1
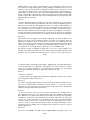
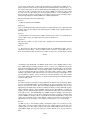
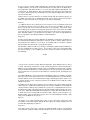
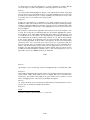
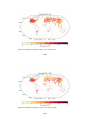
Clim. Past Discuss., 8, C748–C767, 2012
www.clim-past-discuss.net/8/C748/2012/
© Author(s) 2012. This work is distributed under
the Creative Commons Attribute 3.0 License.
Climate
of the Past
Discussions
Interactive comment on “HadISD: a quality
controlled global synoptic report database for
selected variables at long-term stations from
1973–2010” by R. J. H. Dunn et al.
R. J. H. Dunn et al.
[email protected]
Received and published: 5 July 2012
Response to Reviewer #1
We thank referee #1 for their detailed and informative review. We address each point
in detail below.
Referee:
“This is a long paper, which is partly like a user’s manual of the datasets and partly like
a paper. The author’s are to be applauded for taking the time and trouble to write it,
and also for doing all the work that is involved in the dataset construction. The issue
C748
with it being a paper though is that issues with the data will be found in the future, so
I hope there will be a user’s manual (not necessarily called this) where improvements
can be documented.
There is a lot to read in the paper and it is difficult to know if the various thresholds
are the correct ones. The more people use the dataset the more that some of these
thresholds will need revision.”
Response:
We strongly encourage users of the dataset to contact us with suggestions for improvement, which are likely to result in changes to the QC routine. As outlined in Section
7, we will use a version control system which will indicate the version of the dataset,
and supporting documentation will exist on the webpage outlining the changes made
to each version. We will revisit this area of the text, to ensure that this aspect of the
dataset is clear.
Referee:
“One thing I would recommend to add to the paper is a quick analysis of the surface
temperature data. The aim of the dataset is to look at extremes, but how does is
compare with another well-known dataset of average changes. So for daily mean temperature (calculated based on some basic requirement – say the stations that achieve
the station distributions in the middle panel of Figure 2 on page 1813) calculate monthly
average then grid the data a la CRUTEM4 using the 1976-2005 base period. You could
do this at your 1.5# grid resolution or go up to 5 by 5. You could then do the calculation
with the flagged data and without. Say how much has been omitted and what difference (little) has been made. I think a diagram like this will get the paper more widely
read and the dataset more widely known. “
Response:
We agree that this kind of analysis is a useful and interesting future application of
C749
HadISD. However, this requires careful attention to the homogeneity of the data and
also methods of going from incomplete hourly sampling to monthly averages. It is not
within the scope of what the data are being presented for herein – they are assessed
for usefully describing extreme events, not long-term homogeneity and trend analysis.
Furthermore, to do this justice, this would mean lengthening the paper significantly
which is undesirable. We think the reviewer has made an excellent point and fully
intend to explore this in detail in future work, including attempts at homogenising subdaily data which is not trivial.
Referee:
“The other principal point is that all the tests have to be undertaken on each variable in
isolation – well mostly without consideration of the others. Does the flagging of suspect
data in this way lead to the data getting checked to see if data for other variables for
the same time of observation of data have also been flagged? The question here is
it just a mistake for the one variable or is the whole message sent somehow wrong. I
think you tend to think the former, but maybe the latter is a possibility in some places.
Perhaps you should consider whether there is more than one flag set for a particular
set of observations, then perhaps the rest for that time interval should also be flagged?”
Response:
On the whole the tests apply to each variable individually. The main exception is the
diurnal cycle check, where temperature data are used for the test but the flags are
applied to all variables. Other tests which use more than one variable are the odd
cluster check, which uses the wind speed results to flag the wind direction, the frequent
values check, which applies to Td and T synergistically, and the record check, where
the dew points are also flagged if the temperatures exceed a WMO record.
We have been wary of applying the flags from one test on a single variable to all
variables for that observation time. In some stations which have particularly poor data
quality in only one variable, this would mean the removal of a very large fraction of
C750
the data in all other, potentially good, variables. Applying flags synergistically between
T and Td would be less problematic. Although this has not been done in our QC
suite here, it would be possible for a user who wished to do this to use the QC flag
information in the final netcdf files to apply further flags to the data.
Referee:
“A few more comments
1. p1765, what does geographically invariant in their application mean? Is this another
way of saying the stations don’t move? “
Response:
The phrase “geographically invariant” means that the thresholds were fixed for all stations across the globe with no allowance for local climate - i.e. the same test was
applied in the same way using the same thresholds to all stations in the ISD. We will
clarify this through explanation in parentheses.
Referee:
“2. The last sentence on lines 21-23 is a point to remember. This should also be in
the conclusions and in any online pages with the data. Some NMSs do QC on their
data. Whilst we’re on this point, I wondered several times if there was the opportunity
for NMSs to send you the same data from their archives rather than you using your
archive of it – or does this happen? Some NMSs know there are issues with their data
and this is what restricts access some times. There is an opportunity here to offer a
service to some to say you’ll go through their data. This may be thinking too much
aloud, but is this a possibility? This is a problem of peer-review on occasions – you get
quirky suggestions!”
Response:
The source for HadISD is the ISD hosted at NOAA NCDC. In principle, there is no
C751
reason why our QC suite could not be packaged up and provided to NMSs to use.
From our point of view, the more people that use the data and the code the better – as
we are then more likely to discover all the bugs that inevitably exist (despite meticulous
testing of our code). However, there is also value in NMSs not using our code so that
the ‘raw’ version of the data is preserved in global archives such as ISD. While we
believe our QC code does a good job it is certainly not perfect, and so having changes
permanently implemented at the NMS level could be problematic.
We will clarify this point in the manuscript.
Referee:
“3. Why has ISD become HadISD? “
Response:
This is to distinguish between the full archive of operational raw source data from ISD
and this new selected station value-added (by the Hadley Centre) product which is
annually static.
Referee:
“4. On p1768 it is not clear how the number 14 was chosen on line 15. I think this just
comes a little early as the Appendix hasn’t yet been introduced. “
Response:
We will refer to Table 1 in this section in the update to the manuscript which should
clarify this point.
Referee:
“5. On p1768, the discussion about duplicate IDs in the database begins. This is
returned to several times. You have taken all these stations, started with just over
6187 and ended up with 3375 that are usable as they have enough data for doing
C752
something useful climatically. The BEST group claim to have 39,000 stations! They
have additionally got monthly only data sources, so these are additional, but you all
know and I know that their dataset must contain many, many duplicates. There will be
duplicates in HadISD and also in the monthly stations such as GHCN. Do you care
to try and estimate what the true number of possible unique stations really is? WMO
numbers only allow for 10K and then there are numerous missing country IDs, so the
true maximum is smaller. Some countries put out more monthly series, but not that
many more. Maybe what I’m asking is a statement of how many more GHCN has than
your 6187 at the start.”
Response
The main restriction on stations being included in our dataset is their longevity. While
there are around 28,000 stations in the ISD history file, the vast majority of these report
only for short periods of time. We have already established that many of these are
highly likely to be duplications and have conducted a merge of 3353 station IDs to form
1504 composite stations. Of the 26,000+ stations then in the ISD files, selecting on
length of record and reporting frequency resulted in 6187 which were then put forward
to the QC checks. The GHCN-Daily has 75000+ stations including some that have
reported for less than a year to those spanning more than a century. It is likely that
several 10,000s are unique stations. The problem of station identification is large, and
solving it is beyond the scope of this dataset. However, we believe we have done an
appropriate level of checking to ensure that the final product is of research quality.
Referee:
“6. With test 4.1.1, the wording could be changed to make sure you don’t lose any
station data. I’m sure you don’t, but what you say could be taken to mean this. For
example if there are two stations and one runs from 1976 to 2005 and the second runs
form 2000 to 2010, you say you remove the shorter, but this loses 5 years worth of
data. “
C753
Response:
This test does result in the loss of station data. As the test is looking for duplicates after
the merging of composite stations, if any are found, then as these did not pass any of
the requirements for stations to be merged, it is safest if the shorter station record is
removed. We have clarified this point in the text for test 4.1.1.
Referee:
“7. With the station IDs can you explain how the number is derived? I know where
they come from. The first is the WMO station ID with an extra zero. Presumably there
are some where this extra zero isn’t a zero (e.g. Canada where they have recycled
numbers)? The second part of the ID is the national number – well it is for the US
stations! Why not put these in for some of the other countries. This is a pain, I know,
but it is useful to explain this. For many other countries the national IDs are much
longer than the five digits available. Don’t just say you’ll pass this on to the ISD team
at NCDC, as many on the author list are part of the ISD team at NCDC. “
Response:
We have taken the station IDs directly from the ISD history files so that they can easily
be traced back to this source. Placing national IDs into the second part of the station ID
would be complex for, as the referee pointed out, some are longer than five digits and
also some contain characters. We believe that creating a new system will just create
confusion. Full station listings will be given on the download site to enable matching to
other station ID systems if desired. If the ISD numbering system is updated, we intend
to mirror any changes in HadISD.
None of the authors are currently part of the team which constructed the ISD dataset
at NCDC. Also in general, a formally recorded report to NCDC would be beneficial for
audit trail purposes.
Referee:
C754
“8. This issue of IDs in certain countries (former DDR, Balkans, etc). I am just wondering here (in more detail on p1793) whether you’ve done enough to put stations
together. In both these two examples it is just of case of pairing off stations without any
overlaps. In the German case they generally just went from using 09 to 10 with the rest
of the WMO ID remaining the same. In the Balkans it is more complex, but you need to
be able to combine series without overlaps. I don’t think your methodology allows for
that. Perhaps you need an additional test to allow for this. This will be difficult!”
Response:
We permit compositing both with and without overlapping data (otherwise we would
have no stations in the regions the reviewer alludes to). The decisions are based upon
some geographical congruence, metadata and the 00Z data congruence / similarity
between candidates as described in Section 2. This includes accounting for the WMO
assignation changes to the extent possible as described. While undoubtedly a more
complex approach could be undertaken it is not possible to do so within the project
resources and would be more beneficial if performed at the raw ISD station data level.
Referee:
“9. The comment on p1776 about some Australian observing times at the same time
regardless of DST is I’m sure much more widespread. When you say such an error
has been noted and reported back to the ISD team at NCDC, shouldn’t this note also
go to BoM in Melbourne. Similarly with the footnote on p1778 – this should go to JMA.
Also report back to the Met Office Obs section as well. “
Response:
We are trying to ascertain the best way to report any data issues back to NMSs, but
suspect that this may be via GCOS/WMO. These data issues will also be fed back to
NCDC as before. The Australia issue in particular was identified after some discussion
with scientists from BoM so they are aware of it.
C755
Referee:
“10. Why should a Japanese station be measuring in Fahrenheit? Checking on google
reveals that there is no point sending something back to JMA. Google indicates there is
a US Naval Facility there, so this is probably the reason. This would be worth adding, as
it explains why it probably happened. They just forgot for a period to do the conversion.
It is therefore likely that they forgot to convert some other variables? “
Response:
This station (number 476960-43323) has a WBAN id (the last five digits) and so definitely is from a US naval facility. This will be noted in the paper. Indeed linked variables
do suffer from similar problems for this station: the dew point temperatures show the
same conversion errors for the years and values that the temperature measurements
have problems. We have added an extra figure to show this. However no problems are
apparent in the pressure, wind or cloud data which link to those in the temperatures.
We do some synergistic checking (see above) but this needs to be applied carefully to
retain as much good data as possible.
Referee:
“11. In test 4.1.8 I don’t think the word ‘streaks’ is the right one for a period of days
where you have some threshold being exceeded. I think the right word is Spells. We
use this for spells of weather, so why not here. You are looking at unusual spell frequency. “
Response:
This is a good suggestion and we shall amend the manuscript.
Referee:
“12. With Test 12 for clouds and the flagging of middle and upper level cloud as suspect
when the low level is 8 oktas, I think you might have made the wrong decision. The
C756
very fact there are real values for clouds higher than low might suggest that the low
cloud value is at fault. Check the data and see how often full low level cloud occurs
and whether there are values for the two levels above. If this number is very small then
I think this would agree with my hypothesis. “
Response:
The referee is correct, but it would be difficult to tell from the data alone which of the
values (low or mid/high) are at fault. However, there is a possible problem of observer
bias if there are very small gaps in the low cloud. This allows the mid/high cloud amount
to be estimated, possibly from observer memory if there are no gaps at the observation
period, but there were a few minutes beforehand; or the higher level values have been
copied across from a previous observation.
Performing the investigation suggested on the 3375 .clim stations, there are 2956 stations where this flag occurs. The fraction of low-cloud=8 oktas observations which are
flagged by this test is 4.29% (mean) 1.01% (median). The majority of stations have a
small fraction of low-cloud=8 observations flagged by this test. However some do have
a large fraction. For any individual observation it would be difficult to tell which scenario
is correct, though in a complete station-record this would become clearer.
Therefore, on reflection, the safest course of action is to flag all three cloud levels in
this case, and both the medium and high the corresponding case for medium-cloud=8
oktas. We shall adjust the QC procedure, re-create the output files and update the text
and tables in the paper as appropriate. Users can, of course, still choose to use the
flagged data.
Referee:
“13. With the Variance Test (#13) do you also check for markedly reduced variance?
In this section you use hurricane incorrectly. You mean hurricane forces. Hurricanes
are only in the N. Atlantic and E. Pacific. They are called Cyclones and Typhoons
C757
elsewhere. “
Response:
We will correct the wording in the manuscript as we do mean tropical storm force
winds strengths, including Hurricanes, Cyclones and Typhoons. We check for unusual
variance, not just high variance. The example given in Figure 12 happens to be for
the higher than usual variance in the temperature series, but a period of low variance
observations in station 133530-99999, Sarajevo, Bosnia-Herzegovina, in 2008 is also
identified and is now included in the figure as well.
Referee:
“14. With 4.1.14 is it worth flagging data that can’t be checked as it is just too far from
another station or just too early in time to be checked? “
Response:
We do not flag (and therefore do retain) stations which cannot be checked because
of the absence of any neighbouring stations. Our reasoning is that there is no proof
that these stations have bad data, and so we cannot justify removing these data. All
stations where no neighbour checking is possible are noted, and this list is available to
download on the dataset webpage, should users wish to be restrictive on the stations
they chose to use. This is stated in the text, but we shall try to make it more prominent.
If, however, there are sufficient neighbours overall, but insufficient of them have data
to do the comparison for a given time stamp, then the data are also kept for the same
reason. In this case no note is currently made. We intend to add this information into
the flag record before release.
Referee:
“15. Throughout the tests you’ve often assumed a normal distribution. This is a reasonable assumption for many variables, but the Alaskan cold spell got me thinking. Even
C758
with monthly average data, the normal distribution isn’t a great approximation across
Siberia in winter. A 3-parameter Gamma distribution has been used by Briony Horton
and is referred to here (Jones et al. 1999). The use of this could allow for the fact that
temperature data are often negatively skewed in winter.”
Response:
Although in a number of the tests we do fit a Gaussian to the distribution, we only
use it to gain some indication on the spread, rather than use the fit itself to do any
QC. The referee is correct in stating that it is likely that the Gaussian assumption is
not valid in all cases. As some of our tests aim to eliminate spurious extreme nonGaussian behaviour, if the true distribution is non-Gaussian, then the tests are likely to
flag too many valid observations. However, our success in reproducing true extremes
(even in the Alaskan cold spell) suggests that this is not a serious problem. This is
something which we intend to address and improve upon in future versions. Note also
that the figures showing distributions with Gaussian fits have a logarithmic y-axis which
highlights the tails of the distributions.
Referee:
“16. The point on p1792 lines 4-7 is an exceedingly good one. Did you find more in
the tropics than in Siberia in winter? Did you find anything with the Antarctic stations?
Some of the data at the US stations used there were measured in deg F, very difficult
to note in that part of the world! “
Response:
We have 18 stations in Antarctica in the HadISD. None of these are “flag free". The
most common flags are from the Gap, Climatological, Spike, Humidity, Cloud and Odd
Cluster checks. We have not included any specific tests for reporting in Fahrenheit but
if this is deemed necessary then we can try to incorporate it into future versions. Figure
19 shows the rejection rate across the globe for each of the main three variables. For
C759
pressure, there is a band of higher flagging rates around the equator when compared
to higher latitudes (except areas north of the Black Sea and south of the White Sea).
For temperature and dew point there is no such clear global pattern with latitude. The
southern tips of South America, Africa and Australia generally have fewer flags than
the Tropics, but North America and Europe have the highest flagging rates, with very
low rates in East Asia.
However there is also the influence of network density and observation frequency on
the ability of the QC tests to highlight poor data. All else being equal, lower variance
will be a key factor, but all else is not equal, especially record quality
Referee:
“17. With the discussion of when the true Tx and Tn occur, you might be interested
in reading van den Besselaar et al (2012). I’m not sure your assumption of when the
times of Tx and Tn occur is that sound, based on 3-hourly data. This paper shows
that for Europe in the winter a much greater proportion of the values given in SYNOP
messages do not occur in the ‘believed’ 12-hour period. I know you’re not using these
data, but what might be a useful plot from your data is one of the average DTR from
the 3-hourly data. I don’t think that Fig 21 is that informative.”
Response:
For three hourly data, there will be difficulties in obtaining accurate times and values for
the maximum and minimum temperatures. However, for those stations which report on
an hourly basis, this will be less of an effect. Users will be able to select those stations
which match their requirements on reporting frequency.
We will replace Figure 21 with a set of images showing the global variation in DTR over
the four standard three-month seasons. These figures have also been included with
this response (Figs. 1-4). In addition, the text in Section 8.1 will be amended to read
the following:
C760
“””In Fig 21 we show the median diurnal temperature range (DTR) from the subset
of 3375 .clim stations which have records commencing before 1975 and ending after
2005 for the four standard three-month seasons. The DTR was calculated for each day
from the maximum-minimum recorded temperature in each 24 hour period, with the
provisos that there are at least four observations in a 24 hour period, spanning at least
12 hours.
The highest DTRs are observed in arid or high altitude regions as would be expected,
given the lack of water vapour which acts as a moderating influence in wetter climates
at lower altitudes. This stark contrast between high- and low-lying regions can be seen
in Yunnan province in the south-west of China as the DTRs increase with the station
altitude to the west.
The differences between the four figures are most obvious in regions which have high
station densities, and between DJF and JJA. The increase in DTR associated with the
summer months in Europe and central Asia is clear. This is coupled with a decrease in
the DTR in the Indian subcontinent and in sub-Saharan West Africa, linked to the monsoon cycle. Although the DJF DTR in North America is larger than that in Europe, there
is still an increase associated with the summer months. Stations in desert regions, e.g.
Egypt and the centre of Australia as well as those in Tropical Maritime climates show
very consistent DTRs in all seasons.”””
Referee:
“18. Figure 2. So a dot is plotted at the centre of each 1.5# square coloured to show
the number of obs in that square. Why do the dots appear to overlap? Maybe you need
to show with slightly larger squares?”
Response:
This figure shows each 1.5 by 1.5 degree grid box filled with a colour corresponding
to the number of stations within. Perhaps the figure has been made too small and the
C761
1.5 degree boxes are therefore difficult to see? There should be no overlaps. We will
ensure the figure resolution and quality are sufficiently high in the final version.
Referee:
“19. I have trouble following Figure 9. May is a very odd month in Iceland. Try looking
at some annual cycles for Icelandic locations, especially of MSLP. As they are generally
good observers I think what you’re seeing is probably real, and relates to issues such
as possible close sea ice and/or snow on the ground. “
Response:
In Fig 9, the histogram has a logarithmic y-axis, which emphasises the tails of the
distribution, and the observations have been anomalised using the climatology for May,
and then scaled by the IQR of the anomalies. Therefore we are confident that the small
secondary population on the positive x-axis highlighted in red are suspect and hence
they are flagged.
We cannot be certain from the population alone that the skew on the negative x-axis
is good. This is why this test tentatively flags the observations highlighted in orange.
The neighbour check, which will be dominated by other stations in Iceland is then used
to test whether these observations are good (that they are within the distribution of
the neighbouring observations) and the flag removed, or not, and the flag retained.
In fact, for this station, the problematic years are 1973 and 1974 and January 1975.
The secondary population on the positive x-axis appear to be the result of Fahrenheit
conversion errors. The conversion errors in these years are so pervasive, that once
they are removed, there are insufficient observations left to keep the remaining observations, and all observations for these two years are flagged. As far as we can see,
Keflavik is the main international airport in Iceland, and has in the past been used as
a NATO and USAF mid-Atlantic refuelling stop so older observing practices are not
impossible. It also has a WBAN number in its station ID.
C762
Referee:
“20. In Figure 13, it is unclear why ‘another’ test flagged the pressure data in Feb 1976.
“
Response:
This month was flagged by the unusual variance test. Compared to all other Februaries
for this station, 1976 is more variable, and so is flagged. Note, this is unusual for this
month alone. For months in the middle of the year, a higher level of variance is usual
and so no flagging occurs. This has been clarified in the caption.
Referee:
“21. Figure 20 shows you’re rejecting more data in Africa and South America. This is
just the same as looking at monthly average data!”
Response:
Noted
Interactive comment on Clim. Past Discuss., 8, 1763, 2012.
C763
Fig. 1. Average Diurnal Temperature range for each station in DJF.
C764
Fig. 2. Average Diurnal Temperature range for each station in MAM.
C765
Fig. 3. Average Diurnal Temperature range for each station in JJA.
C766
Fig. 4. Average Diurnal Temperature range for each station in SON.
C767