1
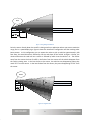
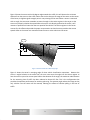
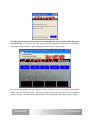
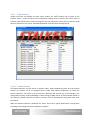
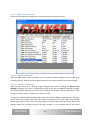
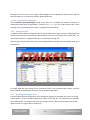
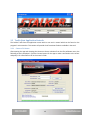
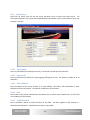
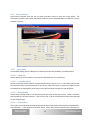
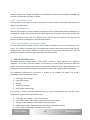
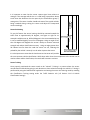
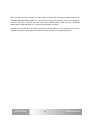
Stalker Speed Sensor II
Traffic Statistics Sensor Manual
011-0132-00 rev A
Applied Concepts, Inc.
2609 Technology Drive
Plano, Texas 75074
972-398-3780
ii
Applied Concepts
TRAFFIC STATISTICS SPEED SENSOR MANUAL
Table of Contents
1. Introduction .............................................................................................................................................. 1
1
Installing the Traffic Statistics sensor.................................................................................................... 1
2
Configuring the TRAFFIC STATISTICS Sensor ......................................................................................... 4
2.1
Dashboard Application Controls ................................................................................................... 4
2.1.1
Standard Configuration ......................................................................................................... 4
2.1.2
Setting the Time .................................................................................................................. 11
2.1.3
Speeding/Slowing the Clock ................................................................................................ 11
2.2
Traffic Stats Application Controls................................................................................................ 12
2.2.1
Connect To Sensor .............................................................................................................. 12
2.2.2
Set Up Survey ...................................................................................................................... 13
2.2.3
Survey Calendar .................................................................................................................. 17
3
Vehicle Classification........................................................................................................................... 18
4
Statistics outputs................................................................................................................................. 20
4.1
Serial outputs .............................................................................................................................. 20
4.1.1
DBG1 Format – ASCII Information for all Tracked Statistics Targets .................................. 20
4.1.2
Log Message – ASCII Information for Statistics Targets as they are lost ............................ 22
iii
iv
1. Introduction
This manual addresses the operation of the 200-0880-01 version of the Traffic Statistics Sensor. This
sensor is intended for collecting traffic pattern data for later analysis. The sensor can be used as a
standalone sensor or in conjunction with Applied Concept’s Traffic Stats PC application. The Traffic Stats
PC application allows for configuring the sensor for surveys, including location and user data, setting up
time schedules for the survey, and displaying the results of the survey.
Speed Sensor Manuals
•
•
•
011-0131-00 Technical Manual
011-0131-01 User’s Manual
011-1032-00 This Manual
1 Installing the Traffic Statistics sensor
The sensor has a radar beam width of 32 degrees both horizontally and vertically. It can be mounted
next to a road way or above it on traffic pole structures. The sensor should be mounted as high as
possible with a minimum of four or five feet above the ground. The higher the antenna is mounted the
better the visibility it will have when tracking multiple vehicles. When the sensor is mounted at vehicle
height, a large leading vehicle will block the radar return for the vehicles behind it. If the sensor is
mounted very high it should have a slight downward tilt. The angle of the tilt will depend on if the
application is more interested in detecting vehicles as far away as possible or is more interested in
vehicles up close.
Position the sensor with its front, the plastic lens, towards the traffic you wish to monitor. The sensor
can be rotated to any angle as long as it its front is facing the traffic.
1
Figure 1: Long Range Installation
Point the sensor directly down the road if it is being used in an application where you want to maximize
range, like in a speed display sign. Figure 1 shows this installation configuration and the resulting radar
beam pattern. In this configuration you can expect the radar to pick up vehicles approximately 1,200
feet away; the actual distance is affected by the size and shape of the vehicle. As Figure 1 shows, the
minimum distance the radar will see a vehicle is affected by which lane the vehicle is in. The further
away from the sensor the lane of traffic is, the further from the sensor will the vehicle disappear from
the radar’s viewing area. In the lane closest to the sensor, the vehicles start disappearing when they
reach 37’9” from the sensor. In the lane furthest from the sensor, they start disappearing at 72’6” from
the sensor.
Figure 2: Angled Sensor
2
Figure 2 shows the sensor with a 10-degree angle towards the traffic, this will shorten the minimum
distance from the sensor to the traffic. Notice that it also shortens the range of the sensor as the center
of the beam, its highest signal strength point is now pointing off the road. When a sensor is mounted
with an angle, the user must remember to enter the angle in the cosine register in the sensor so the
sensor can properly calculate the speed. When the sensor isn't directly pointed at the traffic, it will
measure a speed that is lower than the true speed of the vehicle. The Cosine registers in the sensor
account for this effect and provide the proper compensation so that the sensor provides the correct
speeds. Refer to the sensor user manual on how to enter a cosine value into the sensor.
Sensor
20.0°
17 0.00
35 3.00
125 2.53
Figure 3: Vehicle Classification Mounting Angle
Figure 3 shows the sensor's mounting angle for best vehicle classification operations. Because the
sensor is angled relative to the traffic flow, the user must enter the angle into the Cosine register to
have the sensor report the correct speed. Notice that because of the angle, the maximum radar distance
for the oncoming lane of traffic has been reduced to about 125 feet. This is the configuration that
provides the optimum performance for statistics gathering. The extreme angle reduces the range so that
only vehicles near the sensor will be counted, reducing the effects of vehicles pulling in and out of
traffic.
3
2 Configuring the TRAFFIC STATISTICS Sensor
Two software tools exist to help configure the Sensor for optimum statistics gathering operations. The
first tool is Dashboard, which allows configuration of all of the sensor options, not just statistics type
options. Generally these sensor controls can be left at the factory settings and only changed when the
sensor's environment creates problems which changing the sensor settings may resolve.
The second tool is the Stalker Traffic Stats PC application. This tool is designed specifically to work with
the traffic statistic sensor and is used to configure the sensor for the type of statistics collection
required.
2.1 Dashboard Application Controls
Review the Speed Sensor II User’s Manual for details on Dashboard's features and operation. This
section focuses on configuration settings pertaining to statistics gathering.
2.1.1 Standard Configuration
When viewing the main Dashboard screen, the name of a configuration file is displayed in the title bar.
(e.g. [Configure Stationary II w Stats 1.0.0.0.cfg]) This file defines all of the configurable settings that are
available on a particular model of speed sensor. Since features and settings are added and changed in
different versions of software, the filename also includes the version (1.0.0.0) that the file’s settings
apply to.
Check the model of sensor connected to the Dashboard by selecting About from the Help pull-down
menu. The following screen appears with the sensor model and version identified in the Radar Interface
field.
4
It is important that the model and version in the configuration file name match the model and version
in the About box. If they are not the same, open a list of other available configuration files by selecting
“Select New Startup Config File” from the Config pull-down menu as shown below:
Once the desired configuration file is selected, view the settings of the unit by choosing “Edit Firmware
Values” from the Config pull-down. The Config Settings screen opens with several tabs for different
groups of settings. The following sub-sections discuss tabs and settings unique to the statistics sensor.
5
2.1.1.1 Main Tab – Basic Configuration
The Main tab has one basic configuration setting that is treated specially by the statistics sensor –
Transmitter Control.
The Transmitter Control setting turns the radar transmitter on (Transmit) or off (Hold). The transmitter
must be on for the radar to register speeds. The Automatic value is used in conjunction with statistics
gathering. When a survey is loaded into the unit, it includes calendar settings to allow the unit to run
statistics during certain time periods on certain days. When the Transmitter Control is set for
Automatic, the statistics function controls the state of the transmitter by turning it off if no statistics are
being gathered. This results in lower power draw and the ability to run an interrupted survey for a
longer time.
6
2.1.1.2 Traffic Statistics
Though most tabs are available on other sensor models, the Traffic Statistics tab is unique to the
statistics sensor. Under this tab are the configuration settings that are used by the sensor when in
statistics mode. While there are other settings that are also used by the sensor when in statistics mode
these are exclusive to this sensor. A detailed explanation of each of these settings follows.
2.1.1.2.1 Statistics Monitor
The Statistics Monitor sets the sensor in statistics mode. When enabled the sensor will use the data
stored in its statistics set up, as configured by the Traffic Stats software application, to control the
sensor's operation. The values in the stored survey definition will override any of the settings in the
configuration memory made by Dashboard. These settings include control of the transmitter based on
the statistics schedule, direction of traffic to monitor, units of measurements along with some other
parameters.
When the Statistics Monitor is disabled, the sensor works like a typical speed sensor and operates
according to the settings stored its configuration registers.
7
2.1.1.2.2 Minimum Tracking Distance
The Minimum Tracked Distance setting can be used to filter out some short-lived targets during a
survey. An ideal survey location would not have intersecting streets or driveways along the path of the
surveyed vehicles, but sometimes this cannot be avoided. To keep from counting vehicles that only
travel a portion of the survey path by turning onto or off of the roadway, set the Minimum Tracked
Distance for a distance (in feet) that a target needs to travel to be counted in the survey. The range of
settings is 0-500 feet with a default of 200 feet.
2.1.1.2.3 Vehicle Classification Settings
One of the qualities of stats targets is their classification: Class 1 (larger targets) through Class 5 (smaller
targets). Read more about classes in Section 3 Vehicle Classification. The sensor measures the intensity
of the returned radar signal for each target it tracks and assigns it a class depending on where that
intensity falls in the range of Class Thresholds. There are five Away Class Thresholds and five Closing
Class Thresholds.
These thresholds may be set to any level by the user, or the unit may train itself for the range of targets
it sees in a particular installation. This is accomplished by enabling the Classification Training setting.
The radar monitors the next 100 targets it sees, calculates the intensity range of those targets, and then
automatically sets the thresholds within that range. This training gives reasonable assurance that the
statistics survey will provide results with targets spread throughout the class range. Note that if the unit
is configured for only one direction of traffic, Away or Closing, it only tracks 100 targets moving in that
direction. If it is set up for Both directions, it tracks 100 away targets to determine the Away Thresholds
and 100 closing targets for the Closing Thresholds.
As soon as the Classification Training is enabled, the Training Status value is automatically set to
Incomplete. After the training finishes, the sensor automatically disables Classification Training, sets the
Training Status to Complete, and updates the Class Thresholds with the newly calculated values.
Since the training settings are remembered after power-off, it is possible to enable the unit for
classification training and turn it off before going out to the survey site. Then, on-site, simply power it
up, and it automatically starts to train as it sees targets. After completion of training, it immediately
starts to gather statistics based on the trained classification thresholds. The targets monitored during
the training period are not included in the statistics counts.
8
2.1.1.3 Target Recognition
The Target Recognition tab has one basic configuration setting that is treated specially by the statistics
sensor – Stats Target Strength Sensitivity.
2.1.1.3.1 Stats Target Strength Sensitivity
Whereas the Sensitivity setting compares the target strength to the ambient noise from other radar
reflections (signal-to-noise ratio) to declare recognition of a target, the Stats Target Strength Sensitivity
setting can be used to recognize or suppress targets depending purely on the target’s strength. A higher
value allows smaller, lower strength targets to be acquired. A lower value requires the target to be
larger/closer before it is acquired.
9
2.1.1.4 COM Port Configuration
There are several COM port configuration settings that apply to statistics functions.
2.1.1.4.1 Output Format DBG1
When the DBG1 output format is selected, the unit streams out ASCII messages for each target being
tracked by the unit. Refer to the Serial Outputs section for the content and format of these messages.
2.1.1.4.2 Statistics LOG Messages
When the stats sensor unit is tracking targets and gathering statistics, enabling the Statistics LOG
Messages configures the sensor to append ASCII strings to the end of standard streaming messages.
These strings identify targets that were lost from tracking in the last radar measurement period – this is
the point at which a target is included in the statistics counts.
This feature is especially effective when used in conjunction with the DBG1 streaming format. The DBG1
format streams out strings of data after each 48 ms processing period for each target being tracked.
Monitoring this data can tell a user how many targets are being tracked; what their latest, fastest and
average speeds are; and how long they have been tracked. In the streamed data for the period
10
following the loss of one or more targets, LOG messages will be appended to show the final data for
each lost target as it is saved in the statistics gathering function.
2.1.1.4.3 Statistics Record Messages
Use the Statistics Record Messages setting on the stats unit to enable raw statistics records to be
streamed out when they are generated – normally on a 1-, 2-, 5-, 10-, 30- or 60-minute period. These
messages are only generated if the survey is configured for External data.
2.1.2 Setting the Time
In addition to the standard configuration file for the statistics sensor, there are other configuration files
used for special functions like setting the date and time in the unit’s on-board real-time clock (RTC). For
this function select the “Configure Stationary II w Stats Date-Time.cfg" file.
After choosing Edit Firmware Values from the Config pull-down, the date and time settings show up in
the Main tab.
To change date and time settings, enter the desired values in the Proposed Value column, and then
select “Upload Proposed Values To Sensor” from the Options pull-down.
2.1.3 Speeding/Slowing the Clock
A second special function configuration file is available to speed up or slow down the clock if it is losing
or gaining time. It is the “Configure Stationary II w Stats Cal RTC.cfg” file. The single setting on the Main
tab is Calibrate RTC. The range of values for this setting is 128 thru 200. Choose a lower value to slow
down the clock or a higher value to speed it up.
11
2.2 Traffic Stats Application Controls
The Stalker Traffic Stats PC application comes with its own user’s manual which can be found on the
program’s main menu bar. This section will provide a brief overview of what is available in that tool.
2.2.1 Connect To Sensor
After opening the app and choosing the Connect to Sensor selection from the File pull-down menu, the
following screen is displayed. Click the Connect button for the app to make a connection to the sensor
and query it for information to fill in the screen’s fields.
12
2.2.2 Set Up Survey
Select Set Up Survey from the Set Up Survey pull-down menu to open the screen below. The
information entered in this screen and the following Survey Calendar screen can be saved to the sensor
to define a “survey”.
2.2.2.1 Survey Name
Enter any name desired to identify the survey. The field can include up to 50 characters.
2.2.2.2 Operator ID
Enter any ID desired to identify the person/group defining the survey. The field can include up to 20
characters.
2.2.2.3 Survey Address
Enter the address of the survey location as a street address, intersection, GPS coordinates or other
identifier of the survey location. The field can include up to 50 characters.
2.2.2.4 Zone
Enter other survey location identification information such as school zone, hospital zone, etc. The field
can include up to 20 characters.
2.2.2.5 Traffic Direction
Enter information relative to traffic direction on this field. NE above signifies traffic moving in a
northeast-bound direction. A pull-down with options is provided.
13
2.2.2.6 Unit of Speed
Select between MPH, km/h, knots, meters/sec or feet/sec. These choices correlate to the available
configuration settings of the sensor. When a stored survey in the sensor is activated, this setting will
override any other configuration setting which may have been made using the Dashboard configuration
app. This ensures that the desired survey setting is used when gathering statistics.
2.2.2.7 Speed Limit
Enter the speed limit of the survey location here.
2.2.2.8 Survey Direction
Select between Both, Closing, or Away. As with the Unit of Speed above, these choices correlate to the
sensor’s configuration setting and will override a sensor setting when a survey is activated.
2.2.2.9 Internal/External Memory
Choose Internal or External. Select Internal Memory to save all survey results inside the non-volatile
memory of the sensor itself. After the survey has run, the sensor can be connected to a PC running this
app again to extract the survey data for analysis.
If External Memory is selected, the sensor does not retain the survey data internally. It can be
configured to stream the raw stats records out a serial port by enabling a COM port’s Statistics Record
Messages setting.
2.2.2.10 Speed Resolution
Select 1, 2, 5 or 10 MPH from the pull-down menu. (If the Unit of Speed is changed to km/h, for
example, the setting is understood as 1, 2, 5, or 10 km/h.) This is the size of “bucket” used to collect
stats information. Using a low setting like 1 causes the sensor to keep counts for each MPH and uses up
its available memory faster. Using a higher number like 10 causes the unit to keep counts for 1-10, 1120, 21-30… MPH spans and reduces the amount of memory required for the counts. However, using
these larger spans of speeds reduces the level of analysis possible after the survey has been completed.
2.2.2.11 Time Resolution
Select 1, 2, 5, 10, 30 or 60 minutes from the pull-down menu. As above for the Speed Resolution, this
setting affects how targets are counted and stored in stats memory. For a 1-minute setting, speed
counts are stored each minute. This allows for the highest level of analysis detail but requires more
memory space. Conversely, storing data in 60-minute periods allows many more periods of data to be
saved, but it reduces in-depth analysis capabilities.
2.2.2.12 Vehicle Classification
Turn classification on or off here. As with the Speed and Time Resolution settings, this one also has an
effect on internal sensor memory usage. If classification is turned on, target counts are "bucketized"
and saved for each of the five classification levels. If off, all classes of vehicles are included in a single set
of counts for each period.
14
2.2.2.13 Minimum Following Time
This setting can be used to require a minimum inter-vehicle gap between vehicles to be counted. Any
number between 0 and 10.0 seconds (in tenths) can be entered to require that no target is counted
unless it has that much time between itself and the preceding target. This can be helpful to leave
vehicles out of a survey if there is another vehicle in front of them that might preclude them from
proceeding at their desired speed.
2.2.2.14 Maximum and Minimum Speeds
Use these settings to define a range of speeds of interest. Only vehicles within this range are counted in
the statistics. As with other settings above, when a survey starts these values will override values that
may have been configured in the sensor using Dashboard. They also have an effect on internal stats
memory usage. A smaller speed range requires less stats memory and can increase the time a survey
can run before filling all available memory.
2.2.2.15 Calculated Operation Time
The time displayed in this field is a worst-case estimate of the length of time a survey can run before
filling the sensor’s internal memory. It is affected by the following settings and is updated as they are
changed to give an idea of how different combinations result in different survey lengths: Survey
Direction, Speed Resolution, Time Resolution, Vehicle Classification, Maximum Speed, and Minimum
Speed. Keep in mind that this is a worst-case estimate; actual surveys can run longer due to
compression of data that is accomplished depending on actual traffic conditions.
As a baseline example, statistics data can be saved for over 61 days of continuous operation with the
following settings:
• Survey Direction = Closing
• Time Resolution = 5 Minute
• Vehicle Classification = Off
• Speed Resolution = 5 MPH
• Min/Max Speed Range = 0-100
The following paragraphs discuss the effects of changing each of the settings.
There would be no difference in operation time if the Survey Direction was changed to Away since the
unit would still be saving data for only one direction of travel. But, if Survey Direction was changed to
Both, the total survey time would be cut in half since the sensor would save two full sets of data: one for
closing targets and one for away targets.
If the Time Resolution was changed from 5 minutes to 10 minutes, the total survey time would double
since records are saved only half as often. Conversely, a change from 5 minutes to 1 minute would
result in a total survey time of one-fifth the duration.
15
Vehicle Classification is turned off in the baseline example above. There are 5 classification levels, so
total survey time would be divided by 5 if classification was turned on since the sensor saves a full set of
data for each classification level.
Speed Resolution and Min/Max Speed Range also affect the total operation time but not as cleanly as
the settings discussed above which are simple multipliers or dividers of the total survey time. This is
because these settings affect the length of the records saved, not the number of records or how often
they are saved. The data records contain a number of “buckets” defined by the speed range divided by
the speed resolution. For example a speed range of 0-100 divided by a speed resolution of 5 results in
20 buckets – one for each 5 mile per hour span. That same range of 0-100 divided by a speed resolution
of 10 results in 10 buckets – one for each 10 MPH span. You might think that changing speed resolution
from 5 to 10 would result in twice the total survey time since there are half as many buckets to save.
But since there is also overhead data stored with each full record, two 10 bucket records take more
memory than a single 20 bucket record since each of the 10 bucket records have the same amount of
overhead as the single 20 bucket record. So the improvement factor achieved by changing these
settings is not as clean as changing other settings above due to the record overhead.
Finally, after all of the above considerations have been taken into account and the Traffic Stats app
displays the Calculated Operation Time, the actual total survey time will be longer due to compression
of the records made possible by the actual vehicle speeds counted in each time span. Since the amount
of compression depends on actual traffic conditions during the survey period, it is not possible to
quantify the expected improvement.
2.2.2.16 Description
This field is available for any other notes that the user desires to save with the survey. Any text can be
entered up to 248 characters.
2.2.2.17 Save Button
Click the Save button near the bottom, right-hand corner of the screen to save the field settings to the
sensor. This initiates a complete erase of all statistics data saved in the unit and saves the new “survey”
definition there. This “survey” definition includes the entries on this Set Up Survey screen as well as the
entries on the Survey Calendar screen described below.
16
2.2.3 Survey Calendar
Select Survey Calendar from the Set Up Survey pull-down menu to open the screen below. The
information entered in this screen and the Set Up Survey screen discussed above is saved to the sensor
to define a “survey”.
2.2.3.1 Survey Mode
The available settings here are Always On, Continuous Period, Daily Schedule, and Selected Days.
2.2.3.1.1 Always On
Choose Always On for the sensor to save statistics data whenever it is powered up.
2.2.3.1.2 Continuous Period
Choose Continuous Period to define a single time period for a survey to run. In this mode, select a start
date and time and a stop date and time for the survey. When the sensor is powered, it waits until the
start date/time to automatically start saving survey data and stops saving at the stop date/time.
2.2.3.1.3 Daily Schedule
Choose Daily Schedule mode to run the same survey every day at the same time(s). Select a start date
and stop date for the stats collection. Then set one, two, or three time periods for stats to be collected
on each of those days.
2.2.3.1.4 Selected Days
This mode is much like Daily Schedule except specific days of the week can be selected or deselected for
stats collection. In the example screenshot above, survey data will be collected every Monday thru
17
Friday in October from 7:00AM to 9:00AM, from 10:00AM to 1:00PM and from 2:00PM to 4:00PM. No
statistics are collected on Saturday or Sunday.
2.2.3.2 Current Sensor Time
Click the Read Sensor button to have the app query the sensor to get its Real-Time Clock Setting and
display in the fields shown.
2.2.3.3 Edit Sensor Time
With the Use Computer Time box checked, the Date, Day and Time fields should reflect the date/time of
the PC’s clock. Simply click the Save to Sensor button here to set the sensor’s internal clock to that time.
To set the internal sensor clock to a different time, uncheck the Use Computer Time box, set the
Date/Time fields to the desired time, and click Save to Sensor.
2.2.3.4 Survey Calendar - Save to Sensor Button
Click the Save to Sensor button under the Survey Mode drop-down to save the field settings to the
sensor. This initiates a complete erase of all statistics data saved in the unit and saves the new “survey”
definition there. This “survey” definition includes the entries on this Survey Calendar screen as well as
the entries on the Set Up Survey screen described in the section above.
3 Vehicle Classification
The Stalker Stationary Speed Sensor II can provide a means to classify vehicles into 5 different
categories. The primary use of this feature is to document the road usage by vehicle size. While the
sensor cannot actually measure vehicle size it can provide an indication of the approximate size of the
vehicle by the measured returned signal strength which in most cases is proportional to vehicle size.
The classification performed by the sensor is relative to the average size vehicle. The sensor's
classification results in these five classes:
1.
2.
3.
4.
5.
much larger than average
larger than average
average
smaller than average
much smaller than average.
If the sensor is trained (training is discussed later) on a typical multi-vehicle type road then these
classifications result in these typical vehicle sizes.
1.
2.
3.
4.
5.
much larger than average - semi truck, box trucks
larger than average - large pickups, large vans, small delivery trucks
average - 4-door vehicles, small pickups, cross over vehicles.
smaller than average - 2-door vehicles, small pickups, small 4-door vehicles
much smaller than average - motorcycles, Smart Cars
18
It is important to note that the sensor reports signal sizes relative to
average. If the average vehicle size on a road being surveyed are dump
trucks than that becomes the size report by the classification group 3,
average size. The sensor installer should take note of the typical vehicles
being recorded during training the sensor and adjust the interpreted
result accordingly.
Sensor Positioning
To use this feature the sensor housing should be mounted toward the
traffic flow at approximately 20 degrees, see figure at right for an
example installation set up. While 20 degrees is the recommended set up
it can be modified slightly, from 15 to 25 degrees. Using an angle of less
than 20 degrees will degrade the sensor's ability to measure returned
strength and reduce classification accuracy. Using an angle greater than
20 reduces how far down the road the sensor can see, reducing the
probability the vehicle is securely in track when it passes the sensor.
It is also important to note that the lane closest to the sensor will provide
the most accurate vehicle classification. While lanes other than the one adjacent to the sensor can be
used to collect vehicle classification, the results will have more variance.
Sensor Training
Once properly positioned the sensor needs to be "trained". Training is a process where the sensor
records data on 100 vehicles going in each direction to learn what the average size vehicle is. Training is
performed by using the Dashboard PC application and setting the sensor into training mode by enabling
the Classification Training setting under the Traffic Statistics tab. (ref Section 2.1.1.2.3 Vehicle
Classification Settings)
19
4 Statistics outputs
4.1 Serial outputs
4.1.1 DBG1 Format – ASCII Information for all Tracked Statistics Targets
Byte #
Description
Value
1
ASCII “T”
0x54
2
Target number tens digit
3
Target number ones digit
4
ASCII space
0x20
5
Target ID thousands digit
6
Target ID hundreds digit
7
Target ID tens digit
8
Target ID ones digit
9
ASCII space
0x20
10
Target direction – ASCII “C” for closing, “A”
for away, “?” for unknown
11
Last target speed hundreds digit
12
Last target speed tens digit
13
Last target speed ones digit
14
ASCII space
0x20
15
Peak speed direction – “C”, “A” or “?”
16
Peak speed hundreds digit
17
Peak speed tens digit
18
Peak speed ones digit
19
ASCII space
0x20
20
Average speed direction – “C”, “A” or “?”
21
Average speed hundreds digit
22
Average speed tens digit
23
Average speed ones digit
24
ASCII space
0x20
25
Target Strength tens digit
26
Target Strength ones digit
27
ASCII space
0x20
28
Target duration thousands digit
29
Target duration hundreds digit
30
Target duration tens digit
31
Target duration ones digit
32
ASCII space
0x20
33
Carriage Return
0x0D
20
When the DBG1 Format is selected, the unit streams a 33-byte ASCII message as defined above (e.g.
“T00 0018 A040 A041 A040 18 0006 <cr>“) for each of the targets being tracked. If the unit is configured
for tenths resolution, a decimal point and tenths digit is added to each speed value (e.g. “T00 0018
A040.1 A041.3 A040.4 18 0006 <cr>”) and the message length is 39 bytes.
Since the unit can track up to 15 targets, the baud rate setting must be set at 115200 to ensure that a
complete message for each target is sent before the radar processes new target information.
21
4.1.2 Log Message – ASCII Information for Statistics Targets as they are lost
Byte #
Description
Value
1
ASCII “L”
0x4C
2
ASCII “O”
0x4F
3
ASCII “G”
0x47
4
ASCII space
0x20
5
Target ID thousands digit
6
Target ID hundreds digit
7
Target ID tens digit
8
Target ID ones digit
9
ASCII space
0x20
10
Year thousands digit (ASCII)
11
Year hundreds digit (ASCII)
12
Year tens digit (ASCII)
13
Year ones digit (ASCII)
14
ASCII slash (“/”)
0x2F
15
Month tens digit (ASCII)
16
Month ones digit (ASCII)
17
ASCII slash (“/”)
0x2F
18
Date tens digit (ASCII)
19
Date ones digit (ASCII)
20
ASCII space
0x20
21
Hour tens digit (ASCII)
22
Hour ones digit (ASCII)
23
ASCII colon (“:”)
0x3A
24
Minute tens digit (ASCII)
25
Minute ones digit (ASCII)
26
ASCII colon (“:”)
0x3A
27
Second tens digit (ASCII)
28
Second ones digit (ASCII)
29
ASCII space
0x20
30
Direction first character (ASCII)
“A” or “C”
31
Direction second character (ASCII)
“W” or “L”
32
Direction third character (ASCII)
“A” or “O”
33
Direction fourth character (ASCII)
“Y” or “S”
34
ASCII space
0x20
35
ASCII “L”
0x4C
36
Last target speed hundreds digit
37
Last target speed tens digit
38
Last target speed ones digit
39
ASCII space
0x20
22
40
41
42
43
44
45
46
47
48
49
50
51
52
53
54
55
56
57
58
59
60
ASCII “P”
Peak target speed hundreds digit
Peak target speed tens digit
Peak target speed ones digit
ASCII space
ASCII “A”
Average target speed hundreds digit
Average target speed tens digit
Average target speed ones digit
ASCII space
Target Strength tens digit
Target Strength ones digit
ASCII space
Target classification
ASCII space
Target duration thousands digit
Target duration hundreds digit
Target duration tens digit
Target duration ones digit
ASCII space
Carriage Return
0x50
0x20
0x41
0x20
0x20
0x20
0x20
0x0D
When LOG messages are enabled with the Enable Stats LOG Messages setting on a port, the unit
generates a 60-byte ASCII message as defined above
(e.g. “LOG 0015 2000/12/31 23:59:59 CLOS L040 P041 A040 19 2 0077 <cr>“) for each of the targets lost
in the last radar measuring period. It appends these LOG message(s) to the end of the selected standard
streaming format messages. If the unit is configured for tenths resolution, a decimal point and tenths
digit is added to each speed value
(e.g. “LOG 0015 2000/12/31 23:59:59 CLOS L040.1 P041.3 A040.4 19 2 0077 <cr>”) and each LOG
message is 66 bytes long.
Due to the length of these messages and the variable number of them, the baud rate setting should be
set at 115200 to ensure that all generated messages are sent before the radar processes new target
information.
23