1
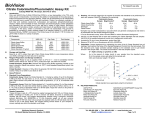
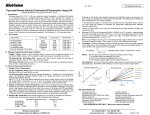
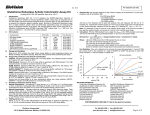
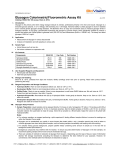
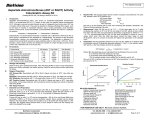
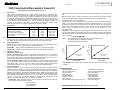
BioVision
For research use only
rev. 02/13
FAD Colorimetric/Fluorometric Assay Kit
(Catalog #K357-100; 100 assays; Store kit at -20°C)
Components
FAD Assay Buffer
OxiRed Probe (in DMSO)
FAD Enzyme Mix (lyophilized)
FAD Standard (1 nmol, lyophilized)
Stop Solution
100 assays
Cap Code
Part Number
25 ml
0.2 ml
1 vial
1 vial
1.2 ml
WM
Red
Green
Yellow
Blue
K357-100-1
K357-100-2A
K357-100-4
K357-100-5
K357-100-6
III.
Storage and Handling:
Store the kit at -20°C, protect from light. Allow Assay Buffer to warm to room temperature before
use. Briefly centrifuge vials before opening. Read the entire protocol before the assay.
IV.
Reagent preparation:
Probe: Ready to use as supplied. Warm to room temperature to thaw the DMSO solution
before use. Store at -20°C, protect from light. Use within two months.
Enzyme Mix:
Dissolve in 220 µl Distilled Water. Store at -20°C. Use within two months.
FAD Standard: Dissolve in 100 µl DMSO to generate 10 pmol/µl (10 µM) FAD Standard.
V.
FAD Assay Protocol:
1. Standard Curve Preparation:
For the colorimetric assay, dilute the 10 pmol/µl FAD Standard solution to 0.2 pmol/µl by
adding 10 µlof FAD Standard to 490 µl of Assay Buffer, mix well. Add 0, 2, 4, 6, 8, 10 µl into a
series of wells. Adjust volume to 50 µl/well with Assay Buffer to generate 0, 0.4, 0.8, 1.2, 1.6, 2
pmol/well of the FAD Standard. Use a freshly diluted Standard each time.
For the fluorometric assay, dilute the FAD Standard solution to 0.02 pmol/µl by adding 10 µl of
the 10 pmol/µl FAD Standard to 490 µl of Assay Buffer, mix well. Then take 10 µl to 90 µll of
Assay Buffer. Add 0, 2, 4, 6, 8, 10 µl into a series of wells. Adjust volume to 50 µl/well with
Assay Buffer to generate 0, 0.04, 0.08, 0.12, 0.16, 0.2 pmol/well of the FAD Standard.
2. Sample Preparations:
Homogenize tissue (5 - 20 mg) or cells (1 x 10⁶) in 400 µl of Assay Buffer, centrifuge to remove
insoluble material at 13,000 x g for 3 mins. Serum samples should be collected using EDTA to
inhibit enzymes that may degrade FAD. Deproteinize sample using perchloric acid precipitation
(BioVision, Cat.# K808-200, Deproteinizing Sample Prep Kit) to release FAD from proteins. After
deproteinization, add samples directly to 96 well plate, bring the volume to 50 µl/well with Assay
Buffer. Approximate sample amount per assay: ~0.1 - 0.5 mg tissue; ~10,000 - 100,000 cultured
cells, ~0.1 - 20 µl serum. For unknown samples, we suggest testing several doses of your
sample to ensure the readings are within the standard curve range.
3. Reaction Mix: Mix enough reagent for the number of assays to be performed. For each well,
prepare a total 50 µl Reaction Mix containing:
46 µl Assay Buffer
2 µl OxiRed Probe*
2 µl Enzyme Mix
BioVision Incorporated
155 S. Milpitas Boulevard, Milpitas, CA 95035 USA
Add 50 µl of the Reaction Mix to each well containing FAD Standard and test samples. Mix
well.
* Note: Fluorometric Assay is 10 fold more sensitive than Colorimetric Assay. Using 0.4 µl/well
of the probe will significantly decrease the background reading in fluorometric assay.
4.
Incubate the reaction at room temperature.
5.
Measure OD 570 nm for the colorimetric assay or Ex/Em = 535/587 nm for the fluorometric
assay in a micro plate reader. Reading the samples and standards every 5 min. You can stop
the reactions by adding 10 µl of Stop Solution; gently shake the plate to mix. The reaction is
stable for 24 hr after adding stop solution. Use the data on the time that shows maximum
linear readings. The reaction is linear with time until OD 570 nm reaches 1.8 in the
colorimetric assays.
6.
Calculation: Correct background by subtracting the value derived from the 0 FAD control
from all sample readings (The background reading can be significant and must be subtracted
from sample readings). Plot FAD standard Curve, FAD concentrations of the test samples can
then be calculated:
C = Sa/Sv pmol/µl or µM
Where: Sa is the sample amount of unknown (in pmol) from standard curve,
Sv is sample volume (in µl) added into the wells.
FAD Molecular Weight is 785.55 g/mol.
1.5
FAD Fluorometric assay
10000
FAD Colorimetric Assay
8000
1
RFU
II.
Introduction:
Flavin Adenine Dinucleotide (FAD) is a redox cofactor which plays an important role in
metabolism. FAD exists in different redox states and cycles between FAD, FADH and FADH2.
The primary sources of reduced FAD in eukaryotic metabolism are the citric acid cycle and the
beta oxidation reaction pathways. In BioVision’s FAD Assay Kit, FAD functions as the cofactor of
an oxidase which catalyzes the formation of a product generating color and fluorescence. FAD
can be detected by either colorimetric (OD = 570 nm) or fluorometric (Ex/Em = 535/587 nm)
methods. The kit provides a rapid, simple, ultra-sensitive, and reliable test suitable for high
throughput assay of FAD. The lower limit of detection is less than 1 nM FAD.
Kit Contents:
OD 570 nm
I.
6000
4000
0.5
y = 0.6976x + 0.0315
R² = 0.9994
y = 45285x + 835.62
R² = 0.9996
2000
0
0
0
0.5
1
1.5
FAD (pmol/well)
2
0
0.05
0.1
0.15
0.2
FAD (pmol/well)
FAD Standard Curve. Assays were performed following this protocol, reading after 15 min
incubation.
RELATED PRODUCTS:
NAD/NADH Quantification Kit
ADP/ATP Ratio Assay Kit
Glucose Assay Kit
Ethanol Assay Kit
Pyruvate Assay Kit
Creatinine Assay Kit
Hemin Assay Kit
Total Antioxidant Capacity (TAC) Assay Kit
NADP/NADPH Quantitation Kit
Ascorbic Acid Quantification Kit
Fatty Acid Assay Kit
Uric Acid Assay Kit
Lactate Assay Kit/ II
Triglyceride Assay Kit
Glutathione Detection Kit
Nitric Oxide Assay Kit
FOR RESEARCH USE ONLY! Not to be used on humans.
Tel: 408-493-1800 | Fax: 408-493-1801
www.biovision.com | [email protected]
Page 1 of 2
BioVision
rev. 02/13
For research use only
GENERAL TROUBLESHOOTING GUIDE:
Problems
Cause
Solution
Assay not working
• Use of ice-cold assay buffer
• Assay buffer must be at room temperature
Samples with erratic readings
Lower/ Higher readings in Samples
and Standards
Readings do not follow a linear
pattern for Standard curve
Unanticipated results
• Omission of a step in the protocol
• Refer and follow the data sheet precisely
• Plate read at incorrect wavelength
• Check the wavelength in the data sheet and the filter settings of the instrument
• Use of a different 96-well plate
• Fluorescence: Black plates ; Luminescence: White plates ; Colorimeters: Clear plates
• Use of an incompatible sample type
• Refer data sheet for details about incompatible samples
• Samples prepared in a different buffer
• Use the assay buffer provided in the kit or refer data sheet for instructions
• Samples were not deproteinized (if indicated in datasheet)
• Use the 10 kDa spin cut-off filter or PCA precipitation as indicated
• Cell/ tissue samples were not completely homogenized
• Use Dounce homogenizer (increase the number of strokes); observe for lysis under
microscope
• Samples used after multiple free-thaw cycles
• Aliquot and freeze samples if needed to use multiple times
• Presence of interfering substance in the sample
• Troubleshoot if needed, deproteinize samples
• Use of old or inappropriately stored samples
• Use fresh samples or store at correct temperatures till use
• Improperly thawed components
• Thaw all components completely and mix gently before use
• Use of expired kit or improperly stored reagents
• Always check the expiry date and store the components appropriately
• Allowing the reagents to sit for extended times on ice
• Always thaw and prepare fresh reaction mix before use
• Incorrect incubation times or temperatures
• Refer datasheet & verify correct incubation times and temperatures
• Incorrect volumes used
• Use calibrated pipettes and aliquot correctly
• Use of partially thawed components
• Thaw and resuspend all components before preparing the reaction mix
• Pipetting errors in the standard
• Avoid pipetting small volumes
• Pipetting errors in the reaction mix
• Prepare a master reaction mix whenever possible
• Air bubbles formed in well
• Pipette gently against the wall of the tubes
• Standard stock is at an incorrect concentration
• Always refer the dilutions in the data sheet
• Calculation errors
• Recheck calculations after referring the data sheet
• Substituting reagents from older kits/ lots
• Use fresh components from the same kit
• Measured at incorrect wavelength
• Check the equipment and the filter setting
• Samples contain interfering substances
• Troubleshoot if it interferes with the kit
• Use of incompatible sample type
• Refer data sheet to check if sample is compatible with the kit or optimization is needed
• Sample readings above/below the linear range
• Concentrate/ Dilute sample so as to be in the linear range
Note: The most probable list of causes is under each problem section. Causes/ Solutions may overlap with other problems.
BioVision Incorporated
155 S. Milpitas Boulevard, Milpitas, CA 95035 USA
Tel: 408-493-1800 | Fax: 408-493-1801
www.biovision.com | [email protected]
Page 2 of 2