1
Manually Adjust
the Baseline and
Threshold
Experimental error (such as contamination or inaccurate pipetting) can produce
data that deviate significantly from data for typical amplification curves. Such
atypical data cause the software algorithm to generate incorrect baseline and
threshold values for the associated detector.
Reviewing all baseline and threshold values after analysis of the study data is
recommended. If necessary, adjust the values manually as described in the
appropriate instrument user manual.
IMPORTANT! After analysis, you must verify that the baseline and threshold
were called correctly for each well by viewing the resulting amplification plots.
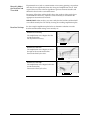
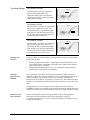
Baseline Settings
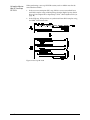
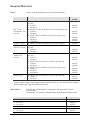
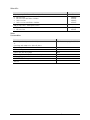
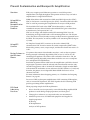
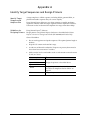
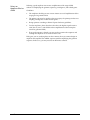
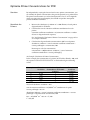
See the example amplification plots below to determine whether or not the
baseline and threshold settings were correctly set.
Baseline Set Correctly
The amplification curve begins after the
maximum baseline.
No adjustment necessary.
Baseline Set Too Low
The amplification curve begins too far to
the right of the maximum baseline.
Increase the End Cycle value.
Baseline Set Too High
The amplification curve begins before the
maximum baseline.
Decrease the End Cycle value.
20
SYBR® Select Master Mix User Guide