1
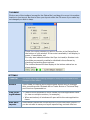
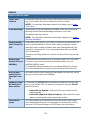
SETTINGS
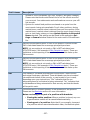
l
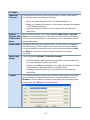
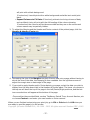
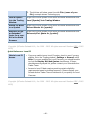
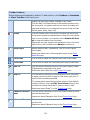
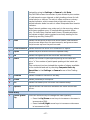
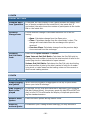
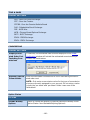
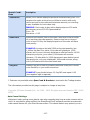
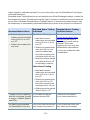
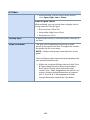
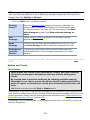
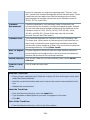
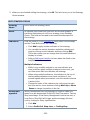
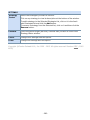
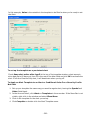
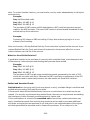
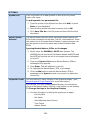
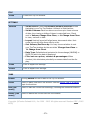
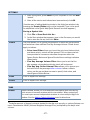
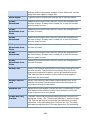
When selected, you can choose which lines to
view: Open, High, Low or Close.
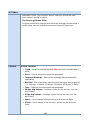
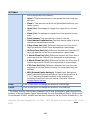
Point & Figure Charts
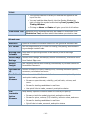
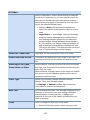
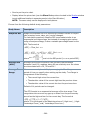
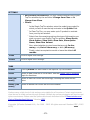
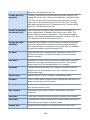
When selected, you can choose how to display the following items for Point & Figure:
l
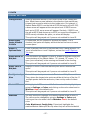
Box size from 0.05 to 500
l
Using either High/Low or Close
l
Reversal from 1 to 5.
Overlay Style
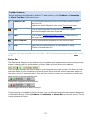
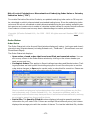
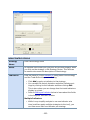
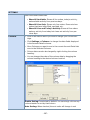
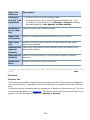
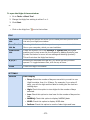
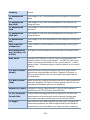
If applying an overlay of a second symbol, the style is
set here.
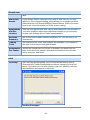
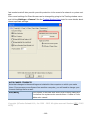
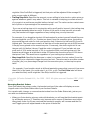
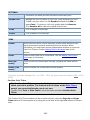
Graph Line Width
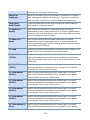
This gray field is adjustable with the up or down
arrows to the right of the field. The higher the number,
the bolder the line in the chart.
NOTE: A higher setting may cause distortion to the
graph.
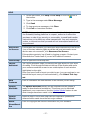
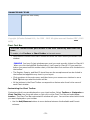
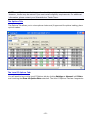
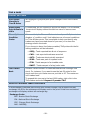
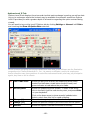
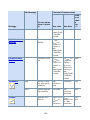
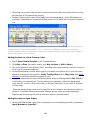
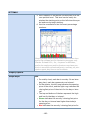
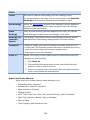
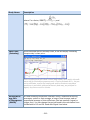
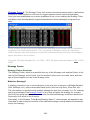
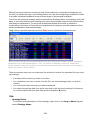
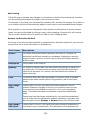
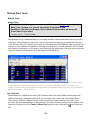
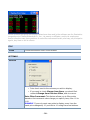
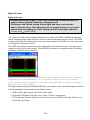
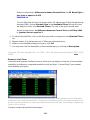
Point and Figure charts have several designations the
user should be familiar with.
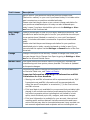
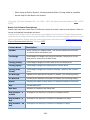
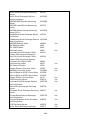
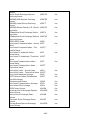
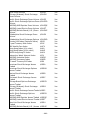
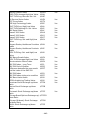
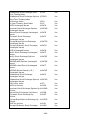
1. Within the rising and falling columns of daily Point
& Figure charts there are letters and numbers.
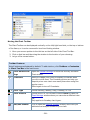
Since Point & Figure charts technically don’t
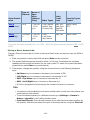
include ‘time,’ these designations are used for reference. January through September correspond
with 1- 9 and A, B, C are assigned to October
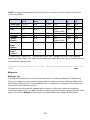
through December respectively. See below:
- 195 -