1
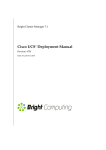
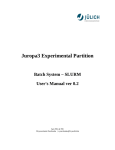
366
Cluster Monitoring
Figure 11.20: Graph Display Pane Settings Dialog
This allows the following settings to be modified:
• the Title shown at the top of the graph;
• over When the x-range is displayed;
• The existence and positioning of the Legend;
• the Intervals value. This is the number of intervals (by default
200) used to draw the graph. For example, although there may be
2000 data points available during the selected period, by default
only 200 are used, with each of the 200 an average of 10 real data
points. This mechanism is especially useful for smoothing out noisier metrics to give a better overview of behavior.
• The Refresh Interval, which sets how often the graph is recreated;
• the visual layout of the graphs, which can be adjusted so that:
– Color aspects of each graph are changed in the row of settings
for that graph;
– Each graph is deleted from its pane with the button at the
end of the row of settings for that graph;
– The number of points representing Outliers can be set for
each boxplot (page 361) displayed. The points are chosen based
on their distance being a maximum from the median, with the
order in which they are chosen being alternately above and below the median.
11.4
Monitoring Configuration With cmgui
This section is about the configuration of monitoring for health checks
and metrics, along with setting up the actions which are triggered from a
health check or a metric threshold check.
Selecting Monitoring Configuration from the resources section
of cmgui makes the following tabs available (figure 11.21):
© Bright Computing, Inc.