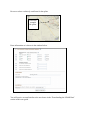
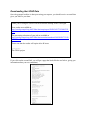
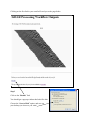
1
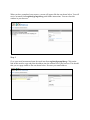
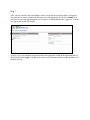
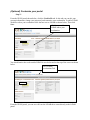
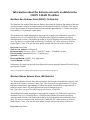
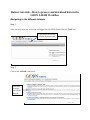
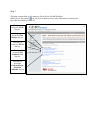
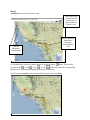
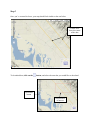
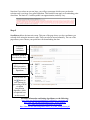
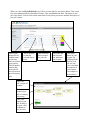
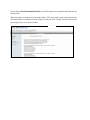
GEON LiDAR Workflow (GLW)
Users Guide
Sarah Robinson
Joshua Coyan
Christopher Crosby
Ramón Arrowsmith
School of Earth and Space Exploration
Arizona State University
April 2008
http://lidar.asu.edu
Table of Contents
About LiDAR ................................................................................................................................ 2
Getting Started - Register for a GEON and LiDAR account and log in ................................. 3
Registering with GEON.............................................................................................................. 3
Accessing the GEON LiDAR Workflow.................................................................................... 8
(Optional) Customize your portal ............................................................................................. 11
Information about the datasets currently available in the GEON LiDAR Workflow ......... 12
Northern San Andreas Fault (NSAF), CA Data Set ................................................................. 12
Western Rainier Seismic Zone, WA Data Set .......................................................................... 12
Fault Systems in the Eastern California Shear Zone (ECSZ) ................................................... 13
B4: Southern San Andreas Fault............................................................................................... 14
Dataset tutorials—How to process and download data in the GEON LiDAR Workflow ... 15
Navigating to the different datasets .......................................................................................... 15
Downloading Data .................................................................................................................... 17
Job management........................................................................................................................ 22
Generating a DEM via spline.................................................................................................... 25
Downloading the LiDAR Data ................................................................................................. 27
About LiDAR
Light Distance and Ranging (LiDAR) or Airborne Laser Swath Mapping (ALSW) data
has become readily available as both technologies have increased and the emergence of
Geoinformatics has occurred. LiDAR data is collected by use of an aircraft that is outfitted with
a kinematic GPS, an inertial measurement unit, and a pulsed laser ranging system. The
combination of these three mechanism work in unison to produce billions of measurement of x,
y, and z coordinates of the ground surface and vegetation cover. This data is referred to as the
‘Point Cloud’ (Crosby, 2006).
Due to the potentially large size of such data sets it can be difficult to both make the data
available to others and to model such large data sets in a meaningful way. The GEON LiDAR
Workflow (GLW) provides a window to a user-defined selection of raw data that may be
modeled into unique, user-defined DEMs or visualizations. The GLW can do this by
democratizing the data though multiple super computers. This approach provides a useful avenue
to share data and to model cyber infrastructure and information technology. A generalized aerial
LiDAR acquisition and processing workflow consists of the following four steps: 1) Data
acquisition, 2) processing of laser ranging, GPS and IMU data to generate LiDAR point cloud, 3)
point cloud classification and 4) generation, manipulation, and delivery of digital ground and
vegetation models (Crosby, 2006)
For more information about LiDAR refer to:
Crosby, Christopher J. A Geoinformatics Approach to LiDAR Data Distribution
and Processing with Applications to Geomorphology. Master’s Thesis, Arizona State
University, August 2006.
http://activetectonics.la.asu.edu/GEONatASU/index.htm
http://lidar.asu.edu
Getting Started - Register for a GEON and LiDAR account
and log in
This portion of the manual will guide you through setting up an account for GEON, setting up an
account for LiDAR, and will briefly discuss some options you may come across. In order to use
the GEON LiDAR you will need to register with both GEON and register with LiDAR.
Registering with GEON
Step 1
Go to www.geongrid.org
This is the intro page for GEON. This is a good location to learn more about GEON and
LiDAR by clicking on the About, Research, Resources, Educational, and Tutorials tabs.
Step 2
Click on the Portal button shown below. This tab will take you to the login screen.
Click
here
to
enter
Step 3
The portal grants access to the GEON resources and GEON tools. The portal also provides a
private workstation where you can queue jobs and return to access them again and again.
In order to have access to the GEONgrid each user must register by clicking the Request an
Account link shown below. If you already have an account simply type your username and
password into the appropriate box to gain access.
Click here if you have not
requested an account and
need to register.
Step 4
This screen requires you to enter information about yourself. Notice, you must enter your first
and last name and email address, these fields are required. You must enter a valid email address
in order to receive further instructions to login. When you have entered the appropriate
information click Continue.
Step 5
A confirmation screen will appear with the information you entered. Take a moment to review
your information and see that it is correct, if it is correct click Submit if it is not correct click
Edit Request, which will return you to the previous screen.
When you have completed your request, a screen will appear like the one shown below. You will
receive an email from [email protected] with further instructions. You can close this
window in your browser.
Step 6
Go to your email account and open the email sent from [email protected]. Click on the
link in this email or copy and paste the address into the address bar of your browser. This should
take you to a page similar to the one shown below. Re-enter your email address.
Step 7
After you have entered your email address a new screen like the one shown below will appear.
You will need to choose a password and enter it into the appropriate fields, click Submit. You
will receive a message indicating that your account is awaiting administrative approval. You can
now log in and use the GEONgrid.
To login, type your username and password into the appropriate fields on the right hand side of
the screen and click Login. You may wish to have your username and password remembered, if
so check the box.
Accessing the GEON LiDAR Workflow
Step 8
Once you have logged into GEON portal, you should see a screen like the one shown below. To
access the LiDAR data set, click on the Tools tab shown below.
Click here to access the
LiDAR registration page
and tool.
Step 9
This will take you to a screen like the one shown below. This screen is a menu of GEON tools
available for use; for more information about each tool click on the appropriate link. To access
the LiDAR Workflow, click on the GEON LiDAR link shown below.
Click here
to access
the LiDAR
registration
page and
tool.
Step 10
It is now possible to use the LiDAR workflow trial version. To use the trial version, which limits
the user to 5 million points per query, see the Data and Tutorials sections of this user’s manual.
In order to register for an account that will allows 50 million points per query it is necessary to
fill out the form shown below (red box), when you are finished click Submit. Note that we have
this second layer of authentication because we are using US Teragrid compute resources
(http://www.teragrid.org). We take advantage of the GEON portal role-based authentication
capabilities to manage resource use accordingly. Give this a try and if you need more, contact
the GLW development team ([email protected]) and we can up your point limit.
Once you have completed the form you should see a screen that looks like the one shown below.
Expect to receive an email from the GLW reviewers within 24 hours. While you are waiting, feel
free to run some jobs and get used to the GLW.
The next time you return to the LiDAR page the registration form will not be a part of the screen
and you can now directly access the data sets. For information on how to access the data sets see
the Data and Tutorial sections of this User’s Manual.
(Optional) Customize your portal
Step 11
From the GEON portal shown below, click the UserProfile tab. In this tab you can edit your
account information, change your password, and customize your workstation. To add a LiDAR
Workflow tab to your workstation click the box next to LiDAR as shown below. Then click
Save.
Click here to add a
LiDAR tab to your
workstation.
You should notice that a tab entitles LiDAR is now be located on the top of the screen as shown
below.
New LiDAR
workstation Tab
From the GEON portal, you can now click on the LiDAR tab to come directly to the LiDAR
portal.
Information about the datasets currently available in the
GEON LiDAR Workflow
Northern San Andreas Fault (NSAF), CA Data Set
The Northern San Andreas Fault data set features data along the Northern San Andreas fault and
associated marine terraces in coastal Sonoma and Mendocino counties, California. This data set
covers approximately 418 square kilometers and includes approximately 1.2 billion data points.
Point density is 1.2 points per square meter.
This airborne laser swath mapping data was acquired in support of collaborative research by
members of the U.S. Geological Survey (USGS)and the National Aeronautics and Space
Administration (NASA), with funding provided by NASA's Earth Surface and Interior Focus
Area. The data were acquired and processed by TerraPoint, LLC under contract to NASA's
Stennis Space Center. The data are in the public domain with no restrictions on their use.
Projection: State Plane
Zone for San Andreas: California II
Horizontal units: US Survey Feet (= 1200/3937 meters ~ 0.30480061 meters)
Elevation units: International Feet (= 0.3048 meters)
Spheroid: GRS80
Horizontal Datum: NAD83, 1991 Adjustment
Vertical Datum: NAVD88
Orthometric elevations are derived from ellipsoid elevations using the National Geodetic Survey
geoid model Geoid99
(https://portal.geongrid.org:8443/gridsphere/gridsphere?gs_action=lidarNSAF&cid=215)
Western Rainier Seismic Zone, WA Data Set
The Western Rainier Seismic Zone data set features data from the western Rainier seismic zone,
adjacent to Mt. Rainier, in Pierce County, WA. This data set covers approximately 325 square
kilometers and includes approximately a billion data points. Point density is approximately 2
points per square meter. For more information on these data please go to:
http://gsa.confex.com/gsa/2003AM/finalprogram/abstract_67004.htm.
This airborne laser swath mapping data was acquired in support of collaborative research by
members of the U.S. Geological Survey (USGS)and the National Aeronautics and Space
Administration (NASA), with funding provided by NASA's Earth Surface and Interior Focus
Area. The data were acquired and processed by TerraPoint, LLC under contract to NASA's
Stennis Space Center. The data are in the public domain with no restrictions on their use.
Projection: State Plane
Zone: Washington North
Horizontal units: US Survey Feet (= 1200/3937 meters ~ 0.30480061 meters)
Elevation units: International Feet (= 0.3048 meters)
Spheroid: GRS80
Horizontal Datum: NAD83, 1991 Adjustment
Vertical Datum: NAVD88
Orthometric elevations are derived from ellipsoid elevations using the National Geodetic Survey
geoid model Geoid99
(https://portal.geongrid.org:8443/gridsphere/gridsphere?gs_action=lidarRainier&cid=215)
Fault Systems in the Eastern California Shear Zone (ECSZ)
The Fault Systems in the Eastern California Shear Zone (ECSZ) contains data acquired by the
National Center for Airborne Laser Mapping (NCALM) on behalf of Dr. Mike Oskin (UNC) and
Dr. Lesley Perg (U of M)) as part of their NSF project on fault systems in the Eastern California
Shear Zone. They have kindly agreed to make these data available to the research community
through the GEON LiDAR Workflow.
Grid Coordinate System Name: Universal Transverse Mercator
UTM Zone Number: 11 N
Transverse Mercator Projection
Scale Factor at Central Meridian: 0.999600
Longitude of Central Meridian: -117.000000
Latitude of Projection Origin: 0.000000
False Easting: 500000.000000
False Northing: 0.000000
Planar Coordinate Information:
Planar Distance Units: meters
Geodetic Model
Horizontal Datum Name: D_WGS_1984
Ellipsoid Name: WGS_1984
(https://portal.geongrid.org:8443/gridsphere/gridsphere?gs_action=lidarECSZ&cid=215)
B4: Southern San Andreas Fault
The B4: Southern San Andreas Fault Data Sat offers access to LiDAR point cloud data of the
southern San Andreas Fault acquired by the National Center for Airborne Laser Mapping
(NCALM) through funding from the National Science Foundation (NSF) as part of the "B4
Project". The B4 Project has kindly agreed to make these data available to the research
community through the GEON LiDAR Workflow. If you utilize the B4 data for talks, posters or
publications, we ask that you acknowledge the B4 project.
Grid Coordinate System Name: Universal Transverse Mercator
UTM Zone Number: 11 N
Transverse Mercator Projection
Scale Factor at Central Meridian: 0.999600
Longitude of Central Meridian: -117.000000
Latitude of Projection Origin: 0.000000
False Easting: 500000.000000
False Northing: 0.000000
Planar Coordinate Information:
Planar Distance Units: meters
Geodetic Model
Horizontal Datum Name: D_WGS_1984
Ellipsoid Name: WGS_1984
(https://portal.geongrid.org:8443/gridsphere/gridsphere?gs_action=lidarB4&cid=215)
Dataset tutorials—How to process and download data in the
GEON LiDAR Workflow
Navigating to the different datasets
Step 1
After you have requested an account and logged into the GEON Portal click the “Tools” tab
Click here to access the
LiDAR Workflow link
Step 2
Click on the “LIDAR” link below.
Click here
to access
the LiDAR
data set.
Step 3
This page contains links to five data sets offered by the LiDAR Workflow.
When you see the symbol
you can click on them to receive more information concerning the
topic that the symbol is in front of.
Click here to
access the NSAF
data set.
Click here to
access the West
Rainier data set.
Click here to
access the ECSZ
data set.
Click here to
access the B4
Southern SAF
data set.
Click here to
access the
GeoEarthScope
Northern
California data set.
Downloading Data
This portion of the manual will guide you through downloading data from the B4 Southern SAF
data set. The other data sets use a similar interface for downloading LiDAR data (i.e. if you
know how to download data from B4, you can easily figure out how to navigate the other data
sets).
Step 1
Click on the “B4: Southern San Andreas Fault” link.
Click
here
You should enter a page that looks like the one below. This page includes information about the
B4 project, and an interactive map for downloading the LiDAR data.
Step 2
Scroll down to view the interactive map.
Tabs allow you to
change from the
terrain view to
map, satellite, or
hybrid views.
Tools for
interacting
with the map
Yellow indicates
where there
should be
downloadable
data
button. You can also
To download data, zoom in toward the area of interest using the
navigate north ( ), south ( ), east ( ), or west ( ) on the map using the corresponding
buttons, or by clicking and dragging the map with your mouse.
For this tutorial, zoom in to the location indicated by the red circle below.
Step 3
Once you’ve zoomed in closer, your map should look similar to the one below.
Yellow lines
show the extent
of the data
To download data, click on the
button, and select the area that you would like to download.
Download
button
Selected area
of interest
Note that if you select an area too large, you will get a message which warns you that the
selection area is too large for a spline algorithm. This limit does not apply to downloading point
cloud data. The limit of 1.6 million points is an approximation, and may vary.
Step 4
Scroll down below the interactive map. This part of the page shows you the coordinates you
selected while using the interactive map. These can also be entered manually. The rest of the
page allows you to choose your preferences for downloading the data.
Your data
selection
coordinates
Checkbox option to
download raw data
Options for your
DEM generation
using local binning
algorithms
You can click on
the button to
view options for
generating a DEM
via spline
interpolation
algorithm, which
is explained later
in this tutorial
For more information on binning algorithms, see the following:
http://lidar.asu.edu/KnowledgeBase/LocalBinning_one-pager.pdf
http://lidar.asu.edu/KnowledgeBase/GLW_Search_Radius/
http://lidar.asu.edu/KnowledgeBase/WCptcount/
http://lidar.asu.edu/KnowledgeBase/Notes_on_Lidar_interpolation.pdf
For this tutorial, we want to check the “IDW” box, enter 0.5 into the “Grid Resolution” text
box, and 1 into the “Enter radius value” text box. Your screen should like the one below.
Check this
box
Enter these
values
Step 5
Scroll down, and enter a job title and job description.
When you are done, press “Submit”. Note that you must have your email entered in order to
receive a notification when your request is done processing. Processing your job could take a
significant amount of time.
Job management
One of the advantages of the cyberinfrastructure approach that we employ is the opportunity to
watch your jobs as they progress through the GLW, to archive your jobs, and to find them again
and modify them and rerun them if desired.
To view access jobs
submitted or status of jobs
submitted click here.
To view a summary of
your LiDAR jobs
submissions click here.
When you click on My LiDAR Jobs you will see a screen like the one shown below. This screen
lists your submitted jobs by Id number, Dataset, Title, and Submission Date. The status of your
job is also listed. You can click on the status link of each job to get a more detailed description of
your job’s status.
This is your
unique Job Id
number based
on the time
that you submit
your request.
This Id number
ensures that
your job will
never be mixed
up with anyone
else.
This is the data
set that the
selected data is
from.
This is the
job’s unique Id
number.
This is the
position your
job is in during
processing.
This is the
status of your
job. If there is
an error, click
on Error to
see the error.
This is the title
that you chose
for your job.
This is the date
and time that
you submitted
your request.
This is the
status of your
request. By
clicking on the
link for each
job you can
view a detailed
description of
your request.
An example is
shown below.
If you click on My Jobs Submission Info you will be taken to a screen that looks like the one
shown below.
This screen gives a summary of your usage history. The top section is your total usage history.
The mid-section is a summary of your usage over the past week. Finally, the bottom section is
your usage history over the last month.
Generating a DEM via spline
This section explains how to generate a DEM via spline. This is not done very often, and is only
good for relatively small areas. They are good if the grid resolution is less than the shot density
(in other words for B4 data it is good for a 25 cm DEM) and for the NSAF and Ranier, it is good
for under the trees where there are many fewer ground returns.
In the interactive map page for B4, click on the button. This will reveal spline options.
Elevation
Slope
The map
direction
that the
slope faces
The profile
curvature
DEM
resolution
The minimum
spacing
between data
points in the
map units
Control the
spline
behavior
between
the points
Be sure to select a relatively small area for the spline.
Good size
example
for spline.
Enter information as is shown in the window below.
You will receive an email similar to the one shown in the “Downloading the LiDAR Data”
section of this user guide.
Downloading the LiDAR Data
Once the geongrid website is done processing your request, you should receive an email that
gives you links to your data:
Thank you for using the GEON LiDAR Workflow running on the GEONgrid.
Your results are available at
http://portal.geongrid.org:8405/lidar/data/tmp/output1209245629732120899795.
html.
The processing selections of your job are available at
http://portal.geongrid.org:8405/lidar/data/metadata/metadata1209245629732120
899795.html.
Please note that the results will expire after 48 hours.
--------------The GEON project
If you click on the second link, you will get a page that looks like the one below, giving you
information about your run (metadata).
Clicking on the first link in your email will send you to the page below.
Step 1
Click on the “Results” link.
You should get a pop-up window that looks like this:
Choose the “Save to Disk” option, and save on
your desktop (or wherever you want)
Step 2
The file you downloaded is compressed, so you will need to decompress the file before you can
work with it in ARC GIS. You can do this by right-clicking on the icon you downloaded.
See GEON LiDAR Workflow (GLW) output and ArcMap Users Guide for information on
using the downloaded data in Arc Map.