1
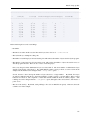
Massif: a heap profiler
distinct stack traces in the tree. In contrast, if B calls A repeatedly from line 15 (e.g. due to a loop), then each of those
calls will be represented by the same stack trace in the tree.
Note also that tree entry with children in the example satisfies an invariant: the entry’s size is equal to the sum of
its children’s sizes. For example, the first entry has size 20,000B, and its children have sizes 10,000B, 8,000B, and
2,000B. In general, this invariant almost always holds. However, in rare circumstances stack traces can be malformed,
in which case a stack trace can be a sub-trace of another stack trace. This means that some entries in the tree may
not satisfy the invariant -- the entry’s size will be greater than the sum of its children’s sizes. Massif can sometimes
detect when this happens; if it does, it issues a warning:
Warning: Malformed stack trace detected. In Massif’s output,
the size of an entry’s child entries may not sum up
to the entry’s size as they normally do.
However, Massif does not detect and warn about every such occurrence. Fortunately, malformed stack traces are rare
in practice.
Returning now to ms_print’s output, the final part is similar:
-------------------------------------------------------------------------------n
time(B)
total(B) useful-heap(B) extra-heap(B)
stacks(B)
-------------------------------------------------------------------------------15
21,112
19,096
19,000
96
0
16
22,120
18,088
18,000
88
0
17
23,128
17,080
17,000
80
0
18
24,136
16,072
16,000
72
0
19
25,144
15,064
15,000
64
0
20
26,152
14,056
14,000
56
0
21
27,160
13,048
13,000
48
0
22
28,168
12,040
12,000
40
0
23
29,176
11,032
11,000
32
0
24
30,184
10,024
10,000
24
0
99.76% (10,000B) (heap allocation functions) malloc/new/new[], --alloc-fns, etc.
->79.81% (8,000B) 0x80483C2: g (example.c:5)
| ->39.90% (4,000B) 0x80483E2: f (example.c:11)
| | ->39.90% (4,000B) 0x8048431: main (example.c:23)
| |
| ->39.90% (4,000B) 0x8048436: main (example.c:25)
|
->19.95% (2,000B) 0x80483DA: f (example.c:10)
| ->19.95% (2,000B) 0x8048431: main (example.c:23)
|
->00.00% (0B) in 1+ places, all below ms_print’s threshold (01.00%)
The final detailed snapshot shows how the heap looked at termination. The 00.00% entry represents the code locations
for which memory was allocated and then freed (line 20 in this case, the memory for which was freed on line 28).
However, no code location details are given for this entry; by default, Massif only records the details for code locations
responsible for more than 1% of useful memory bytes, and ms_print likewise only prints the details for code locations
115