1
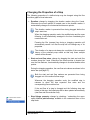
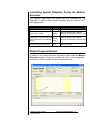
Y-axis has the following characteristics:
•
•
•
•
•
•
Values will be measured and shown in the flow units selected by the
User.
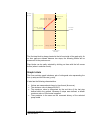
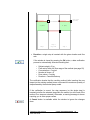
The maximum value (always positive) will be determined by the
maximum flow between those defined by the User within the steps of the
method. It will be also limited by the maximum flow allowed by the
selected pump and syringe models (see page 22). The maximum flow
will be represented by a horizontal line with a tag showing the value. The
area above this maximum flow will be shaded gray.
The minimum value (always negative) will be automatically set to the
absolute value of the maximum flow with the negative sign whenever the
maximum value is changed. The minimum flow will be represented by a
horizontal line with a tag showing the value. The area below this
minimum flow will be shaded gray.
The area around zero below the absolute value of the minimum flow that
the pump is capable of performing will be indicated by two horizontal
lines. The area between these lines will be shaded gray. Furthermore,
the value represented by the line will be drawn on top of each line,
aligned to the right.
It will be crossed by the X-axis always at flow rate 0.
Zoom options are available to allow the User to increase / decrease the
visual flow precision.
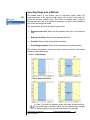
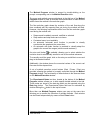
Both the X and Y-axis provide a drag-and-drop mechanism that allows you to
freely move along the time / the flow range. To use it, drag the zone near to
the axis values (when the mouse pointer changes to a double-arrow icon).
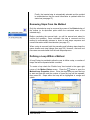
A pair of buttons (- and +) allow you to zoom in and out and thus increase /
decrease the visual time precision.
FlowControl User Manual
5421-002 Rev B
© 2011 Harvard Apparatus
26