1
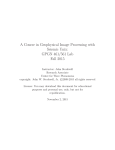
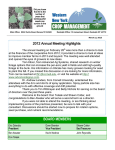
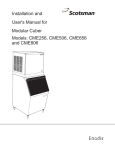
MANURE VALUE, COST AND TIME MANAGEMENT
CALCULATOR
USER’S MANUAL
Caroline Rasmussen, Margaret Dunn, Patty Ristow, Quirine
Ketterings, Tim Shepherd, Karl Czymmek
FEBRUARY 2011
Nutrient Management Spear Program
Collaboration among the Cornell University Department of Animal Science,
PRODAIRY and Cornell Cooperative Extension
http://nmsp.cals.cornell.edu
Contents
1. Introduction ................................................................................................................................. 1
Items Needed to Fill Out Sheets ................................................................................................. 2
2. What is the break-even hauling distance for my manure? ......................................................... 3
Fertilizer Replacement Value Sheet
3. What are the operating and ownership costs for my manure machinery? ............................... 23
Whole Farm Manure Cost Sheet
4. What is the value (fertilizer replacement) and cost of exporting manure? ............................... 30
Export Sheet
5. How much time (machinery and labor) will it take to spread manure? .................................... 33
Time Sheet
Correct citation:
Rasmussen, C., M. Dunn, P.L. Ristow, Q.M. Ketterings T. Shepherd, K. Czymmek (2010)
Manure Value, Cost and Time Management Calculator; User’s Manual. Department of Animal
Science. Cornell University, Ithaca NY. 38 pages.
Downloadable from: http://nmsp.cals.cornell.edu/projects/curriculum.html.
For more information:
Contact Quirine Ketterings at the Nutrient Management Spear Program, Department of Animal
Science, Cornell University, 323 Morrison Hall, Ithaca NY 14583, or e-mail: [email protected].
1. Introduction
This calculator was designed to estimate manure spreading costs in relation to the value of
manure nitrogen (N), phosphorus (P) and potassium (K) using different manure spreading
strategies at the field and whole farm levels. By changing the type or cost of equipment, labor
inputs, manure nutrient densities and application methods, fuel costs, and fertilizer costs,
different scenarios can be created to evaluate different manure allocation options.
The calculator can provide answers and analysis for several questions:
1. What is the fertilizer equivalent value of a manure application?
2. What is the break-even hauling distance for hauling my manure?
3. What are the operating and ownership costs for my manure machinery?
4. What is the value (in terms of fertilizer replacement) and cost of exporting manure?
5. How much time (clock hours as well as machinery and labor) will it take to spread
manure?
Upon opening the calculator, buttons will be displayed with these questions. Clicking on a button
will bring you to the appropriate input and results page. You can also navigate by clicking on the
tabs at the bottom of the screen. From any screen, at the top right-hand corner of the page, there
are two buttons that will take you to the User’s Manual for help, or to the Main Menu (the
“Return” button).
Entering the example data in the steps that are outlined in this user manual will provide the
results shown in snapshots throughout the user manual.
Warning: Feasibility and quality of the output of the calculator are dependent on the quality and
reliability of the input data used; these input data are the responsibility of the person using the
calculator. The equations in this calculator reflect our best effort to interpret a complex body of
scientific research on nutrient crediting and economic assessment, and to translate this into
practical management options. Implementation of manure management practices based on the
output of the calculator does not assure compliance with any applicable law, rule, regulation or
standard, or the achievement of particular discharge levels from agricultural land.
Information Requirements
Farm-specific data are required. To limit redundant data entries, we have attempted to organize
the sheets so that the same information is only entered once. While each different sheet of the
workbook deals with a different question above, many values from one sheet are transferred to
another. Using the sheets in the order that they appear on the opening screen will ensure that all
of the required information is entered.
1
Items Needed to Fill Out Sheets
(1) Fertilizer Replacement Value
Manure analysis (%, lb/gallon, or lb/ton of N, P2O5, and K2O).
Crop requirements (lb/acre of N, P2O5, and K2O).
Value of fertilizer ($/lb of N, P2O5, and K2O).
Field size (acres).
Application rates (gallons/acre or ton/acre).
Spreader capacity (gallons or ton).
Operating costs: fuel price, hourly labor costs.
Fuel efficiencies: average equipment speed (miles/hour for hauling; acres/hour for
application and incorporation), fuel consumption (gallons/hour).
(2) Whole Farm Manure Cost
Total manure to spread for the entire year (gallons or tons).
Total acres on which manure is spread and/or incorporated.
Total hours required to haul, spread, and incorporate manure.
Capital costs: purchase and salvage values of equipment, lifespan, age, repair costs; % of
capital cost used by the business, equipment insurance cost, value of insured equipment.
Information Taken from Other Sheets
Fuel efficiency (Fertilizer Replacement Value, Section (5)).
(3) Export
Field size (acres).
Application rate (gallons/acre or ton/acre, same units as in Fertilizer Replacement Value).
Distance from source (miles, one-way).
Crop needs (lbs/acre of N, P2O5, and K2O).
Information Taken from Other Sheets
Manure analysis and density (Fertilizer Replacement Value, Section (1)).
Fertilizer values and application cost (Fertilizer Replacement Value, Section (2)).
Application units (Fertilizer Replacement Value, Section (4)).
Spreader capacity (Fertilizer Replacement Value, Section (4)).
Hauling speed (Fertilizer Replacement Value, Section (5)).
Total gallons of manure to spread (Whole Farm Manure Costs).
Total hours to spread manure (Whole Farm Manure Costs).
Total per hour costs for spreading and incorporation (Whole Farm Manure Costs).
Total equipment and machinery ownership costs (Whole Farm Manure Costs).
(4) Time
Total loads of manure hauled or spread.
Time for each hauling trip (hours).
Speed of spreaders (loads/hr).
2
2. What is the break-even hauling distance for my manure?
Fertilizer Replacement Value Sheet
Section (1): Manure Nutrient Content
In this section white cells (boxes) are open for data entry and yellow cells (boxes) are calculated
values. The yellow cells present results based on data entered into white cells. Yellow cells are
locked and cannot be manipulated (Figure 1).
Figure 1: data entry for section (1) of the calculator with example data.
a. Animal Species: Animal species must be chosen from a pull down menu. Place the
cursor in the data entry box and then click the down-pointing arrow that appears on the
right; a list will be pulled down and an animal species can be chosen. This information is
important for calculating expected N credits from organic N mineralization over three
years following application.
A decay or mineralization series is commonly used to estimate the rate of N availability from
stable organic N. A decay series of 35, 12, and 5% is used to estimate the rate of
decomposition of organic N in liquid (<18% dry matter) dairy manures in New York. This
sequence of numbers means that 35% of the organic N is mineralized and potentially taken up
by the growing crop during the year the manure was applied, 12% of the initial organic N
application is mineralized and taken up during the second year, and 5% is mineralized and
taken up in the third year. There is evidence that manure containing large amounts of bedding
may mineralize at a slower rate than fresh manure. Therefore, the estimated availability of N
during the year applied is reduced from 35 to 25% when the dry matter content of the manure
exceeds 18%. These decay series and those for other animal manures are listed in Table 1.
3
Table 1: Decay series for stable organic N in manure by animal type. A “last year release rate”
of 12% indicates that an estimated 12% of the organic N applied in the manure is expected to
be utilized by the crop a year after application.
Release rate for organic N in manure (%)
Source
Total
Solids (%)
Present Year
“Decay_current”
Last Year
“Decay_lastyr”
Two Years Ago
“Decay_2yrs”
Cows
Cows
Poultry
Poultry
Swine
Swine
Horses
Horses
Sheep
Sheep
<18
18
<18
18
<18
18
<18
18
<18
18
35
25
55
55
35
25
30
25
35
25
12
12
12
12
12
12
12
12
12
12
5
5
5
5
5
5
5
5
5
5
b. Units: Manure nutrient analysis can be presented in various units: percent, pounds per
ton and pounds per 1000 gallons. Units must be selected from the pull down menu. Place
the cursor in the data entry box and then click the down-pointing arrow that appears on
the right; a list will be pulled down and a unit selection can be made. The units should
match what is reported on the manure analysis from the laboratory.
c. Ammonium-N: Ammonium-N or NH4-N should be entered in units listed beside the data
entry box. Double check the manure analysis report and the spreadsheet to make sure the
units are the same. If they are not the same, change the units by clicking on the data entry
box labeled “Units”.
d. Organic-N: Organic-N content should be entered in the same units as listed beside the
data entry box. Double check the manure analysis report and the spreadsheet to make
sure the units are the same. If they are not, change the units to be consistent with the
manure analysis report clicking on the data entry box labeled “Units”.
e. Total N: Total N is calculated as the sum of ammonium-N and organic-N. Data cannot
be entered into this cell.
f. P2O5: Phosphorus content (reported as P2O5 equivalent) should be entered in units listed
beside the data entry box. Double check the manure analysis report and the spreadsheet to
make sure the units are the same. If they are not, change the units to be consistent with
the manure analysis report. Make sure that the value entered is in P2O5 equivalents, NOT
the P content in the manure. If your manure analysis report only lists P, convert this value
to P2O5 by multiplying by 2.29.
g. K2O: Potassium content (reported as K2O equivalent) should be entered in units listed
beside the data entry box. Double check between the manure analysis report and the
spreadsheet to make sure the units are the same. If they are not, change the units to be
consistent with the manure analysis report. Make sure that the value entered is in K2O
4
equivalents, NOT the K content of the manure. If your manure analysis report only lists
K, convert to K2O by multiplying by 1.20.
h. Total Solids: Total solids are reported as a percentage. If “total solids” is not reported but
percent moisture is given, the total solid content can be determined by subtracting the
percent moisture from 100.
i. Density: Manure density is the mass per gallon usually reported in kg per liter (for
comparison, the density of water is 1 kg/liter). Different manure sources on a farm can
have different densities, which can impact the cost effectiveness of transporting nutrients
to farm fields. If your report only lists kg/liter (kg/L), convert to lb/gallon by multiplying
by 8.35.
In our practice example (found in the companion spreadsheet “Manure Value Calculator User’s
Manual”) we use manure from cattle with less than 18% solids and the manure nutrient content is
listed in percents (instead of pounds per ton or pounds per 1000 gallons)
Section (2): Fertilizer Costs
a.
Fertilizer Costs: To determine the fertilizer
replacement value of manure, contact the fertilizer dealer to
obtain component values. Component values can differ
depending on the base materials used to obtain different
mixes. Determine what fertilizer mix you would purchase if
manure were not available and obtain the component value of
that mix from your fertilizer sales representative.
Figure 2: Section (2) of the
calculator with example data..
b.
Fertilizer Application Costs: Estimate what the fertilizer
application costs would be if fertilizer were applied instead of
manure. Include equipment, labor and fuel in this cost. If there is
a custom fertilizer applicator in your area, they may have the best
estimate of what the per-acre cost would be for a fertilizer
application
In our practice example we use a cost per unit of N, P2O5 and K2O as shown in figure 2 and a
cost for the application of $10.00 per acre. The total cost to supply the crop will be calculated
after section 3 is filled in.
5
Section (3): Crop Nutrient Needs
The calculator calculates the fertilizer replacement value of
the manure on (1) Total nutrients applied with manure and
(2) Nutrient delivered by manure that are needed by the
crop. Section 3 requires the nutrient needs of the crop to be
defined (Figure 3).
Figure 3: Section (3) of the calculator with example data.
Manure nutrients (N, P2O5 and K2O) cannot be adjusted to fit crop needs like fertilizer. In order
to credit only the nutrients in the manure needed by the crop, be sure to indicate what your crop
nutrient needs are. Cornell nutrient guidelines can help determine crop nutrient needs based on
soil type, field history and soil test levels. Cornell nutrient guidelines for N, P and K can be
found at: http://nmsp.cals.cornell.edu/guidelines/nutrientguide.html.
Section (4): Manure Application
Figure 4: Data entry for section (4) of the calculator with example data.
This section allows different combinations of applications rates and methods to be entered to
achieve the desired nutrient credit for the current crop. Units: Two choices (tons or gallons) are
presented and they must be selected from the pull down menu. Place the cursor in the data entry
box and then click the down-pointing arrow that appears on the right; a list will be pulled down
and unit selection can be made.
a. Application Rate: Estimate an application rate that is appropriate for a particular field.
This value can be manually entered or automatically calculated using the “Balance to …”
buttons to the right.
b. Application Method and Timing: Place the cursor in the data entry box and then click
the down-pointing arrow that appears on the right; a list will be pulled down and a unit
selection can be made. Application method can be changed in combination with
application rate to deliver the desired amounts of nutrients.
Choices are listed in Table 2. The main impact of application method and timing is on
ammonium-N conservation. Injection or incorporation during the growing season helps
conserve ammonium-N. Non-incorporation of manure or applying manure in the fall
leads to loss of the ammonium-N in the manure. Surface applications without
6
incorporation will result in higher application costs due to the higher manure loading
rates than would be needed to meet N needs when manure is incorporated. Such higher
application rates will also lead to increases in soil test P and K over time.
Table 2: Manure application methods and the impact on Ammonium-N credits
Manure Application Method
Injected as sidedress on row crops
Spring incorporated within 1 day
Spring Incorporated within 2 days
Spring Incorporated within 3 days
Spring Incorporated within 4 days
Spring Incorporated within 5 days
Topdressed or incorporated after 5 days
Fall incorporated or injected
Surface application on frozen or saturated ground
% Ammonium-N
Credited
Lost
100
65
53
41
29
17
0
0
0
0
35
47
59
71
83
100
100
100
c. Spreader Capacity: Enter the actual capacity of the spreader given foaming reductions
and reductions made to reduce spilling. Spreader capacity impacts the amount of trips the
spreader or hauling trucks must make to a field to achieve a given manure application
rate. The number of trips the spreader or hauling trucks makes to a field changes the cost
per field. Make sure the spreader capacity is correct for the units and application method
and timing entered.
d. Nutrient Balance Check: The nutrient balance check will allow you to see quickly if the
current combination of manure analysis and application rate, method and timing will
allow you to meet crop requirements as entered in the Crop Requirement section. The
nutrient credits are calculated and highlighted in yellow. The credited nutrients are
calculated based on the manure analysis, application rate, timing, and method. Surplus
nutrients (more nutrient supplied by manure than required by the crop) are displayed in
black. Nutrient deficits (more nutrients required by the crop than supplied by manure) are
displayed in red (Figure 5).
Figure 5: The Nutrient Balance Check table indicates the difference between the N, P2O5 and K2O
required and supplied by manure in red if more nutrients are required than supplied and in black if
more nutrients are supplied than required.
7
Clicking on the buttons shown in figure 6 will automatically balance for N, P2O5 or K2O. The
Application Rate entry will be updated to the level that will balance for the nutrient selected.
Figure 6: These buttons, found on the Fertilizer
Replacement Value sheet, will (1) calculate and
enter the manure application rate equal to the crop
nutrient needs; (2) display an ammonia
conservation graph (Figure 7) and (3) display a
graph comparing nutrients supplied by manure to
crop nutrient requirements (Figure 8).
Manure Application Method and Timing:
Effect on Ammonium-Nitrogen Availability from Manure
100
95
100
90
85
% of Manure Ammonium-N
Utilized by the Crop
80
75
70
65
60
65
55
50
53
45
40
35
41
30
25
29
20
15
17
10
5
0
0
Injected as
Spring
Spring
Spring
Spring
Spring
Topdressed or
sidedress on row incorporated within incorporated within incorporated within incorporated within incorporated within incorporated af ter
crops
1 day
2 days
3 days
4 days
5 days
5 days
Manure Application Method and Timing
Figure 7: A graphical representation of manure application method and ammonium-N conservation.
8
Manure Nutrient Credits and Crop Nutrient Requirements
400
350
Nutrients (lbs/acre)
300
250
200
150
ON future
100
NH4
50
ON current
0
Manure N Supplied Crop N Requirement
Manure P2O5
Supplied
Crop P2O5
Requirement
Manure K2O
Supplied
Crop K2O
Requirement
Figure 8: Graphical representation of manure nutrients delivered to the field compared to crop needs.
Loads to meet requirements:
The number of loads required to meet the application rate for the specified field is calculated and
displayed (Figure 9).
Figure 9: The calculator will display the loads required to
meet the nutrient application scenario entered in Section (4).
Section (5) Manure Nutrient Values
The manure value section shows the nutrient value and fertilizer equivalent dollar value of
various forms of nutrients in manure. The different values correspond to different multi-year
nutrient management techniques.
a. Total Ammonium-N: This is the total amount of ammonium-N potentially available, as
recorded on the manure analysis. In our example:
Total ammonium-N (lbs/acre)
= 62,250 lbs manure/acre*100% conservation*0.09% NH4
= 56 lbs N/acre
9
b. Ammonium-N Lost: The estimated amount of ammonium-N lost with different types of
manure application methods and timing combinations is shown for educational purposes.
This value is not used in any other calculation in the calculator.
In our example, there is a calculated difference between the 100% potential NH4 credit of
100% and the credit associated with the manure application practice entered, “Spring
Incorporated, 1 day”, 65% credit.
Ammonium-N lost (lbs/acre)
= Total ammonium-N – ammonium-N credit
= 20 lbs N/acre
c. Ammonium-N Credit: This value is calculated based on the manure analysis, rate, method
and timing. Applying manure during the growing season and incorporating it increases the
amount of ammonium-N that can be credited and decreases N losses. Ammonium-N
availability coefficients used are listed in Table 2.
Ammonium-N credit (lbs/acre)
= 62,250 lbs manure/acre*65% conservation*0.09% NH4
= 36 lbs N/acre
d. Current Year Organic-N Credit: The availability of Organic-N is based on mineralization
rates that have been calibrated for corn in New York State. The mineralization estimates are
based on the percent dry matter content of different manure sources. Expected availability
percentages of the original manure are listed in Table 1.
Current Year Organic N Credit (lbs/acre) is the portion of the organic N available to the
crop in the application year.
In the example, manure organic N composition is 0.29%.
= 62,250 lbs manure/acre*35% current year mineralization*0.29% organic N in manure
= 63 lbs organic N/acre in current year application
e. Organic-N Credit in Future from Current Application: Nitrogen expected to be released
in future years from the current application are calculated based NYS standard
mineralization rates for corn (Table 1). These values are included in the Max Value and AsApplied Value estimates.
In our example, future organic N from current application:
= 62,250 lbs manure/acre*17% future years mineralization*0.29% organic N in manure
= 31 lbs organic N/acre in future year’s application
f. N Available from Current Application: This value is the sum of ammonium-N credit and
current year organic-N credit, adjusted for losses with various application methods and
timings.
10
In our example:
= Ammonium-N credit + current year organic N credit
= 36.4+63.2 lbs/acre
= 99.6 (displayed as 100 lbs/acre)
g. P2O5 from Current Application: This value is calculated based on manure analysis and
application rate. All of the manure P2O5 is assumed to become available for plant uptake in
the year of application.
In our example, P2O5 (as needed) value:
= 62,250 lbs manure/acre*0.19% P2O5 in manure
= 118.28 lbs P2O5/acre
h. K2O from Current Application: This value is calculated based on manure analysis and
application rate. All of the manure K2O is assumed to become available for plant uptake in
the year of application.
In our example, K2O (as needed) value:
= 62,250 lbs manure/acre * 0.23% K2O in manure
= 143 lbs K2O/acre
i. Total N Value: This is the product of the "N Available from Current Application" and the
N fertilizer value listed in section (2): Fertilizer Costs.
In our example, the N fertilizer value is $ 0.50/lb and the total N (as applied) value:
= $ 0.50*(36.4+63.2)
= $ 49.80/acre, $66.40/load and $ 0.01/gallon
j. Total P2O5 Value: This is the product of the "P2O5 from Current Application" value and the
P2O5 value listed in section (2): Fertilizer Costs.
In our example, the P2O5 fertilizer value is $ 0.60/lb and the total P2O5 (as applied) value:
= $ 0.60 * 118.28
= $ 70.97/acre, $ 94.62/load and $ 0.01/gallon
k. Total K2O Value: This is the product of the "K2O from Current Application" value and the
K2O value listed in section (2): Fertilizer Costs.
In our example, the K2O fertilizer value is $ 0.70/lb and the total K2O (as applied) value:
= $ 0.60*118.28
= $ 100.22/acre, 133.63/load and $0.01/gallon
l. As-Applied Value: "As-Applied Value" is the fertilizer replacement value of manure
discounting N lost through volatilization and excess Ammonium-N applied, while crediting
future organic-N, P2O5 and K2O for current and future crops. This value can be realized
11
through current application methods, credited organic-N mineralization from the manure
and annual soil testing plus the fertilizer application cost that was replaced.
In our example the total as-applied value:
= $ 49.80+$70.97+$100.22+10.00
= $ 230.99 per acre, $ 307.98 per load and $ 0.03 per gallon
m. As Needed Value: "As Needed" is the fertilizer replacement value of manure when only
current crop N, P2O5 and K2O needs are credited (no value is credited to nutrients added
over the crop need). In our example, manure applications meet or exceed all crop nutrients,
so the as needed value is the same as the product of the crop nutrient requirements and the
nutrient value as detailed in Table 3.
Table 3: Example as needed fertilizer replacement value of manure only credits the lesser amount
of the current year crop nutrient requirement or the nutrients supplied by the current year manure
application.
Nutrient
Lesser of
*Value
=Value
Crop requirement
Available from current year
($/lb)
($/acre)
manure
application
(lbs/acre)
(lbs/acre)
N
100
99.6
$0.50
$ 49.80
P2O5
25
118
$0.60
$ 15.00
K2O
20
143
$0.70
$ 14.00
Application
$ 10.00
Total
Per acre
$ 88.80
Per load
$ 118.40
Per gallon
$ 0.01
Section (6): Operating Costs and Fuel Efficiencies
This section allows the user to define variable (fuel, labor) costs associated with different manure
spreading strategies. Note that if application and incorporation are done simultaneously, values
representative of the total spreading-incorporating activity should be entered once in only one of
the provided fields. Both application and incorporation should be filled out only if the two
practices are done at different times (see Figure 10).
12
Figure 10: In this example, manure application and incorporation are done consecutively (not
simultaneously) by separate pieces of equipment and operators; Independent operating speeds and fuel
efficiencies are entered on the Fertilizer Replacement Value sheet, section (6).
a. Fuel Costs: Enter the fuel cost in dollars per gallon for the fuel used for loading, hauling,
application and incorporation. The fuel costs entered on this tab (Fertilizer Replacement
Value) are carried over to the other two calculator sheets.
b. Labor Cost: Enter the hourly wage paid to employees to load, haul, spread and
incorporate manure. The labor costs entered on this tab (Fertilizer Replacement Value)
are carried over to the other two calculator sheets.
c. Time, Fuel Efficiency and Speed: Enter the time taken to load manure into the spreader
in minutes. Enter fuel efficiency for loading, hauling, spreading, and incorporating in
gallons per hour. For hauling, enter speed in miles per hour. For spreading and
incorporation, enter speed in acres per hour.
d. Calculate Application and Incorporation Speed: this button estimates field capacity in
acres/hour for common application and incorporation methods. Enter in the speed (in
miles per hour), the width of the implement being used, and use that to determine the
field efficiency factor (provided at the bottom of the page). The field efficiency factor is
the percentage of the theoretical field work accomplished after deducting for efficiency
losses due to turning, overlap and other minor work stoppages. The field efficiency factor
will depend on the shape of the field, the crop, machinery size, etc.
The field capacity will be calculated as follows:
Field Capacity (acres per hour) =
[width (feet)*speed (miles per hour)*field efficiency (decimal)]/8.25
In this equation, 8.25 is utilized to convert between acres and miles.
Clicking the button shown in figure 11 will take the user to a quick calculator is built into the
Fertilizer Replacement sheet so that users can calculate more accurate application and
incorporation speeds with information that they may have more readily on hand (Figure 12).
Figure 11: Button to take you to the quick calculator for application
and incorporation speed.
13
Figure 12: Quick calculator for
determining
application
and
incorporation speeds.
Section (6): Results: Break-even Hauling Distance
Section 6 displays the value of the manure as a substitute for commercial fertilizer and the
operating cost of hauling, applying and incorporating the manure on the field described in
Section 3. The break-even hauling distance is the maximum one-way distance, in miles, where
costs incurred to haul manure to the specified field match the increase in value (replacement
value of the N, P and K in the manure) and decrease in costs (cost of applying fertilizer).
In this example (Figure 13), hauling manure to the 100-acre field with crop requirements of 100
lbs of N, 25 lbs of P2O5 and 20 lbs of K2O per acre, can be paid for by fertilizer cost savings if
you haul less than or equal to 33.1 miles (as applied) or 8.1 miles (currently needed).
Figure 13: The fertilizer replacement value is equal to the operating cost of manure handling when
manure is hauled 33.1 miles (as-applied value) and 8.1 miles (as-needed value) in this example.
Manure Value: As Applied or As Needed
Commercial fertilizer N, P and K can be blended to meet nutrient requirements. Manure is “prepackaged” with a set nutrient composition. Frequent manure testing is necessary to determine the
manure composition. The value that is placed on manure as a substitute for commercial fertilizer
will depend how you credit the nutrients in the manure compared to the crop nutrient
requirements of the field.
"As-Applied Value" is the fertilizer replacement value of manure discounting N lost through
volatilization and excess N applied; however, all future organic-N and excess P2O5 and K2O are
14
credited for current and future crops. This value can be realized through the use of application
management decisions that credit past manure applications and take into account soil test results
"As Needed" is the fertilizer replacement value of manure when only current crop N, P2O5 and
K2O needs are credited (no value is credited for potential future needs).
These concepts are explained using our example. Using the example data that was entered for
manure analysis, field crop nutrient needs, commercial fertilizer costs and for this example, used
a rate of 7500galons per acre with a method and timing of “Spring Incorporation within 1 day”.
As-Applied Value
The “As-Applied Value” in this example, is calculated:
= 7,500 gallons/acre application rate * 8.3 lbs/gallon density
= 62,250 lbs manure/acre.
We need to know the N value + P2O5 value + K2O value.
a. N value (as applied, $/field):
= Value of ammonium N from current application (as applied, $/field)
+ Value of organic N from current application (as applied, $/field)
+ Value of future organic N from current application (as applied, $/field)
i) Ammonium N from current application (as applied, lbs/acre)
= 62,250 lbs manure/acre*65% conservation*0.09% manure ammonium N
= 36.4 lbs ammonium N/acre
Value of ammonium N from current application (as applied $/field)
= 36.4 ammonium N lbs/acre*$0.50 value of fertilizer N = $18.21/acre*100 acres
= $1,821
ii) Organic N from current application (as applied, lbs/acre)
= 62,250 lbs manure/acre*35% current year mineralization*0.29% manure organic N
= 63.2 lbs organic N/acre in current year application
Value of organic N from current application (as applied $/field)
= 63.2 current year organic N lbs/acre*$0.50 value of fertilizer N
= $31.59/acre*100 acres
= $3,159
iii) Total N value (as applied $/field)
= $1,821 ammonium N
+ $3,159 current year organic N
= $4,980
b. P2O5 (as applied, $/field):
= P2O5 (as applied, lbs/acre)*value of fertilizer P2O5*field size (acres)
15
P2O5 (as applied, lbs/acre)
= 62,250 lbs manure/acre*0.19% manure P2O5
= 118 lbs P2O5/acre
P2O5 value (as applied, $/field)
= 118 lbs P2O5/acre*$0.60 value of fertilizer P2O5
= $ 70.97/acre*100 acres
= $ 7,097
c. K2O (as applied, $/field):
= K2O (as applied, lbs/acre)*value of fertilizer K2O*field size (acres)
= 62,250 lbs manure/acre*0.23% manure K2O
= 143 lbs K2O/acre
K2O (as applied) value (as applied, $/field)
= 143 lbs K2O/acre*$0.70 value of fertilizer K2O
= $ 100.22/acre*100 acres
= $ 10,022
d. Application cost ($/field):
= $ 10.00/acre*100 acres
= $ 1,000
e. Total As-applied Value ($/field):
= $ 4,980 N (as-applied) value
+ $ 7,097 P2O5 (as-applied) value
+ $10,022 K2O (as-applied) value
+ $ 1,000 cost of fertilizer application
= $23,099 total (as-applied) value (see Figure 14)
Figure 14: The as-applied and as-needed manure value is displayed for each nutrient and the foregone
cost of commercial fertilizer application.
As Needed Value
"As Needed" is the fertilizer replacement value of manure when only current crop N, P 2O5 and
K2O needs are credited (no value is credited to nutrients added over the crop need).
The “As Needed” value in this example is calculated:
= 7,500 gallons/acre application rate*8.3 lbs/gallon density
16
= 62,250 lbs manure/acre.
We need to know the N value + P2O5 value + K2O value.
a. N value (as needed, $/field):
= Value of ammonium N from current application (as needed $ /field)
+ Value of organic N from current application (as needed $ /field)
i) Ammonium N from current application (as needed, lbs/acre)
= 62,250 lbs manure/acre*65% ammonium conservation*0.09% NH4-N
= 36.4 lbs NH4-N/acre
Value of ammonium N from current application (as needed, $/field)
= 36.4 NH4-N lbs/acre*$0.50 value of fertilizer N=$18.21/acre*100 acres
= $1,821
ii) Organic N from current application (as needed, lbs/acre)
= 62,250 lbs manure/acre*35% current year mineralization*0.29% organic N
= 63.2 lbs organic N/acre in current year application
Value of organic N from current application (as needed, $/field)
= 63.2 organic N lbs/acre*$0.50 value of fertilizer N=$31.59/acre*100 acres
= $3,159
iii) Total N value (as needed $ /field)
36.4 ammonium N lbs/acre+63.2 organic N lbs/acre
= 99.6 lbs total N/acre
99.6 lbs < 100 lbs needed, so all currently available N is credited
Total N (as needed) value ($/field)
= $1,821 ammonium N
+ $3,159 current year organic N
= $4,980
b. P2O5 value (as needed, $/field):
= P2O5 (as needed, lbs/acre)*value of fertilizer P2O5*field size (acres)
P2O5 (as needed, lbs/acre)
= 62,250 lbs manure/acre*0.19% manure P2O5
= 118 lbs P2O5/acre
P2O5 value (as needed, $/field)
Only 25 lbs/acre P2O5 are need for current crop, therefore:
25 lbs P2O5/acre*$0.60 value of fertilizer P2O5
= $15.00/acre*100 acres
= $ 1,500
17
c. K2O5 value (as needed, $/field):
= K2O (as needed, lbs/acre)*value of fertilizer K2O * field size (acres)
K2O5 (as needed, lbs/acre)
= 62,250 lbs manure/acre*0.23% K2O in manure
= 143 lbs K2O/acre
K2O value (as needed, $/field)
Only 20 lbs/acre K2O are need for current crop, therefore:
20 lbs K2O/acre*$0.70 value of fertilizer K2O
= $14.00/acre*100 acres
= $ 1,400
d. Application cost ($/field):
= $10.00/acre*100 acres
= $1,000
e. Total (as needed) Value ($ /field):
= $ 4,980 N (as needed) value
+ $ 1,500 P2O5 (as needed) value
+ $ 1,400 K2O (as needed) value
+ $ 1,000 cost of fertilizer application
$ 8,880 total (as needed) value
18
Manure Cost
Manure costs are shown in three columns: $/hour, $/acre and $/field (Figure 15).
Figure 15: Section (6) of the Fertilizer Replacement Value sheet details the operating costs associated
with manure application.
a. Loads to the field:
= [(application rate/spreader capacity)*field size]
= (7,500 gallons/10,000 gallons)*100 acres
= 75 loads/field
b. Loading fuel cost ($/hour):
= $ 3.00/gallon*1 gallon/hour (fuel efficiency)
= $ 3.00/hour
c. Loading fuel ($/field):
= [Loading fuel cost ($/hour)*number of loads to the field*(minutes per load/60)]
= $ 3.00*75*(30/60)
= $ 112.50
d. Loading labor cost ($/hour):
= $ 12.00 (entered)
e. Loading labor ($/field):
= [Loading labor cost ($/hour)*number of loads to the field*(minutes per load/60)]
= $ 12.00*75*(30/60)
= $ 450.00
f. Hauling fuel cost ($/hour):
= $ 3.00/gallon*10 gallons/hour (fuel efficiency)
= $ 30.00/hour
19
g. Hauling labor cost ($/hour):
= $ 12.00 (entered)
h. Application fuel cost ($/hour):
= $ 3.00/gallon*7 gallons/hour (fuel efficiency)
= $ 21.00/hour
i. Application fuel cost ($/field):
= [Application fuel cost ($/hour)*[field size (acres)/speed (acres/hour)]
= $ 21.00*[100/3]
= $ 700.00
j. Application labor cost ($/hour):
= $ 12.00 (entered)
k. Application labor ($/field):
= [Application labor cost ($/hour)*[field size (acres)/speed (acres/hour)]
= $ 12.00*[100/3]
= $ 400.00
l. Incorporation fuel cost ($/hour):
= $ 3.00/gallon*10 gallons/hour (fuel efficiency)
= $ 30.00/hour
m. Incorporation fuel cost ($/field):
= [Incorporation fuel cost ($/hour)*[field size (acres) / speed (acres/hour)]
= $ 30.00*[100/2]
= $ 1,500.00
n. Incorporation labor cost ($/hour):
= $ 12.00 (entered)
o. Incorporation labor cost ($/field):
= [Incorporation labor cost ($/hour)*[field size (acres)/speed (acres/hour)]
= $ 12.00*[100/2]
= $ 600.00
Break-even
The break-even hauling distance is the number of miles one way, in which the cost of hauling is
equal to the net manure value (manure value less loading, application and incorporation costs).
a. Break-even hauling distance, as applied ($/mile):
= [(Manure value, as applied – manure operating costs except hauling)/hauling $ per mile/2]
(division by two to calculate one way distance instead of round trip)
20
Manure value, as applied ($/field)
= $ 23,099.00
Manure operating costs except hauling ($/field)
= (loading cost+application cost+incorporation cost)
= $ 562.50+$ 1,100+$ 2,100
= $ 3,762.50/field
Manure value less loading, application and incorporation costs, as applied ($/field)
= $ 23,099.00-$3,762.50
= $ 19,366.00
As applied net manure value per load ($/load)
= $ 19,366.00/75 loads
= $ 258.22/load
Hauling cost per mile ($/mile)
= $ 42 per hour/10 miles per hour
= $4.20/mile
Break-even hauling distance, as applied ($/mile)
= $ 258.22/$4.20 per mile/2
= 30.7 miles
b. Break-even hauling distance, as needed ($/mile):
= [(Manure value, as needed – manure operating costs except hauling)/hauling $ per mile/2]
(division by two to calculate one way distance instead of round trip)
Manure value, as needed ($/field)
= $ 8,880.00
Manure operating costs except hauling ($/field)
= (loading cost+application cost+incorporation cost)
= $ 562.50+$ 1,100+$ 2,100
= $ 3,762.50
Manure value less loading, application and incorporation costs, as needed ($/field)
= $ 8,880.00-$3,762.50
= $ 5,117.50
As needed net manure value /load ($/load)
= $ 5,117.50/75 loads
= $ 68.23
Hauling cost per mile ($/mile)
= $ 42 per hour/10 miles per hour
21
= $ 4.20 per mile
Break-even hauling distance, as needed ($/mile)
= $ 68.23/$ 4.20 per mile/2
= 8.1 miles
c. How much time is required?
This button helps determine the amount of labor and machine time required to haul and apply
manure at the given parameters (rate, speeds and efficiencies, and at the break-even distances,
both as-applied and as-needed). The amount of time required is a good cross-check in the realworld feasibility of the manure application strategies represented by the data entered above
(Figure 16).
Figure 16: The “How much time is required?” button.
Figure 17: Display of the time needed to apply manure according to the parameters entered into the
calculator.
22
3. What are the operating and ownership costs for my manure
machinery?
Whole Farm Manure Cost Sheet
In this section white cells (boxes) are open for data entry and yellow cells (boxes) are calculated
values. The yellow cells present results based on data entered into white cells. Yellow cells are
locked and cannot be manipulated.
Section (1): Farm Manure Use
Figure 19 is a screen shot of sections (1) and (2) of the Whole Farm Manure Cost sheet.
Figure 18: Annual whole farm manure management information including the total amount of manure
spread, the total annual manure acres and the total hours required are entered into sections (1) and (2)
of the Whole Farm Manure Cost sheet.
a. Units: Two choices (tons or gallons) are presented and they must be selected from the
pull down menu. Place the cursor in the data entry box and then click the down-pointing
arrow that appears on the right; a list will be pulled down and unit selection can be made.
b. Total Manure to Spread: enter the total tons or gallons of manure to be spread over all
acres owned, rented and exported manure acres for one year.
c. Average Application Rate (acres/hour): this is a calculated value based on entered total
manure to spread (1a) divided by the entered Total Manure Acres (2a).
Section (2): Manure Spreading
a. Total Manured Acres: enter the total number of acres (owned, rented and exported) that
will receive manure during a one year period.
b. Total Hours to Spread: enter the total hours required to spread manure, based on farm
records.
c. Average Rate (acre/hr): this value is calculated by dividing the manured acres by the
hours required (2a/2b above).
d. Fuel Efficiency (gal/hour): this value is taken from Section (5) of the Fertilizer
Replacement Value sheet.
e. Fuel ($/hr): the total fuel cost ($/hr) is calculated by multiplying the Fuel Efficiency by
the Fuel Cost input from Section (5) of the Fertilizer Replacement Value sheet.
23
f. Labor ($/hr): this value is taken from the Fertilizer Replacement Value sheet outlined
above, in Section (5).
g. Total Costs ($/hr): the sum of the Fuel and Labor costs above (2e + 2f).
h. Average per acre spread cost ($/acre): this value is calculated from the various costs,
acreage, and efficiency. The formula is:
=[(Total manured spreading costs*Total hours to spread)/Total manured acres]
Section (3): Manure Incorporation (if operated separately from manure spreading)
Figure 20 is a screen shot of sections (3) and (4) of the Whole Farm Manure Cost sheet.
Figure 19: Annual whole farm manure management information including the total number of acres
with manure incorporation, total machinery hours needed for incorporation and total hours needed for
manure hauling are entered into sections (3) and (4) of the Whole Farm Manure Cost sheet.
a. Total Incorporated Acres: enter the total number of acres on which manure will be
incorporated. Only use this section if the incorporation is done separately from the
manure application.
b. Total Machinery Hours: enter in the total hours logged on spreading machinery.
c. Fuel Efficiency (gallons/hour): this value was entered in Section (5) of the Fertilizer
Replacement Value sheet.
d. Average Rate (acres/hour): this value is calculated by dividing the incorporated acres
by the hours required (3a/3b above).
e. Fuel ($/hr): the total fuel cost ($/hour) is calculated by multiplying fuel cost ($/gal) and
fuel efficiency (gallons/hour) entered in Section (5) of the Fertilizer Replacement Value.
f. Labor ($/hr): the total labor cost ($/hour) was entered in Section (5) of the Fertilizer
Replacement Value sheet.
g. Total Costs ($/hour): the sum of the fuel and labor costs above (3e + 3f).
h. Average per Acre Incorporated Cost ($/acre): this value is Total Costs (3g) divided by
the average rate (3d).
Section (4): Manure Hauling
a. Total Hauling Machinery Hours: enter the total hours logged on hauling machinery
during one year.
b. Fuel Efficiency (gallons/hour): this value is taken from Section (5) of the Fertilizer
Replacement Value sheet.
c. Fuel ($/hour): the total fuel cost ($/acre) is calculated by multiplying the Fuel Efficiency
by the Fuel Cost input from the Fertilizer Replacement Value sheet, in Section (5).
24
d. Labor ($/hour): this value is taken from the Fertilizer Replacement Value sheet outlined
above, in Section (5).
e. Total ($/hour): the sum of the Fuel and Labor costs above (4c + 4d).
f. Average per mile costs ($/mile): this value is calculated by dividing the Total costs (4e
above) by the average speed (miles per hour) entered in Section (5) of the Fertilizer
Replacement Value sheet.
Section (5): Capital Costs
Figure 21 is a screen shot of the Whole Farm Manure Cost sheet: Capital Costs entry, section 5.
Figure 20: Information entered into section (5), including a list of equipment used for manure
management, cost, salvage value, and age information is used to calculate machinery ownership cost
such as depreciation, interest on equity, and insurance costs.
a. Equipment Name: enter in the name of each piece of equipment.
b. Percent of Time Used for Manure Handling (%): enter in the percent of time (as a
whole number) that each piece of equipment is used for handling manure. For instance, in
the figure above, the spreader is only used for manure handling – so 100% is entered. The
tractor is likely to be used for other jobs, so only 40% of the time might be involved in
manure handling.
c. Purchase Cost ($): enter in the price paid for each piece of equipment.
d. Salvage Value ($): enter in the expected value of the equipment at the end of the entered
Equipment Lifespan (yrs).
e. Equipment Lifespan (years): enter in the expected useful lifespan of each piece of
equipment.
f. Age of Equipment (yrs): enter the current age in years of the equipment. Note that the
age must be less than the equipment lifespan.
g. Repairs and Maintenance Per Year ($): enter the average cost spent on non-fuel
maintenance and repairs of each piece of equipment.
h. Cost of Capital (%): the cost of capital is the annual rate of return expected on an
alternative investment with a similar risk.
i. Equipment Insurance Cost per $1000 ($): enter the cost of insurance (in $) per $1000
value of equipment insured.
25
j. Manure Equipment Amount Insured ($): enter the value (in $) of the manure
equipment that is insured. This will be used to calculate insurance expenses, based on the
value entered in (5i) above.
k. Add More Equipment button: If you run out of room and have more equipment to
enter, click the “Add more equipment” button below the chart, or scroll down below the
output area. You will find another similar chart where you can enter additional
information.
Output Values and Tools
There are several buttons found below the input chart.
Add more equipment: takes you to another chart below the report, similar in structure to
the equipment chart filled out above.
Print Sheet: generates a command to print the entire sheet.
Return to Main Menu: takes the user back to the starting page.
The chart shown in figure 22 summarizes the annual farm operating and ownership costs
associated with the entered fuel and labor prices and efficiencies, repairs, and the ownership
costs of the machinery complement.
Figure 21: Whole farm manure cost output details operating and ownership costs for manure
management on an annual whole farm, per acre spread and per gallon (or ton) applied basis.
Costs are displayed on a whole-farm basis, cost per acre, and the cost per gallon or ton. Whole
farm costs are detailed below using the example above to illustrate the calculations. The cost per
26
acre is the whole farm cost divided by the annual number of manure acres entered into the Whole
Farm Manure Costs Sheet (2a). The cost per gallon is the whole farm cost divided by the annual
quantity of manure handled entered into the Whole Farm Manure Cost Sheet (1b).
Loading machinery hours:
= [(total manure/spreader capacity)*(load time/60)
= [(1,500,000 gal/10,000 gallons)*(30/60)]
= 75 hours
a. Loading fuel ($)
= [loading machinery hours*loading fuel efficiency*loading fuel cost]
= [(75)*1 gal per hour*$3.00 per gallon]
= $ 225.00
b. Loading labor ($)
= [loading machinery hours*loading labor cost]
= [(75)*$12.00 per hour]
= $ 900.00
c. Hauling machinery hours: entered number of annual hauling machinery hours (4a)
= 70 hours
d. Hauling fuel ($):
= [hauling machinery hours*hauling fuel cost ($ per hour)]
= [70 hours*$30.00 per hour]
= $ 2,100.00
e. Hauling labor ($):
= [hauling machinery hours*hauling labor cost]
= [70 hours*$12.00 per hour]
= $ 840.00
f. Spreading acres: entered number of acres receiving manure (2a)
= 250 acres
g. Spreading fuel ($):
= [total hours to spread (entered 2b)*spreading fuel cost ($ per hour)]
= [30 hours*$21.00 per hour]
= $ 630.00
h. Spreading labor($):
= [total hours to spread (entered 2b)*spreading labor cost ($ per hour)]
= [30 hours*$12.00 per hour]
= $ 360.00
i. Incorporation acres: entered number of acres manure incorporation (2a)
= 0 acres
j. Incorporation fuel:
= [(Incorporation acres/average incorporation rate)*incorporation fuel cost ($ per hour)]
= [(0 acres/2 acres per hour)*$30.00 per hour]
= $0.00
k. Incorporation labor:
= [(Incorporation acres/average incorporation rate)*incorporation labor cost ($ per hour)]
= [(0 acres/2 acres per hour)*$12.00 per hour]
= $ 0.00
27
l. Manure Equipment Repairs and Maintenance: sum of all manure machinery annual
repairs and maintenance (entered 5 g)*percent of time used for manure handling (5b).
= [($2,500 (spreader)*1.00)+($1,000*0.45)]
= $ 2,950
m. Depreciation: Depreciation is a method to to spread the cost of an asset over the useful
life of the asset.
Depreciation
= [((purchase cost–salvage value)/lifespan)*percent of time used for manure handling]
Spreader depreciation:
= [(($35,000-$5,000)/10)*1.0]
= $ 3,000
Tractor depreciation:
= [(($65,000-$10,000)/12)*0.45]
= $ 2,063
Farm depreciation:
= spreader depreciation+tractor depreciation
= $ 5,063
n. Interest on Equity: Interest is charged on the asset equity (un-depreciated value) to
account for the opportunity cost of investing in the manure equipment instead of an
alternative investment.
= [(un-depreciated value*cost of capital)*percent of time used for manure handling]
Un-depreciated value:
= [(purchase cost–salvage value)–(((purchase cost–salvage value)/lifespan)*age)]
Spreader un-depreciated value:
= [(($35,000-$5,000)-((($35,000-$5,000)/10)*4)]
= $ 18,000
Spreader interest on equity
= [($18,000 *0.06) * 1]
= $ 1,080
Tractor un-depreciated value:
= [(($65,000-$10,000)-((($65,000-$10,000)/12)*2)]
= $ 45,833
Tractor interest on equity
= [($45,833*0.06)*0.45]
28
= $ 1,238
Farm depreciation:
= spreader depreciation+tractor depreciation
= $ 2,318
o. Insurance: Total annual insurance charge is calculated from values entered in section
5i and 5j.
= [Equipment insurance cost per $1000*(manure equipment amount insured/1000)].
= [$6.00*(75,000/1000)]
= $ 450.00
29
4. What is the value (fertilizer replacement) and cost of
exporting manure?
Export Sheet
In this section white cells (boxes) are open for data entry and yellow cells (boxes) are calculated
values. The yellow cells present results based on data entered into white cells. Yellow cells are
locked and cannot be manipulated.
Section (1): Characterize Exports
Figure 23 is a screen shot of the Export sheet: Characterize Exports entry, section 1.
Figure 22: Information entered into section (1), includes the export field manure application rate
(gallons/acre or tons/acre) and the distance in miles from the manure source to the export field.
a. Application Rate: enter the rate at which you will apply exported manure. The units
(gallons/acre or tons/acre) are based on your selection in Section (4) on the Fertilizer
Replacement Value sheet.
b. Distance one way from source: enter the distance (in miles) that you would travel one
way to ship manure.
c. “Print Sheet” button allows you to print the entire page for your records.
Section (2): Value of manure to the field receiving manure (fertilizer replacement value)
Figure 24 is a screen shot of the Export sheet: Value of manure to the field receiving manure
(fertilizer replacement value), section 2.
Figure 23: The export field’s crop nutrient requirements are entered in the Export sheet, section (2).
The fertilizer replacement value, as applied and as needed, are also shown in this section.
a. Crop Needs (lbs/acre): enter the crop requirements in lbs/acre for N, P2O5, and K2O.
30
b. Output Values: the sheet calculates the value of the manure as fertilizer material, based
on nutrient inputs and values from Sections (1) and (2) of the Fertilizer Replacement
Value sheet, and the acreage and rate parameters on this sheet. N, P2O5, and K2O are
given in terms of the total amount applied, and the value per unit (ton or gallon) and per
acre. The Fert. Application value is the one entered in Section (2) of the Fertilizer
Replacement Value sheet. As Needed values are also reported.
Section (3): Cost of transporting and spreading manure to the receiving field (operating and
ownership costs)
Figure 25 is a screen shot of the Export sheet: Cost of transporting and spreading manure to the
receiving field (operating and ownership costs), section (3).
Figure 24: The operating and ownership costs and machinery hours associated with manure
applications to the export field are detailed by load, per unit and per acre in the Export sheet, section
(3).
These values are all calculated from the inputs above and on other sheets. The average speed and
application rates and efficiencies are used to generate the Machine hours/load, the expense per
load, gallon or ton, and acre.
a. Operating Costs: calculates costs associated with hauling, applying, and incorporating
manure, using values given on the Fertilizer Replacement Value and Whole Farm
Manure Costs sheets. Costs are reported by load, per unit (ton or gallon), and per acre.
b. Total Operating Costs: sums the calculated Operating Costs.
c. Ownership Costs: calculates the cost of owning machinery for the above operations,
based on inputs on the Whole Farm Manure Costs sheet.
d. Operating + Ownership Costs: the sum of the Total Operating and Ownership Costs (c
+ d above).
Section (4): Net Income or Cost of Manure Export
Figure 26 is a screen shot of the Export sheet: Net Income or Cost of Manure Export, section (4).
31
Figure 25: The return to operating costs and return to operating and ownership costs associated with
manure applications to the export field are shown for applications valued as applied and applications
values as needed per unit and per acre in the Export sheet, section (4).
This section summarizes the above information to generate a net profit or loss statement for the
export of manure. Net values are reported for both the As Applied and As Needed bases, and
expressed in terms of $/unit (ton or gallon) and $/acre. Remember that the As Applied value
takes into account all the nutrients put onto the land, while the As Needed value only considers
the nutrients actually required by the crop that year.
a. Return to Operating Costs: subtracts the cost of equipment operation (Section (3)) from
the value of manure (from Section (2)).
b. Return to Ownership and Operating Costs: subtracts the cost of equipment operation
and ownership (from Section (3)) from the value of manure (Section (2)).
32
5. How much time (machinery and labor) will it take to spread
manure?
Time Sheet
Figure 27 is a screen shot of the Manure Application Time Management sheet.
Figure 26: In Time sheet, manure applications are broken down into blocks of fields with similar
time, machinery and labor requirements. These blocks appear as rows on this sheet. Machinery, labor
and clock hours are calculated for each management block.
In this section white cells (boxes) are open for data entry and yellow cells (boxes) are calculated
values. The yellow cells present results based on data entered into white cells. Yellow cells are
locked and cannot be manipulated. In this sheet, the total amount of time (clock hours) needed to
complete manure handling as well as hours of hired labor and equipment hours required are
calculated. In this area, you can experiment with different numbers of trucks and times to
determine work-flow bottlenecks. The user breaks all farm manure handling tasks into blocks of
time that are similar in time and machinery/labor requirements. In the screen shown in Figure 28,
a producer using a drag hose and frac tank system considers farm applications in two rows:
500 loads are applied with 3 trucks hauling to the frac tank with a ½ hour round trip time
(including loading) and 1 tractor simultaneously spreading the manure from the tank.
The second row has the same number of loads, same machinery and labor complement
but requires a 1 hour round trip time.
33
Figure 27: Entries to the Time sheet depict 500 loads with a one half hour round trip time requirement
and 500 loads requiring a one hour round trip time requirement illustrate how the Time sheet can be
used to consider the total labor, machinery and time resulting from alternative manure management
schemes.
a. Loads: enter in the number of loads of manure hauled or applied.
b. Hauling Equipment Number and Application Equipment Number: enter in the
number of pieces of machinery working at once – for instance if two tractors equipped
with spreaders were working on one day, enter in “2” for “Application Equipment
Number.”
c. Hauling round trip time (hours): enter in the hours spent for each piece of equipment.
However, if (for instance) hauling and spreading were both done in one trip by the same
piece of equipment; enter the total time under ONE of the headings, but not both.
d. Application speed (loads/hr): enter in the number of loads spread per hour.
e. Hauling machinery hours and Spreading machinery hours: the calculated hours spent
on hauling or spreading; Number of Loads divided by the Application Speed. In the
example, first line:
Hauling machinery hours:
= 500 loads * ½ hour/load
= 250
However since the 3 machines are working at the same time and each piece hauls about
166 loads, the clock time is 83 hours (166 * ½ hr).
Spreading machinery hours:
= 500 loads/10 loads per hour
= 50 hours
f. Hauling clock hours and Spreading clock hours: the calculated hours required per
laborer running the equipment; calculated as Hauling or Spreading machinery hours
divided by the Hauling or Application Equipment Number.
34
g. Total clock hours: the larger of the Hauling or Spreading clock hours. In our example,
since the application equipment and hauling equipment are working at the same time, the
one with the great time requirement will be the value used to calculate the total clock
hours.
h. Total labor hours: the Total clock hours times the number of people required to run the
machinery (the sum of the Application and Spreading Equipment Numbers).
In the example, there are 4 employees each working 83.3 hours:
= [4*83.3]
= 333 hours
i. Totals: the manure loads, machinery hours, and clock hours are totaled.
35