1
Report Elements
Bar
A bar chart displays series as set of horizontal bars that are grouped by category. The categories are
arranged horizontally and the values vertically . Bar charts are used to compare value over categories
and are ideal for showing the variations in the value of an item over time, or for showing the values
of several items at a single point in time.
The Bar chart types include Bar, Bar Chart 3D, Bar Stacked Chart and Bar Stacked Percentage. The
3D Bars are used to display data in 3D format which is convenient for visually comparing the Bars.
This is used for making comparisons between groups of data particularly when you want to compare
one period of time to another(You can use Bar graph to compare sales per quarter).
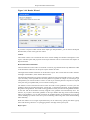
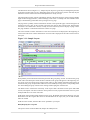
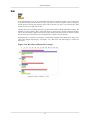
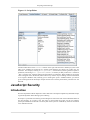
From Repertoire 7.6 onwards, sub-category is supported for both Bar and Column charts. Figure 4.18,
“Bar Chart without Sub-Category” and Figure 4.19, “Bar Chart with Sub-Category” explains for
themselves.
Figure 4.18. Bar Chart without Sub-Category
55