1
DIAdem
TM
Getting Started with DIAdem
Getting Started with DIAdem
May 2008
373422F-01
Support
Worldwide Technical Support and Product Information
ni.com
National Instruments Corporate Headquarters
11500 North Mopac Expressway
Austin, Texas 78759-3504
USA Tel: 512 683 0100
Worldwide Offices
Australia 1800 300 800, Austria 43 662 457990-0, Belgium 32 (0) 2 757 0020, Brazil 55 11 3262 3599,
Canada 800 433 3488, China 86 21 5050 9800, Czech Republic 420 224 235 774, Denmark 45 45 76 26 00,
Finland 358 (0) 9 725 72511, France 01 57 66 24 24, Germany 49 89 7413130, India 91 80 41190000,
Israel 972 3 6393737, Italy 39 02 41309277, Japan 0120-527196, Korea 82 02 3451 3400,
Lebanon 961 (0) 1 33 28 28, Malaysia 1800 887710, Mexico 01 800 010 0793, Netherlands 31 (0) 348 433 466,
New Zealand 0800 553 322, Norway 47 (0) 66 90 76 60, Poland 48 22 3390150, Portugal 351 210 311 210,
Russia 7 495 783 6851, Singapore 1800 226 5886, Slovenia 386 3 425 42 00, South Africa 27 0 11 805 8197,
Spain 34 91 640 0085, Sweden 46 (0) 8 587 895 00, Switzerland 41 56 2005151, Taiwan 886 02 2377 2222,
Thailand 662 278 6777, Turkey 90 212 279 3031, United Kingdom 44 (0) 1635 523545
For further support information, refer to the Technical Support and Professional Services appendix. To comment
on National Instruments documentation, refer to the National Instruments Web site at ni.com/info and enter
the info code feedback.
© 2003–2008 National Instruments Ireland Resources Limited. All rights reserved.
Important Information
Warranty
The media on which you receive National Instruments software are warranted not to fail to execute programming instructions, due to defects
in materials and workmanship, for a period of 90 days from date of shipment, as evidenced by receipts or other documentation. National
Instruments will, at its option, repair or replace software media that do not execute programming instructions if National Instruments receives
notice of such defects during the warranty period. National Instruments does not warrant that the operation of the software shall be
uninterrupted or error free.
A Return Material Authorization (RMA) number must be obtained from the factory and clearly marked on the outside of the package before
any equipment will be accepted for warranty work. National Instruments will pay the shipping costs of returning to the owner parts which are
covered by warranty.
National Instruments believes that the information in this document is accurate. The document has been carefully reviewed for technical
accuracy. In the event that technical or typographical errors exist, National Instruments reserves the right to make changes to subsequent
editions of this document without prior notice to holders of this edition. The reader should consult National Instruments if errors are suspected.
In no event shall National Instruments be liable for any damages arising out of or related to this document or the information contained in it.
EXCEPT AS SPECIFIED HEREIN, NATIONAL INSTRUMENTS MAKES NO WARRANTIES, EXPRESS OR IMPLIED, AND SPECIFICALLY DISCLAIMS ANY WARRANTY OF
MERCHANTABILITY OR FITNESS FOR A PARTICULAR PURPOSE. CUSTOMER’S RIGHT TO RECOVER DAMAGES CAUSED BY FAULT OR NEGLIGENCE ON THE PART OF
NATIONAL INSTRUMENTS SHALL BE LIMITED TO THE AMOUNT THERETOFORE PAID BY THE CUSTOMER. NATIONAL INSTRUMENTS WILL NOT BE LIABLE FOR
DAMAGES RESULTING FROM LOSS OF DATA, PROFITS, USE OF PRODUCTS, OR INCIDENTAL OR CONSEQUENTIAL DAMAGES, EVEN IF ADVISED OF THE POSSIBILITY
THEREOF. This limitation of the liability of National Instruments will apply regardless of the form of action, whether in contract or tort, including
negligence. Any action against National Instruments must be brought within one year after the cause of action accrues. National Instruments
shall not be liable for any delay in performance due to causes beyond its reasonable control. The warranty provided herein does not cover
damages, defects, malfunctions, or service failures caused by owner’s failure to follow the National Instruments installation, operation, or
maintenance instructions; owner’s modification of the product; owner’s abuse, misuse, or negligent acts; and power failure or surges, fire,
flood, accident, actions of third parties, or other events outside reasonable control.
Copyright
Under the copyright laws, this publication may not be reproduced or transmitted in any form, electronic or mechanical, including photocopying,
recording, storing in an information retrieval system, or translating, in whole or in part, without the prior written consent of National
Instruments Corporation.
The DataFinder component in this product includes CLucene software which use is governed by the Apache License, Version 2.0.
This software includes Stingray software developed by the Rogue Wave Software division of Quovadx, Inc.
Copyright © 1995–2006, Quovadx, Inc. All rights reserved.
The following notices relate to certain components used in USI (Xerces C++, ICU, HDF5, Citadel 5, b64 library and Stingray). For a listing of
conditions and disclaimers regarding these components, refer to the USICopyrights.chm.
Xerces C++. This product includes software developed by the Apache Software Foundation (http://www.apache.org/).
Copyright 1999 The Apache Software Foundation. All rights reserved.
ICU. Copyright 1995–2003 International Business Machines Corporation and others. All rights reserved.
HDF5. NCSA HDF5 (Hierarchical Data Format 5) Software Library and Utilities
Copyright 1998, 1999, 2000, 2001, 2003, by the Board of Trustees of the University of Illinois. All rights reserved.
Citadel 5. In regards to components that use Citadel 5, the following copyright applies. Copyright © 1994 Hewlett-Packard Company.
b64 library. Copyright (c) 2004–2006, Matthew Wilson and Synesis Software. All Rights Reserved.
Stingray. This software includes Stingray software developed by the Rogue Wave Software division of Quovadx, Inc.
Copyright 1995–2006, Quovadx, Inc. All Rights Reserved.
National Instruments respects the intellectual property of others, and we ask our users to do the same. NI software is protected by copyright and other
intellectual property laws. Where NI software may be used to reproduce software or other materials belonging to others, you may use NI software only
to reproduce materials that you may reproduce in accordance with the terms of any applicable license or other legal restriction.
Trademarks
National Instruments, NI, ni.com, LabVIEW, and DIAdem are trademarks of National Instruments Corporation. Refer to the Terms of Use
section on ni.com/legal for more information about National Instruments trademarks.
Other product and company names mentioned herein are trademarks or trade names of their respective companies.
Members of the National Instruments Alliance Partner Program are business entities independent from National Instruments and have no
agency, partnership, or joint-venture relationship with National Instruments.
Patents
For patents covering National Instruments products, refer to the appropriate location: Help»Patents in your software, the patents.txt file
on your media, or ni.com/patents.
WARNING REGARDING USE OF NATIONAL INSTRUMENTS PRODUCTS
(1) NATIONAL INSTRUMENTS PRODUCTS ARE NOT DESIGNED WITH COMPONENTS AND TESTING FOR A LEVEL OF
RELIABILITY SUITABLE FOR USE IN OR IN CONNECTION WITH SURGICAL IMPLANTS OR AS CRITICAL COMPONENTS IN
ANY LIFE SUPPORT SYSTEMS WHOSE FAILURE TO PERFORM CAN REASONABLY BE EXPECTED TO CAUSE SIGNIFICANT
INJURY TO A HUMAN.
(2) IN ANY APPLICATION, INCLUDING THE ABOVE, RELIABILITY OF OPERATION OF THE SOFTWARE PRODUCTS CAN BE
IMPAIRED BY ADVERSE FACTORS, INCLUDING BUT NOT LIMITED TO FLUCTUATIONS IN ELECTRICAL POWER SUPPLY,
COMPUTER HARDWARE MALFUNCTIONS, COMPUTER OPERATING SYSTEM SOFTWARE FITNESS, FITNESS OF COMPILERS
AND DEVELOPMENT SOFTWARE USED TO DEVELOP AN APPLICATION, INSTALLATION ERRORS, SOFTWARE AND
HARDWARE COMPATIBILITY PROBLEMS, MALFUNCTIONS OR FAILURES OF ELECTRONIC MONITORING OR CONTROL
DEVICES, TRANSIENT FAILURES OF ELECTRONIC SYSTEMS (HARDWARE AND/OR SOFTWARE), UNANTICIPATED USES OR
MISUSES, OR ERRORS ON THE PART OF THE USER OR APPLICATIONS DESIGNER (ADVERSE FACTORS SUCH AS THESE ARE
HEREAFTER COLLECTIVELY TERMED “SYSTEM FAILURES”). ANY APPLICATION WHERE A SYSTEM FAILURE WOULD
CREATE A RISK OF HARM TO PROPERTY OR PERSONS (INCLUDING THE RISK OF BODILY INJURY AND DEATH) SHOULD
NOT BE RELIANT SOLELY UPON ONE FORM OF ELECTRONIC SYSTEM DUE TO THE RISK OF SYSTEM FAILURE. TO AVOID
DAMAGE, INJURY, OR DEATH, THE USER OR APPLICATION DESIGNER MUST TAKE REASONABLY PRUDENT STEPS TO
PROTECT AGAINST SYSTEM FAILURES, INCLUDING BUT NOT LIMITED TO BACK-UP OR SHUT DOWN MECHANISMS.
BECAUSE EACH END-USER SYSTEM IS CUSTOMIZED AND DIFFERS FROM NATIONAL INSTRUMENTS' TESTING
PLATFORMS AND BECAUSE A USER OR APPLICATION DESIGNER MAY USE NATIONAL INSTRUMENTS PRODUCTS IN
COMBINATION WITH OTHER PRODUCTS IN A MANNER NOT EVALUATED OR CONTEMPLATED BY NATIONAL
INSTRUMENTS, THE USER OR APPLICATION DESIGNER IS ULTIMATELY RESPONSIBLE FOR VERIFYING AND VALIDATING
THE SUITABILITY OF NATIONAL INSTRUMENTS PRODUCTS WHENEVER NATIONAL INSTRUMENTS PRODUCTS ARE
INCORPORATED IN A SYSTEM OR APPLICATION, INCLUDING, WITHOUT LIMITATION, THE APPROPRIATE DESIGN,
PROCESS AND SAFETY LEVEL OF SUCH SYSTEM OR APPLICATION.
Contents
About This Manual
Conventions ...................................................................................................................vii
Related Documentation..................................................................................................viii
Chapter 1
Introduction to DIAdem
Using the Introduction Screen .......................................................................................1-3
Finding Examples ..........................................................................................................1-4
Summary ........................................................................................................................1-5
Chapter 2
Finding Data
Mining Data ...................................................................................................................2-1
Running a Quick Search..................................................................................2-1
Running an Advanced Search .........................................................................2-2
Browsing in Data Sets....................................................................................................2-4
Loading and Managing Data..........................................................................................2-5
Saving Data .....................................................................................................2-6
Summary ........................................................................................................................2-7
Chapter 3
Viewing and Evaluating Data
Viewing Curves .............................................................................................................3-1
Zooming Curve Sections .................................................................................3-2
Editing Curves ...............................................................................................................3-3
Measuring Curves............................................................................................3-3
Copying Curve Sections ..................................................................................3-3
Editing Data in Channel Tables .....................................................................................3-5
Summary ........................................................................................................................3-7
Chapter 4
Analyzing Data with Mathematical Functions
Using Standard Mathematical Functions .......................................................................4-1
Channel Values Summation ............................................................................4-2
Averaging Channels ........................................................................................4-3
Calculating with the Units Catalog ................................................................................4-4
Calculating Formulas with the Calculator .....................................................................4-6
Summary ........................................................................................................................4-7
© National Instruments Ireland Resources Limited
v
Getting Started with DIAdem
Contents
Chapter 5
Creating Reports
Creating Axis Systems .................................................................................................. 5-1
Editing Axis Systems ...................................................................................... 5-3
Graphics and Lines ........................................................................................................ 5-4
Using Text and Variables as Labels .............................................................................. 5-5
Adding and Formatting Channel Properties.................................................... 5-5
Summary........................................................................................................................ 5-7
Chapter 6
Automating Sequences
Creating Scripts ............................................................................................................. 6-1
Editing Scripts ............................................................................................................... 6-4
Testing Scripts ............................................................................................................... 6-5
Summary........................................................................................................................ 6-7
Appendix A
Technical Support and Professional Services
Getting Started with DIAdem
vi
ni.com
About This Manual
You can use this manual to familiarize yourself with DIAdem features and
how to use them. Each chapter describes a DIAdem panel.
This manual contains exercises for finding, analyzing, and presenting data,
and for automating functions to process your data. The exercises do not
take long, and they make it easier for you to get started with DIAdem. Each
chapter concludes with a summary of the main points.
Conventions
The following conventions are used in this manual:
<>
Angle brackets indicate a key you press to perform a function, for example,
<Ctrl> for the control key.
»
The » symbol leads you through nested menu items and dialog box options
to a final action. The settings Help»Examples instruct you to open the
Help menu and select the menu item Examples. DIAdem opens the
ExampleFinder, where you can run examples for various DIAdem
functions.
This icon denotes a tip, which alerts you to advisory information.
This icon denotes a note, which alerts you to important information.
bold
Bold text denotes items that you must select or click in DIAdem, such as
menu items and dialog box options. Parameters are also in bold type.
italic
Italic text denotes variables, emphasis, cross-references, or an introduction
to important concepts.
monospace
Text in this font denotes text or characters that you should enter from the
keyboard, such as sections of code, programming examples, and syntax
examples. This font is also used for the proper names of disk drives, paths,
folders, programs, subprograms, subroutines, device names, functions,
operations, commands, variables, controls, events, methods, filenames and
extensions, and code excerpts.
© National Instruments Ireland Resources Limited
vii
Getting Started with DIAdem
About This Manual
Related Documentation
For more information on DIAdem, refer to the following documentation:
•
DIAdem: Data Mining, Analysis, and Report Generation
This DIAdem manual explains the structure of DIAdem and how to
use DIAdem to mine data, to run analyses, to create reports, and to
combine all functions in a script.
•
DIAdem Help, which you open via Help»Contents, or <F1>.
The DIAdem help offers you procedures and dialog box help for each
panel, as well as references to functions, commands, and variables for
programmers.
•
DataFinder Server Edition: Search Engine for Technical Data
This manual describes how you use the DataFinder server to index data
files in networks. Users connect DIAdem with a DataFinder server to
search for the indexed data.
Getting Started with DIAdem
viii
ni.com
Introduction to DIAdem
1
DIAdem is the interactive National Instruments software for finding and
managing technical data, for mathematically and graphically-interactively
analyzing data, and for presenting the data in reports. In a uniform
environment, DIAdem offers a unique combination of tools that are
tailored to the requirements of technicians, engineers, and scientists. You
can adjust all the tools to your tasks and automate them in scripts, thereby
drastically reducing evaluation times.
The DIAdem DataFinder enables you to find test data quickly and easily,
and to identify correlations in the data. To use the DataFinder you do not
require a database or support from the IT-department because the
DataFinder is ready for use directly after installation. You use the Chart
Wizard to create and to modify your diagrams quickly and easily. You use
video synchronization to evaluate videos and the respective measurement
data and 3D models to project data onto the test object.
You have received DIAdem 11 on a DVD. If your computer does not have a DVD
drive, you can download DIAdem 11 at ni.com or obtain a CD with DIAdem 11 from our
support.
Note
DIAdem groups functions in panels and function groups. Use the panel bar
that is on the left of the DIAdem screen to switch panels. Each panel offers
powerful tools that you use for the following tasks:
•
Use DIAdem NAVIGATOR to find, to load, and to manage data. Use
the DataFinder to search for data on your computer and in the network,
and to navigate through the found data files and databases. You load
the data into the Data Portal so that all DIAdem panels can work with
the data, which is organized in channels.
•
Use DIAdem VIEW to view, to analyze, and to edit data as curves in
axis systems. In channel tables you can edit and delete the data and
enter new data. You synchronize videos with data and project data onto
3D models.
•
Use DIAdem ANALYSIS to analyze data mathematically. If you want
to use mathematical standard functions, you select the input data and
the settings. Use the Calculator to calculate your own formulas.
© National Instruments Ireland Resources Limited
1-1
Getting Started with DIAdem
Chapter 1
Introduction to DIAdem
•
Use DIAdem REPORT to document data and to present results in a
report. In 2D and 3D axis systems you display your data as curves, as
bar diagrams, and as surfaces and in 2D and 3D tables you list channel
contents. Use comments and text to label your report and graphics to
illustrate your report.
•
Use DIAdem SCRIPT to automate tasks. A script combines several
work steps for recurring sequences such as standard calculations and
serial evaluations. A script can use functions from all DIAdem panels.
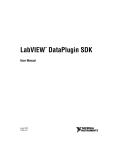
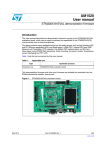
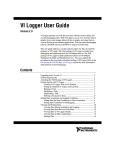
When you select a panel, DIAdem changes the user interface so that you
can quickly find the functions you want. Each DIAdem panel has its own
group bar to the right of the panel bar as shown in Figure 1-1. Open a group
bar, click a function group, and select a function. The workspace also
changes with the DIAdem panel and displays a folder hierarchy or a
worksheet. The toolbars and the shortcut menus contain frequently used
functions. DIAdem also adjusts the toolbars and the shortcut menus to the
selected panel.
5
1
2
6
3
4
7
8
1
2
3
4
Panel bar
Group bar
Function group
Tooltip for the selected function
5
6
7
8
DIAdem VIEW toolbar
Data Portal
DIAdem VIEW workspace
Status bar
Figure 1-1. DIAdem User Interface
Getting Started with DIAdem
1-2
ni.com
Chapter 1
Introduction to DIAdem
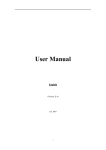
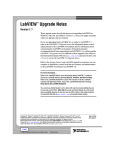
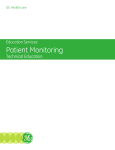
Using the Introduction Screen
When you launch DIAdem, the DIAdem introduction screen appears. The
introduction screen shown in Figure 1-2 contains tutorials and examples
that you can run, to show you how to work with DIAdem. The information
on DIAdem contains tips for newcomers and advanced users and connects
you to further information on the internet.
Figure 1-2. The DIAdem Introduction Screen
Note If DIAdem does not display the introduction screen when DIAdem launches,
select Help»Introduction to open the introduction screen.
To run a tutorial, complete the following steps.
1.
Click Tutorials»DIAdem at a Glance.
Use the buttons on the bar at the bottom of the screen to control the
tutorials.
2.
Click the button shown on the left to close the tutorial window and
return to the introduction screen.
The DIAdem panels contain tutorials in the tutorials function group that complement
the respective panel.
Tip
© National Instruments Ireland Resources Limited
1-3
Getting Started with DIAdem
Chapter 1
Introduction to DIAdem
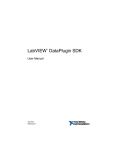
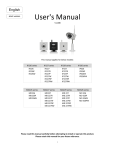
Finding Examples
The DIAdem Help contains examples for data analysis, for report
generation, and for script generation. The examples contain simple
solutions as well as extensive applications that you also can use as
templates for your own applications.
Complete the following steps to automatically load and execute examples
in DIAdem.
1.
Click Examples»Examples Gallery in the introduction screen.
DIAdem closes the introduction screen and opens the ExampleFinder
with a preview of the report examples as shown in Figure 1-3.
Figure 1-3. The Examples in DIAdem
2.
Click the picture Calculations for Process Capability.
DIAdem loads the data set and the layout of this example and displays
the report.
Getting Started with DIAdem
3.
Click DIAdem ExampleFinder on the Windows task bar to open the
ExampleFinder again.
4.
Navigate the ExampleFinder in the table of contents as shown in
Figure 1-3 to find simple solutions as well as more extensive
applications for data analysis, for report generation, and for script
generation.
1-4
ni.com
Chapter 1
Introduction to DIAdem
5.
Click Open Introduction Screen in the table of contents.
6.
Click Continue with DIAdem»Start Using DIAdem.
Summary
The summary provides an overview of the topics discussed in this chapter.
It also includes additional information.
Tutorials
Use the tutorials in the introduction screen to learn how to use DIAdem.
Select Help»Tutorials Visible to specify whether DIAdem displays the
Tutorials function group with the tutorials that complement the respective
panel, in the group bar. Refer to the DIAdem internet site ni.com/diadem
for further videos.
Examples
Use the Example Gallery or the ExampleFinder to automatically load and
execute examples for data analysis, for report generation, and for script
creation and to use these examples as templates for your own applications.
The table of contents for the examples also contains procedures that
provide step-by-step instructions for the solution of certain tasks.
Reproduce the steps of a procedure to learn how to use the described
function.
New to DIAdem?
Refer to the items under this heading to open the DIAdem manuals in the
introduction screen. Select New to DIAdem?»Getting Started to open the
Getting Started manual on the screen. Select DIAdem Basics to open the
user manual. The user manual contains a short introduction on how to
operate DIAdem and a description of the individual panels.
Upgrading DIAdem?
Refer to the items under this heading in the introduction screen for
descriptions of the most important functions of the current version. Click
More New Features to view all new features, changes, and extensions.
© National Instruments Ireland Resources Limited
1-5
Getting Started with DIAdem
Chapter 1
Introduction to DIAdem
Additional Resources
Refer to this heading in the introduction screen for the DIAdem Help and
internet links to further information.
The DIAdem Help familiarizes you with DIAdem, and shows you how
to use functions and to automate sequences. The DIAdem Help offers
procedures and dialog box help for each panel, as well as a programming
reference for creating scripts.
Click Training Courses to find out about the contents and the dates of
upcoming DIAdem training courses. Select DataPlugins Downloads and
Information to open the portal with the file filters available for DIAdem
and to download DataPlugins. Visit the Discussion Forum to read the
questions and answers listed or to direct your own questions to other
DIAdem users.
Getting Started with DIAdem
1-6
ni.com
2
Finding Data
DIAdem NAVIGATOR finds, loads, and saves your data. DIAdem works
with data from files and databases. To find files you can run a quick search
with separate terms or you can combine search conditions. DIAdem
displays the data found, in the search results.
The file browser offers a tree view of the data that is available. If the data
format allows browsing, you can browse to channel level in the folders and
the files.
Mining Data
Use the Quick Search to search for a term if you do not know whether the
property belongs to a file, a group, or a channel. Use the Advanced Search
to combine several search conditions and to specify which properties you
are searching for.
Running a Quick Search
To find data with a Quick Search, complete the following steps.
1.
Select DIAdem NAVIGATOR.
The file browser in the NAVIGATOR panel offers external data in a
tree structure.
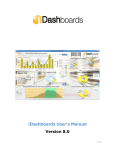
2.
Enter Weather in the input area, to find all the data sets that contain
the term Weather.
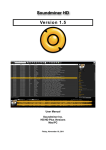
3.
Click Search.
In the quick search DIAdem does not distinguish whether the data set
contains the term as the name or the property of a file, of a channel
group, or of a channel. DIAdem displays all files that contain the term
Weather or compound terms such as Weatherdata, as Search
Results as shown in Figure 2-1.
© National Instruments Ireland Resources Limited
2-1
Getting Started with DIAdem
Chapter 2
Finding Data
Figure 2-1. Search Results of the Quick Search
Running an Advanced Search
To find data with an Advanced Search, complete the following steps.
1.
Click the Advanced Search button shown on the left to specify the
search results more accurately, as shown in Figure 2-2.
Figure 2-2. Selection List with the Channel Names of the Indexed Data
Getting Started with DIAdem
2-2
ni.com
Chapter 2
2.
Finding Data
Click File in the Search In column and select Group.
a.
Click <Enter a property> in the Property column of the same
row and select Name.
b.
Click the button with the three dots at the end of the same row.
DIAdem lists the names of all the groups found, as shown in
Figure 2-2.
c.
Double-click the group name Weather.
If the list does not contain the term Weather, DIAdem was not able to index all
example files. Select Settings»My DataFinder»Configure»Indexer»Start Now to start
indexing.
Note
Define another search condition in the second row to specify the search
more accurately.
3.
Click File in the second row of the Search In column and select
Channel.
a.
Click <Enter a property> in the Property column of the
second row and select Name.
b.
Click the button with the three dots at the end of the second row.
DIAdem lists the names of all the channels found.
c.
Double-click the channel name Precipitation.
As you can see in the logical operations line under the search
conditions, DIAdem connects several search conditions with the AND
operator by default.
4.
Replace AND with OR in the logical operations line to create the
following operation:
C1 OR C2
5.
Click Search Files.
DIAdem displays the Search Results, as shown in Figure 2-3. Each of
the listed files contains a group with the name Weather or a channel
with the name Precipitation.
© National Instruments Ireland Resources Limited
2-3
Getting Started with DIAdem
Chapter 2
Finding Data
Figure 2-3. Search Results of the Advanced Search
Browsing in Data Sets
To inspect search results, you can open data files in the file browser.
To open data files in the file browser, complete the following steps.
1.
Right-click the Data1.tdm file in the search results to open the
shortcut menu.
2.
Select Display in File Browser from the shortcut menu.
DIAdem switches from the search results to the file browser and
displays the Data1.tdm file with the TDM file symbol in the tree
structure. If the file browser knows the file formats, it displays the
respective file symbol before the file. If the file browser does not know
the file formats, it displays the file symbol with a question mark.
3.
Click the plus sign in front of the file symbol to view the channel
groups.
4.
Click the plus sign in front of the Weather channel group to view the
channels.
5.
Click the Precipitation channel.
DIAdem lists all the channel groups and channels that are contained in
a file, in a tree structure. Refer to the Properties window below the
File Browser for further information about the selected file, channel
group, or channel, as shown in Figure 2-4. If you select a channel, the
channel preview on the right side of the properties window displays the
channel data as a curve.
Getting Started with DIAdem
2-4
ni.com
Chapter 2
Finding Data
Figure 2-4. Browsing the Found Files in the File Browser
Loading and Managing Data
If you want to work with the data you have found, you must load the data
into the Data Portal. To load data and to remove unnecessary data, complete
the following steps.
1.
Click Delete Internal Data on the toolbar.
2.
Click the Weather channel group in the file browser to select this
channel group.
3.
Drag and drop the selected channel group into the Data Portal.
The Data Portal displays the Weather channel group with all the
channels, as shown in Figure 2-5.
© National Instruments Ireland Resources Limited
2-5
Getting Started with DIAdem
Chapter 2
Finding Data
Figure 2-5. Loading Data from the File Browser to the Data Portal
If you modify data in the Data Portal, DIAdem does not save the changes
automatically. The changes are executed only in the memory and not in the data file from
which you loaded the data. This enables you to experiment with data without modifying
the original data.
Note
Saving Data
To save the data in the Data Portal, complete the following steps.
Getting Started with DIAdem
1.
Click the File Browser tab in DIAdem NAVIGATOR.
2.
Navigate to the DIAdem folder Data in the National Instruments
folder.
3.
Select the Weather channel group in the Data Portal.
4.
Drag and drop Weather to the Data folder.
5.
Enter the file name Weather data in the Save As dialog box.
6.
Select the file type National Instruments TDM Files (*.tdm).
7.
Click Save.
2-6
ni.com
Chapter 2
Finding Data
Summary
The summary provides an overview of the topics discussed in this chapter.
It also includes additional information.
DataFinder
In the search input area of the DataFinder you enter search conditions to
help you find your data. You also can drag and drop properties from the
properties window of the Data Portal or of the file browser into the search
input area. In the logical operations line you connect the search conditions
with AND and OR and use parentheses to specify a query more precisely.
DIAdem lists the files found in the search areas on the Search Results tab.
DataFinder Server Edition
The DataFinder Server Edition enables up to 25 DIAdem users to access
common search areas simultaneously. You also can enable security settings
and use archiving systems.
Search Areas
Search areas are folders of the file system, which the DataFinder browses.
Select Settings»My DataFinder»Configure to modify the search areas of
the DataFinder.
File Browser
Use the shortcut menu of the Search Results to open the found data files
in a tree structure in the File Browser. Right-click the empty space to open
the shortcut menu and hide or show the folders of the local file system in a
separate tree.
Internal Data in the Data Portal
DIAdem manages internal data in the Data Portal, which is visible in all
panels. In the DIAdem panels you work with the channels of the internal
data and their descriptive information. DIAdem saves result data in the
Data Portal. You can display and edit the channel contents in DIAdem
VIEW.
You do not need the <Shift> or <Ctrl> keys to select several channels in the Data
Portal; just click the symbols next to the channel names. DIAdem displays a cursor with a
plus sign.
Tip
© National Instruments Ireland Resources Limited
2-7
Getting Started with DIAdem
Chapter 2
Finding Data
Channel Groups
Channel groups contain channels and descriptive properties of the channel
groups. Use channel groups to organize data. You can define a channel
group as a default group, for example, to automatically group all the
calculation results in DIAdem ANALYSIS. DIAdem displays the group
name of the default group in bold.
Channels
Channels contain data series that you measured during a test, loaded from
an external data set, or calculated with DIAdem. DIAdem distinguishes
numeric channels, waveform channels, time channels, and text channels.
Numeric channels contain data series, waveform channels contain data
series and the associated x-channel as a generation instruction, time
channels contain time data series, and text channels contain text.
Properties
Properties are information about the data, which DIAdem saves with the
data series in a TDM file. The data set properties contain the name of the
author and the storage date, the channel group properties contain the name
of the measurement and comments, and the channel properties contain the
data type and the channel unit. In addition to the standard properties, you
can create your own custom properties for the data set, the channel group,
and the channel. DIAdem displays the properties in the properties window
of the file browser and of the Data Portal.
Units Catalog
The channel unit is a special channel property because you can organize the
channel units in the units catalog. Use the units catalog to assign a physical
quantity and a unit to measurement values, for example, the quantity speed
and the unit kilometers per hour. If you assign the unit mile per hour from
the units catalog to the speed channel, DIAdem can convert the channel
values.
Getting Started with DIAdem
2-8
ni.com
3
Viewing and Evaluating Data
You use DIAdem VIEW to view, to analyze, and to edit data as curves in
axis systems. In channel tables you can edit and delete the data and enter
new data. You synchronize videos with data and project data onto
3D models.
Viewing Curves
To view the loaded data set in an axis system, complete the following steps.
Note If you have not completed the exercise from the previous chapter, load the data set
Data1.tdm located in the DIAdem folder Data. This folder is located in the DIAdem
NAVIGATOR file browser in the search area National Instruments.
1.
Select DIAdem VIEW.
2.
Click New Layout.
3.
Click Regular Worksheet Partitions on the group bar.
4.
Click Two Areas in this function group.
Each panel has its own group bar on the left side. When you click a button on the
group bar, DIAdem opens the function group where you can select a function.
Note
5.
Select the Date time channel in the Data Portal.
6.
Click the symbol shown on the left before the channel name to also
select the numeric channels T_max and T_min. The cursor changes its
color and displays a plus sign.
7.
Drag and drop the three channels selected in the Data Portal into the
upper worksheet area.
© National Instruments Ireland Resources Limited
3-1
Getting Started with DIAdem
Chapter 3
Viewing and Evaluating Data
8.
Select 2D Axis System in the selection dialog box.
DIAdem displays the axis system as shown in Figure 3-1.
Figure 3-1. Viewing Temperature Data as Curves
If you select several channels in the Data Portal and drop the channels onto an axis
system, DIAdem assigns the first channel you select to the x-axis. If you select only
one channel, DIAdem uses the index to display a numeric channel and uses the x-part to
display a waveform channel.
Note
Zooming Curve Sections
In DIAdem VIEW you can zoom curves with the band zoom or the frame
zoom from the axis system toolbar. For a close-up view of curves, complete
the following steps.
Getting Started with DIAdem
1.
Click Band Zoom on the axis system toolbar.
2.
Click the axis system and drag open the band to specify the width of
the curve section.
3.
Click Move on the axis system toolbar and move the curves to the
section that you want to magnify.
4.
Click Zoom In on the axis system toolbar to increase the zoom in the
selected section.
3-2
ni.com
Chapter 3
Viewing and Evaluating Data
5.
Click Zoom Off to return from the zoomed area to the complete curve.
6.
Click Move again to disable the move mode and to reactivate the
cursor.
Editing Curves
In DIAdem VIEW you can measure curves, and copy, delete, and
interpolate curve sections. Use the curve cursor, the maximum values
cursor, or the minimum values cursor on the DIAdem VIEW toolbar to
measure a curve. To edit curve sections use the flag functions on the axis
system toolbar.
Measuring Curves
To follow the curve points with the curve cursor in an axis system, complete
the following steps.
1.
Click Curve Cursor on the toolbar.
2.
Click the axis system and move the curve cursor along the curve.
DIAdem displays the x-values and the y-values of the curve points in
a tooltip next to the crosshair cursor that follows the cursor.
3.
Click a checkbox on the right side of the axis system to specify a
different curve as the leading curve.
DIAdem displays the coordinates of the new leading curve in the
tooltip.
Copying Curve Sections
To select a curve section and to copy the data of the curve section into the
Data Portal, complete the following steps.
1.
Click Band Cursor on the toolbar.
2.
Click the axis system and drag open the cursor range. Move the cursor
lines to specify the width of the band cursor.
3.
Click between the two lines to move the band cursor along the curves.
4.
Move the band cursor to the period of time from 12.03 to 3.04.
© National Instruments Ireland Resources Limited
3-3
Getting Started with DIAdem
Chapter 3
Viewing and Evaluating Data
5.
Click Set Flags on the axis system toolbar to mark the points of the
leading curve in the selected section.
Note If you press <Shift> at the same time, DIAdem marks the points of all curves in this
section.
6.
Click Flags: Copy Data Points on the axis system toolbar to copy the
data of the marked curve points to new channels.
In the Data Portal, DIAdem creates a time channel and a numeric
channel with the values of the copied curve section and selects these
channels.
7.
Drag and drop the selected curves into the bottom workspace.
8.
Select 2D Axis System.
DIAdem displays the copied curve section as shown in Figure 3-2.
Figure 3-2. Selecting Curve Sections and Copying them in the Data Portal
9.
Getting Started with DIAdem
Click Remove Flags from All Data on the DIAdem VIEW toolbar to
undo the selections.
3-4
ni.com
Chapter 3
Viewing and Evaluating Data
Editing Data in Channel Tables
In channel tables you can edit and delete data and add new data. You can
enter new data manually or generate data series.
To edit values in a channel table and to generate new values complete the
following steps.
1.
Click Assigned Worksheet Partitions on the group bar.
2.
Click Channel Table in this function group.
DIAdem creates a new worksheet with a channel table.
3.
Select the channels Comments, CopyXDate, and CopyYT_Max in the
Data Portal.
4.
Drag and drop the channels selected in the Data Portal into the channel
table.
DIAdem displays the columns of the channel table in the order in
which you select the channels in the Data Portal.
5.
Click the cell in the CopyYT_max column, row 10.
6.
Enter the value 1 and press <Enter>.
DIAdem also displays the new value in the curve in the bottom axis
system on the previous worksheet.
7.
Right-click next to the channel table and select Create New Channel
from the shortcut menu.
a.
Enter the channel name Generated_Channel.
b.
Click OK to create the new channel in the channel table and in the
Data Portal.
© National Instruments Ireland Resources Limited
3-5
Getting Started with DIAdem
Chapter 3
Viewing and Evaluating Data
8.
Right-click the first cell of the empty column Generated_Channel
and select Generate from the shortcut menu.
a.
Enter 0.5 as the step width and 100 as the number of values.
b.
Click OK to create the channel values.
DIAdem displays the channel table as shown in Figure 3-3.
Figure 3-3. Editing and Generating Data in Channel Tables
To use the layout with all worksheets as a template for similar data sets,
click Save Layout As.
Getting Started with DIAdem
3-6
ni.com
Chapter 3
Viewing and Evaluating Data
Summary
The summary provides an overview of the topics discussed in this chapter.
It also includes additional information.
Layouts
A layout can contain several worksheets. DIAdem saves layouts separately
from the channels. You can reuse the layout as a template for data sets with
a similar structure.
Areas
Partition worksheets into areas to insert axis systems, channel tables,
videos, 3D models, text, and graphics. You can move the separating bars to
resize any area in a worksheet. Use the Assigned Worksheet Partitions
function group to add new worksheets with predefined areas to a layout.
Axis Systems
In axis systems you display data as curves, spikes, or as stair curves. To
insert data into an axis system, drag and drop channels from the Data Portal
into an axis system. Use the band cursor and the frame cursor to zoom curve
sections. You open the legend on the right side of an axis system.
Graphics Cursors
DIAdem VIEW offers various graphics cursors for evaluating curves in
axis systems. The curve cursor moves from curve point to curve point and
other graphics cursors determine the minimum values and the maximum
values of a curve. If an axis system contains several curves, the graphics
cursor follows the leading curve that you specify with the checkboxes in the
legend. DIAdem synchronizes all the cursors of a worksheet with each
other and with videos and 3D models.
Flags
Use the band cursor and the frame cursor to select curve sections with flags,
to delete, to copy, or to recalculate the selected curve points.
© National Instruments Ireland Resources Limited
3-7
Getting Started with DIAdem
Chapter 3
Viewing and Evaluating Data
Channel Tables
In channel tables you view the individual values of the channels, edit the
values of all channel types, and add new values or channels. In the display
properties of a channel table you can specify whether a channel table only
displays the channels that were dragged and dropped into the table or
whether the channel table automatically displays all channels of a group or
of the Data Portal.
Videos
In the video area you show videos. If you display the associated measured
values as curves in an axis system, you can move a graphics cursor along
the curves to display the frame associated with each measurement value.
Double-click an empty video area to insert a video.
3D Models
In model areas you project the measured or simulated data as color shading
or as deformation onto a model of the test object. For example, you display
temperatures as color shading on a climate dummy or you display strain on
bridge elements as deformation. To do so, you insert the 3D model of the
test object and connect each data channel with the respective model point.
For model points with no sensor, DIAdem interpolates the values from the
data of neighboring model points.
Textboxes
You can display text and variable information in text boxes, for example,
the current date. You can drag and drop properties from the Data Portal into
the text box. Double-click a text box to enter text. Select Display from the
shortcut menu to edit the appearance of the text.
Graphics
You illustrate graphics areas with graphics. Double-click a graphics area to
insert a picture.
Getting Started with DIAdem
3-8
ni.com
Analyzing Data with Mathematical
Functions
4
You use DIAdem ANALYSIS to analyze data mathematically. You can
apply predefined standard mathematical functions, including basic
mathematics, curve fitting, signal analysis, and statistics. The dialog boxes
for the standard mathematical functions guide you through the calculation
so you do not have to enter a formula. You select the input data and the
settings. Use the DIAdem Calculator to define and calculate your own
formulas.
Using Standard Mathematical Functions
DIAdem has extensive libraries of standard mathematical functions in
several function groups in DIAdem ANALYSIS. The results of the
calculations are displayed in new channels in the Data Portal.
Note If you have not completed the exercise from the previous chapter, load the data set
Data2.tdm located in the DIAdem Data folder. This folder is located in the DIAdem
NAVIGATOR file browser in the search area National Instruments.
To create a new group for the calculation results, complete the following
steps.
1.
Select DIAdem ANALYSIS.
2.
Right-click in the Data Portal and select New»Group from the
shortcut menu.
3.
Enter Results as the Name. Enable the checkbox Set default group.
4.
Click OK.
DIAdem displays the name of the default group in bold type in the
Data Portal.
© National Instruments Ireland Resources Limited
4-1
Getting Started with DIAdem
Chapter 4
Analyzing Data with Mathematical Functions
Channel Values Summation
To total the precipitation for the year 2003, complete the following steps.
1.
Click Statistics on the group bar.
2.
Click Descriptive Statistics in this function group.
3.
Select Weather/Precipitation sum in the Data Portal.
This notation means the Precipitation sum channel is in the
Weather channel group.
4.
Drag and drop the selected channel to the Channels entry field in the
Object to be evaluated area in the dialog box.
5.
Enter 2-13 as the Rows.
To check which rows the precipitation for 2003 is in, switch to DIAdem VIEW and
load the channels Month and Precipitation sum into a channel table. The Month
channel contains the time values for the monthly precipitation totals.
Tip
6.
Click All Off to clear all the checkboxes of the characteristic values.
7.
Select Characteristic values»Sums»Measured values. DIAdem
shows the Descriptive Statistics dialog box as shown in Figure 4-1.
Figure 4-1. Precipitation Summation in Sections
Getting Started with DIAdem
4-2
ni.com
Chapter 4
8.
Analyzing Data with Mathematical Functions
Click OK to calculate the sum and to close the dialog box.
If you want to execute further calculations with this standard function, click
Calculate. The dialog box remains open for further entries.
Note
9.
Right-click Results/Sum in the Data Portal and select Rename.
10. Enter Precipitation_2003 as the channel name and press <Enter>.
Averaging Channels
To calculate the average monthly temperatures, complete the following
steps.
1.
Click Channel Functions on the group bar.
2.
Click Average Channel in this function group.
3.
Select Weather/Tm_min in the Data Portal.
4.
Press <Ctrl> and also select Weather/Tm_max.
5.
Drag and drop the selected channels into the Channels to be averaged
field in the Average Channels dialog box.
DIAdem displays the dialog box as shown in Figure 4-2.
Figure 4-2. Averaging Minimum and Maximum Temperatures
6.
Click OK.
7.
Right-click Results/Mean in the Data Portal and select Rename.
8.
Enter Temperatures as the channel name and press <Enter>.
© National Instruments Ireland Resources Limited
4-3
Getting Started with DIAdem
Chapter 4
Analyzing Data with Mathematical Functions
Calculating with the Units Catalog
The DIAdem units catalog organizes physical quantities and the associated
units. Use the units catalog to convert channels into other units.
To convert the calculated average monthly temperature from degrees
Celsius to degrees Fahrenheit, complete the following steps.
1.
Click Channel Functions on the group bar.
2.
Click Convert Channel Unit in this function group.
3.
Select Results/Temperatures in the Data Portal.
4.
Drag and drop the selected channel to the Channels entry field in the
Channel to be calculated area in the dialog box.
5.
Select in the Unit area the Unit set <All units>.
6.
Select under To the setting [°F] degree Fahrenheit as shown in
Figure 4-3.
Figure 4-3. Converting Channel Units with the Units Catalog
Getting Started with DIAdem
7.
Click OK.
8.
Right-click Results/UnitConverted in the Data Portal and select
Rename.
4-4
ni.com
Chapter 4
9.
Analyzing Data with Mathematical Functions
Enter Temperatures_F as the channel name and press <Enter>.
Note You also can convert channel data to a different unit in the Data Portal. To do so,
click the unit entry field in the properties window and click the button with the three dots
to open the Symbol Input Help dialog box.
DIAdem ANALYSIS displays a record of the calculations as shown in
Figure 4-4, and the Data Portal contains the calculation results in new
channels.
Figure 4-4. Record of the Calculations with Standard Functions
Refer to Figure 5-3 in the next chapter to view the curves of the average
temperatures and the annual precipitation.
© National Instruments Ireland Resources Limited
4-5
Getting Started with DIAdem
Chapter 4
Analyzing Data with Mathematical Functions
Calculating Formulas with the Calculator
Use the DIAdem Calculator to mathematically analyze data with your own
formulas. Use the Calculator to calculate channels, variables, and input
values. DIAdem stores the results in channels or variables.
To calculate the difference between the monthly maximum temperatures
and the average temperatures, complete the following steps.
1.
Click the Calculator on the toolbar.
2.
Enter the following formula in the Calculator entry field.
Ch("Results/TmMax_Diff")=Ch("[1]/Tm_max")-Ch("[2]/Temperatures")
To insert the output channels in the formula, open the Channels tab
and double-click a channel. DIAdem inserts the channel name with the
group index at the cursor position. DIAdem displays the Calculator as
shown in Figure 4-5.
Figure 4-5. Calculating Formulas with the Calculator
3.
Click Calculate.
4.
Click Close.
DIAdem adds the new channel TmMax_Diff to the Results channel
group in the Data Portal.
Getting Started with DIAdem
4-6
ni.com
Chapter 4
Analyzing Data with Mathematical Functions
Summary
The summary provides an overview of the topics discussed in this chapter.
It also includes additional information.
Mathematical Functions
DIAdem ANALYSIS offers a variety of standard functions for analyzing
your data. You assign input channels to standard functions, set parameters,
and execute the calculation. Click OK to execute a calculation once and to
close the dialog box. Click Calculate to execute several calculations with
one standard function.
Result Channels
DIAdem ANALYSIS saves calculation results in new channels. This
enables you to calculate new data without overwriting the existing
channels. In most dialog boxes of the standard functions you can select
Store result in original channel to overwrite the existing channels.
Default Group
DIAdem stores the result channels of a calculation in the default group in
the Data Portal. Use the shortcut menu to change the default group in order
to specify where DIAdem saves calculation results. DIAdem displays the
group name of the default group in bold type.
Calculator
Use the Calculator to specify your own formulas for analyzing data. The
Calculator has functions that range from simple arithmetic functions to
advanced scientific and engineering functions. Use the Calculator to
calculate channels, variables, and single values. DIAdem stores the results
in channels or variables.
Units
If you assign units from the units catalog to the original channels, DIAdem
automatically specifies the unit of the result channels. Based on the
physical quantities and units of the original channels dividing distance by
time results in a speed with the unit kilometers per hour, for example. Select
Settings»Options»Units to add your own units and to define unit sets with
favorite units.
© National Instruments Ireland Resources Limited
4-7
Getting Started with DIAdem
5
Creating Reports
You use DIAdem REPORT to create multi-page reports of data and results.
You use two-dimensional and three-dimensional axis systems, tables, polar
axis systems, text, variables, and graphics to document and to present data.
You use the Chart Wizard to create and to modify 2D axis systems and polar
axis systems.
Creating Axis Systems
To create a new layout with the Chart Wizard, complete the following steps.
Note If you have not completed the exercise from the previous chapter, load the data set
Data3.tdm located in the DIAdem Data folder. This folder is located in the DIAdem
NAVIGATOR file browser in the search area National Instruments.
1.
Select DIAdem REPORT.
2.
Click New Layout.
3.
Select the channels Weather/Month, Weather/
Precipitation sum, and Results/Temperatures.
4.
Right-click the selected channels and select Chart Wizard from the
shortcut menu.
DIAdem opens the Chart Wizard and creates a new worksheet with an
axis system. In the axis system, DIAdem displays the channels that are
selected in the Data Portal as curves as shown in Figure 5-1. DIAdem
assigns the first selected channel to the x-axis.
In Step 1 you select the diagram type. In Step 2 you add or delete
curves. In Step 3 you specify the diagram display on several tabs. The
preview as shown in Figure 5-1 directly displays how the diagram
changes.
© National Instruments Ireland Resources Limited
5-1
Getting Started with DIAdem
Chapter 5
Creating Reports
5.
Click the diagram type Lines with Several Y-Axes.
Figure 5-1. The Chart Wizard Displays the Preview in the Worksheet
6.
Click Next twice to open Step 3 of 3.
7.
Select the X-Axis tab.
8.
Enable Manual from for the value range and enter 01/01/2003 as
the start and 12/31/2003 as the end.
9.
Click Finish to create the axis system.
In the axis system, DIAdem displays the monthly precipitation and the
monthly average temperatures over the date.
You can open the Chart Wizard at several points in DIAdem. If you want to display
curves with various x-channels, open the Chart Wizard on the toolbar. If you want to
integrate axis systems into the current worksheet, open the Chart Wizard from the 2D Axis
Systems function group or the Polar Axis Systems function group. If you want to edit an
axis system, open the Chart Wizard from the shortcut menu of the axis system.
Tip
Getting Started with DIAdem
5-2
ni.com
Chapter 5
Creating Reports
Editing Axis Systems
You can move and resize axis systems or parts of an axis system. To make
it easier for you to see which objects you can select, DIAdem displays an
object in a blue frame as soon as the mouse cursor idles on the object.
Double-click the object to open the settings.
1.
To reduce the width of the axis system move the small square in the
middle of the right edge of the selected axis system to the left.
2.
Double-click the axis system to open the curve and axis definition.
3.
Click the entry field Type in the first line of the curve
Month/Precipitation sum.
4.
Select the Display mode Bars.
5.
Click OK twice to close the dialog box for the curve parameters and
the dialog box for the curve and axis definition.
DIAdem displays the worksheet as shown in Figure 5-2.
Figure 5-2. DIAdem Displays the Precipitation as Bars
© National Instruments Ireland Resources Limited
5-3
Getting Started with DIAdem
Chapter 5
Creating Reports
Graphics and Lines
Illustrate reports with graphics and company logos. Use lines and
rectangles to divide the worksheet or to highlight a text field. To add a
graphic to your worksheet, complete the following steps.
1.
Click Graphics on the group bar.
2.
Click Load Graphic in this function group.
3.
Select Weather.jpg in the DIAdem Documents folder and
click Open.
4.
Click and drag the graphic to the right edge of the workspace. Resize
the graphic by dragging the small squares at the corners of the graphic.
To prepare a text field on the right of the worksheet, complete the following
steps.
1.
Click Decorations on the group bar.
2.
Click Rectangle in this function group. A small rectangle appears next
to the cursor.
3.
Drag open a lamellar frame from the top of the worksheet to the bottom
right corner of the worksheet and separate the text field from the axis
system.
4.
Double-click the rectangle and enter for X2 and for Y2 100 on the
Position tab.
5.
Click OK.
The rectangle is now flush with the frame of the worksheet as shown
in Figure 5-3.
Getting Started with DIAdem
5-4
ni.com
Chapter 5
Creating Reports
Using Text and Variables as Labels
Add text and variables to a report to highlight the contents and
specific items. All texts can include formula expressions and DIAdem
variables, which DIAdem updates along with the rest of the report.
Double @ characters indicate to DIAdem which parts of the text to evaluate
dynamically. To add a text to your report, complete the following steps.
1.
Click Decorations on the group bar.
2.
Click Text in this function group. The cursor changes to a text cursor.
3.
Click the text field header in the worksheet, where you want to enter
a heading.
4.
Enter the text Weather report and press <Enter>.
5.
Enter @@CurrDate@@ in the second line.
6.
Click outside the text to conclude the entry.
7.
Click the text. To resize the text, drag the small squares at the corners
of the text with your mouse cursor.
Adding and Formatting Channel Properties
You can drag and drop channel properties from the Data Portal into the
worksheet. Click the button with the three dots at the end of the entry field
in the text editor dialog box to access further variables and expressions. To
add a channel property to your report and to edit the channel property,
complete the following steps.
1.
Select Results/Precipitation_2003 in the Data Portal.
2.
Click Minimum in the properties window of the Data Portal and drag
the channel property into the text field.
3.
Double-click the inserted text. The text editor displays the following
text:
Minimum: @@Str(Data.GetChannel("[2]/Precipitation_2003").
Properties("minimum").Value, "AutoAdj")@@
a.
Replace the first word Minimum: with the description Annual
precipitation.
b.
Press <Enter> to position the value below the text.
c.
Enter mm at the end of the text.
© National Instruments Ireland Resources Limited
5-5
Getting Started with DIAdem
Chapter 5
Creating Reports
4.
Click the Position tab and select Centered as the Relative position.
5.
Click OK.
6.
Select all texts and the graphic and click Center Vertically on the
toolbar.
DIAdem displays the worksheet as shown in Figure 5-3.
Figure 5-3. Using Text and Variables as Labels
To use the layout with all worksheets as a template for similar data sets,
click Save Layout As.
Getting Started with DIAdem
5-6
ni.com
Chapter 5
Creating Reports
Summary
The summary provides an overview of the topics discussed in this chapter.
It also includes additional information.
Layouts
A layout can contain several worksheets. DIAdem saves layouts separately
from the channels. You can reuse layouts as templates for data sets with a
similar structure.
Worksheets
Worksheets contain axis systems, text, tables, and graphics. To add data to
the worksheet, drag and drop channels from the Data Portal into axis
systems and tables. In addition to selecting data channels from the Data
Portal, you also can add data channels by double-clicking an axis system or
a table.
Select Settings»Layout Setup»Worksheet Parameters, for example, to
change the page format of the worksheet from horizontal to vertical.
Master Layout
Use a master layout to create a uniform appearance for reports. The master
layout remains unchanged in the background of all worksheets and consists
of a landscape master and a portrait master. To create a master layout, select
File»Master Layout»New.
Chart Wizard
You can use the Chart Wizard to create and to modify 2D axis systems and
polar axis systems. The preview function displays each changed setting in
the worksheet.
Axis Systems
Use axis systems to display channels as curves, bars, and surfaces. You
double-click an axis system to edit the displayed curves, to add new curves,
and to delete existing curves.
Tables
Use tables to list channel contents. You double-click a table to edit the
displayed columns, to add new columns, and to delete existing columns.
© National Instruments Ireland Resources Limited
5-7
Getting Started with DIAdem
Chapter 5
Creating Reports
Text
Use text to label worksheets. Text also can include variable information
such as filenames or the current date. For DIAdem, the @@ characters
indicate a variable expression. Click Refresh on the DIAdem REPORT
toolbar to display the current variable contents.
Decorations
Use comments, lines, arrows, rectangles, and circles in a worksheet to
highlight certain areas or curve points.
Graphics
Use graphics and logos to illustrate worksheets. DIAdem supports a
number of different graphic formats including PNG, BMP, JPG, TIF, and
WMF.
Format Bar
Use the format bar below the toolbar to format report objects. The format
bar always displays the properties that all selected objects have in common,
for example, line width, line style, and line color for selected curves.
Getting Started with DIAdem
5-8
ni.com
6
Automating Sequences
With DIAdem SCRIPT you can create scripts to automate sequences in
DIAdem. The recording mode lists all the actions that you complete
interactively in DIAdem, in a script. You can add program structures and
dialog boxes to recorded scripts in the integrated script editor.
Creating Scripts
The recording mode is the easiest way to create scripts. When you enable
the recording mode, DIAdem creates a new script in the script editor and
records the steps you make in this script. To create a new script in recording
mode, complete the following steps.
1.
Select DIAdem SCRIPT.
2.
Click Enable Recording Mode on the toolbar to start recording the
script.
3.
Enter DIAdem user as the Author and Manual example as the
Comment as shown in Figure 6-1.
Figure 6-1. Configuring the Recording Mode
DIAdem writes this information directly into the script code to help
you identify the script in the future.
4.
Click OK.
The status bar displays the recording mode symbol.
© National Instruments Ireland Resources Limited
6-1
Getting Started with DIAdem
Chapter 6
Automating Sequences
5.
Select DIAdem NAVIGATOR.
6.
Click Delete Internal Data to delete the data in the Data Portal.
7.
Enter Weather in the search input area of the quick search.
8.
Press <Ctrl-A> to insert DIAdem instructions in the script for the
search.
DIAdem inserts several lines in the recorded script. Before you use the
script, you must edit these lines.
If you do not press <Ctrl-A>, DIAdem does not record the instructions for the
search.
Note
9.
Click Search.
10. Drag and drop the Data1.tdm file into the Data Portal.
11. Select DIAdem ANALYSIS.
12. Click Channel Functions on the group bar.
13. Click Average Channel in this function group.
14. Select the channels Weather/Tm_min and Weather/Tm_max in the
Data Portal.
15. Drag and drop the selected channels into the Channels to be averaged
field in the Average Channels dialog box.
16. Click OK.
17. Select DIAdem REPORT.
18. Click Load Layout.
19. Select the layout Report2.tdr and click Open.
DIAdem automatically refreshes the display to show the data set you
have just loaded.
20. Select DIAdem SCRIPT.
Getting Started with DIAdem
6-2
ni.com
Chapter 6
Automating Sequences
21. Click Disable Recording Mode.
DIAdem displays the recorded script in the script editor as shown in
Figure 6-2.
Figure 6-2. Recording Actions in the Script Editor
After the commenting header, DIAdem declares the MyFolders path
variable and assigns to this variable the paths to the data folder and to the
document folder. If you want the script to load the data file or the report file
from another folder, just change the paths at this point in the script.
© National Instruments Ireland Resources Limited
6-3
Getting Started with DIAdem
Chapter 6
Automating Sequences
Editing Scripts
In the recording mode you pressed <Ctrl-A> to record the search for the
weather data. DIAdem has inserted parts of these lines as comments, to
allow a search with or without the DIAdem NAVIGATOR interface.
To allow interactive data selection in the script, complete the following
steps.
1.
Delete the quotation mark at the beginning of the following script line
with <Ctrl-Shift-'> to convert the comment into a command. The
command configures the query in the DIAdem NAVIGATOR interface
and lists the channels of the channel groups found, on the Search
Results tab.
Call Navigator.Display.CurrDataProvider.QueryForm.Search()
2.
Replace the script line for loading the data file Data1.tdm
Call DataFileLoad(MyFolders(0)&"Data1.tdm","TDM","")
with the following script lines:
Call WndShow ("NAVIGATOR","Open")
Call InteractionOn
The first script line opens the NAVIGATOR panel and the second line
stops the script so that you can load data interactively.
3.
Use the CodeCompletion function to enter the statement for hiding the
DataPortal behind the last script line:
a.
Enter Portal.
As soon as you enter the dot behind the Portal object, DIAdem
offers the methods and properties available for this object, as
shown in Figure 6-3.
b.
Double-click Visible to insert this property into the script.
c.
Complete the script line as follows:
Portal.Visible = False
4.
Enter the command Keywait in the script line as shown in Figure 6-3.
Select Keywait and press <F1> to open the Help for this command.
Getting Started with DIAdem
6-4
ni.com
Chapter 6
5.
Automating Sequences
Enter the following script line to redisplay the Data Portal at the end.
Portal.Visible = True
Figure 6-3. CodeCompletion Makes Editing Objects Easier
Testing Scripts
To test the modified script, complete the following steps.
1.
Click Run Script.
The script opens the NAVIGATOR panel and displays in the Search
Results all the data files that contain the term Weather.
2.
Click the file symbol in front of the Data4.tdm file to select the file.
3.
Drag and drop the selected file into the Data Portal.
© National Instruments Ireland Resources Limited
6-5
Getting Started with DIAdem
Chapter 6
Automating Sequences
4.
Click End Interaction on the toolbar.
The script opens the REPORT panel. DIAdem refreshes the date
displayed in the header and hides the Data Portal as shown in
Figure 6-4.
Figure 6-4. Report Created with the Script
5.
Press a key to redisplay the Data Portal and to end the script.
Select DIAdem SCRIPT and click Save File As to save the script.
Getting Started with DIAdem
6-6
ni.com
Chapter 6
Automating Sequences
Summary
The summary provides an overview of the topics discussed in this chapter.
It also includes additional information.
Scripts
Scripts allow you to execute a series of commands for finding data, loading
data, analyzing data, and creating reports. You can use VBS syntax and
DIAdem commands in scripts. You can integrate the standard dialog boxes
in scripts or you can create your own dialog boxes.
Recording Scripts
In the recording mode DIAdem records the command for every action that
you execute interactively, in a script.
<Ctrl-A>
In recording mode, DIAdem does not usually record the value assignment
for program variables. For example, press <Ctrl-A> in a DIAdem REPORT
dialog box to record the values of the program variables. If DIAdem is not
in recording mode, copy the value assignments of the program variable
with <Ctrl-A> to the Windows clipboard and then add these assignments to
a script.
Script Editor
The script editor displays the program code of scripts. While you record
actions in the recording mode, DIAdem records the commands directly in
the script editor. Use functions such as line enumeration, jump statements,
bookmarks, restoring, and find and replace, to make script editing easier.
Use the Microsoft Windows Script Debugger in the script editor to work
through scripts step by step and to find errors.
If you click a command or a variable, the tooltip displays the parameters of
the command or the value range of the variable. Press <F1> to call the Help
page of the command or the variable.
CodeCompletion
If you enter the name of an object and complete the entry with a dot, the
script editor offers the subobjects, events, properties, and methods that
are available for this object. Add your selection to the object with a
double-click.
© National Instruments Ireland Resources Limited
6-7
Getting Started with DIAdem
Chapter 6
Automating Sequences
Interaction Mode
When you use the interaction mode, you can stop your script to work
interactively with DIAdem. You enable the interaction mode in scripts with
the InterActionOn command. To end the interaction mode, click the End
Interaction button, which is on the toolbar in all panels.
User Commands
To add commands to DIAdem, you can define user commands in a script.
You use these user commands, for example, in Calculator formulas, for axis
system formats in DIAdem REPORT, and as new commands in DIAdem
SCRIPT.
User Dialog Boxes
Create user dialog boxes in the dialog editor in DIAdem SCRIPT to enter
values, to request settings, or to start functions. Use events to connect
elements from user dialog boxes and specify how the script proceeds in
relation to the previously specified settings.
Getting Started with DIAdem
6-8
ni.com
Technical Support and
Professional Services
A
Visit the following sections of the award-winning National Instruments
Web site at ni.com for technical support and professional services:
•
Support—Technical support resources at ni.com/support include
the following:
–
Self-Help Technical Resources—For answers and solutions,
visit ni.com/support for software drivers and updates, a
searchable KnowledgeBase, product manuals, step-by-step
troubleshooting wizards, thousands of example programs,
tutorials, application notes, instrument drivers, and so on.
Registered users also receive access to the NI Discussion Forums
at ni.com/forums. NI Applications Engineers make sure every
question submitted online receives an answer.
–
Standard Service Program Membership—This program
entitles members to direct access to NI Applications Engineers
via phone and email for one-to-one technical support as well as
exclusive access to on demand training modules via the Services
Resource Center. NI offers complementary membership for a full
year after purchase, after which you may renew to continue your
benefits.
For information about other technical support options in your
area, visit ni.com/services, or contact your local office at
ni.com/contact.
•
Training and Certification—Visit ni.com/training for
self-paced training, eLearning virtual classrooms, interactive CDs,
and Certification program information. You also can register for
instructor-led, hands-on courses at locations around the world.
•
System Integration—If you have time constraints, limited in-house
technical resources, or other project challenges, National Instruments
Alliance Partner members can help. To learn more, call your local
NI office or visit ni.com/alliance.
© National Instruments Ireland Resources Limited
A-1
Getting Started with DIAdem
Appendix A
Technical Support and Professional Services
If you searched ni.com and could not find the answers you need, contact
your local office or NI corporate headquarters. Phone numbers for our
worldwide offices are listed at the front of this manual. You also can visit
the Worldwide Offices section of ni.com/niglobal to access the branch
office Web sites, which provide up-to-date contact information, support
phone numbers, email addresses, and current events.
Getting Started with DIAdem
A-2
ni.com