1
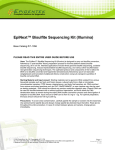
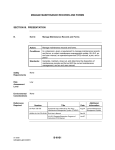
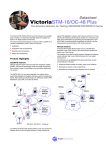
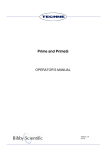
Pro Study Software
Operation Manual
Intended use
This document and its contents are proprietary to Bibby Scientific and its affiliates (“Bibby Scientific”), and are
intended solely for the contractual use of its customer in connection with the use of the product(s) described
herein and for no other purpose. This document and its contents shall not be used or distributed for any other
purpose and/or otherwise communicated, disclosed, or reproduced in any way whatsoever without the prior
written consent of Bibby Scientific. Bibby Scientific does not convey any license under its patent, trademark,
copyright, or common-law rights nor similar rights of any third parties by this document.
The instructions in this document must be strictly and explicitly followed by qualified and properly trained personnel
in order to ensure the proper and safe use of the product(s) described herein. All of the contents of this document
must be fully read and understood prior to using such product(s).
FAILURE TO COMPLETELY READ AND EXPLICITLY FOLLOW ALL OF THE INSTRUCTIONS CONTAINED
HEREIN MAY RESULT IN DAMAGE TO THE PRODUCT(S), INJURY TO PERSONS, INCLUDING TO USERS OR
OTHERS, AND DAMAGE TO OTHER PROPERTY.
BIBBY SCIENTIFIC DOES NOT ASSUME ANY LIABILITY ARISING OUT OF THE IMPROPER USE OF THE
PRODUCT(S) DESCRIBED HEREIN (INCLUDING PARTS THEREOF OR SOFTWARE) OR ANY USE OF SUCH
PRODUCT(S) OUTSIDE THE SCOPE OF THE EXPRESS WRITTEN LICENSES OR PERMISSIONS GRANTED BY
PCRMAX IN CONNECTION WITH CUSTOMER’S ACQUISITION OF SUCH PRODUCT(S).
FOR RESEARCH USE ONLY
© 2014 Bibby Scientific. All rights reserved.
2
Contents
Page
Intended use
2
Contents
3
Introduction
5
What is Pro Study?
5
Requirements for a standard curve study
5
Requirements for a Relative Quantification Study
5
Adding an Experiment
6
Designating the Mother Plate
6
Designating Plate Control Wells in your Study
7
Specifying Analysis Settings for your Study
8
Analyzing a Standard Curve Study
8
Analyzing a Relative Quantification Study
8
Reviewing the Data in your Study
10
Well table
10
Amplification plot
11
Melt Curve
12
Results Tab
12
Standard Curve
12
Relative Quantification
13
Exporting Study Data to a Report or Presentation
13
Technical Assistance
14
© The copyright of this instruction book is the property of Bibby Scientific. This instruction book is supplied by Bibby Scientific on the express
understanding that it is to be used solely for the purpose for which it is supplied. It may not be copied, used or disclosed to others in whole
or part for any purpose except as authorised in writing by Bibby Scientific. Bibby Scientific reserves the right to alter, change or modify this
document without prior notification.
Bibby Scientific Limited
Beacon Road,
Stone,
Staffordshire
ST15 0SA,
United Kingdom
Tel: +44(0)1785 812121
Fax: +44(0)1785 810405
e-mail: [email protected]
www.techne.com
3
4
Introduction
What is Pro Study?
The Pro Study software enables you to combine data from multiple Prime Pro 48 experiments into a study for
analysis. Currently, only Standard Curve and Relative Quantification experiments are supported.
NOTE We do not recommend combining experiments from multiple instruments because differences in
raw fluorescence values between instruments might increase the systematic error in your measurements.
Requirements for a Standard Curve Study
To ensure successful analysis, a Standard Curve study must contain:
•
One or more experiments of the same type, with the same thermal profile (except for melt profile) and
number of thermal cycles
•
One mother plate (if the study includes more than one experiment)
•
At least two standards with different values
•
One or more plate control wells in each plate
Requirements for a Relative Quantification Study
To ensure successful analysis, a Relative Quantification study must contain:
•
One or more experiments of the same type, with the same thermal profile (except for melt profile) and number of thermal cycles
•
One mother plate (if the study includes more than one experiment)
•
One or more plate control wells in each plate
•
One reference sample against which the target (non-reference) samples will be analyzed
•
At least one target (non-reference) assay
5
Setting Up a Study
Setting up a study is a three-part process, described in detail in the following sections of this document.
•
First, you must add one or more experiments to a study. The experiments must be of the same type
(Standard Curve or Relative Quantification), have the same thermal profile (except for melt profile), and
have the same number of thermal cycles.
•
Next, for studies containing more than one experiment, you designate one experiment as the mother plate. The mother plate is the plate against which the other experiments in the study will be compared. Pro Study automatically selects one experiment to serve as the mother plate. However, you can
change this setting to designate any other experiment as the mother plate.
•
Finally, you designate at least one well on the mother plate to serve as a plate control. Once assigned on the mother plate, Pro Study automatically identifies wells containing the same assays, reporter dyes,
and sample name on the other plates in your study. During analysis, the Pro Study software uses the Cq data from the plate control wells identified on each plate as a basis for comparing values across plates.
Adding an Experiment
When you start the Pro Study software, it opens to a new (blank) study. To analyze data from multiple experiments
in the study, you must add two or more Prime Pro 48 experiments of the same type (Standard Curve or Relative
Quantification), with the same thermal profile (except the melt profile) and number of thermal cycles.
1 TIP
Select File | Add Experiment.
You can also add experiments by dragging-and-dropping experiments onto the Pro Study software
or by right-clicking the Experiment list on the Amplification Plot, Melt Curve, or Results tab and selecting
Add Experiment.
2
TIP
Navigate to the *.ecod experiment data files you want to include in your study and click Open.
If the experiment files are saved in the same folder, you can Ctrl- or Shift- click to select multiple files for inclusion in your study at once.
3
NOTE
Repeat this procedure until all desired experiments are added to your study.
Pro Study automatically selects one experiment to serve as the mother plate. The mother plate is the plate against which the other experiments in the study will be compared. You can change this setting to designate any other experiment as the mother plate. For more information, see Designating the Mother Plate on page 6.
NOTE If one or more of the experiments you selected is of a different type, has a different thermal profile, or has
a different number of thermal cycles than the first experiment added to the study, an error message opens
for each unsupported experiment. Click OK through each error message.
Pro Study will add any remaining supported experiments to your study.
Designating the Mother Plate
Every study must have one experiment designated as the mother plate. The mother plate is the plate against
which the other experiments in the study will be compared. The other experiments in the study are referred to as
daughter plates.
1
2
6
Click the Plate Layout tab.
From the Experiments drop-down menu, select the experiment you want to use as the mother plate for your study.
Setting Up a Study
•
For Standard Curve studies, the mother plate must have at least two wells with the role Standard, but with
different quantities.
•
For Relative Quantification studies, any plate can be used as the mother plate. However, the mother plate
must have at least one well that meets the criteria to serve as a plate control. For more information on plate control requirements, see Designating Plate Control Wells in your Study on page 7.
3
Click the Mother Plate check box.
The previously designated mother plate is demoted to a be a daughter plate.
NOTE If you had a plate control well designated on the previous mother plate, it is cleared and a new plate
control will need to be assigned on the new mother plate. For more information, see Designating Plate Control Wells in your Study on page 7.
Designating Plate Control Wells in your Study
At least one well on the mother plate must be designated as the plate control. Once assigned on the mother plate,
Pro Study automatically identifies wells containing the same assays, reporter dyes, and sample name on the other
plates in your study. During analysis, the Pro Study software uses the Cq data from the plate control wells identified
on each plate as a basis for comparing values across plates.
1
2
3
Click the Plate Layout tab.
From the Experiments drop-down menu, select the experiment designated as the mother plate for your study.
Right-click the desired well on the plate layout diagram and select Assign as Plate Control.
•
•
For Standard Curve studies, the well you designate as the plate control must have an assay with the role Standard, Unknown, or Positive, as well as have a sample assigned. Additionally, the plate control well must not be excluded from the study.
For Relative Quantification studies, the well you designate as the plate control must have an assay with the role Unknown or Positive, as well as have a sample assigned. Additionally, the plate control well must
not be excluded from the study.
Wells containing the same assays, reporter dyes, sample name, and assay names are labeled Plate Control on the
plate layout diagram for every experiment in your study.
On the other tabs in the Pro Study software, plate control wells are indicated by the
icon in the Well Table
7
Specifying Analysis Settings for your Study
As you change settings in your study, including adding experiments and changing the mother plate and plate
control designations, the Pro Study software automatically re-analyzes your data using the default baseline,
threshold, and Cq variation values. If you want to use values other than the default settings, you can specify so in
the Analysis Settings dialog box, as described in the following sections.
Analyzing a Standard Curve Study
1
Click the Analysis Settings
button.
2
On the Cq Settings tab, for each assay, do the following:
a
Determine whether you want to specify the baseline start and end values or allow the Pro Study software to auto-calculate those values. If you specify the baseline Start and End values yourself, you
can use any numeric value between 1 and the total number of cycles in your study. The baseline End
value must be equal to or higher than the baseline Start value.
b
Determine whether you want to specify the threshold or allow the Pro Study software to auto
calculate the value. If you specify the Threshold value yourself, you can use any numeric value above
0 (zero).
NOTE
For more information on the auto-baseline and auto-threshold algorithms, see the Prime Pro 48
Real-Time PCR System User Guide.
c
Specify the desired Cq Variation value. If a plate control well in your study has a Cq Variation value above the one you specify, it is indicated by a
icon in the Well Table, so you can exclude that well
from the analysis, if desired. To exclude the well, right-click it in the Well Table and select Exclude.
3
Click OK. Pro Study re-analyzes your data using the new analysis settings.
Analyzing a Relative Quantification Study
1
Click the Analysis Settings
button.
2
On the RQ Settings tab, do the following:
a
From the RQ Analysis Method drop-down menu, specify the desired analysis method: Singleplex or Multiplex.
— If your study includes only singleplexed wells, the drop-down menu only includes that one option.
— If your study includes both singleplexed and multiplexed wells, both options are available. Only the wells matching your selection will be analyzed. The other wells will be omitted from the analysis.
b
From the RQ Algorithm drop-down menu, specify the desired normalization method: ΔΔCq or Efficiency Correction. The ΔΔCq method is supported only if you have a single reference gene and the amplification efficiencies are equal and at 100%. If your study does not meet these requirements,
you must use the Efficiency Correction method. For more information on these methods, see the Prime Pro 48 Real-Time PCR Operation Manual.
c
From the Reference Sample drop-down menu, select one sample to be used as the reference sample.
d
For each assay, specify:
— PCR Efficiency %: can be any numeric value between 0-200%
— Error %: can be any numeric value greater than or equal to 0 (zero)
e
Select the Reference Assay check box for every assay you want to use as a reference assay. You must
leave at least one assay unchecked to be used as the target assay.
3
On the Cq Settings tab, for each assay, do the following:
a
Determine whether you want to specify the baseline start and end values or allow the Pro Study software to auto-calculate those values. If you specify the baseline Start and End values yourself, you
can use any numeric value between 1 and the total number of cycles in your study. The baseline End
value must be equal to or higher than the baseline Start value.
b
Determine whether you want to specify the threshold or allow the Pro Study software to auto-
calculate the value. If you specify the Threshold value yourself, you can use any numeric value above
0 (zero).
8
Specifying Analysis Settings for your Study
NOTEFor more information on the auto-baseline and auto-threshold algorithms, see the Prime Pro 48 Real-Time PCR Operation Manual.
c
Specify the desired Cq Variation value. If a plate control well in your study has a Cq Variation value above the one you specify, it is indicated by a
icon in the Well Table, so you can exclude that
well from the analysis, if desired. To exclude the well, right-click it in the Well Table and select Exclude.
4
Click OK. Pro Study re-analyzes your data using the new analysis settings
9
Reviewing the Data in your Study
The data in your study can be viewed graphically or in a table on the Amplification Plot, Melt Curve, and Results
tabs in the Pro Study software. The example here shows the Amplification Plot tab for a Relative Quantification
study containing three experiments.
Figure 1 New study
Well Table
The Well Table appears on the Amplification Plot,
Melt Curve, and Results tabs. The columns in the Well
Table vary depending on your type of study. Using
the Well Table settings, you can control what data are
included in the Amplification Plot, Melt Curve, and
Results graphs.
•
•
•
Select specific rows in the Well Table to display the data in the graph.
By default, all rows are selected (highlighted in yellow) and so data for all wells in your study are shown in the graph.
Hover over a row in the Well Table to highlight it
in the graph.
Specify filter criteria in the empty fields above each column to find data more easily. In this
example, the Well Table is filtered to show only wells with a Cq Standard Deviation less than or equal to 0.15.
Figure 2 Well table
To clear the filter and return to the full data set, click the Clear Filter button.
• Click a column heading to sort the Well Table by the data in that column.
• Select the Disable Auto Scroll
button to stop the Well Table from scrolling vertically as you highlight data in the graph.
10
Reviewing the Data in your Study
Amplification Plot
The Amplification Plot displays the normalized or
baseline-subtracted fluorescence signal for a well at
each cycle. Using the Amplification Plot settings, you
can control how data are displayed in the Well Table
and graph.
•
•
•
•
•
•
•
•
Hover over a line in the Amplification Plot to highlight it in the Well Table.
From the Experiments list, select one or more experiments to limit what data appear in the graph and Well Table.
From the Assay drop-down menu, select one or more assays to limit what data appear in the graph and Well Table.
From the Plot Type drop-down menu, specify whether you want to show normalized (R) or baseline-subtracted (∆R) data in the graph.
From the Graph Type drop-down menu, specify
whether you want to show the data using a logarithmic or linear scale.
Click-drag the mouse over an area of the graph to zoom in on that area. To clear the zoom and return to the full view of the graph, click the Undo Zoom button
.
Drag the threshold line for an assay up or down on
the graph to change the analysis settings
without opening the Analysis Settings dialog box. The threshold can only be adjusted when viewing the data on a log scale.
If you turned off the Auto Baseline option in the
Analysis Settings dialog box, you can drag the
baseline start and end point
indicators for an
assay left or right on the graph to change the baseline settings.
Figure 3 Amplification Plot
Figure 4
11
Reviewing the Data in your Study
Melt Curve
The Melt Curve graph displays the fluorescence signal or
derivative fluorescence signal for a well at every 0.3° C
(0.54° F) of melting. Using the Melt Curve settings, you
can control how data are displayed in the Well Table and
graph.
•
•
•
•
•
Hover over a line in the Melt Curve graph to
highlight it in the Well Table.
From the Experiments list, select one or more experiments to limit what data appear in the graph and Well Table.
From the Assay drop-down menu, select one or more assays to limit what data appear in the graph and Well Table.
From the Plot Type drop-down menu, specify whether you want to show Raw or Derivative Melt data in the graph.
Click-drag the mouse over an area of the graph to zoom in on that area.
Figure 4 Derivative Melt
To clear the zoom and return to the full view of the
graph, click the Undo Zoom button.
Results Tab
The Results graph displays the results of your study
in one of the following formats, depending on the
type of study you ran: Standard Curve or Relative
Quantification.
Standard Curve
Standard Curve studies generate a standard curve line
graph. The slope, PCR efficiency and standard error
percentage, and R2 of that curve appear in the graph’s
legend. The standard curve is always shown, though
you can decide which data points to include in the
graph by selecting the appropriate rows in the Well
Table.
Figure 5 Standard curve
12
Reviewing the Data in your Study
Relative Quantification
Relative Quantification studies generate a bar graph
that includes error bars. The displayed histogram can
be toggled to group data by assay or by sample.
Figure 6 RQ vs Sample
Exporting Study Data to a Report or Presentation
You can export the data from your study in a variety
of formats, including comma- and tab-delimited text
files, Microsoft Excel spreadsheet, and Microsoft
PowerPoint.
1
2
3
4
5
Click the Export
button.
Type a name for the exported file.
The Export File Name field is pre-populated with the name of the study or, if you have not yet named the study, with the name New Study.
Click Browse and navigate to the folder where you want the exported data saved.
Select the format in which you want your data exported.
In the Export Options area, select the check box for each type of data you want exported. The options available here vary depending on the type of study you ran and the file format you chose to output.
If a type of data is not available, it appears grayed out in the Export Options area. In this example, the Plate Layout, Thermal Profile, and Results Table are being exported to Excel.
Figure 7 Export options
6 Click OK. Your exported data opens in the appropriate software application for the file format you chose to export.
13
Technical Assistance
For technical assistance, go to www.techne.com or
contact your local distributor.
MSDS
Material safety data sheets (MSDS) are available on the
Techne website at www.techne.com.
Product Documentation
If you require additional product documentation, you
can obtain PDFs from the Techne website.
Go to www.techne.com or contact your local distributor.
14
Notes
15
Bibby Scientific Ltd
Beacon Road Stone
Staffordshire ST15 0SA
United Kingdom
Tel: +44 (0)1785 812121
Fax: +44 (0)1785 813748
e-mail: [email protected]
www.bibby-scientific.com
Bibby Scientific France
Bâtiment le Deltaparc Silic Paris Nord 2,
7 rue du Canal, BP 55437 Villepinte
95944 ROISSY Charles de Gaulle
France
Tel: +33 (0) 1 48 63 78 00
Fax: +33 (0) 1 48 63 78 01
Email: [email protected]
www.bibby-scientific.com
Bibby Scientific Middle East Ltd
BPO Box 27842
Engomi 2433
Nicosia Cyprus
Tel: +357 22 660 423
Fax: +357 22 660 424
e-mail: [email protected]
www.bibby-scientific.com
Bibby Scientific US Ltd
3 Terri Lane Suite 10
Burlington NJ 08016
USA
Tel: 800-225-9243
Fax: 609-589-2571
www.bibby-scientific.com
Bibby Scientific (Asia) Ltd
Room 607 Yen Sheng Centre
64 Hoi Yuen Road Kwun Tong
Kowloon Hong Kong
Tel: +852 3583 1581
Fax: +852 3583 1580
e-mail [email protected]
www.bibby-scientificasia.com