1
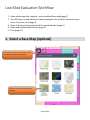
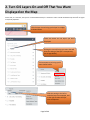
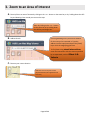
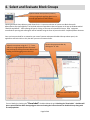
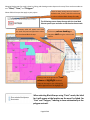
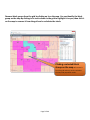
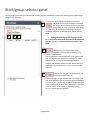
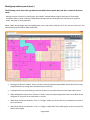
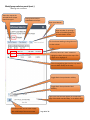
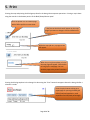
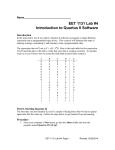
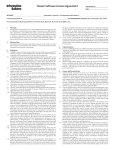
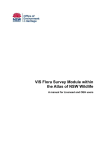
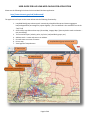
USER GUIDE FOR HUD LOW-MOD CALCULATOR APPLICATION Please use the following link to launch the Low-Mod Calculator application: http://www.sbcounty.gov/eda/hudlowmod/ The application will open to the screen below with the following functionality: 1. Low/Mod Block/group selector panel. Interactively select Block Groups and view an aggregate low/mod population percentage for project eligibility. (The User Manual is also available here via the “help” link) 2. Select a base map Select a base map (Street Map, Imagery Map ) (Not required to make a selection – may use default) 3. Turn on and off layers (schools, parks, city limits, low/mod block groups, etc.) 4. Address search - Locate and zoom to an address 5. Pan and zoom to an area of interest 6. Print a map 1. Low/Mod Block/group selector panel 7. View legend of map elements 5. Zoom in/out 4. Address Search 7. View legend 3. Turn layers on/off 2. Select a base map Auto locate / initial extent Page 1 of 11 Low Mod Evaluation Workflow 1. Select a base map (not required – may use default base map)(page 2) 2. Turn GIS layers on and off that you want displayed in the map (Ex: low/mod census tracts, City limits, etc.) (page 3) 3. Zoom to the area of interest/search for specific address (page 4) 4. Select and evaluate Block Groups (page 5) 5. Print (page 11) 1. Select a Base Map (optional) Click this icon in the top left portion of the map to open the base map selector Choose a base map by clicking base map icon Page 2 of 11 2. Turn GIS Layers On and Off That You Want Displayed on the Map Ensure that, at a minimum, the layer for “Low Mod Block Groups” is selected in order to shade all Block Groups with 51% or higher in low/mod population. Click the Layer icon to bring up the layer list widget as shown below. Check the boxes for the layers you want displayed. Clicking this icon will bring up a menu that will allow the setting of the layer’s transparency (see images below). Click transparency to bring up the menu shown below. Slide this setting to the left to make the layer more opaque, and to the right to make the layer more transparent. Page 3 of 11 3. Zoom to an Area of Interest A. Zoom In/Out to an area of interest by clicking on the + or – button on the zoom bar, or by holding down the shift key and drawing a box around your area on the map. Zoom by clicking on the + or – button on the zoom bar or by holding down the shift key and drag a box. B. Address Search Use the geocoding tool if you have an address for the area you’re interested in. Type the address into the input box and press the [Enter] key or click the magnifying glass icon. To find places using street intersections, enter the intersection with the streets separated by an ampersand, such as: Gilbert St & Valencia C. Zoom to your current location Click here to zoom to your current physical location (not supported in all browsers) Page 4 of 11 4. Select and Evaluate Block Groups Open the Block Group selector panel by clicking the globe/magnifying glass icon in the top right portion of the browser. Opening the Block Group Selector panel allows for the interactive selection of census tract Block Groups for determination of project eligibility. The low/mod and overall population values will appear in the pop-up window entitled “Block/Group Selector”. After opening this panel, clicking on the map will select Block Groups. Map navigation commands for panning and zooming will still be available using the zoom in/out tool and the keyboard/mouse shortcuts. Once you have searched for or zoomed to your area of interest and opened the Block Group selector panel, the application will look similar to this, but with your area of interest shown. Adjust the map view using the “+”/”-“icons, and/or by using keyboard/mouse shortcuts. Pan the map by clicking the mouse button and holding it while dragging across the map. Dismiss the pop-up window by clicking the “X” icon Click the “Show labels” check box Turn on labeling by checking the “Show labels” checkbox below the grid. Checking the “Show labels” checkbox will place a point inside the Block Group polygons with text showing the low mod counts for the Block Group along with its total population. Page 5 of 11 Selecting block groups for study is done by clicking and drawing section shapes on the map. There are three modes to use: “Point,” “Line,” and “Polygon.” Leave the Block Group selection method in default mode, “Point,” and click on the map to select individual Block Groups for study Select all Block Groups that apply to your project. The following screen shows the app with the Low Mod Selector panel open and after a selection has been made. A Summary table will appear and show the total low/mod and population values for the selected Block Groups Click on any column heading on the grid to sort using the values in the column Clicking a row in the grid in the “Tract” column will highlight the Block Group on the map in cyan. Clicking the column again will turn the highlight off. When selecting Block Groups using “Point” mode, the label for it will appear at the location on the map it’s clicked. For “Line” and “Polygon,” labeling is done automatically at the polygon centroid. Page 6 of 11 Remove block groups from the grid by clicking on it on the map. You can identify the block group on the map by clicking in its tract column in the grid to highlight it in cyan, then click it on the map to remove it from the grid and re-calculate the totals. Clicking a selected Block Group on the map will remove it from the grid and map, and re-calculate the low/mod population totals. Page 7 of 11 Block/group selector panel The Low Mod Selector panel initially has the following controls available for interactively selecting census Block Group polygons from the map. Clicking the “Point” button allows for the selection individual census tracts. Clicking the map with the “Point” option selected will select the Block Groups from the map, put the low/mod values for it into the grid, and then summarize the low/mod population values for all selected Block Groups into the table. A A A B C Clicking a Block Group on the map that’s b e e n s e l e c t e d will remove Block Group low/mod population from the t o t a l s and re-summarize the values in the table. B Clicking the “Line” button allows for the selection of Block Group by drawing a line around the desired area. Start the line with a single mouse click. Click again to end each line segment and continue in a different direction. Double click to end the line and make the selection. Changing the selection mode to “Point” allows adding or removing i nd i v id u al B loc k G r o up s to fine tune the selection. C Clicking the “Polygon” button allows for the selection of Block Group by drawing a polygon shape. Start the line with a single map click. Each additional click will end that segment and begin a continuing one. Double click to end the shape input and make the selection. As with “Line,” changing the selection mode to “Point” allows adding or removing B l o c k G r o u p s to fine tune the selection. Page 8 of 11 Block/group selector panel (cont.) The following screen shows the app with the Low Mod Selector panel open and after a selection has been made. Labeling has been turned on by checking the “Show labels” checkbox below the grid. Checking the “Show labels” checkbox will place a point inside the individual Block Groups with text showing the low mod counts for the Block Group along with its total population. Below, a Block Group polygon has been highlighted in cyan on the map by clicking in the “Tract” column in the row in the accumulation grid that holds its Block Group data. Changing the selection mode to “Point” will allow removing individual selected Block Group data from the map and grid selection by clicking within the Block Group on the map. Pressing the [Esc] key while drawing a selection shape on the map will discontinue the shape input process. When adding Block Groups to the selection in “Point” mode, the low/mod population label for the Block Group will appear at the point on the map where it’s clicked. When Block Groups are selected in “Line” or “Polygon” mode, any current selection is cleared by the results of the new selection. When Block Groups are selected in “Line” or “Polygon” mode, Block Group labels appear at the centroid of the Block Group polygon. Page 9 of 11 Block/group selector panel (cont.) Working with a selection Zoom the map to the selected Block Groups listed in the grid. Clear grid and map of selected Block Groups. Open User Manual Open window for printing a table of the block/group list and calculation results Click a column heading in the grid to sort on that column. Click any row in the “Tract” column to highlight its Block Group on the map. Click it again to un-highlight it. Click the magnifying glass icon for any row to zoom its Block Group on the map. Toggle Block Group selection visibility. Toggle Block Group selection label visibility. Type in the title that will appear on the PDF map page.”2014 HUD Low Mod Map” is the default title. Click the printer icon to create a page with a PDF map of the current view. Page 10 of 11 5. Print Printing the map and printing the block groups listed in the data grid are separate operations. Printing a map is done using the controls in the bottom portion of the Block/Group Selector panel Click the printer icon to create a page with a PDF map of the current view. … But first set the title that will appear on the map page if you want to change it from the default title. While the map job runs, a progress icon will appear. When the print job completes, a link to the map page will appear. Click the link to bring up the map page. You can send the page to the printer from here. Printing the block group data in the data grid is done using the “Print” button that appears above the data grid after a selection is made. Press the print button to bring up a report page for printing the data grid values (low/mod population, total population and low/mod percentage). Page 11 of 11