1
Ying Feng & Katy Börner: Using Semantic Treemaps to Categorize and Visualize Bookmark Files. In Visualization
and Data Analysis 2002. Robert F. Erbacher, Philip C. Chen, Matti Grohn, Jonathan C. Roberts, Craig M. Wittenbrink
(eds), January 20-25, 2002, San Jose, CA, USA, Proceeding of SPIE, Volume 4665, pp. 218-227.
Using Semantic Treemaps to categorize and visualize bookmark files
Ying Feng
Computer Science Department
Indiana University
Bloomington, IN 47405, USA
Katy Börner
Information Science & Cognitive Science
Indiana University, SLIS
Bloomington, IN 47405, USA
ABSTRACT
As more and more information is available on the Internet, search engines and bookmark tools become very popular.
However, most search tools are based on character-level matching without any semantic analysis, and users have to
manually organize their bookmarks or favorite collections without any convenient tool to help them identify the subjects
of the Web pages. In this paper, we introduce an interactive tool that automatically analyzes, categorizes, and visualizes
the semantic relationships of web pages in personal bookmark or favorites collections based on their semantic similarity.
Sophisticated data analysis methods are applied to retrieve and analyze the full text of the Web pages. The Web pages are
clustered hierarchically based on their semantic similarities. A utility measure is recursively applied to determine the best
partitions that are visualized by what we call the Semantic Treemap. Various interaction methods such as scrolling,
zooming, expanding, selecting, searching, filtering etc. are provided to facilitate viewing and querying for information.
Furthermore, the hierarchical organization as well as the semantic similarities among Web pages can be exported and
visualized in a collaborative 3D environment, allowing a group of people to compare and share each other’s bookmarks.
Keywords: Semantic Treemap, Spring Embedding, semantic similarity, bookmark, cluster, hierarchy, interaction,
information visualization
1. INTRODUCTION
The millions of documents on the rapidly expanding World Wide Web further exacerbate the information overload
problem. The Web today has no classification system for Web sites, no formal indexing policy or controlled vocabulary,
and no systematic way to name Web pages and assigning authorship in a particular catalogue. Currently most Web
surfers rely on browser search engines such as Yahoo, Google etc. to find specific information on the Web. A typical
search engine allows a user to type in certain keywords and simply retrieves all Web pages containing those words using
character-level matching, instead of analyzing the semantic relationships between the query and the retrieved pages. As a
result, many irrelevant Web pages may be retrieved, especially in the case of words with different meanings (e.g., bank)
or different words with similar meanings (e.g., dad and pa). A big part of the work to identify relevant information is still
left to the user and information searching on the Web remains a challenging and often frustrating task. One strategy to
deal with this problem is to develop personal information systems consisting of focused subsets of Web sites highly
relevant to a particular user. Bookmark or favorite collections are a convenient and popular way to achieve this goal.
Most Web browsers nowadays such as Netscape and Internet Explorer provide embedded tools for a user to bookmark
his favorite URLs and organize them into folder structures featuring different categories. The efficiency of the
categorization is totally up to the user’s own archiving experience and knowledge about the Web pages. In many cases
the user bookmarks a Web page for later use before having a chance to read it, so it’s hard for him to label the category
for that page. Another problem is that the bookmark archive management is completely manual: the user has to
reorganize the folders himself after he adds, deletes, or changes bookmarks. As the size of the archive grows, pool
scalability of the current tools makes it hard to browse and retrieve bookmarks in a deeply nested hierarchy [16].
In this paper, we introduce an interactive tool that aims automatically analyses, categorizes and visually displays
collections of Web pages. The tool can take personal bookmark archives or bookmark collections from different
individuals and parse all the linked Web pages. Advanced data mining techniques such as Latent Semantic Analysis [1]
is used to analyze the semantic similarities between the pages. According to this semantic information, clusters of Web
pages are generated and labeled with their semantic topics. Further on, a visualization technique that we call Semantic
Treemap is utilized to visualize the bookmark hierarchy in both the generated clustering division and the original folder
organization making it easy for users to quickly locate relevant Web pages. To avoid information overflow and improve
focusing, zooming and expanding are enabled on any area inside the Semantic Treemap. Besides, various searching and
filtering methods are provided to help users quickly identify the Web pages satisfying their requests. Finally, the spatial
layout of the Web pages can be exported and utilized to create a visualization of the Web pages in a 3D virtual reality
environment that can be shared and collaboratively examined.
The rest of the paper is organized as follows: section 2 introduces related work; section 3 explains the data analysis
process for semantic similarity analysis and categorization of Web page collections; section 4 describes the Semantic
Treemap used to visualize bookmark hierarchies as well as the various embedded interaction methods to facilitate
information viewing and retrieval; section 5 gives some application examples using the Semantic Treemap to visualize
bookmark collections; finally, section 6 summarizes the paper and discusses future work.
2. RELATED WORK
Since its first appearance, Latent Semantic Analysis (LSA) [1] has been widely used to induce semantics of textual
documents [3], especially in content-based information retrieval [2] and semantic similarity comparison [4]. The
technique is explained in section 3.2. To visualize similarity results, Force Directed Placement (FDP) algorithms [5] are
frequently used. Kumar etc. implemented a 3D version of FDP [6]. Huang etc. extended FDP in a system that uses a
“logical frame” to present a subgraph of an entire graph and smoothly migrates from one frame to another [7]. FDP is
used in Pathfinder Network Scaling (PfNet), which is utilized in StarWalker by Chen to layout documents according to
their semantic similarity [8]. In StarWalker, the similarity matrix is determined based on co-citation patterns for a large
set of papers and the citation networks are displayed as minimal spanning trees that preserve only the most important
links.
To visualize hierarchical data Treemaps have shown great powers in many applications including DiskMapper from
Micro Logic Corp, SeeDiff software code viewer from Bell Labs, Honeycomb electronic product catalogs by the Hive
Group, as well as SmartMoney’s Stock Marketmap and TruePeers’s PeopleMap. Many efforts have been made to make
the space filling technique more effective. Asahi etc. introduced dynamic queries into the Analytic Hierarchy Process
Treemap, allowing users to interactively change and see the influence of different factors [10]. Van Wijk etc. developed
Cushion Treemaps to improve the visibility of nesting depth by shadows on cushion-like 3-D mounds [11]. Stasko and
Zhang proposed a Focus+Context display and navigation techniques for enhancing radial, space-filling hierarchy
visualizations [12]. Bederson etc. proposed Ordered and Quantum Treemaps, which organize the screen space into
horizontal-vertical strips with square-like aspect ratio, while at the same time maintaining the original ordering as well as
satisfying the need to accommodate fixed shape items [14].
Some empirical studies have been carried out on bookmark usage in the Web information space. A 1996 survey of
6619 Web users [15] reported that over 80% respondents cited bookmarks as a strategy for locating information, and
organizing bookmarks became one of the top three Web usability problems. In his survey on 322 Web users [16],
Abrams addressed why and how people create, use, and organize bookmarks, as well as the necessity to improve the
organization, visualization, representation, and integration of bookmarks. These user studies provide scientific basis for
the design of bookmark visualization and management systems.
3. DATA MINING AND CLUSTERING
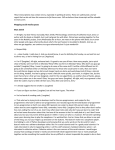
Our bookmark visualization tool works in two phases: the data analysis phase and the data visualization phase. The first
phase is divided into three steps: bookmark file parsing, semantic similarity modeling using LSA, and bookmark
clustering and labeling. The second phase is also divided into three steps: bookmark layout with Semantic Treemaps,
graphical display, and user interaction. The overall procedure is illustrated in Figure 1 and explained in detail in the
following sections.
3.1 Bookmark parsing
Bookmark parsing is the first step of the whole visualization process. The input of the bookmark parser comes from
existing bookmark files and the purpose is to set up a folder hierarchy representing the original categorization manifested
in those files. There are two formats for the input. The first type contains personal bookmarks organized in a folder
archive, usually maintained by their owner through some Web browser and saved as a standard HTML file. For this
format our bookmark parser runs a recursive procedure to parse the HTML document and build up a folder tree
containing all bookmarks in the document while maintaining the owner’s original folder hierarchy. The root of the tree
corresponds to the unique top-level folder, each non-leaf node is a subfolder, and all bookmarks are in leaf nodes. Each
folder or bookmark has a label, as given by the original owner suggesting his definition of its semantics. A URL link is
kept for each bookmark so that the referred Web page can be downloaded for semantic analysis . The folder tree created
in this way exactly represents the user’s manual organization of his bookmarks.
In the course of collaboration it can be advantageous to share bookmark files. Therefore, we support a second input
file format resembling a list of bookmarks collected from different people. Each bookmark has an owner, a name, and a
URL link. Since the bookmarks are arranged in a linear order, we need to create a hierarchical structure for the folder
tree. We assign the root of the tree to be the bookmark pool containing all bookmarks from the file. In the first level we
divide the bookmarks by their owners and for each owner build under the root a subfolder containing all his bookmarks.
Next we divide each owner’s bookmarks by their URL fields and build a second-level subfolder for each field. For
example, URL fields ending with “.edu” are categorized as “Educational”, while URLs with “.com” go under
“Commercial”. We can further develop the folder tree by adding more layers categorized with more fine-grained
features. The folder tree generated in this way roughly follows the categorization implied by the bookmarks’ features
specified in the input file. Both formats of bookmark files can be imported in multiple and combined together, in which
case a ‘bookmark pool’ will be set up for all people’s bookmarks and represented as the folder tree root; each owner will
have a subfolder under the root and his bookmarks will be categorized either as defined by himself, or by bookmark
features when the former is not available.
3.2 Similarity modeling with Latent Semantic Analysis
Next we need to download and parse all Web pages linked from the bookmarks in the folder tree and apply LSA to them.
LSA [1] is a variant of the vector space model that converts a representative sample of documents to a term-by-document
matrix in which each cell indicates the frequency with which each term (row) occurs in each document (column). In our
case, if there are p valid Web pages (documents) and t distinct words (terms) in all pages, this results in a t ×p term-page
matrix F , which can also be regarded as p column vectors of t-dimension. LSA extends the vector space by modeling
term-page relationships using a reduced approximation for the column and row space computed by singular value
decomposition (SVD), as shown in formula (1), where L and R are t * n and n * p respectively, and S is an n * n diagonal
matrix with the singular values. Care needs to be taken when choosing an appropriate value for n, which should be
ideally large enough to fit the real structure of the data, but small enough so that noise, sampling errors and unimportant
details are not modeled. We can sort all singular values and cut them at the point where the value greatly drops, and take
the n highest singular values while omitting all others. Thus each Web page is represented as an n-dimensional vector in
the n * p matrix FR , as shown in formula (2). This way, the dimensionality is greatly reduced (n << t), and only
important and reliable patterns underlying the original data are maintained.
F˜ L *S* R
(1)
S M = FN * FN’,
0 = S M (ij) = 1
(3)
FR = S * R
(2)
DS (ij) = 1 - | S M (ij) |, 1 = i, j= n
(4)
Similarities between Web pages can be comp uted using dot products between two column vectors of the reduced matrix,
reflecting the degree to which two Web pages have a similar term usage pattern. The formula is given in (3), where S M is
the n * n similarity matrix, and FN is obtained by normalizing the column vectors in FR . To simplify clustering and
visualization, S M is converted into the distance matrix DS by subtracting the absolute value of each element in S M from
1,as given in formula (4), resulting in a symmetric n * n matrix with all elements in the range [0, 1] and all zeros on the
diagonal.
The terms we use for LSA are collected from the textual part of all downloaded Web pages (including the titles and
labels of all HTML elements), and only terms with substantial meanings are counted. All punctuations, numbers, and
special names are excluded. Besides, we build a small dictionary of stopwords to filter out grammatical or commonly
used phrases that tend to appear in almost every document. To speed up text parsing, a hashtable is used to record the
frequencies of term occurrences for each Web page. However, not all Web pages are valid. Some bookmarks have malformatted URLs, some pages aren’t accessible due to network failures, and some just don’t contain any useful terms. All
invalid bookmarks are recorded with special marks and will not be considered in the semantic analysis. After all Web
pages are parsed, the term-page matrix is generated for all valid terms and Web pages.
Other than text, an HTML page may contain various multimedia and executable elements, such as images, audio,
video, and applets etc. the semantic analysis of which is beyond the scope of this paper. However, we maintain statistics
on the number of audio files, video clips, and applets etc. that are linked from any web page as well as information on its
type, size, and access frequency etc. These statistics can be useful for data filtering and searching when users want to
hide or highlight Web pages with certain features.
Data Analysis Phase
Bookmark File
Bookmark Parsing
Folder Tree
Data Visualization Phase
( ( (p1 p2) (p3 p4)) ( (p5 p6) (p7 p8) ) )
((p1 p2 p3 p4 p5 p6 p7 p8))
Export to File
((p1 p2 p3 p4) (p5 p6 p7 p8))
ST Algorithm
((p1 p2 p3 p4) (p5 p6) (p7 p8))
ST Layout
((p1 p2) (p3 p4) (p5 p6) (p7 p8))
LSA Modeling
Page-Term Matrix
Similarity Matrix
Graphical Display
((p1 p2) (p3 p4) (p5 p6) (p7) (p8))
((p1 p2) (p3 p4) (p5) (p6) (p7) (p8))
Interaction
((p1 p2) (p3) (p4) (p5) (p6) (p7) (p8))
Clustering & Labeling
User Interface
((p1) (p2) (p3) (p4) (p5) (p6) (p7) (p8))
Cluster Tree
User Operation
Figure 1. Two phase bookmark visualization
p1 p2
p3 p4
p5 p6
p7 p8
Figure 2. Hierarchical clustering of 8 Web pages
3.3 Hierarchical clustering
From the similarity results of LSA we categorize the bookmarks and create a hierarchy of clusters grouping Web pages
of similar semantic contents by a nearest-neighbor-based, agglomerative, hierarchical, unsupervised clustering algorithm.
Clustering starts with a set of singleton clusters, each containing one Web page. The two most similar clusters over the
entire set are merged into a new one that covers both. A complete linkage measurement is applied to determine the
distance inside and between clusters based on the distance matrix. Merging of clusters repeats until a single all-inclusive
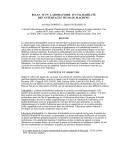
cluster remains and a binary hierarchy of clustering sequence is produced. Figure 2 shows an example of how eight Web
pages are clustered. The clustering layers are shown on the left with their corresponding partitions on the right.
Obviously, the display of all the different clusters in this hierarchy in a Treemap would lead to a very cluttered
display. We therefore developed a combination of a traditional Treemap and the Spring Embedding algorithm called
Semantic Treemap (SM). An SM utilizes a Treemap to display the ‘best partitions’ of the hierarchical organization of the
bookmark categories (clusters or folders) in a slice-and-dice fashion (see Figure 3). Within each subcategory, the Web
pages are laid out according to their semantic similarities using the Sping Embedding algorithm. Consequently, similar
bookmarks will be positioned close to each other, and bookmarks on similar topics will be clustered under the same
category.
To obtain a ‘best cluster partitions’, we recursively select the partitions that minimize the average intra-cluster
distance AAD and maximize the average inter-cluster distance AED. Starting from the initial singleton clusters, as the
cluster merging goes on, the inter-cluster distance between the two merged clusters grows bigger. It’s easy to infer from
the algorithm described below that AAD keeps growing bigger, while AED first grows bigger to the maximum and then
starts to drop. We define a utility measure U as the ratio of AAD against AED, and the partition with the lowest utility
will be selected. In the example shown in Figure 2, layer 6 (the bottom one being layer 0) is selected as the first-level
partition. It contains three clusters: (p1..p4)(p5,p6)(p7,p8). We can further partition each cluster in this level by applying
the above utility recursively, and eventually build up a cluster tree with the whole bookmark set being the root, each
cluster being a non-leaf node, and all bookmarks being the leaf nodes.
Several factors should be considered when deciding whether a cluster should be further partitioned or not. One is
the utility measure of the cluster. If its best (minimal) value is still quite small, we ’ll see that bookmarks inside that
cluster still show the tendency to cluster into smaller subclusters, so it makes sense to further partition it. Another factor
is the current cluster size, i.e. the number of bookmarks inside that cluster. If the size is too big, the treemap used to
visualize it (see section 4) will be very crowded; if the size is too small, then space will not be efficiently used. The third
factor is the current depth of the cluster. If the cluster is too deep, the treemap will be divided into too many small areas
and it will be hard to identify each individual bookmark. To balance all above factors, we can define a threshold for each
of them, while at the same time, give users the option to interactively adjust the level of clustering.
To speed up the clustering procedure, we implement an algorithm that computes the intra/inter-cluster distances
iteratively, rather than starting from individual clusters each time. Assume at layer q, we have partition Pq = { C0 , …, Cpq-1 }, each cluster C k contains a set of bookmarks C k = { …, Bi , … }, the inter-cluster distance AEDkl between C k and Cl
and the utility measure U is given as below:
SADk = ? d ij for all Bi , Bj ? Ck, i ? j,
SANk =| Ck | * (| Ck | - 1) / 2, Ck ? Pq
(5)
SAD = ? SADk & SAN = ? SANk for all Ck ? Pq ,
AAD = SAD / SAN
(6)
SEDkl = ? d ij for all Bi ? Ck, Bj ? Cl ,
SENkl = | Ck | * | Cl |, Ck, Cl ? Pq , k ? l
(7)
SED = ? SEDkl & SEN = ? SENkl for all Ck, Cl ? Pq , k ? l,
AED = SED / SEN
(8)
AEDkl = SEDkl / SENkl, Ck, Cl ? Pq , k ? l
U q = AAD / AED
(10)
(9)
SADk and SANk are the total distance and number of edges inside Ck respectively, d ij is the distance between Bi and Bj ,
and |Ck| is the size of Ck; SAD and SAN are the total intra-cluster distance and number of edges inside Pq respectively, and
AAD is the average intra-cluster distance of Pq ; SEDkl and SENkl are the total distance and number of edges between Ck
and Cl respectively; SED and SEN are the total inter-cluster distance and number of edges inside Pq respectively, and
AED is the average inter-cluster distance of Pq . The algorithm is described as follows:
1.
Initia lize the bottom-layer partition P0 = { C0 , …, Cp-1 }, where Ck = { Bk }, k = 0…p-1, and Bk is any valid
bookmark in the bookmark pool. From the above formulas, we have:
AEDkl = d kl, Ck, Cl ? P0 , k ? l;
2.
SAD = 0, SAN = 0;
SED = ? d ij for all Bi , Bj , SEN = p * (p – 1) / 2.
In the current layer partition Pq , select cluster Cm and Cn , where AEDmn is the minimum among all AEDkl, Ck, Cl
? Pq , and merge them into a new cluster Ch . Calculate the next layer partition:
AEDkl : = AEDkl, where k, l ? m, n, h,
AEDkh : = (SEDkm + SEDkn) / (SENkm + SENkn);
SAD := SAD + SEDmn , SAN := SAN + SENmn ; SED := SED - SEDmn , SEN := SEN - SENmn ;
AAD := SAD / SAN, AED := SED / SEN, U q+1 := AAD / AED; Pq+1 := Pq – { Cm , Cn } + { Ch }.
3.
Repeat step 2 for p-1 times, until there’s only one cluster Pp-1 = { C }, where C = { B0 , …Bp-1 } contains all
bookmarks in the pool. Now we obtain all layers of partitions.
4.
Create the cluster tree with C being the root. Select partition Po with the optimal (minimal) utility Uo among all
Uq , q = 0…p -1, add its clusters as the first-level nodes to the cluster tree.
5.
Regard each cluster Ck in Po as the root of the subtree for Ck, using the knowledge of the partition layers and
formulas similar to those in step 2, calculate the optimal utility for subpartitions in Ck, and obtain its next -level
subclusters and add them to the cluster tree.
6.
Repeat step 5 until one of the thresholds for utility measure, cluster size, or cluster depth is reached.
7.
Put all invalid bookmarks in the pool in one cluster, label it as an invalid cluster and add it as a first-level node
to the cluster tree. The construction for the cluster tree is now complete.
The purpose of adding all invalid bookmarks into the cluster tree is to keep it consistent with the folder tree so that
both contain the complete set of bookmarks. As we can see in step 2, instead of recalculating all cluster distances from
scratch for the next layer partition, we reuse the results from the current layer. Besides, only the clusters affected in the
merging process need to be recalculated. This greatly reduces the computation complexity.
3.4 Cluster labeling
Each cluster needs a label to represent the semantic category of the Web pages it contains. An ideal label for a cluster
would be the keywords that are most popular in all Web pages inside it while not so frequently used outside. To factor
out Web page size when we count term frequencies, we normalize the term-page matrix by dividing each element with
the norm of its column vector. Each time we label a cluster, we remove that label from the set of selectable terms when
we label its subclusters, so that a cluster never uses the same label as its ancestors. Since the root cluster represents the
whole bookmark pool, we label it with the same name as the folder tree root, and the set of selectable terms contains all
terms in the term-page matrix. Starting from the root, we recursively label all clusters in a top-down order.
Suppose we already have cluster C labeled with term t chosen from term set T (all C ’s ancestors should have been
labeled by now), our next step is to label each subcluster Ck in C. We select from term set T’ = T – t the term tk with the
maximum frequency measure (note that all frequencies here are normalized), which is the weighted sum of three factors:
M( tk, Ck ) = a * F( tk, Ck ) – b * S( tk, Ck ) – c * F( tk, C-Ck )
(11)
Here 0 = a, b, c = 1 are weights, F( tk, Ck ) is the average frequency with which tk appears in all Web pages in Ck; S( tk,
Ck ) is the standard deviation of tk’s frequencies in Ck; F( tk, C-Ck ) is the average frequency with which tk appears in all
other subclusters in C. The first factor favors terms with a highest overall frequency in Ck. The second factor penalizes
terms with uneven frequency distribution in Ck, i.e. terms that are frequent in all Web pages are preferred over those that
are only frequent in certain pages. The third factor penalizes terms that also appear frequently outside Ck, so only terms
uniquely representative for Ck are chosen, and labels for different subclusters are dis tinguishable from each other. Among
the above three factors, the first one is more important and thus a is usually set bigger than b and c.
4. VISUALIZATION AND INTERACTION
From the data analysis phase we acquire two kinds of bookmark hierarchies, one is based on the original folder structure
inherent in the input bookmark files, the other comes from the semantic similarity and clustering results. We use
Semantic Treemaps to visualize the tree structure of these two hierarchies as well as the semantic properties of individual
bookmarks and the similarities between them.
4.1 Semantic Treemap
Semantic Treemaps are used to visualize the folder tree and the cluster tree respectively. STs use the traditional
Treemap [9] space filling technique to represent the tree structure of the best partitions by alternatively dividing
rectangles in horizontal and vertical direction, resulting in a set of nested rectangles showing the layers of nodes in the
tree. A Spring Embedding also called Force Directed Placement (FDP) algorithm is used to layout the web pages in each
Treemap rectangle according to their semantic similarities. By associating the semantic distances between data items
with the spring force coefficients similar items will be drawn close to each other and vice versa.
Note that FDP takes a long time to stabilize on large data sets. However, we use a divide-and-conquer strategy:
instead of applying the FDP algorithm to the whole data set, we take advantage of the hierarchical data structure and
calculate its layout within each subcategory, which is of much smaller size and thus manageable within reasonable
amount of time.
In the final visualization, each folder/cluster (both called category) in the tree is represented by a rectangle in the
treemap. The nesting of the rectangles represents the relationships among the subcategories. The bottom-level rectangles
serve as the containers for web pages, each of which is represented by a small dot inside its corresponding rectangle. The
area of each rectangle is in ratio with the size (total number of bookmarks) of that subcategory, wh ich helps maintain an
even density among rectangles and avoid over-crowdness in big categories. Inside each rectangle, the semantic
similarities between web pages are approximated with their 2D Euclidean distances, with semantically similar ones
placed closer.
To compute the Semantic Treemap layout, first we run a recursive procedure to calculate the positions and sizes for
all rectangles according to the composition of the hierarchy; then for all innermost rectangles, we calculate their Spring
Embedding layouts one by one using a subset of the distance matrix. Even though we might have a huge number of web
pages in the pool, there are rather few web pages in each cluster; besides we can limit the cluster size using a threshold
(as discussed in section 3.3). As a result we only need to compute the positions of a limited number of nodes during the
FDP iterations.
4.2 Visual Cues
Color and size coding is used to visualize some other properties of bookmark folders and clusters. For example, the
thickness of the rectangle frame and the size of its header are both in proportion with the rectangle's size, so upper level
categories (assuming they are of more importance) will usually have thicker frames and bigger headers and thus are more
obvious. Besides, rectangles of different levels are displayed in colors of different brightness, i.e. the further down the
nesting level, the darker the color. This gives a much clearer view of the hierarchy than plain rectangles with no frames
or color-coding. As for the bookmarks, different dot shapes represent different types of Web pages, and the size of each
dot encodes the size of the HTML document. Besides, the popularity (hotness) of a Web page is also modeled by the
saturation of its color hue. Naturally, bigger Web pages correspond to bigger dots, while pages more frequently accessed
appear in more saturated colors.
When there are many levels in the bookmark hierarchy, the Semantic Treemap might get crowded without enough
space for labels , and it could be hard for users to identify the hierarchical structure at one glance. To help users obtain an
overview of the hierarchy, we provide an expandable textual node-link tree as a site map on the left side of the Semantic
Treemap. Each non-leaf node in the tree represents a subcategory, and each leaf node represents a bookmark. While
invalid bookmarks and clusters are not shown in the Semantic Treemap they are shown with special marks in the textual
tree, reminding users to delete the obsolete links and reload the temporarily failed ones. To ensure consistency between
the textual tree and the Semantic Treemap, any operation on one of them will apply to the other as well. Both views can
be chosen to display either the folder or the cluster hierarchy, and the choices are independent of each other, e.g. users
can have both views displaying the folder hierarchy, or he can have the textual tree to show folders while the treemap to
show clusters. The latter choice can achieve some special query functions as discussed later.
4.3 Interaction Techniques
Various interaction methods are provided to further facilitate the navigation for information, including scrolling,
zooming, expanding/collapsing, filtering, searching, and selection. Among these interactions, selection and
expanding/collapsing apply to the textual tree and the Semantic Treemap at the same time, scrolling apply to both but are
independent, while zooming, filtering, and searching apply only to the treemap.
Both the textual tree and the Semantic Treemap are displayed in a scrollable panel. When the hierarchy is too big to
be shown in one frame, a user can scroll horizontally or vertically to move any part into the view port. He can also zoom
in/out the treemap to see more details or more overview. An important feature of the Semantic Treemap is that each
rectangle is expandable. To avoid over-crowdness, the user can collapse lower-level rectangles and hide them so that the
overall structure is clearer. Vice versa, he can expand a path of rectangles to see the internal structure of their
subcategories and bookmarks. The user can also expand/collapse nodes in the textual tree and the operation will
automatically apply to the treemap as well. If the user opens a dot (bookmark), it will be displayed in a special fill
pattern, and a Web browser will be brought up to show the corresponding Web page.
When a rectangle in the Semantic Treemap is pointed at (by mouse), its path (the sequence of its ancestors from itself
up to the root) will be highlighted and its detailed information will be popped up next to its header. When a node is
selected either in the tree or the treemap, it will be highlighted in the tree and its path will be highlighted in the treemap.
When a user wants to see only the bookmarks within a certain range, he can use filters to hide the unwanted ones. Three
kinds of filters are provided to select web pages based on domain type, size, or hotness. These filters can be used either
separately or conjunctly. For example, the user can filter to see only pure-text Web pages under 10MB among the top ten
hottest Web pages. The user can also use searching tools to find certain bookmarks with certain features. There are also
three ways for searching: by names, by keywords (terms that appear most frequently in a Web page), and by URL links.
For examp le, the user can type in the name of a folder and retrieve all the bookmarks in that folder; he can also search by
keywords that may represent a cluster, or he can directly type in a URL. The bookmarks retrieved from the search will be
highlighted. The search is "tolerant" in the sense that partial matching is used so that the user doesn't need to know the
exact whole string. Of course, the more complete input the user submits, the more accurate result he will get.
An interesting way to combine selecting with searching in the two bookmark hierarchy views can help a user
evaluate how accurate he organizes his bookmarks. This can be achieved in the following way. First the user can show
the cluster hierarchy in the textual tree and the folder hierarchy in the Semantic Treemap. Then he can select any cluster
in the tree and issue a special "Search Selection" command, which will enable all bookmarks in the selected cluster to be
retrieved in the treemap. From the distribution of the highlighted bookmarks, the user can find out how much his own
folder organization matches the computed semantic clustering. Vice versa, he can show the folders in the tree and the
clusters in the treemap, and test how accurate the automatic categorization match the original manual one.
To enable input and output of data, the tool also provides file operations. A user can import bookmark files from
URLs or local file systems, and export the Semantic Treemap layout into a specially formatted text file. He can also
reload updated Web pages or broken links due to network failures. Finally, the bookmark trees as well as the interaction
status of their Semantic Treemaps can be saved into a binary file enabling users to resume a particular visualization
session at a later point in time.
5. APPLICATION EXAMPLES
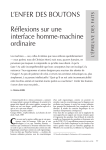
Figure 3 shows a screen shot visualizing the lead author’s personal bookmark archive. The left-side view gives the
cluster hierarchy in a link-node tree structure, which is partly expanded displaying the names of some subclusters. The
right-side view is the Semantic Treemap for the folder hierarchy. Under the root “Bookmarks for Ying Feng” we can see
three folders represented as three light green rectangles. Inside the first folder “Personal Tool Bar” there is a subfolder
with smaller header “Channels ” at the top of a darker green rectangle, inside which there are several bookmarks
represented as small blue dots. Some folders are collapsed, such as “Personal Bookmarks / Computer / Course”, whose
subfolders inside are hidden; some are expanded, such as subfolder “Research” just to the right, as we can see, its four
subfolders are shown. Among them the one called “Visualization” is selected and highlighted in pink. Inside it the
bookmark “AVL” is currently pointed at, and a small yellow dialog window is popped up near by showing its detailed
information, while all its parent folders are highlighted with white borders showing its path to the root. From the toolbar
near the top of the screen, we can see that only Web pages with size between 4KB and 10KB are shown, while all others
are filtered out and hidden. On the other hand, all links at Indiana University that are related to visualization are
highlighted in purple, as a result of the search by keywords “visualization” and URL link “Indiana”.
Figure 3. Visualization of a personal bookmark file
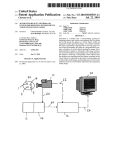
Figure 4. A shared 3-D collaborative bookmark space
To enable sharing and collaborative browsing, web page collections can be exported and visualized in a 3D desktop
virtual reality environment such as the ActiveWorlds browser as shown in Figure 4. Each bookmark is represented by a
small frame that is linked to the original Web page. The horizontal layout of the web pages is identical to the layout in
Figure 3, i.e., bookmarks on similar topics are close in space. Users can enter this virtual bookmark landscape
collaboratively, navigate freely, click on the frame to display the corresponding web page in the web browser, or answer
questions and give advice using the in-built chat facility [17].
6. CONCLUSIONS AND FUTURE WORK
Today, bookmark and favorite collections are used to create personal Web information spaces that help people remember
and retrieve interesting Web pages. This paper introduced and applied Semantic Treemaps to support users to better
organize and view their bookmark space as well as to maintain a large bookmark pool for mutual sharing among user
groups. Taking advantage of both the Spring Embedding and the Treemap algorithm, Semantic Treemaps make efficient
use of limited screen resource and make it possible to display large hierarchical bookmark sets while showing the
semantic similarities between individual bookmarks at the same time. The user interface facilitates both browsing and
retrieving.
There are several aspects that need to be improved in the future. Squarified [11] or variable-shaped [13] Treemaps
can be applied to avoid long narrow areas, so that Spring Embedding layouts can be better displayed in approximate
squares. Currently our Semantic Treemaps can visualize inter-cluster hierarchies and intra-cluster similarities. We hope
to further develop them to visualize inter-cluster similarities as well. This may be achieved by applying Spring
Embedding at the cluster level, and accommodate a layout similar to Bubblemaps [14], instead of following strictly the
slice-and-dice layout. Eventually we want to bring the bookmark visualization tool online, so that users can submit and
modify their bookmarks and browse the bookmark pool through the Internet, achieving free sharing among communities
in the real sense.
ACKNOWLEDGEMENTS
We would like to thank Jason Baumgartner for many useful suggestions on the HTML parser. The SVDPACK by M.
Berry was used for computing the singular value decomposition.
REFERENCES
1.
2.
3.
4.
5.
6.
7.
8.
9.
10.
11.
12.
13.
14.
15.
16.
17.
Deerwester, S., Dumais, S. T., Furnas, G. W., Landauer, T. K., & Harshman, R. (1990). Indexing by Latent
Semantic Analysis. Journal of the American Society For Information Science, 41, 391-407.
Berry, M. Dumais, S. T., & O’Brien, G. W. (1995). Using Linear Algebra for Intelligent Information Retrieval.
SIAM: Review, 37(4), 573-595.
Rehder, B., Schreiner, M. E., Wolfe, M. B., Laham, D., Landauer, T. K., & Kintsch, W. (1998). Using Latent
Semantic Analysis to Assess Knowledge: Some Technical Considerations. Discourse Processes, 25, 337-354.
Börner, K., Dillon, A., & Dolinsky, M. (2000). LVis - Digital Library Visualizer. Information Visualization 2000,
Symposium on Digital Libraries, London, England, 19 -21 July, pp. 77-81.
Battista, G., Eades, P., Tamassia, R., & Tollis, I.G. (1994). Algorithms for Drawing Graphs: an Annotated
Bibliography. Computational Geometry: Theory and Applications, 4 (5), pp. 235-282.
Kumar, A. & Fowler, R.H. (1996). A Spring Modeling Algorithm to Position Nodes of an Undirected Graph in
Three Dimensions. Technical Report Department of Computer Science, University of Texas – Pan American.
Huang, M., Eades, P., & Wang, J. (1998). On -Line Animated Visualization of Huge Graphs Using a Modified
Spring Algorithm. Journal of Visual Languages and Computing (Academic Press), volume 9, No.6, pages 623-645.
Chen, C. (1999). Visualizing Semantic Spaces and Author Co-Citation Networks in Digital Libraries. Information
Processing and Management 35, 401-420.
Shneiderman, B. (1992). Tree Visualization with Treemaps: 2D Space-Filling Approach. ACM Transactions on
Graphics 11, 1 (Jan. 1992), 92 - 99.
Asahi, T., Turo, D., & Shneiderman, B. (1994). Using Treemaps to Visualize the Analytic Hierarchy Process.
Technical Report CAR-TR-719, Department of Computer Science, University of Maryland, College Park, MD.
Van Wijk, J. & Van de Wetering, H. (1999). Cushion Treemaps: Visualization of Hierarchical Information. IEEE
Symposium on Information Visualization (INFOVISí99).
Stasko, J., & Zhang, E. (2000). Focus+Context Display and Navigation Techniques for Enhancing Radial. SpaceFilling Hierarchy Visualizations, Graphics, Visualization, and Usability Center, Georgia Institute of Technology,
Atlanta, GA, Technical Report GIT-GVU-00-12, August 2000.
Vernier, F. & Nigay, L. (2000). Modifiable Treemaps Containing Variable-Shaped Units.
http://iihm.imag.fr/publs/2000/Visu2K_Vernier.pdf.
Bederson, B., Shneiderman, B., & Jones, D. Ordered and Quantum Treemaps: Making Effective Use of 2D Space
to Display Hierarchies. To be published in ACM Transactions on Graphics in 2002.
Pitkow, J. (1996). GVU’s 5th WWW User Survey. http://www.cc.gatech.edu/gvu/user_survey/suyvey-04-1996.
Abrams, D., Baecker, R. & Chignell, M. Information Archiving with Bookmarks: Personal Web Space Construction
and Organization. In: ACM SIGCHI Conference on Human Factors in Computing Systems, CHI 98, Los Angeles,
California April 18-23, 1998.
Börner, K. Using Twin Worlds to Research Digital Cities and Their Evolving Communities. The Second Kyoto
Meeting on Digital Cities Digital Cities 2001, International Symposium and Workshop, Kyoto, Japan, October 1820, 2001.