1
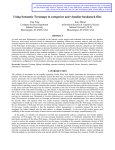
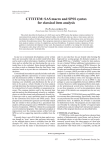
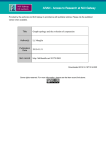
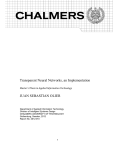
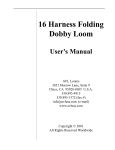
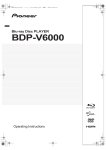
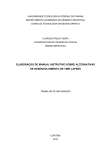
Behavior Research Methods 2009, 41 (1), 128-136 doi:10.3758/BRM.41.1.128 ConceptBuilder: An open-source software tool for measuring, depicting, and quantifying causal models Nancy S. Kim Northeastern University, Boston, Massachusetts and Edward Y. Park athenahealth, Inc., Watertown, Massachusetts Measurements of people’s causal and explanatory models are frequently key dependent variables in investigations of concepts and categories, lay theories, and health behaviors. A variety of challenges are inherent in the pen-and-paper and narrative methods commonly used to measure such causal models. We have attempted to alleviate these difficulties by developing a software tool, ConceptBuilder, for automating the process and ensuring accurate coding and quantification of the data. In this article, we present ConceptBuilder, a multiple-use tool for data gathering, data entry, and diagram display. We describe the program’s controls, report the results of a usability test of the program, and discuss some technical aspects of the program. We also describe ConceptAnalysis, a companion program for generating data matrices and analyses, and ConceptViewer, a program for viewing the data exactly as drawn. Causal and explanatory models form an important component of people’s real-life mental representations of concepts (Ahn, 1998; Anderson & Lindsay, 1998; Dweck, 1996; Gopnik, 2000; Keil, 2006; Murphy, 2000; Rehder & Hastie, 2001; Thagard, 1999; Vosniadou, 1994; Wisniewski & Medin, 1994). Cognitive psychologists, social psychologists, and cognitive anthropologists alike have attempted to measure people’s causal models for such diverse concepts as natural kinds and artifacts (McNorgan, Kotack, Meehan, & McRae, 2007; Rein, Love, & Markman, 2007; Rozenblit & Keil, 2002; Sloman, Love, & Ahn, 1998); emotional states (Furnham, Cheng, & Shirasu, 2001; Lunt, 1991); behaviors (Fletcher, 1995; Malle, 2004); social groups (Haslam & Levy, 2006; Haslam, Rothschild, & Ernst, 2000; Sommers & Norton, 2006; Wittenbrink, Hilton, & Gist, 1998); racial groups (Hirschfeld, 1995, 1996); individuals (Vasilyeva & Coley, 2008); management problems (LangfieldSmith & Wirth, 1992; Markóczy & Goldberg, 1995); issues concerning economics, law, justice, and education (Furnham, 1988); and medical and mental disorders and their treatments (Baumann, 2003; Furnham, 1995; Furnham & Bower, 1992; Furnham & Hume-Wright, 1992; Haslam & Ernst, 2002; Houts, 1984; Kim & Ahn, 2002; Kleinman, 1995; Leventhal, Meyer, & Nerenz, 1980; Lynch & Medin, 2006; MacFarlane & Kelleher, 2002; Matschinger & Angermeyer, 1996; Meyer, Leventhal, & Gutmann, 1985; Morton & Frith, 1995; Pennebaker & Epstein, 1983; Pistrang & Barker, 1992; Wong, 1994), to name a few. This article describes a new software tool, ConceptBuilder, which is designed to depict and quantify causal models of concepts. ConceptBuilder has multiple uses: It can be used as a data-gathering tool with which study participants can draw their own causal models, a dataentry tool that can be used by researchers to code verbally reported causal models (oral or written), and a diagramdisplay tool for use in experiments and in written reports of experiments. Particularly with respect to the first function, measuring people’s causal structures can be a laborious process in which beliefs are often either measured as responses on 5-point Likert scales or gathered as full narratives that cannot easily be quantified or compared systematically across individuals. Anthropac, which is tailored for use in cultural anthropology, can be used for narrative data, but because it is not specifically intended for use by study participants in an experimental psychology setting, it cannot easily be used by study participants to depict causal structures directly; in addition, it is only available for a fee.1 ConceptBuilder was designed to adopt some of the advantages of both Likert scales and narrative methods: The measurements capture much of the complexity of fuller explanations but can also be quantified and compared with relative speed and ease. N. S. Kim, [email protected] © 2009 The Psychonomic Society, Inc. 128 ConceptBuilder 129 Specifically, ConceptBuilder automates a task commonly used to assess people’s beliefs about the causal relationships between features of a concept. For example, a person’s concept of strep throat may not only include the features strep bacteria and sore throat, but also include the causal relationship between the features (e.g., strep bacteria cause sore throat). A typical pen-and-paper task involves showing study participants the features of the concept, usually encased in circles or rectangles, on a large piece of paper. Study participants are then asked to draw arrows indicating causal or dependency relations between features, including the strength of each relation (e.g., numerically, so that 1 5 weak, 2 5 moderate, and 3 5 strong, or by color coding arrows to indicate relational strength; see Kim & Ahn, 2002; Rein et al., 2007; Sloman et al., 1998). One difficulty participants may encounter in using this pen-and-paper method is that features cannot be moved around. An alternate method involves giving people paper slips that can be relocated on the page (e.g., Kim & Ahn, 2002), but for concepts with large numbers of features, this can quickly become unwieldy. Furthermore, recoding diagrams into numerical form is time consuming and daunting, particularly when many participants, multiple separate concepts, and/or large numbers of features for each concept are used. In addition, manual coding of the data can be prone to errors, and multiple coders may be needed to ensure accuracy of transcription. In some cases, messiness in the participants’ drawings can render diagrams unreadable in places. Using ConceptBuilder may help eliminate all of these difficulties. In this article, we describe the features of ConceptBuilder and its companion programs for data viewing (ConceptViewer) and analysis (ConceptAnalysis). We then report the results of usability testing, discuss some technical aspects of the software, and explain how to obtain and use these open-source software programs legally. Features of ConceptBuilder In ConceptBuilder, the features of a concept appear on a screen as labels on small boxes (see Figure 1). With a mouse, users may move the features to any location on the screen. Mouse clicks allow users to draw arrows between features, depicting the users’ beliefs about causal links. Users are instructed to click on the cause feature first (pressing the Control key to select it), and then click on the effect. The program draws an arrow pointing from the selected cause to the selected effect. Users may move the feature boxes to any location at any time; even arrows that have already been drawn dynamically follow the feature whenever it is moved. Arrows always float above boxes when arrows and boxes cross. Furthermore, regardless of whether arrows cross or boxes overlap on the screen, the data are still recorded accurately. If users so choose, they Figure 1. A screenshot of ConceptBuilder depicting a study participant’s causal model of depression. Note that even if the participant chooses to place the features so that arrows and strengths are not clearly visible to the eye (as often happens in pen-and-paper diagrams), all the information is still recorded accurately in the data file. ConceptViewer also allows users to review the exact diagrams drawn, such as the one depicted here. 130 Kim and Park A B C D E Figure 2. Screenshots of the pop-up screens in ConceptBuilder for (panel A) selecting a causal strength for an arrow just drawn, (panel B) changing the causal strength of an arrow or deleting the arrow, (panel C) moving on to the next set or concept, (panel D) rating confidence in the causal model just drawn, and (panel E) finishing the experiment. Pop-up screens are superimposed over the main ConceptBuilder screen and disappear when a choice is made or when the red X in the upper right-hand corner of the pop-up is clicked. can also draw bidirectional arrows using the same procedure described above. After an arrow is drawn, a popup screen immediately asks the user to assign a causal strength rating to the arrow (e.g., 1 5 weak relationship, 2 5 moderate relationship, and 3 5 strong relationship; see Figure 2A).2 Different strengths or the same strength can be assigned to the different arrows in a bidirectional relationship. Once a strength is assigned, it appears alongside the arrow as a number on the screen. By clicking again on an arrow, users may also open a pop-up screen ConceptBuilder 131 [DESCRIPTION] Below are the symptoms and associated features of DEPRESSION, as described in the Diagnostic and Statistical Manual of Mental Disorders (4th ed., text revision). Your task is to draw a diagram of your beliefs about how the different symptoms are related to each other. [FEATURES] Feelings of worthlessness / excessive guilt Depressed mood Sleep disturbances Fatigue or loss of energy Indecisiveness or difficulty in concentrating Marital, occupational, or academic problems Less satisfying social interactions Decrease or increase in weight Anxiety or phobias Excessive worry over physical health Lasts for at least 2 weeks Brooding or obsessive rumination Difficulties in sexual functioning Tearfulness Lack of pleasure in daily activities Restlessness or unusual slowness Ideas/plans of suicide or suicide attempts Figure 3. The lines of code in the configuration file specifying the features of the concept and the corresponding instruction header for the ConceptBuilder task screen shown in Figure 1. that asks whether they would like to change the causal strength rating assigned to the arrow (see Figure 2B). This pop-up screen also gives users the option of deleting an existing arrow. Multiple concepts can also be presented in sequence.3 For multiple drawings, the user is instructed to click on a button labeled “Next Set” when ready to move on to the next concept. When this button is clicked, a pop-up screen is immediately launched, asking, “Are you sure that you are finished and would like to move on to the next set?” (see Figure 2C). Users can then opt either to return to the diagram just completed or to go on to the next set. Different, identical, or no instructions may also be presented at the top of the screen for each concept. After each causal drawing, the participants are prompted to rate their confidence in the diagram on a Likert scale (e.g., on a scale of 1–9, where 1 5 not at all confident and 9 5 very confident; see Figure 2D). The confidence rating prompt appears as a pop-up screen after the participant confirms that he or she is ready to move on to the next concept. When a participant clicks on “Next Set” for the last concept in the experiment, a final pop-up screen indicates that the experiment has been completed (see Figure 2E). The experimenter can set several key parameters of a ConceptBuilder experiment; a configuration file is included for this purpose. Specifically, the experimenter can set the range of values for the causal strength rating (e.g., changing the 3-point scale to a 5-point scale, or omitting the request for strength ratings; Figure 2A) and the range of values for the confidence rating scale (e.g., changing the 9-point scale to a 7-point scale, or omitting the confidence ratings; Figure 2D). The experimenter may also set whether features appear in randomized order on the screen or in a fixed order specified by the experimenter. The experimenter can also specify whether the concepts themselves will appear in randomized order for each participant or in the order specified by the experimenter. Finally, experimenters themselves can also draw causal models to be shown to study participants by setting the feature lists and instructions as desired and completing the task themselves. Screenshots can be taken of experimenter-drawn causal models in ConceptBuilder and used as standard image files for pen-and-paper tasks or in other software. ConceptViewer and ConceptAnalysis: Viewing and Working With the Data The data are recorded in an automatically generated folder labeled with the participant’s name or number, typed by the experimenter into the first screen at the start of the experiment. Even after the study has been completed and closed, experimenters can review the actual diagrams with the participant-drawn spatial layout of features preserved intact. By launching ConceptBuilder and re-entering the relevant participant’s name or number, they can also allow participants to go back and change their diagrams. If experimenters do not wish to relaunch the entire set of data for a participant and simply wish to 132 Kim and Park Figure 4. ConceptAnalysis numerical output for the same causal model depicted in Figure 1. view a specific diagram, they can use a companion piece of software, ConceptViewer, to view a previous diagram exactly as drawn by the participant. Separate files are automatically created for each concept. Confidence ratings for each concept are also recorded in separate files. To aid in viewing the ConceptBuilder data in numerical form, we have also designed a second companion piece of software, ConceptAnalysis, with the following capabilities: 1. ConceptAnalysis outputs data in standard commadelimited (e.g., csv) format, which can be imported into Microsoft Excel or other tools for viewing and analysis (e.g., see Figure 4 for the data output corresponding to the causal model in Figure 1). Data appear in the form of n 3 n adjacency matrices, where n is the number of features in the concept and features act as causes in rows and as effects in columns. For example, if a person draws a causal link between feature i and feature j, so that feature i causes feature j with a strength of 3, in the data output file the number 3 will appear in the adjacency matrix in the cell at the intersection of row i and column j. If, on the other hand, no causal link is drawn between feature i and feature j, then the number 0 will appear in the intersection cell instead. An arbitrary stable constant, the number 1, is automatically assigned to all cells in the diagonal of the adjacency matrix. For ease of interpretation, feature labels also appear automatically in the data output.4 2. When applied to more than one causal model, Concept Analysis presents both the individual adjacency matrices (i.e., one for each individual causal model) and an averaged adjacency matrix collapsing the information across all participants’ causal models for the same concept. 3. ConceptAnalysis can calculate an ordering of features from most central to least central using the following algorithm developed by Sloman et al. (1998): ci,t11 5 Σj dij cj,t , (1) where dij is a positive number that represents how strongly feature j depends on feature i, and cj,t is the conceptual centrality of feature j at time t. This algorithm generates a stable ordering within a small number of iterations.5 In previous studies, this algorithm provided the best fit to human response data (Sloman et al., 1998). ConceptAnalysis can generate centrality rankings for each individual adjacency matrix, as well as for the averaged adjacency matrix across participants (described above). Of course, other calculations can be performed on the data (e.g., Rein et al., 2007), and these may be carried out on the raw adjacency matrices from the ConceptAnalysis output at the discretion of the user. User Feedback As mentioned earlier, ConceptBuilder can be used for multiple purposes. We have used the software alternately as a data-gathering tool with which study participants can generate and report their own causal models, a data-entry tool with which causal models reported by participants in narrative form are recoded into data files using the software, and a diagram-display tool with which causal models can be drawn and shown to study participants. However, it is not yet clear whether ConceptBuilder would be considered to be user friendly by individuals who are not programmers or researchers. Because ConceptBuilder’s effectiveness as a data-gathering tool in particular depends on its usability by participant populations commonly em- ConceptBuilder 133 ployed in experimental studies, we carried out usability testing with undergraduate students. To get a general sense of the ease with which the software can be learned in an experimental setting, we asked undergraduate students to use ConceptBuilder to draw their beliefs of how the features of concepts cause and maintain each other, and then asked them questions about their experience using the program. Because previous work (Kim & Ahn, 2002) has shown that even people untrained in clinical psychology are adept at drawing causal beliefs for disorders, we used mental disorder concepts (depression and anorexia). We abbreviated and simplified the features for each concept from the Diagnostic and Statistical Manual of Mental Disorders (4th ed., text revision; American Psychiatric Association, 2000) diagnostic criteria and characteristic features. (For an example, see Figure 1 for the features we used for depression; see also McRae, Cree, Seidenberg, & McNorgan, 2005, for normed feature lists for an enormous variety of living and nonliving concepts that could also be used as features in ConceptBuilder). In the present study, 24 undergraduate students (14 female) from a variety of majors took part in exchange for partial introductory psychology course credit. Participants were given a sheet of instructions (see the Appendix) and practiced using the controls with a sample concept (phobia). When participants felt comfortable using the controls, they were then asked to draw their two diagrams for the main study in randomized order. A sample diagram depicting a participant’s concept of depression is shown in Figure 1. Immediately afterward, participants completed a pen-andpaper questionnaire in which they were polled about the usability of ConceptBuilder, their prior computer experience, and demographic information about themselves. Participants were allowed unlimited time to complete the study but chose to spend only a mean of 4.04 min (SD 5 1.89 min) in the training phase; all participants spent less than 10 min in training. Participants used the program for a mean total of 21.26 min (SD 5 8.62 min), including training and the two concepts for the main study. After the ConceptBuilder study, participants rated themselves as being quite comfortable with the program (M 5 1.88, SD 5 1.08, on a scale of 1–5, where 1 5 comfortable and 5 5 uncomfortable). Ratings differed significantly from the midpoint rating of 3 [t(23) 5 5.12, p , .001]. Participants also rated the program as fairly easy to use overall (M 5 1.75, SD 5 0.94, on a scale of 1–5, where 1 5 easy and 5 5 difficult). Ratings differed significantly from the midpoint [t(23) 5 6.49, p , .001]. Furthermore, on the same scale, they rated separately how easy or difficult it was to use each of the five main controls of ConceptBuilder. All individual program controls were rated as quite easy to use: For create arrow, M 5 1.58, SD 5 0.97; for edit arrow weight, M 5 1.79, SD 5 0.98; for delete arrow, M 5 1.96, SD 5 1.23; move blocks, M 5 1.21, SD 5 0.51; and for move to the next set, M 5 1.33, SD 5 0.64. Ratings for all five of the above individual program controls differed significantly from the midpoint (all ts $ 4.14, all ps , .001). The instructions (see the Appendix) helped participants understand how to use the program relatively well (M 5 1.79, SD 5 0.83, on a scale of 1–5, where 1 5 well and 5 5 poorly). Ratings differed significantly from the midpoint [t(23) 5 7.11, p , .001]. Participants also reported that it was fairly easy to understand the instructions (M 5 2.04, SD 5 0.91, on a scale of 1–5, where 1 5 easy and 5 5 difficult). Ratings differed significantly from the midpoint [t(23) 5 5.17, p , .001]. Although only 2 were computer science majors, our participants were quite comfortable with routine computer use; all said that they used a computer daily. Participants were also comfortable with using computers in general (M 5 1.04, SD 5 0.20, on a scale of 1–5, where 1 5 comfortable and 5 5 uncomfortable). Ratings differed significantly from the midpoint [t(23) 5 18.65, p , .001]. Thus, these usability results should be interpreted in the context of this participant population. Finally, we also quantified two basic characteristics of the actual causal models participants drew using ConceptBuilder in this usability study and of the pen-and-paper causal models drawn by 20 Yale undergraduates in Study 1 of Kim and Ahn (2002). The data from these two studies were collected at different points in time and from different university populations, so the following two comparisons should be interpreted with some caution. However, because the exact same concepts and features were used in the two studies, these comparisons may be informative to experimenters considering crossing over from the pen-and-paper method to ConceptBuilder. First, there was a tendency for people to draw more causal links in total in ConceptBuilder (M 5 19.30 links per concept, SE 5 2.26) than in a pen-and-paper task (M 5 12.85, SE 5 1.26) [t(41) 5 2.39, p 5 .02]. Experimenters who wish to compare ConceptBuilder results to the results of previous pen-and-paper studies may want to take this into account, depending on the particular situation. Second, the rankordered centralities obtained in each task (as calculated by Equation 1) were generally comparable overall, as evidenced by positive Spearman correlation coefficients for the comparison between the averaged matrix rank-order calculations of the ConceptBuilder data versus those of the pen-and-paper data [for depression, rs(18) 5 .69, p , .01; for anorexia, rs(17) 5 .41, p 5 .10]. Technical Discussion ConceptBuilder, ConceptAnalysis, and ConceptViewer were developed using Tcl/Tk (Welch, Jones, & Hobbs, 2003) and Perl (Wall, Christiansen, & Orwant, 2000). Tcl/Tk and Perl are standard, widely used scripting languages; as a result, ConceptBuilder and ConceptAnalysis can be run on every major platform, including Microsoft Windows, Macintosh OS X, and Linux. Specifically, on Windows, ConceptBuilder, ConceptAnalysis, and ConceptViewer can be run under the ActiveTcl and ActivePerl interpreters, both available free of charge at www.activestate.com. Users of Macintosh computers with OS X already have the necessary Tcl/Tk and Perl interpreters preinstalled. 134 Kim and Park Because ConceptBuilder, ConceptAnalysis, and onceptViewer were developed using standard scriptC ing languages, the programs themselves are simply text files that can be edited using a standard text editor such as WordPad or TextEdit. Basic changes, such as modifying the lists of features, adjusting experimental parameters, and changing the ConceptBuilder screen size, feature box sizes, and font size, can be carried out by nonprogrammers in the included configuration file. For example, Figure 3 depicts a portion of the configuration file corresponding to the list of features and instructions header for the concept shown in Figure 1; researchers can easily edit these values to configure the program to suit their needs. As can be seen in Figure 3, any number of features can be entered by the experimenter.6 The output of ConceptBuilder and ConceptAnalysis is stored in similarly straightforward text files. Concept Builder creates a folder containing the participant’s data for each causal model that the participant is asked to draw. ConceptBuilder generates a text file within that folder that contains the instructions necessary for relocating a specific causal model produced by a participant. For example, for Subject 1, Concept 0, the data are stored in subject1/0.tcl. After the desired number of participants have completed the task, ConceptAnalysis parses the output in these folders and generates final output in a standard comma-delimited (e.g., csv) format. Software Access and Licensing Information ConceptBuilder (including the configuration file), ConceptAnalysis, and ConceptViewer are copyrighted programs released under the GNU General Public License (see www.gnu.org/licenses/). Copies of these programs may be downloaded along with basic instructions at www.psych .neu.edu/faculty/n.kim/CCLsoftware.html. Under the terms of the license, users are free to correct bugs, extend the code, and/or adapt the code to meet their own needs, but must leave the copyright information in the code intact. Users may not sell ConceptBuilder, ConceptAnalysis, and/or ConceptViewer for profit, nor may they sell modifications of ConceptBuilder, ConceptAnalysis, and/or ConceptViewer for profit; all adaptations made to the software must also be free to the public. Users are required to cite this article in manuscripts, presentations, and reports for which ConceptBuilder, ConceptAnalysis, and/or ConceptViewer are used. Author note N.S.K. contributed primarily to manuscript writing and usability testing, and E.Y.P. contributed primarily to software development. We thank Kristyna Reisberg and Sarah Augliera for help in running experimental sessions, Margaret Pierce for assistance with library research, and Daniel Noonan for proofreading this article. Technical questions may be e-mailed to [email protected]. Correspondence concerning this article should be directed to N. S. Kim, Department of Psychology, 125 NI, Northeastern University, 360 Huntington Ave., Boston, MA 02115-5000 (e-mail: [email protected]). References Ahn, W. K. (1998). Why are different features central for natural kinds and artifacts? The role of causal status in determining feature centrality. Cognition, 69, 135-178. American Psychiatric Association (2000). Diagnostic and statistical manual of mental disorders (4th ed., text rev.). Washington, DC: Author. Anderson, C. A., & Lindsay, J. J. (1998). The development, perseverance, and change of naive theories. Social Cognition, 16, 8-30. Baumann, L. C. (2003). Culture and illness representation. In L. D. Cameron & H. Leventhal (Eds.), The self-regulation of health and illness behaviour (pp. 242-253). London: Routledge. Dweck, C. S. (1996). Implicit theories as organizers of goals and behavior. In P. M. Gollwitzer & J. A. Bargh (Eds.), The psychology of action: Linking cognition and motivation to behavior (pp. 69-90). New York: Guilford. Fletcher, G. (1995). The scientific credibility of folk psychology. Mahwah, NJ: Erlbaum. Furnham, A. (1988). Lay theories: Everyday understanding of problems in the social sciences. Oxford: Pergamon. Furnham, A. (1995). Lay beliefs about phobia. Journal of Clinical Psychology, 51, 518-525. Furnham, A., & Bower, P. (1992). A comparison of academic and lay theories of schizophrenia. British Journal of Psychiatry, 161, 201-210. Furnham, A., Cheng, H., & Shirasu, Y. (2001). Lay theories of happiness in the East and West. Psychologia, 44, 173-187. Furnham, A., & Hume-Wright, A. (1992). Lay theories of anorexia nervosa. Journal of Clinical Psychology, 48, 20-36. Gopnik, A. (2000). Explanation as orgasm and the drive for causal knowledge: The function, evolution, and phenomenology of the theory formation system. In F. C. Keil & R. A. Wilson (Eds.), Explanation and cognition (pp. 299-323). Cambridge, MA: MIT Press. Haslam, N., & Ernst, D. (2002). Essentialist beliefs about mental disorders. Journal of Social & Clinical Psychology, 21, 628-644. Haslam, N., & Levy, S. R. (2006). Essentialist beliefs about homosexuality: Structure and implications for prejudice. Personality & Social Psychology Bulletin, 32, 471-485. Haslam, N., Rothschild, L., & Ernst, D. (2000). Essentialist beliefs about social categories. British Journal of Social Psychology, 39, 113-127. Hirschfeld, L. A. (1995). Do children have a theory of race? Cognition, 54, 209-252. Hirschfeld, L. A. (1996). Race in the making: Cognition, culture, and the child’s construction of human kinds. Cambridge, MA: MIT Press. Houts, A. C. (1984). Effects of clinician theoretical orientation and patient explanatory bias on initial clinical judgments. Professional Psychology: Research & Practice, 15, 284-293. Keil, F. C. (2006). Explanation and understanding. Annual Review of Psychology, 57, 227-254. Kim, N. S., & Ahn, W. K. (2002). The influence of naive causal theories on lay concepts of mental illness. American Journal of Psychology, 115, 33-65. Kleinman, A. (1995). Writing at the margin: Discourse between anthropology and medicine. Berkeley: University of California Press. Langfield-Smith, K., & Wirth, A. (1992). Measuring differences between cognitive maps. Journal of the Operational Research Society, 43, 1135-1150. Leventhal, H., Meyer, D., & Nerenz, D. (1980). The common sense representation of illness danger. In S. Rachman (Ed.), Contributions to medical psychology (Vol. 2, pp. 7-30). New York: Pergamon. Lunt, P. K. (1991). The perceived causal structure of loneliness. Journal of Personality & Social Psychology, 61, 26-34. Lynch, E., & Medin, D. (2006). Explanatory models of illness: A study of within-culture variation. Cognitive Psychology, 53, 285-309. MacFarlane, A., & Kelleher, C. (2002). Concepts of illness causation and attitudes to health care among older people in the Republic of Ireland. Social Science & Medicine, 54, 1389-1400. Malle, B. F. (2004). How the mind explains behavior: Folk explanations, meaning, and social interaction. Cambridge, MA: MIT Press. Markóczy, L., & Goldberg, J. (1995). A method for eliciting and comparing causal maps. Journal of Management, 21, 305-333. Matschinger, H., & Angermeyer, M. C. (1996). Lay beliefs about the ConceptBuilder 135 causes of mental disorders: A new methodological approach. Social Psychiatry & Psychiatric Epidemiology, 31, 309-315. McNorgan, C., Kotack, R. A., Meehan, D. C., & McRae, K. (2007). Feature–feature causal relations and statistical co-occurrences in object concepts. Memory & Cognition, 35, 418-431. McRae, K., Cree, G. S., Seidenberg, M. S., & McNorgan, C. (2005). Semantic feature production norms for a large set of living and nonliving things. Behavior Research Methods, 37, 547-559. Meyer, D., Leventhal, H., & Gutmann, M. (1985). Common-sense models of illness: The example of hypertension. Health Psychology, 4, 115-135. Morton, J., & Frith, U. (1995). Causal modeling: A structural approach to developmental psychopathology. In D. Cicchetti & D. J. Cohen (Eds.), Developmental psychopathology: Vol. 1. Theory and methods (pp. 357-390). New York: Wiley. Murphy, G. L. (2000). Explanatory concepts. In F. C. Keil & R. A. Wilson (Eds.), Explanation and cognition (pp. 361-392). Cambridge, MA: MIT Press. Pennebaker, J. W., & Epstein, D. (1983). Implicit psychophysiology: Effects of common beliefs and idiosyncratic physiological responses on symptom reporting. Journal of Personality, 51, 468-496. Pistrang, N., & Barker, C. (1992). Clients’ beliefs about psychological problems. Counseling Psychology Quarterly, 5, 325-335. Rehder, B., & Hastie, R. (2001). Causal knowledge and categories: The effects of causal beliefs on categorization, induction, and similarity. Journal of Experimental Psychology: General, 130, 323-360. Rein, J. R., Love, B. C., & Markman, A. B. (2007). Feature relations and feature salience in natural categories. Proceedings of the 29th Annual Conference of the Cognitive Science Society (pp. 593-598). Mahwah, NJ: Erlbaum. Rozenblit, L., & Keil, F. (2002). The misunderstood limits of folk science: An illusion of explanatory depth. Cognitive Science, 26, 521-562. Sloman, S. A., Love, B. C., & Ahn, W. K. (1998). Feature centrality and conceptual coherence. Cognitive Science, 22, 189-228. Sommers, S. R., & Norton, M. I. (2006). Lay theories about white racists: What constitutes racism (and what doesn’t). Group Processes & Intergroup Relations, 9, 117-138. Thagard, P. (1999). How scientists explain disease. Princeton: Princeton University Press. Vasilyeva, N. Y., & Coley, J. D. (2008, February). Representations of human kinds and individuals. Poster presented at the annual meeting of the American Association for the Advancement of Science, Boston, MA. Vosniadou, S. (1994). Capturing and modeling the process of conceptual change. Learning & Instruction, 4, 45-69. Wall, L., Christiansen, T., & Orwant, J. (2000). Programming Perl (3rd ed.). Sebastopol, CA: O’Reilly & Associates. Welch, B. B., Jones, K., & Hobbs, J. (2003). Practical programming in Tcl and Tk (4th ed.). Upper Saddle River, NJ: Prentice Hall. Wisniewski, E. J., & Medin, D. L. (1994). On the interaction of theory and data in concept learning. Cognitive Science, 18, 221-281. Wittenbrink, B., Hilton, J. L., & Gist, P. L. (1998). In search of similarity: Stereotypes as naive theories in social categorization. Social Cognition, 16, 31-55. Wong, J. L. (1994). Lay theories of psychotherapy and perceptions of therapists: A replication and extension of Furnham and Wardley. Journal of Clinical Psychology, 50, 624-632. Notes 1. Similarly, Bayesian network software can depict causal models, but generating tables of prior and conditional probabilities may not be a feasible task for study participants. For models with more than just a few features, such judgments quickly become extremely difficult to make. 2. Simply exiting from that pop-up screen will automatically assign the scale midpoint rating 2 to that arrow. 3. ConceptBuilder’s default settings will randomize the order of concepts presented for each participant. 4. In the feature labels in the ConceptAnalysis output (Figure 4), the marker “\n” denotes a line break in the boxed features depicted visually in ConceptBuilder (Figure 1). 5. In essence, this calculation ranks features such that a feature becomes more central when it causes more features with greater strength. Features caused both directly and indirectly are incorporated into the calculation. Note that the absolute values of the Equation 1 calculations shown in Figure 4 are not meaningful; instead, the rank ordering of those values (where the highest absolute value corresponds to the most central feature in the causal model) indicates the relative centralities of features. 6. In addition, more advanced changes, such as using a different centrality algorithm, can be accomplished by novice programmers. Appendix Sample ConceptBuilder Instructions WELCOME TO THE EXPERIMENT! In this task, you will be drawing a diagram of your beliefs about how the different symptoms of a mental disorder are related to each other. You will be drawing a diagram for each of two different mental disorders: anorexia and depression. Please ask the experimenter at any time if you come across a term with which you are unfamiliar, and she will give you the definition. First, please practice the task using the sample disorder currently on the screen: (1) Read through the symptoms of the disorder. You can move a symptom around by clicking on it with the mouse and dragging it to the location of your choice. (Please try it now.) (2) Then, for every symptom X that causes a symptom Y, please draw an arrow between the two symptoms pointing from cause to effect. For instance, if you believe that symptom X causes symptom Y, draw the following: X Y You can draw an arrow by holding down the “Ctrl” key while clicking on the cause symptom and then (still holding down the “Ctrl” key) clicking on the effect symptom. (Please try it now, and ask the experimenter if you have questions.) You may also draw bidirectional arrows (e.g., if you believe that Y and X cause each other). To deselect a symptom, just release “Ctrl” and click on the symptom again. (3) As soon as you complete an arrow, you will be prompted to assign a strength rating to that arrow indicating the strength of the causal relationship between X and Y on a scale of 1–3 (where 1 5 weak, 2 5 moderate, and 3 5 strong). 136 Kim and Park Appendix (Continued) (4) You can delete an arrow by clicking on it again and selecting the appropriate button. (Please try it now, and ask the experimenter if you have questions.) When you are comfortable with the program, please ask the experimenter to launch the real experiment. Using the commands above, please draw a diagram for each of the two disorders. Please take as much time as you need to complete this task carefully. Please feel free to ask the experimenter questions now or at any time, and when you are ready, please turn to the screen and begin. (Manuscript received April 18, 2008; revision accepted for publication July 21, 2008.)