1
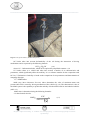
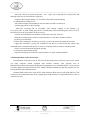
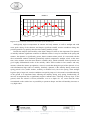
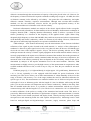
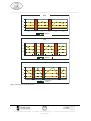
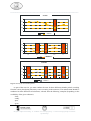
___________________________________________________________________________
WORKBOOK
TERRAMECHANICS
AND OF – ROAD VEHICLES
LUBLIN 2014
Projekt współfinansowany ze środków Unii Europejskiej w ramach Europejskiego Funduszu
Społecznego
___________________________________________________________________________
Author: Jarosław Pytka
Desktop publishing: Jarosław Pytka
Technical editor: Jarosław Pytka
Figures: Jarosław Pytka
Cover and graphic design: Jarosław Pytka
All rights reserved.
No part of this publication may be scanned, photocopied, copied or distributed in any form,
electronic, mechanical, photocopying, recording or otherwise, including the placing or
distributing in digital form on the Internet or in local area networks,
without the prior written permission of the copyright owner.
Publikacja współfinansowana ze środków Unii Europejskiej w ramach Europejskiego
Funduszu Społecznego w ramach projektu
Inżynier z gwarancją jakości – dostosowanie oferty Politechniki Lubelskiej
do wymagań europejskiego rynku pracy
© Copyright by
Jarosław Pytka, Lublin University of Technology
Lublin 2014
First edition
Projekt współfinansowany ze środków Unii Europejskiej w ramach Europejskiego Funduszu
Społecznego
___________________________________________________________________________
TABLE OF CONTENTS
TABLE OF CONTENTS
1.
DETERMINATION OF OFF-ROAD MOBILITY INDEXEX
1.1. Introduction
1.2. Methods for determining the traction properties of the deformable substrate
3
5
5
6
1.3
Mobility indexes in off-road conditions
8
1.4
Determination of the mobility indexes – carrying out of the exercise
11
DETERMINATION OF THE STRESS AND DEFORMATION STATE IN THE
DEFORMABLE SUBSTRATE
Introduction
SST head
Conducting the measurement
Determination of the stress state
DETERMINING FIELD PERFORMANCE OF THE OFFROAD VEHICLE
Introduction
The effect of climate conditions on the mobility
Measurement of the soil humidity using the TDR method
Performance of the exercise
12
2.
2.1
2.2
2.3
2.4
3.
3.1
3.2
3.3
3.4
Projekt współfinansowany ze środków Unii Europejskiej w ramach Europejskiego Funduszu
Społecznego
12
12
13
17
18
18
18
20
22
___________________________________________________________________________
Projekt współfinansowany ze środków Unii Europejskiej w ramach Europejskiego Funduszu
Społecznego
___________________________________________________________________________
1. DETERMINATION OF OFF-ROAD MOBILITY INDEXES
1.1 Introduction
It is estimated that 35% of Polish roads has no paved surface ready for normal driving. They also
include public roads: access roads, internal roads.
A separate problem is the mobility of vehicles in the field, on soft surfaces. This applies to
military, specialized and agricultural vehicles. In these cases we have to deal with other factors that
affect the mobility of vehicles:
significantly increased deformability of the natural substrate, particularly soils used
agriculturally;
presence of flora, which can reduce the traction;
possibility of field obstacles occurrence e.g. steep ramps, small walls, bumps, barbs.
Important factor that determines mobility is type and condition of the surface. If we assign one
number to the set of surface characteristics, which determine its mobility, and if we assume 1,00 as
mobility on the concrete road with dry surface, than any other type of the surface can be described by
a fraction, as shown in Table 1.1
The following substrate properties affect the arbitrary value of trafficability:
type of soil: sand, loess (loam), peat, snow or a percentage of the individual factions;
substrate moisture content of the substrate, changeable in time, depending on
precipitation, wind and sunlight;
density degree of the substrate material, as well as its structure.
Table 1.1 Characteristics of different surfaces
N
o.
Type and condition of
Mobility
the surface
[%]
1
Dry concrete surface
100
.
2
Wet asphalt surface
30-65
3
Dry dirt road
40-90
4
Meadow
20-75
5
Agricultural soil
15-50
6
Peat bog
5-40
7
Sands
20-50
.
.
.
.
.
.
Projekt współfinansowany ze środków Unii Europejskiej w ramach Europejskiego Funduszu
Społecznego
___________________________________________________________________________
8
Deep snow
0-30
9
Wetland
0-25
.
.
1
Heavy
terrain
+
0-10
0.
obstacles
Sands depending on the specific density will differently affect the mobility, therefore important
role is played by unit pressure that is exerted by traction element. Loess soils are more sensitive to
changes in humidity and their resistance can vary within very wide limits. At certain humidity, loess
will turn into liquid mud, therefore it does not show shear strength. Peats and forest soils do not form
macrostructure and in result their strength and derivative mobility depend on the presence of the root
system, which acts as a warp. As it was already mentioned, an important factor that affects traction
properties of the substrates is humidity. It’s a feature that affects the mobility on any type of substrate,
but in various degrees. In contrast to loess soils, the sand in certain humidity achieves so called
apparent cohesion, resulting from the formation of viscosity bonds between the quartz particles. The
case is similar in regard to snow. Certain content of water can improve mobility by providing the
tendency for kneading and in result, so called destructive metamorphism occurs. However, high
humidity of the snow causes a decrease in friction coefficient, which significantly reduces adhesion.
1.2 Methods for determining the traction properties of the deformable substrate
Value of the driving force and traction force depends on the distribution and value of the shear
stresses in the area of wheel’s contact with the ground. In order to determine these stresses, we use so
called hypothesis of two constants formulated in 1776 by Coulomb:
c
ptg
(1.1)
where: τ – shear stress, c-cohesion, p – unit pressure, φ-angle of internal fraction.
Coulomb formula extended by the factor describing the effect of slipping of the traction element
can provide an analytical description of driving force’s characteristics or unit contact reaction in the
traction element-substrate system. Examples of the characteristics for various deformable substrates
are shown in figure 1.1.
Internal friction angle and cohesion are the basic traction parameters of the deformable substrate.
Determination of these parameters is possible using e.g. laboratory shear test of soil sample.
Projekt współfinansowany ze środków Unii Europejskiej w ramach Europejskiego Funduszu
Społecznego
coefficient
force siły
Driving
jazdy [-] [▪ ]
Wskażnik
___________________________________________________________________________
Luźnysand
gruntsoil
piaszczysty
Loose
Compacted
sand soil
Ubity
grunt piaszczysty
Deep snow
Głęboki
śnieg
Ice
Lód
Poślizg
[%]
Skid [%]
Fig.1.1 Typical characteristics of the unit contact force working in the wheel-substrate system for selected
deformable substrates.
Research conducted by Bekker in the 60s of XX century led to the development of the model
defining wheels’ impact on the soil, which describes the relation between traction element recess and
unit pressure p:
p
kc
b
k
zn
(1.2)
Bekker model is a typical example of the empirical model. Parameterization of the model is based
on three coefficients: kc, kφ and n, and to determine them, we use a device called bewameter (fig. 1.2).
Fig.1.2 Bewameter for traction tests of soil properties (WITPiS Sulejówek)
Projekt współfinansowany ze środków Unii Europejskiej w ramach Europejskiego Funduszu
Społecznego
___________________________________________________________________________
Exemplary values of the coefficients defining traction properties of the selected deformable
substrates are listed in table 1.2.
Table 1.2 Values of the coefficients determining traction properties of the sand and loess soil.
Coefficient
Type of soil
Sand
1,18
0,006
0,084
0,017
29,5
3,8
n
kc
kφ
C
θ
K
loess
0,68
0,576
0,6
0,031
33,6
2,8
1.3 Mobility indexes in off-road conditions
Coulomb model and Bekker model are the basis for traction performance description of the
traction element on the deformable substrate, because they allow for the determination of the driving
force and rolling resistance force. A slightly different method is the determination of vehicle mobility
in the field conditions, based on so called single-number index of mobility.
Introduction of mobility indexes resulted from the need to determine this characteristic with the
use of a single number, in a simple and reliable manner. The demand for such indexes has been mainly
manifested by armoured troops and land transportation. Basically, mobility indexes are based on the
method of unit pressure.
1.3.1 NGP Index
NGP (Nominal Ground Pressure) index has been introduced in order to determine the pressure
exerted on the ground by the belts of tracked vehicles. It is expressed with the following formula:
NGP
G
PG
(1.3)
where: G – vehicle weight [N], PG – belt surface of the continuous track [m2].
NGP index does not take into account the size, number and arrangement of the wheels. Also,
there’s no NGP analogue for the wheeled vehicles.
1.3.2 Cone Index
CI – Cone Index and its derivatives: VCI (Vehicle Cone Index), RCI (Rating Cone Index) enable
the prediction of mobility, based on the field measurements with the use of cone penetrometer. It is a
portable testing device and its measuring head is shaped like a cone with an angle of 60° (fig.1.3). This
test consists of measuring the force used for pushing the cone into the soil. This force is dependent on
momentary condition of the soil and its value shows good correlation with traction.
Projekt współfinansowany ze środków Unii Europejskiej w ramach Europejskiego Funduszu
Społecznego
___________________________________________________________________________
Fig.1.3 Cone penetrometer (WITPiS Sulejówek)
RCI index takes into account deformability of the soil during the interaction of driving
mechanisms and is expressed by the following formula:
RCI
CI DI
(1.4)
where: DI – Deformation Index, which can be replaced by simplified constant = 0,8.
VCI index relates to a vehicle and takes into account a number of its characteristics and
parameters, which significantly affect the mobility. It is a reference number for the comparison with
RCI or CI. Estimation of mobility is based on the comparison of two parameters and determination of
inequality direction.
1.3.3 MMP Index
MMP (ang. Mean Maximum Pressure) index determines the value of maximum mean unit
pressure that can be exerted by driving mechanism of the vehicle (fig.1.4). The characteristic value of
the MMP system is the capability to predict the mobility of both tracked vehicles and wheeled vehicles
(table 1.3).
MMP value is determined using the following formulas:
- for the wheeled vehicles:
K 'W
MMP
0.5
2mb
0.85
d
(1.5)
1.15
d
Projekt współfinansowany ze środków Unii Europejskiej w ramach Europejskiego Funduszu
Społecznego
___________________________________________________________________________
- for the tracked vehicles
MMP
1.26W
2mcb pd
(1.6)
0 .5
The parameters occurring in the above formulas allow for a sufficiently precise determination of
the impact of the structure and properties of the drive system on the mobility.
Table 1.3 MMP values for various vehicles
Vehicle
Land Rover
HMMWV
Hummer
Pandur
T-72
Merkava
M 113
Weight [T]
2,1
3,87
MMP
278
272
11,3
44,3
60
11,6
335
257
279
121
Analytically determined MMP values are compared to the adopted soil parameters of the given
climate zone. 3 ranges of MMP values (table 1.4) are applied, while the limit value defines „go-no go”
conditions, and indicated recommended value allows to additionally apply for maneuverability,
performance, etc.
Table 1.4 Limit MMP values
Climate
MMP
INDICATED
Moderate climate
RECOMMENDED
LIMIT
165
115
250
200
125
75
Tropical climate
values [kPa]
Pressure
analytical
[kPa]
analityczne
wartości
Nacisk - –
800
45
700
g
de
a
ni
nd
Li
la
w
o
R
wg
PM
M
in
ur
cla
a
M
wg
PMM
600
500
400
300
P
NG
200
100
100
200
300
400
500
600
700
800
Pressure
measured
values [kPa]
[kPa]
Nacisk - –wartości
zmierzone
Fig.1.4 Comparison of the unit pressure measured with mobility indexes
Projekt współfinansowany ze środków Unii Europejskiej w ramach Europejskiego Funduszu
Społecznego
___________________________________________________________________________
1.4 Determination of the mobility indexes – carrying out of the exercise
Carrying out of the exercise consist of a practical part – conducted in the polygon conditions, and
analytical part – conducted inside the classroom. Practical part is based on the determination of cone
index for minimum 3 selected deformable substrates, while in principle cohesive soils should be used.
Measurement with the use of penetrometer must be conducted on levelled, flat surface of the soil,
while repeating it at least 5 times in the given place. For each type of the substrate, you need to select
5 different locations (test spots). Measurements from the given spot must be arithmetically averaged.
Result of the measurement for the given type of substrate (soil) must be expressed as arithmetic mean
from 5 spots, along with the value of standard deviation and with designation of maximum and
minimum CI value. The results must be summarized in a table.
Analytical part consists of designation of mobility indexes based on the formulas presented in this
instruction. You need to determine MMP index for 5 selected vehicles, while two of them should be
tracked vehicles. Obtained results must be compared with acceptable and recommended values for the
soils of temperate zone. The results should be summarized in a table.
Projekt współfinansowany ze środków Unii Europejskiej w ramach Europejskiego Funduszu
Społecznego
___________________________________________________________________________
2. DETERMINATION OF THE STRESS AND DEFORMATION STATE
IN THE DEFORMABLE SUBSTRATE
2.1 Introduction
Measurements of the stresses in soils under wheel load of the vehicles are used in the following
areas:
- automotive industry – determination of the influence of non-hardened substrate on the mobile
properties and operation of off-road vehicles;
- agriculture – determination of the impact of vehicles on the soils;
- geotechnics and road engineering – determination of the road substrate deformability;
- others, including research and study issues, etc.
Stress measurements are conducted with the use of equipment, which main component is a stress
sensor. Basic type of transducer used in soil stress sensor structures is a strain gauge transducer.
Moreover, piezoelectric, semiconductor and others transducers are also used.
Stresses in the soil can be measured as normal one-way stresses. Then, the measurement is
conducted with the use of individual sensors placed at selected depths in the soil. The measurement of
stresses for determination of spatial stresses state is also applied. For such measurements, the SST
head (Stress State Transducer) is used.
2.2 SST head
SST measuring head is constructed from six stress sensors, which are arranged in such manner
that the measured presses comprise the complete information about the state of the stress in the spot of
the tested medium. Schematic of SST head is shown in figure 1.
SZ
SN2
SN3
SN1
SX
SY
Fig.2.1 Schematic of SST head
SX, SY and SZ sensors are placed in the main axes, mutually perpendicular, and SN1, SN2, SN3
sensors form a second independent system that is perpendicular in regard to each other. Determination
of stresses in the spot of tested medium is carried out with the assumption that the value of the
measured soil pressure in regard to membrane of the sensor is equal to the stress value. According to
Projekt współfinansowany ze środków Unii Europejskiej w ramach Europejskiego Funduszu
Społecznego
___________________________________________________________________________
this, the determined stresses have values averaged from the area of active surfaces of the sensors. With
the measured values of SX, SY, SZ, SN1, SN2 and SN3 pressure, it is possible to analytically
determine the components of stress state: main stresses - S1, S2, S3 and its directional cosines in
regard to main axes, as well as the components in the octahedral system (octagonal): mean normal
stress (MNS) and shear stress (OCTSS - Octahedral Shear Stress).
General appearance of the SST head is shown in figure 2.2. Appropriate mutual orientation of the
sensors can be achieved by placing them in the body, in which the sensor sockets and channels for
signal wires are implemented. Multi-pin socket is built in the body axis and screwed cover closes the
body from the bottom. Multi-pin connection AMPHENOL enables detachable connection of the signal
cable with the head that is resistant to moisture, dust and dirt.
Fig. 2.2 SST head – general appearance
The SST head includes pressure sensors. These are the sensors in round shape, constructed with
the use of electro-resistance strain gauges. The sensor is built in the form of round membrane
supported annularly on the circuit. This type of structure imposes the use of membrane strain gauges
in the full bridge system, in which two branches work for radial stretching, forming full circuit of a
circle, and the other two are deformed circumferentially and are located near the centre of the
membrane. Such strain gauge arrangement guarantees excellent temperature compensation, however
in the case of long-term static measurements, it is advantageous to use additional compensating stain
gauges.
In the absence of SST head, you can use single-axis sensors in the low profile housing to carry out
this exercise.
2.3 Conducting the measurement
Determination of the stress state in soil is conducted in natural conditions on substrates and soils
in stale state, without special preparation. Only, depending on the needs, it might be necessary to
remove dispensable flora on the soil surface. In case when the test is supposed to be carried out in
model conditions, the soil must be cleaned from flora and roots to required depth, with the use of
Projekt współfinansowany ze środków Unii Europejskiej w ramach Europejskiego Funduszu
Społecznego
___________________________________________________________________________
available methods. It’s recommended to conduct this treatment minimum 2 days before the planned
tests.
Standard preparation of the ground for tests is as follows:
(1) Levelling of the surface;
(2) Selection of the test site – a place must be selected in such manner so that the maneuvering of
the test vehicle will be possible in front of and behind the test spot. You should choose a place with
dimensions of approximately 2 x 2 m in the middle of the outer path of vehicle and the vehicle while
driving in the predetermined track should have the possibility to turn around and assume the position
for next test (see Figure 1). Selected place must be properly marked and the movement of vehicle, as
well as pedestrians should be limited in the area of the marked site.
(3) Placement of the measuring head in the ground. The measurements of the pressure in the soil
are possible at different depths. In general, depth of the measurement is determined by the test
objective, as shown in table 2.1.
Table 2.1 Selection of the depth for placement of triaxial head in regard to the test objective
N
Measuring depth
Test objective
1
10-15 cm
Determination of stresses for correlation with
pulling/driving force, in simultaneous measurements with
ground deformation using optoelectronic method
2
15-25 cm
Standard measuring depth, in accordance with MacLaurin
MMP method
3
30-35 cm
In simultaneous measurements with deformations using
optoelectronic method
4
40-50 cm
o.
In tests regarding distribution of vertical stresses
Before placing the head in the ground, you need to check the performance of individual pressure
sensors. Inspection must be conducted on the completed measuring track. In order to this, you need to:
- start control-recording computer;
- connect the signal wires from triaxial head to sockets on the transducer board;
- run the subprogram for recording and push the individual sensors in the head, while observing
the indications of the recording subprogram;
- changes in monitored voltage on individual channels means that the measuring track is working
properly;
- in the absence of reaction from the monitoring program during the pushing of any of the
sensors, you need to conduct additional inspection of the measuring track, in particular of: head –
signal wire connection, singal wire – A/C transducers board, power supply of the head, connection of
the A/C board with the computer;
Projekt współfinansowany ze środków Unii Europejskiej w ramach Europejskiego Funduszu
Społecznego
___________________________________________________________________________
After confirmation of measuring track efficiency, you can proceed to placement of the SST head
at the selected depth. First of all, you need to identify type of the soil on which the tests will be
conducted. Type of the soil determines further course of action, particularly manner of the head
placement. Placing the head in the soil is associated with partial or complete destruction of the
structure of the tested soil. It affects the test results. Therefore, method of placement has been
developed for three types of soil: sand, loess and peat, while taking into account the characteristic
features of those materials. These types of soil are typical for Poland and most of the European
territory. Most of the soils and grounds are mixtures of the mentioned components. Sand and loess
comprise the substrates with extremely different properties and they are the components of almost all
soils and lands. Peat substrate has completely different properties and it frequently occurs in forest,
wetland and meadow areas. In addition, a method for placing the SST head in the snow has been
developed, because the snow also has different properties.
Sandy soil
Sandy soil is characterized by the absence of bindings between the particles (grains), which
significantly affects the possible ways of placing SST head. Dry sand is a granular material, without
intermolecular structure. Mechanical strength of the sandy substrate is only affected by the manner of
molecular arrangement, while the possibility of arrangement that will result in significant change in
strength is lower, the greater is the volume of the given medium half-space. It is assumed that in the
case of volume amounting to several tens of dm3, arrangement of the molecules is no longer relevant.
A method for placing SST head in the substrate is as follows:
- dig a hole to the required depth;
- level and align the bottom of the hole;
- place the head;
- mark the head’s position using the shovel and twig inserted into the soil;
- place the signal wire;
- precisely strew the head with sand from the hole to compensate the level over the hole;
- remove the head after the measurement by vertical digging, carefully not to damage the signal
wires.
In the case of conducting the measurements at greater depths (below 35 cm), it is recommend to
strew and tamp the sand in layers, in order to reconstruct the original density of the substrate.
Loess soil
Loess soil forms a structure and depending on the type of native rock and humidity, it can have
completely different characteristics and forms: from solid state with significant hardness to liquid
mass. Limitations of the method do not allow for measurements in saturated soils, therefore the
method of head placement has to ensure a minimal impact of the structural damage on the results.
Method of placing the triaxial head in the loess soil is as follows:
- dig a hole to the required depth, hole dimensions in the horizontal cross-section should be as
small as possible;
- level and align the bottom of the hole;
- place the head;
Projekt współfinansowany ze środków Unii Europejskiej w ramach Europejskiego Funduszu
Społecznego
___________________________________________________________________________
- mark the head’s position using the shovel and twig inserted into the soil;
- place the signal wire;
- precisely strew the head with fragmented soil from the hole to compensate the level over the
hole, this action must be perform for each 5-cm layer of soil;
- cover the place with sun shield (aluminium foil);
- start the measurements after approximately 1-3 hours, depending on the soil humidity – the
higher humidity, the shorter waiting time;
- remove the head after the measurement by vertical digging, carefully not to damage the signal
wires.
Peat soil
Peat soils due to different morphology structure require the use of other method of triaxial head
placement. Structure of these soils is strongly associated with root system of occurring flora, therefore
you need to place the head in a manner that will not destroy or minimally damage this structure.
Depending on the assumed depth of the measurement, two methods are possible:
(1) For measurement depth of 10 – 30 cm and with intense rooting of the flora:
- remove the flora without damaging the surface of the soil;
- using a sharp shovel cut vertically a rectangle with sides equal to shovel’s width and with depth
equal to the assumed measurement depth;
- using gentle motion, pick up the cut volume of the soil and set it aside;
- level the bottom of the hole;
- place the head;
- mark the head’s position using the shovel and twig inserted into the soil;
- place the signal wire;
- fill the hole with previously cut volume of the soil;
In case when rooting of the flora is weak and maintaining the cut volume of the soils in its entirety
becomes impossible, then you need to use method for sandy soil.
(2) For the measuring depth above 30 cm
- dig a hole with dimensions of 0,7m x 0,7m, and depth of 20 cm greater than the predicted
measuring depth; front edge of the hole should be at the distance of approximately 40-50 cm from the
measuring site;
- in the front edge of the dig, make a horizontal opening with diameter of approximately 35mm
using thin-walled tube, for a length of approximately 50 cm;
- place triaxial head in this channel while maintaining appropriate levelling;
- fill the channel with soil;
- remove the head using vertical digging.
Performance of the test requires the following actions, which additionally must be synchronized
in time:
(1) Placement of the vehicle
- get the vehicle close to measuring site – for a distance of approximately 3-4 m;
- mark the position of the head in the test site using shovel, twig, chalk, etc.;
Projekt współfinansowany ze środków Unii Europejskiej w ramach Europejskiego Funduszu
Społecznego
___________________________________________________________________________
- direct the vehicle by maneuvering front – rear – right –left so that the line of right wheel and
marking in the test site would form a single line;
- stop the vehicle approximately 1-2 m in front of the head position marking.
(2) Starting the recording device
- turn on the computer and transducer board or make sure that it is turned on;
- run the program for results recording;
- name the recording file in accordance with concept adopted at the briefing e.g.
Loess_drive_001, or Sand_rolling_002; the use of numbering allows maintaining the order in a set of
files that are records of repetitions of the given test;
- wait for the confirmation of readiness from the driver and any observers;
- finish the recording and save the file on the hard drive or any other available medium.
(3) Driving over the head.
Caution! The command to start the test is always given by the person operating the recorder.
- trigger the recording by giving the command to the driver to start moving the vehicle; this
command can be communicated directly in words or using the means of wireless communication;
- observe recorder indications during the passing;
(4) Saving the measurement results
- stop the recording and save the file on the hard drive or other available medium.
2.4 Determination of the stress state
Determination of the stress state in soil based on obtained results of stresses in the soil is carried
out using computer station equipped with SSTKiel software. This program runs in
MS DOS environment and requires the appropriate preparation of so called batch files – their structure
is strictly defined and described in the User manual. Detailed method of using this program has also
been included in the mentioned annex.
Obtained final results in the form of files with extension .PRN must be read using MS Exel. The
results must be summarized in the form of graph representing relations of components of stress state as
a function of time.
Projekt współfinansowany ze środków Unii Europejskiej w ramach Europejskiego Funduszu
Społecznego
___________________________________________________________________________
3. DETERMINING FIELD PERFORMANCE OF THE OFF-ROAD
VEHICLE
3.1 Introduction
Traction performance of the vehicle in the field is a fraction of the performance achieved on a
paved road, while its reduction is determined by two most essential phenomena:
a decrease in wheel-substrate adhesion, which is a consequence of shearing of the soil and
skidding of the wheels;
an increase in movement resistance, which is a consequence of rut formation in the deformable
layer.
Environmental factors such as rain, snow, sunshine, wind affect the mobility of the vehicle in a
significant manner. However, from the point of view of wheel-deformable substrate system, the most
important is a separation of the parameter (or parameters) of substrate state, which (1) affect the
mechanical properties of the substrate, (2) remain under the influence of the above-mentioned
environmental factors. Based on the literature research and experiences, it has been proven that soil
humidity is such factor. Regardless of the impact of environmental factors on other soil and ground
properties (porosity, granulometric distribution, density, etc.) it can be safely assumed that it’s the
water content in the soil mass that affects the changes in its strength, leading to decrease in mobility.
This can be summarized by stating that the humidity is somewhat synthetic parameter containing
within itself all above-mentioned individual factors, which is also intuitively understood because e.g.
direct impact on moisture is attributed to intensity of precipitation, sunlight, wind, etc.
3.2 The effect of climate conditions on the mobility
Based on the tests, mobility values are in the range from 0 to 100% and greatly depend on the
weather conditions. In accordance with predictions, mobility is the lowest in the winter-spring period
and the highest in late summer and early autumn. During winter and spring, traction conditions in the
field are degraded mainly due to high humidity, which is affected by precipitation, low temperature
(low evaporation of water) and low sunlight.
Projekt współfinansowany ze środków Unii Europejskiej w ramach Europejskiego Funduszu
Społecznego
___________________________________________________________________________
PRZEJEZDNOŚĆ
MOBILITY
1
0.8
0.6
0.4
DZ
IE
Ń
LI
ST
OP
AD
SI
EŃ
DZ
IE
RN
IK
GR
U
PA
Ź
RZ
E
September
November
August
October
December
W
June
SI
ER
PI
EŃ
July
LI
PI
EC
AJ
M
EC
May
ER
W
IE
C
April
CZ
KW
Y
AR
Z
M
LU
T
ST
Y
CZ
EŃ
0
January
March
February
IE
CI
EŃ
0.2
Fig.3.1 Results of mobility obtained in each month of the calendar year
Analogically, high air temperature in summer and early autumn, as well as sunlight and wind
cause quick drying of the substrate and despite significant rainfall, traction conditions during this
period regenerate very quickly, therefore the resulting mobility is high.
Besides the analysis of the mobility value alone, changes in time are also important. The dynamic
of mobility indicates significant variations in different seasons. It may be noted that in the spring and
summer, the dynamic is significantly greater, than in autumn-winter period. It is associated with the
above-mentioned weather conditions (particularly with air temperature, sunlight, wind). At the same
time, in the summer occur the most intensive rainfalls (July), which combined with evaporation rate
gives highly differentiated results of the mobility. More stable weather in late summer and early
autumn, without the intense precipitation, causes in result that during this period the dynamic is low
with simultaneous high values of mobility. Similarly, dynamic of the mobility during winter-early
spring period is low (stable weather, mobility at medium level), but in the spring, when sunlight
begins to play a larger role, traction conditions can quickly improve. It also must be noted that thawing
of the ground is an important factor affecting the mobility during early spring. Paradoxically, an
increase in temperature has a significantly negative influence here. Thawing of the top layer of the
ground, while the subsoil is frozen (sometimes even to a depth of 1 m) causes that the water
accumulated on the surface has no possibility to penetrate deeper and the soil humidity increases to
very high values.
Projekt współfinansowany ze środków Unii Europejskiej w ramach Europejskiego Funduszu
Społecznego
___________________________________________________________________________
1
0.8
0.6
0.4
0.2
0
ZIMA
WINTER
WIOSNA
SPRING
LATO
SUMMER
JESNIEŃ
AUTUMN
Fig. 3.2 Mean values of the mobility for individual seasons
In summary, the influence of climate conditions on the off-road mobility is significant and the soil
humidity that is a derivative of the above-mentioned weather conditions can be its measure.
3.3 Measurement of the soil humidity using TDR method
As an exercise, the students will learn about the modern method of soil humidity measurement,
which uses the phenomenon of time domain reflectometry.
Measurement of soil humidity is a complex metrological problem. Soil is a three-phase porous
medium – besides the solid phase (clay minerals, sand, dust), it also has a liquid phase, so called soil
water and soil air, which (with exception of the very strongly dried soils) is in 99–100% saturated with
water vapour. Various organic compounds and mineral salts are dissolved in the soil water. Besides
the free water, which fills the pores, also the bounded water occurs and its molecules are connected by
intermolecular forces with molecules of the soil solid phase. Standard method for determination of soil
humidity, so called thermogravimetric method requires the following: sample must be transported to a
laboratory, weighed, dried by placing it for 24 hours in the oven at 105 °C and then the water loss is
calculated through comparison of the mass of wet sample and dried sample. This method is timeconsuming, laborious and requires access to a laboratory.
Soil humidity can also be determined with the use of electric methods, such us resistive and
dielectric methods (capacitive, reflectometric). Such measurements are fast, safe, easy to carry out and
above all non-destructive. Gauges that use measurement of soil resistance are the cheapest and the
simplest solution, however they do not provide adequate accuracy of the measurement, because the
soil electric resistance is affected not only by its humidity, but also by its salinity. Therefore this
method is not selective, which limits its applications. Dielectric methods use the measurement of
relative electric permittivity (dielectric constant) of the soil. Dielectric constant of the water is
approximately 80 (depending on temperature) and dielectric constant of the soil solid phase – from 3
to 6. Therefore, the value of soil permittivity determines the water content. Relative permittivity is
generally dependent on frequency of the applied electric field i.e. measurement of various frequency
values of the electric field gives different values. Devices that use capacitive methods determine
Projekt współfinansowany ze środków Unii Europejskiej w ramach Europejskiego Funduszu
Społecznego
___________________________________________________________________________
dielectric constant through the measurement of capacity of the probe placed in the soil. However, for
the frequency of electric field used in capacitive methods reaching only to approx. 150 MHz, the value
of dielectric constant is also affected by soil salinity – the greater the soil conductivity, the higher
dielectric constant. Therefore, capacitive measurements, although more accurate than resistance
methods, are also not sufficiently selective and do not provide appropriated accuracy of the
measurement and their use is limited to soils with low salinity.
Dielectric reflectometric methods use analysis of the electric signal reflected in the waveguide,
located in the tested soil medium, for determination of the soil humidity. Reflectometric techniques in
frequency domain (FDR – frequency-domain reflectometry) enable to achieve a spectrum of joint
relative permittivity as a function of the frequency of the applied electric signal. When using
adequately high frequency (at least 400-500 MHz) they enable an accurate and selective measurement
of the humidity and electric conductivity, which is a measure of soil salinity. However, FDR devices
that operate at sufficiently high frequencies are expensive and difficult to build.
TDR technique – time domain reflectometry uses the measurement of time between individual
reflections of the signal in probe located in the tested material, i.e. analysis of the reflectogram is
conducted. A discrete or pulse signal is used, with a very short rise time (in the case of FOM/mts type
device the rise time of the impulse is approx. 250 ps). The devices operating with the use of TDR
technique measure the velocity of electric signal propagation in the tested material and this velocity is
inversely proportional to the square root of dielectric constant of the medium. Due to the generation of
electric impulse, which spectrum is mainly contained within the range of microwave frequencies, the
measured value of the relative permittivity does not depend on the soil salinity, which in turn can be
determined by analysis of the impulse attenuation level in the tested medium. Therefore, TDR
measurements are highly selective, provide high accuracy of the measurement in comparison to other
available methods and also are fast, as well as easy to carry out. Thus, they are suitable for universal
field use.
FOM/mts gauge (fig. 3.3) is light and handy (it weighs approx. 350 g with battery, dimensions: 18
x 8,5 x 5,8 cm), optionally it is also equipped with GPS module for precise localization of the
measuring site. This device allows you to make measurements of volume humidity of the soil in the
range of 0-100%, with accuracy ±2% of the range (without the need for individual calibration for
specific type of soil). The measurements are conducted with the use of field two-rod probe with the
rod length of 10 cm or laboratory probe with the length of 5,2cm. In addition, while using the field
probe, you can also measure soil temperature and its electric conductivity. Thanks to the delay lines
that are installed inside this device, it is possible to conduct measurements with the use of probe
connected using cable with the length of 1,5-9,5 m. The device is connected to a PC via USB interface
to enable calibration of the probes or reading of the memorized and stored results. This device is
powered by lithium-ion battery that allows for performance of approx. 1000 measurements. It consists
of three printed circuit boards (keyboard and display board, control-powering board with separate
microprocessor and measuring board also with separate microprocessor). Measuring board is built
based on analogue-digital and digital-analogue converters, supply converters, phase loops and
Projekt współfinansowany ze środków Unii Europejskiej w ramach Europejskiego Funduszu
Społecznego
___________________________________________________________________________
amplifiers, module for conductivity and soil temperature measurement, impulse generator, sampling
head with a delay line.
Fig. 3.3 FOM gauge in a set for field measurement
3.4 Performance of the exercise
Normally, the mobility tests are conducted over a full calendar year. They consist of testing the
mobility of the vehicle over the given track and the following components of the mobility are tested:
- time of acceleration to 30 km/h from the standing start, tV30;
- time of passing through the testing section (approximately 500 m), t500;
- mobility of the special section „go-no go”(mobility limit), GNG;
- the need to use 4x4 drive, AWD.
Individual components of the mobility are subject to averaging, wherein the weighted average is
used:
P
1 tv 30
5 tvw30
t500
w
t500
2GNG
AWD
(3.1)
where: tw – means model times of passing, determined in the test on dry surface in good condition.
Examples of test results are shown in figures 3.4 and 3.5 for exemplary quarters of the calendar
year.
Projekt współfinansowany ze środków Unii Europejskiej w ramach Europejskiego Funduszu
Społecznego
___________________________________________________________________________
K WAPRIL
IE C IE Ń
1
0.7 5
0.5
0.2 5
0
3 IV
9 IV
15 IV
17 IV
2 4 IV
2 9 IV
PRZEJ
EZ DNOŚ Ć
MOBILITY
4 x4
MAY
MA
J
1
0.75
0.5
0.25
0
7 V
10 V
16 V
22 V
24 V
28 V
PRZEJEZ
DNOŚ Ć
MOBILITY
4x4
C ZE JUNE
R W IE C
1
0.7 5
0.5
0.2 5
0
1 VI
4 VI
8 VI
11 V I
4x 4
16 V I
22 VI
23 VI
29 VI
P RZ
EJEZDNO ŚĆ
MOBILITY
Fig. 3.4 Mobility for the spring quarter
Projekt współfinansowany ze środków Unii Europejskiej w ramach Europejskiego Funduszu
Społecznego
___________________________________________________________________________
OCTOBER
P A ŹD
ZIE R N IK
1
0.7 5
0.5
0.2 5
0
1X
9X
13X
4x4
20 X
2 5X
PR MOBILITY
ZEJEZ DN OŚ Ć
LNOVEMBER
IS T O P AD
1
0.7 5
0.5
0.2 5
0
3 XI
9 XI
1 5XI
4 x4
23XI
29
17XII
21 XII
P RZ
EJ EZD NO ŚĆ
MOBILITY
DECEMBER
G
R U D ZIE Ń
1
0.7 5
0.5
0.2 5
0
3 XII
8 XII
4 x4
1 4XII
MOBILITY
PR ZEJ
EZ DN OŚĆ
Fig.3.5 Mobility for the autumn quarter
As part of the exercise, you must conduct the tests for three different calendar periods, resulting
from the course plan (during laboratory course occurring in the semester). The measurement should be
conducted on three different soil substrates, selected from the following examples (depending on the
availability of the given substrate):
- loess;
- sandy;
- peat;
- grass.
Projekt współfinansowany ze środków Unii Europejskiej w ramach Europejskiego Funduszu
Społecznego
___________________________________________________________________________
In addition, as far as possible you should carry out the mobility measurement in the winter
conditions i.e. on the snow or on the icy surface.
During mobility tests, you also need to carry out the humidity measurements using TDR gauge.
Obtained results must be developed as follows:
- table summarization of the measurements results for the individual components of mobility
index P,
- graphical summary of the P index results for different types of substrates,
- table summarization of the TDR measurements results.
Projekt współfinansowany ze środków Unii Europejskiej w ramach Europejskiego Funduszu
Społecznego


![Invitation to Tender [ANG,PDF]](http://vs1.manualzilla.com/store/data/005809365_1-50c817a2bb68ee8f891e3007a43ef57c-150x150.png)