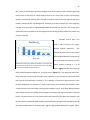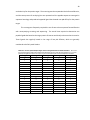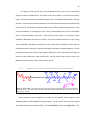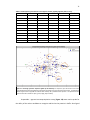
1
Development of Protein-Catalyzed Capture (PCC)
Agents with Application to the Specific Targeting of
the E17K Point Mutation of Akt1
Thesis By:
Kaycie Marie Deyle
In Partial Fulfillment of the Requirements
for the Degree of
Doctor of Philosophy
California Institute of Technology
Pasadena, CA
2014
(Defended: May 19, 2014)
ii
© 2014
Kaycie Marie Deyle
All Rights Reserved
iii
“There is no passion to be found playing small - in settling for a life that is less than the one
you are capable of living.” – Nelson Mandela
“To give anything less than your best is to sacrifice the gift.” – Steve Prefontaine
iv
Abstract
This thesis describes the expansion and improvement of the iterative in situ click
chemistry OBOC peptide library screening technology. Previous work provided a proof-of-concept
demonstration that this technique was advantageous for the production of protein-catalyzed
capture (PCC) agents that could be used as drop-in replacements for antibodies in a variety of
applications. Chapter 2 describes the technology development that was undertaken to optimize
this screening process and make it readily available for a wide variety of targets. This optimization
is what has allowed for the explosive growth of the PCC agent project over the past few years.
These technology improvements were applied to the discovery of PCC agents specific for
single amino acid point mutations in proteins, which have many applications in cancer detection
and treatment. Chapter 3 describes the use of a general all-chemical epitope-targeting strategy
that can focus PCC agent development directly to a site of interest on a protein surface. This
technique utilizes a chemically-synthesized chunk of the protein, called an epitope, substituted
with a click handle in combination with the OBOC in situ click chemistry libraries in order to focus
ligand development at a site of interest. Specifically, Chapter 3 discusses the use of this technique
in developing a PCC agent specific for the E17K mutation of Akt1. Chapter 4 details the expansion
of this ligand into a mutation-specific inhibitor, with applications in therapeutics.
v
Acknowledgements
I must start by thanking my family, without whom I would not be where I am today. My
parents, Ed and Diane, have supported me in every way possible since the day I was born. You
both have raised me and the world’s best brothers (both pretty incredible people), Matt and
Shawn, to be like yourselves – strong, confident, intelligent, and hard-working. With the tools
with which you have equipped me for this life, anything is possible. The closeness of my family
astounds me, and I have the honor of saying that some of my best friends were destined to be a
part of my life from birth. To my immediately family, but also my extended family, including my
grandparents (Clarence and Mary Ann Badar), and my vast network of aunts, uncles, and cousins,
thank you for always being there and for helping to mold me into the person I am today.
To my husband, Casey, who has been there for every day of this journey, cheering me on
through the best days while reminding me that there is more to life during the worst. Major
thanks for being a constant source of support and laughter, and for ensuring that we were always
well-stocked with ice cream and wine.
Next, I must thank my advisor, Jim Heath, for his well-timed guidance throughout the
course of my six years in his lab. I greatly appreciate the ability to explore and learn on my own
and at my own pace, being roped in only when necessary. Thank you for showing me that nothing
in science is impossible if you can think about it the right way, and for ensuring that we always
had more than enough funding to do the best possible work.
To my committee, Dennis Doughtery, Doug Rees, and John Bercaw, I greatly appreciate
the guidance and direction that you have provided throughout the years. Your insightful
questions and candid advice have expanded my range as a scientist. To my previous mentors,
Carl LeBlond and LeRoy Whinnery, thank you for taking a raw student under your wings and
vi
turning her into a scientist, and to Dr. LeBlond, thank you for instilling in me a love for organic
chemistry and science in general. To LeRoy, your constant support throughout all of the years in
which I have known you has meant more to me than you will ever know.
I must next thank my colleagues in and around the Heath group. I have had the sincere
pleasure these past six years to work with the hands-down smartest, most capable and genuinely
nicest lab mates I have ever seen assembled. You have all enriched my Caltech experience beyond
measure and have encouraged me every single day to be better than I ever thought possible. A
special thanks to Blake Farrow, Jessica Pfeilsticker, Aiko Umeda, Steve Millward, Heather Agnew
and Bert Lai for being such capable and absolutely amazing people to work with, not to mention
some of my best friends. I would get my hands dirty again in a lab with any of you at any time.
To the rest of the capture agents group: Rosemary Rohde, JingXin Liang, Arundhati Nag, Samir
Das, Ryan Henning, Joey Varghese, and Mary Beth Yu, thank you for being incredible lab mates
and really helping to push our technology to the limits. And to all of the Heath group members
past and present, for our interactions both personal and professional, thank you for being there
to both enhance my Caltech experience and keep me sane: Alex Sutherland, Min Xue, Jing Yu, Jing
Zhou, Wei Wei, Jun Wang, Kevin Kan, Habib Ahmed, Udi Vermesh, Ophir Vermesh, Slobadon
Mitrovik, Ann Cheung, Kiwook Huang, John Nagarah, and Jen-Kan Yu. I have met some of the best
people I hope to ever have the pleasure of calling friends in this lab.
Life at Caltech ran so smoothly for me, mostly due to the amazing support system in place
around me. I cannot thank the people that make up that system, and have allowed me to focus
more on research and less on paperwork: Elyse Garlock, Joe Drew, Carlos Rodriquez, Cora
Carriedo, Ron Koen, and Steve Gould, to name a few. I also must thank Jost Vielmetter and his
team at the Protein Expression Center (PEC) for being so amazingly helpful all of the time. Felicia
Rusnak and Jie Zhou at the Protein and Peptide Mass Analysis Lab (PPMAL) for all of their help
vii
and experimental input over the years. And Mona Shahgholi for always be willing to chat, and
her advice and assistance with MS techniques and experiments.
There is sometimes a life outside of lab, and mine was far richer for the people that were
in it. To Tim Mui, thank you for being the world’s greatest roommate, running buddy and
sounding board. To Kristina Daeffler, Chris Daeffler, Renee Thomas, Catrina Pheeney, and
Matthew Van Wingerden, for always being up for a good game – be it board or football – or a
good bottle of wine. Both of these are better with friends. To the Robinsons – Diane, Brent,
Katherine and Brenna – for opening up your lives and your home (and grill!) to Casey and me,
whenever we wanted or needed the company. Your support has been indescribable these past
few years, and we consider you our extended family. To my twin, Joe Zewe, for being never more
than a phone call away, and for always somehow knowing exactly what to say. I raise my phoneshot of Jack to you, sir! To my soul mate and maid-of-honor, Jessica Nichol, for…everything. Your
support, whether by phone, email, gchat or random cards and care packages has certainly seen
me through my fair share of tough times. Thank you for being one of the most caring and
considerate people I have ever met. And to Marc, whom I still miss as a lab partner to this day,
Whoomp! There it is!
Last but not least, to AJ. You have shown me the very definition of bravery and strength,
and I strive to face much lesser adversity with your grace and courage. I miss you every day, and
you remain, as you will forever, the never-ending source of my inspiration. Love you always.
viii
Table of Contents
Abstract ........................................................................................................................................... iv
Acknowledgements.......................................................................................................................... v
List of Figures and Tables .............................................................................................................. xii
Chapter 1....................................................................................................................................... 15
1.1
Protein-Catalyzed Click (PCC) Peptide Capture Agents for Biomarker Detection and
Therapeutics .............................................................................................................................. 16
1.2
Epitope Targeting Strategies .......................................................................................... 18
1.3
In Situ Click Screening Using Azide-Containing Phage Display Libraries ........................ 21
1.4
References ..................................................................................................................... 22
Chapter 2....................................................................................................................................... 25
2.1
Introduction ................................................................................................................... 26
2.1.1
Iterative In Situ Click Chemistry for Protein-Catalyzed Capture (PCC) Agent
Development.......................................................................................................................... 26
2.1.2
2.2
Prostate Specific Antigen (PSA).............................................................................. 27
Materials and Methods.................................................................................................. 29
2.2.1
Standard Materials................................................................................................. 29
2.2.2
Peptide Library Construction ................................................................................. 29
2.2.3
Bulk Peptide Synthesis ........................................................................................... 30
2.2.4
Typical Screening Protocol for Fluorescent Dye-labeled Protein Target Detection
………………………………………………………………………………………………………………………….30
2.2.5
Typical Screening Protocol for Antibody Signal Amplification Target Only Screens
………………………………………………………………………………………………………………………….31
2.2.6
Typical Screening Protocol for an Anti-Screen....................................................... 32
2.2.7
Typical Target Screening Procedure During a Multi-Step Screen (Figure 2-3) ...... 33
2.2.8
Typical Screening Protocol for a Preclear .............................................................. 33
2.2.9
Typical Screening Protocol for a Click Product Screen........................................... 34
2.2.10
Peptide Sequencing Strategies .............................................................................. 34
2.3
Results and Discussion ................................................................................................... 36
2.3.1
Screening via Fluorescent Dye-labeled Protein Target Detection ......................... 36
2.3.2
Screening via Antibody Signal Amplification Target Only Screens ........................ 39
2.3.3
Introduction of an Anti-screen............................................................................... 40
2.3.4
Introduction of a Click Product Screen .................................................................. 43
ix
2.3.5
Introduction of a Preclear ...................................................................................... 45
2.3.6
Use of Alkyne Versus Azide Libraries ..................................................................... 46
2.3.7
Typical Flow of Screening....................................................................................... 48
2.4
Conclusions .................................................................................................................... 49
2.5
Acknowledgements........................................................................................................ 50
2.6
References ..................................................................................................................... 50
Chapter 3....................................................................................................................................... 51
3.1
Introduction ................................................................................................................... 52
3.1.1
The E17K Mutation in the Pleckstrin Homology Domain of Akt1 .......................... 52
3.1.2
A General Strategy for Targeting Single Amino Acid Point Mutations in Proteins 53
3.2
Materials and Methods.................................................................................................. 54
3.2.1
Akt1 PH Domain Expressions ................................................................................. 54
3.2.2
Design and Synthesis of Epitope-Targeting Anchor/Target Peptide ..................... 56
3.2.3
CD Spectroscopy of 33-mer Target Peptide Epitope ............................................. 56
3.2.4
Screen for Initial Anchor Ligand Peptide................................................................ 57
3.2.5
Hit Library Bead Sequence Analysis ....................................................................... 59
3.2.6
Streptavidin-Agarose Immunoprecipitation (Pull-down) Assays for Binding Affinity
59
3.2.7
Point ELISAs with Anchor Ligand and 33-mer Epitope (Epitope Targeting
Verification)............................................................................................................................ 61
3.2.8
HPLC-Detected Immunoprecipitation (Pull-down) Assays (Epitope Targeting
Verification)............................................................................................................................ 62
3.2.9
Ligand-Directed Tosyl Labeling Experiments ......................................................... 62
3.2.10
Details of the MALDI-TOF Analysis of Tryptic Peptide Fragments ......................... 64
3.2.11
Images of Anchor Ligand in HEK-293T Cells Expressing PH Domains .................... 67
3.3
Results and Discussion ................................................................................................... 69
3.3.1
Ligand
In situ Click Epitope-Targeted Screening Strategy for E17K PH Domain-Specific
69
3.3.2
CD Spectroscopy of 33-mer Target Peptide Epitope ............................................. 72
3.3.3
Verification of the Epitope Targeting Strategy ...................................................... 73
3.3.4
Ligand-Directed Labeling Experiment to Confirm Epitope Targeting and Ligand
Selectivity ............................................................................................................................... 76
3.3.5
3.4
In Cell Imaging ........................................................................................................ 79
Conclusions .................................................................................................................... 81
x
3.5
Acknowledgements........................................................................................................ 81
3.6
References ..................................................................................................................... 82
Chapter 4....................................................................................................................................... 83
4.1
Introduction ................................................................................................................... 84
4.2
Materials and Methods.................................................................................................. 84
4.2.1
Screen for Biligand Peptide .................................................................................... 84
4.2.2
Streptavidin-Agarose Immunoprecipitation (Pull-down) Assays to Test Biligand
Candidates (Figure 4-6) .......................................................................................................... 88
4.2.3
Screen for Triligand Peptide................................................................................... 90
4.2.4
Full ELISA Curves for Ligands.................................................................................. 91
4.2.5
Point ELISA Assays for Triligand Binding to Akt1 and Akt2 Wildtype and E17K
Mutant Proteins ..................................................................................................................... 92
4.2.6
4.3
PIP3 Agarose Inhibition Assays .............................................................................. 93
Results and Discussion ................................................................................................... 94
4.3.1
Biligand Development ............................................................................................ 94
4.3.2
Triligand Development........................................................................................... 97
4.3.3
Inhibition Assays .................................................................................................. 100
4.4
Conclusions .................................................................................................................. 101
4.5
Acknowledgements...................................................................................................... 101
4.6
References ................................................................................................................... 101
Chapter 5..................................................................................................................................... 102
5.1
Introduction ................................................................................................................. 103
5.1.1
Azide-Containing Phage Display Libraries ............................................................ 103
5.1.2
Mirror-Image Phage Display ................................................................................ 104
5.1.3
G6PD Capture for Malaria Eradication................................................................. 104
5.2
Materials and Methods................................................................................................ 106
5.2.1
Preparation of Plasmid for Incorporation of Azidophenylalanine and Amp
Resistant Gene ..................................................................................................................... 106
5.2.2
Test of Azidophenylalanine Incorporation into a Protein in E.coli ...................... 110
5.2.3
Test of Azidophenylalanine Incorporation into M13KE Phage ............................ 110
5.2.4
Synthesis of M13KE Azidophenylalanine-Terminated 7-mer Random Library .... 111
5.2.5
Design and Synthesis of G6PD Target and Scrambled Target for Screening ....... 113
5.2.6
Optimized Phage Library Target Screening Conditions........................................ 115
5.2.7
Testing Phage Plaques for Library Inserts ............................................................ 117
xi
5.2.8
Incorporation of Azidophenylalanine into Phage Libraries ................................. 118
5.2.9
Optimized Phage Library Click Screening Conditions........................................... 119
5.3
Results and Discussion ................................................................................................. 119
5.3.1
Test of Azidophenylalanine Incorporation into a Protein in E.coli ...................... 119
5.3.2
Test of Azidophenylalanine Incorporation into M13KE Phage ............................ 120
5.3.3
Phage Library Screening Conditions and Results ................................................. 121
5.3.4
Focused Library Screening ................................................................................... 122
5.4
Conclusions .................................................................................................................. 123
5.5
Acknowledgements...................................................................................................... 124
5.6
References ................................................................................................................... 124
Appendix A .................................................................................................................................. 125
A.1
Regular Use .................................................................................................................. 126
A.1.1
Loading a Bead ..................................................................................................... 126
A.1.2
Solvents ................................................................................................................ 127
A.1.3
Ordering ............................................................................................................... 128
A.1.4
Contacting AB....................................................................................................... 128
A.1.5
Idle machine ......................................................................................................... 129
A.1.6
Settings................................................................................................................. 129
A.2
Troubleshooting ........................................................................................................... 131
A.2.1
Computer Errors, Freezing, or Not Saving Spectra .............................................. 131
A.2.2
Machine Bottle Runs Dry ..................................................................................... 132
A.2.3
HPLC Bottle Runs Dry ........................................................................................... 132
A.2.4
Baseline Errors – Dip at front of Spectra ............................................................. 133
A.2.5
Baseline Errors – Stretched Out Amino Acid Standards ...................................... 135
A.2.6
Pressure Errors – Change Bottle Seals ................................................................. 135
A.2.7
Pressure Errors – Clogged Lines ........................................................................... 136
xii
List of Figures and Tables
Chapter 2:
Figure 2-1: Iterative In Situ Click Screening Core Technology. .................................................... 28
Figure 2-2: OBOC Peptide Library ................................................................................................. 29
Figure 2-3: Typical Antibody-Detected Target Screen.. ............................................................... 33
Figure 2-4: Image of Hit Beads on GenePix microarray scanner. ................................................ 36
Figure 2-5: Histogram of Position X2 in PSA Screens. ................................................................... 37
Table 2-1: Screens from Sample Target Screen Using Fluorescent Protein Detection. .............. 38
Figure 2-6: Image of Hit Bead Developed with BCIP/NBT.. ......................................................... 39
Table 2-2: Screens from Sample Antibody Amplification Screen Using BCIP/NBT Protein
Detection. ...................................................................................................................................... 40
Figure 2-7: SPR Data from Akt Biligand. Data from Steve Millward’s Akt biligand capture agent
....................................................................................................................................................... 41
Figure 2-8: Sample Anti-Screen Step. ........................................................................................... 43
Table 2-3: PSA Screening Statistics. .............................................................................................. 44
Table 2-4: PSA Hit Bead Sequences from Product Screen. .......................................................... 44
Figure 2-9: Sample Product Screening Step. ................................................................................ 45
Figure 2-10: Sample Preclear Screening Step. .............................................................................. 46
Chapter 3:
Figure 3-1: PH Domain Binding Pocket Changes upon E17K Mutation: ...................................... 52
Figure 3-2: Screening Strategy for Anchor Ligand Determination ............................................... 59
Figure 3-3: Biotin – PEG5 – yleaf – Pra Anchor ligand: ................................................................. 61
Table 3-1: Excel Table of Tryptic Fragment Analysis .................................................................... 66
Figure 3-5: yleaf – PEG5 – TAT – Cy5: ............................................................................................ 67
Figure 3-6: Design of Screening Target Epitope: .......................................................................... 69
Table 3-3: Hit sequences from Anchor screen against 33-mer peptide fragment (16hr) ........... 71
Figure 3-7: Clustering of Anchor Sequence Ligands by AA Similarity: ......................................... 71
Figure 3-8: Streptavidin-Agarose Pulldown Assays for Anchor Ligand Binding Affinity:............ 72
Figure 3-9: CD Spectra of 33mer Epitope Fragment used in screening:. ..................................... 73
Figure 3-10: HPLC-detected Immunoprecipitation Assay for Epitope Targeting Verification.. .. 75
Figure 3-11: ELISA Assay Verification of Epitope Targeting. ........................................................ 75
Figure 3-12: Ligand-Directed Labeling Diagram. .......................................................................... 76
Figure 3-13: Fluorescent Gel Image to Confirm Cy5 Labeling ...................................................... 76
Figure 3-14: Images of Labeled and Unlabeled MALDI-TOF Spectra of Unlabeled (top) and
Labeled (bottom) Proteins. ........................................................................................................... 77
Figure 3-16: Trypsin Digested Sequence of PH Domain Protein.................................................. 78
Figure 3-17: Compiled Crystal Structure of Fully Labeled Protein. .............................................. 79
Figure 3-18: Images of Anchor Ligand in GFP-tagged WT and E17K PH Domain. ....................... 80
Figure 3-19: Image demonstrating co-localization of Cy5 - ......................................................... 80
xiii
Chapter 4
Figure 4-1: Biotin – PEG5 – yleaf – Pra: ........................................................................................ 85
Figure 4-2: Screening Strategy for Biligand Determination: ........................................................ 88
Figure 4-3: Lys(N3) - yleaf - Tz - yksy - PEG5 – Biotin: .................................................................... 89
Figure 4-4: Screening Strategy for Triligand Determination: ....................................................... 91
Figure 4-5: Clustering of Biligand Sequence Ligands by AA Similarity: ....................................... 95
Table 4-1: Hit Sequences from Biligand Screen............................................................................ 96
Figure 4-6: Pulldown Assay Results for Biligand Candidates: ...................................................... 96
Table 4-2: Hit Sequences from Triligand Screen .......................................................................... 97
Figure 4-7: ELISA assays for affinity and selectivity of triligand candidates. .............................. 97
Figure 4-8: Structure of final triligand: ivdae – Pra – Lys (N3) – yleaf – Pra – Lys (N3) - yksy ...... 98
Figure 4-9: Full ELISA curves of Anchor, Biligand, and Triligand.................................................. 99
Figure 4-10: Point ELISA of Triligand binding to Akt1 and Akt2. ................................................. 99
Figure 4-11: PH Domain membrane binding in the presence of each ligand. ........................... 100
Figure 4-12: Expanded Inhibition Assay. .................................................................................... 100
Figure 5-1: Azido - phenyl alanine. ............................................................................................. 103
Figure 5-2: Mirror-image phage display technique3. ................................................................. 104
Chapter 5
Table 5-1: Primers for AmpR Switch. .......................................................................................... 107
Figure 5-3: pAC-DHPheRS-6TRN Plasmid.................................................................................... 108
Figure 5-4: Distribution of random nucleotides. ........................................................................ 112
Figure 5-5: Distribution of amino acids. ..................................................................................... 113
Figure 5-6: Location of G6PD Mutations in protein. .................................................................. 113
Figure 5-7: Amino Acid Sequence of Exons 1 and 2 of G6PD.. ................................................... 114
Figure 5-8: Crystal Structure of G6PD (1QKI). ............................................................................ 115
Table 5-3: Primers for Colony PCR of Inserts.............................................................................. 117
Figure 5-9: Formula for estimation of phage concentration. .................................................... 118
Figure 5-10: Phage Click Screening Strategy............................................................................... 119
Figure 5-11: Test of azide incorporation in e.coli. ...................................................................... 120
Figure 5-12: Click-It Kit Visuablization of Azide in pIII coat protein. ......................................... 121
Figure 5-13: Gel Image of Colony PCR. ....................................................................................... 122
Table 5-4: Hits from 13 Insert-Containing Phages, Figure 5-13 ................................................. 123
Appendix A:
Table A-1: Solvent Compositions……………………………………………………………………………………….. 128
Table A-2: Parts and Chemicals Commonly Ordered from Applied Biosystems ....................... 128
Table A-3: Parts and Chemicals Commonly Ordered from Sigma Aldrich................................. 128
Table A-4: PulsedLiquid cLC Method .......................................................................................... 129
Figure A-1: Temperature and Pressure Settings ........................................................................ 130
xiv
Figure A-2: Normal1 cLC Gradient .............................................................................................. 131
Figure A-3: Procise Screen for Backflushing a Line..................................................................... 133
Figure A-4: Dip at front of spectra indicative of bad pump seal................................................ 135
Figure A-5: Leak Test Procise Software Screen .......................................................................... 136
15
Chapter 1
Introduction
16
1.1
Protein-Catalyzed Click (PCC) Peptide Capture Agents
for Biomarker Detection and Therapeutics
Detecting cancer-associated biomarkers is a necessary step on the road to personalized
medicine, as emerging therapeutics require the identification of specific patient populations that
will respond to targeted therapies1. Methods for protein biomarker detection are highly desirable
for rapidly screening changes in protein mutation status, monitoring patient treatment2, and
simple point-of-care diagnostics3. Techniques that rely on detecting or monitoring protein levels
mainly use antibodies for the capture and measurement of these proteins4. Antibodies, however,
are biological reagents that are inherently unstable, vary from batch to batch, can exhibit high
levels of cross-reactivity with other antibodies, and are expensive to produce5. Diagnostic assays
are frequently prohibitively limited in both cost and stability due to the restrictions of the goldstandard antibody detection agents.
Peptides can be the missing link for both inexpensive biomarker detection and targeting
traditionally undruggable proteins. Peptide - protein interactions cover a large surface area,
producing antibody-like affinities with unsurpassed specificities6. To date, most peptide discovery
techniques use genetically-encoded libraries, which allow for ease of library generation and rapid
and simple sequencing. These techniques permit screening of enormous numbers of compounds
against a target of interest without any complicated syntheses or detailed knowledge of the
target7. These libraries, however, are limited by the biological system from which they are
derived, both in terms of screening elements and library size. Most of these systems, such as
phage display, bacterial display and yeast display, are confined to the natural amino acids because
they use the cell machinery to make and express their libraries. These systems limit the suitability
of the resulting peptide capture agents due to the instability of biological peptides, which are
comprised of naturally-occurring L -amino acid monomers that can be degraded in biological
systems and fluids.
17
The Heath group has sought to alleviate the issue of peptide capture agent instability by
relying exclusively on the use of unnatural amino acids. Because biological libraries are not
conducive to this type of work, we have instead adopted a peptide screening method utilizing
One-Bead, One-Compound (OBOC)8 chemically synthesized libraries on 90μm polystyrene beads.
This technique trivializes the inclusion of any unnatural amino acid or structure that can be
chemically synthesized, allowing for the use of biologically stable D - amino acids and azide-alkyne
click chemistry handles in the library9.
The Sharpless group showed that the typical azide - alkyne click catalyst, Cu(I)10, speeds
up the reaction but is only barely necessary for it to occur, and demonstrated the ability to replace
this catalyst with the surface of a protein. They took advantage of this to assemble small molecule
inhibitors for proteins by breaking up known inhibitors into two components and assembling two
libraries – each one comprised of pieces similar to its original half of the inhibitor. One of these
libraries of molecules was appended with a click handle, the other library with the opposite click
handle. When two click reactants bound tightly to the protein surface and in close enough
proximity to each other, the long dwell time of these reagents allowed for the click to occur
without the use of Cu(I)11. In this way, they were able to bring the two libraries, which consisted
of variations on the original inhibitor, together and use the surface of the protein to assemble the
best possible small molecule inhibitor.
We have adapted this technology to assemble 5-mer peptide sequences displayed on
OBOC libraries using the surface of the target protein itself to catalyze a click reaction between
peptides that bind tightly to this surface. Hence, we have termed these capture agents “protein
catalyzed capture” (PCC) agents. This strategy requires that the two compounds are high-affinity,
selective binders for the target that is acting as a catalyst because the click reaction does not occur
without a long dwell time between the two agents. PCC agents have been developed against a
18
number of protein targets, and have been shown to exhibit a selectivity and affinity similar to
those of monoclonal antibodies. They also can be readily integrated into all standard protein
assay formats.
Chapter 2 of this thesis describes the technology development process that was
undertaken to optimize the screening stages for the production of high-affinity ligands to targets
of interest. Optimizing the in-depth screening procedure has allowed for the rapid expansion of
this project in the past few years. This detailed in situ azide-alkyne click screening technology is
now regularly used to develop peptide affinity agents that mimic the performance of antibodies915
. These affinity agents that maintain the stability of small molecules can be made to replace
biological reagents9,12,15, lowering the cost and increasing the robustness of detection assays13,14.
1.2
Epitope Targeting Strategies
The detection of single amino acid point mutations in proteins is critical in the
identification of specific patient populations that will respond to targeted therapies in the new
era of personalized medicine1. The current techniques for mutation detection rely on either
capture and measurement of these proteins through antibodies,4 or on DNA sequencing. DNA
sequencing is currently an expensive and time-consuming route to take for mutation screening,
especially as most patients need to be screened for mutations before the proper course of their
treatment is even decided16. Antibodies can provide a faster route for mutation detection and
treatment monitoring, as there are methods currently in place for their use as rapid point-of-care
diagnostics3.
These diagnostic tests also provide information about the levels of protein
expression in a body, something that cannot be tested through sequencing, which can be used to
monitor the response level of a patient to a certain treatment, potentially detecting ineffective
19
medications immediately after they are given. In a diagnostic setting, such binders can be used
to assay for the mutant protein within diseased tissues, and thus potentially provide clinical
guidance for treatment decisions3.
A more ambitious application is the development of drugs that can selectively inhibit
mutant proteins, and thus avoid those toxic side-effects that stem from the inhibition of the wildtype (WT) variants17 that reside in non-diseased tissues. Patients on therapies targeted very
specifically to the mutations characteristic of their disease could show significant improvements
without the toxic side-effects that stem from of the inhibition of the healthy, wild-type versions
of these proteins17. A relevant example is compound CO-1686, which is an a epidermal growth
factor receptor (EGFR) inhibitor specific for the T790M point mutation associated with certain
non-small cell lung carcinomas. That drug, which is currently in clinical trials, is designed to
minimize the toxicities (such as skin rash) that can appear when WT EGFR is targeted, since WT
EGFR is expressed throughout the healthy tissues in the body18.
A challenge of drug targeting a single point mutation is that the mutation may not be
directly associated with a binding pocket. The presence of a binding pocket is traditionally
required for small molecule inhibitor development as is serves as a thermodynamic sink that can
attract binders. This requirement does not hold for antibodies and, in fact, several examples of
monoclonal antibodies directed against epitopes containing single amino acid mutations do
exist19,2,20. However, antibodies do not readily enter the living cells that can harbor the mutated
proteins21,22, and so, mutation-selective antibodies are typically only used as diagnostic reagents
for staining fixed cells or tissues.
Thus, there is a need for an approach that can identify small molecules that can be
generally targeted against epitopes containing single amino acid point mutations to allow for the
rapid detection and assessment of tumor status, and can also potentially be developed into cell-
20
penetrant inhibitors5. Our approach is inspired by the technique for developing an epitopetargeted monoclonal antibody (mAb). Such mAbs are made by injecting a small portion of the
protein of interest containing the mutation (the epitope) into an animal and screening for an
immune response that has the desired selectivity2,20,19. This approach can yield an antibody that
exhibits focused binding to the specific designated area of the protein surface.
An all-chemical strategy for targeting PCC agent development against epitopes near
phosphorylates sites was developed recently15. For that approach, an approximately 30-amino
fragment representing the phosphorylated epitope of interest was synthesized, and a
metalloorganic Zn-chelator was utilized to bind to the phosphate group and present an azide near
that site. That epitope was then screened against a large (1 million element) one-bead-onecompound (OBOC) library of 5-mer alkyne-presenting peptides. Hits were defined as those
compounds that bound to the synthesized epitope, and that were coupled to that epitope through
a triazole linkage. PCC Agents with high selectivity for the epitope and the full protein, and with
affinities as low as 19nM, were developed.
The bulk of my thesis work focuses on the generalization of the epitope targeting strategy
by directly substituting an alkyne click handle into the chemically synthesized peptide epitope
(around the E17K residue of Akt1) of interest. Chapter 3 describes how this technique was used
to develop a 5-mer PCC agent selective for the E17K mutant Akt1 protein. This PCC agent was
able to be used as a drop in antibody replacement for the detection of this single amino acid
mutation in various assays. It was also possible to render this agent cell-membrane permeable,
and this allowed it to be used as a focused imaging agent in live cell experiments. Chapter 4
describes the expansion of this PCC agent into a biligand and then a triligand through the use of
iterative in situ click chemistry in order to make a bulkier PCC agent. The final triligand PCC agent
is capable of blocking the binding of the mutant protein to its substrate at the cell membrane,
21
rendering it inactive and demonstrating the ability of these PCC agents to serve as targeted
therapeutics.
1.3
In Situ Click Screening Using Azide-Containing Phage
Display Libraries
Peptide screening technology has expanded incredibly in the past ten years since the
inception of the PCC agent project. Using the protein-catalyzed click screens described above,
PCC agents have been developed against only small chunks, or “epitopes” of proteins15, and
various PCC agents that have shown to be unique inhibitors and activators of Akt kinase23,15,
molecular imaging agents24, detection agents for anthrax14, suitable as third world detection
agents for HIV13, as well as the single amino acid point mutation specific E17K agents.
The OBOC libraries have their drawbacks, however. The physical size of the library limits
the number of total sequences that can be screened. A full library usually contains up to 10 6
members – only a portion of which are screened. The library screening and hit picking methods
are exceptionally time-consuming and labor-intensive, hindering rapid peptide discovery. The
sequencing of OBOC libraries is also done by either Edman degradation or MALDI TOF/TOF,
rendering the sequencing process expensive, time-consuming, and reliant on expert knowledge.
Many of these drawbacks are also a huge barrier to entry in this field, limiting the labs that would
be able to assist in the advancement of the science. PCC agents could be produced significantly
faster and cheaper with library display technology that would combine the advantages of the
OBOC product screening techniques and library design with the rapid screening and sequencing
of genetically displayed libraries.
Recent advances in biology have made it possible to incorporate unnatural amino acids
into the genetic code25. Schultz has shown that through the use of amber suppression, azidecontaining amino acids can be incorporated in specific locations into the pIII coat protein on an
22
M13 phage26. The Methanococcus jannaschii amber suppressor tRNATyr (MjtRNA) and the
mutant M.jannaschii tyrosyl-tRNA synthetase (MjTyrRS) DNA can be contained in one plasmid
that can be used to express these amber suppression tools in E.coli. In this system, the mutant
synthetase is used to attach the unnatural amino acid azidophenylalanine to the tRNA in vivo,
allowing for its incorporation into proteins. This tRNA recognizes the amber stop codon and
should insert the amino acid in only that location, creating a new amino acid/tRNA combination
that can be encoded into proteins.
Chapter 5 discusses the ongoing development of a screening technology that combines
the in situ click screen advantages of the OBOC process with the rapid screening of large libraries
characteristic of biological display systems. For this project, a phage display library containing
azidophenylalanine for use in in situ click chemistry screening has been made and is being used
to develop a PCC agent. These phage libraries can be screened in place of the OBOC peptide
libraries described in previous chapters for the more rapid development of PCC agents.
1.4
References
1.
Hanash, S. M.; Baik, C. S.; Kallioniemi, O., Emerging molecular biomarkers--blood-based
strategies to detect and monitor cancer. Nature reviews. Clinical oncology 2011, 8 (3), 142-50.
2.
Yu, J.; Kane, S.; Wu, J.; Benedettini, E.; Li, D.; Reeves, C.; Innocenti, G.; Wetzel, R.;
Crosby, K.; Becker, A.; Ferrante, M.; Cheung, W. C.; Hong, X.; Chirieac, L. R.; Sholl, L. M.; Haack,
H.; Smith, B. L.; Polakiewicz, R. D.; Tan, Y.; Gu, T.-L.; Loda, M.; Zhou, X.; Comb, M. J., MutationSpecific Antibodies for the Detection of EGFR Mutations in Non–Small-Cell Lung Cancer. Clinical
Cancer Research 2009, 15 (9), 3023-3028.
3.
Rusling, J. F.; Kumar, C. V.; Gutkind, J. S.; Patel, V., Measurement of biomarker proteins
for point-of-care early detection and monitoring of cancer. Analyst 2010, 135 (10), 2496-2511.
4.
Borrebaeck, C. A., Antibodies in diagnostics - from immunoassays to protein chips.
Immunology today 2000, 21 (8), 379-82.
5.
Kodadek, T.; Reddy, M. M.; Olivos, H. J.; Bachhawat-Sikder, K.; Alluri, P. G., Synthetic
molecules as antibody replacements. Accounts of chemical research 2004, 37 (9), 711-8.
6.
Edwards, P. J.; LaPlante, S. R., Peptides as Leads for Drug Discovery. In Peptide Drug
Discovery and Development, Wiley-VCH Verlag GmbH & Co. KGaA: 2011; pp 1-55.
7.
Sun, N.; Funke, S. A.; Willbold, D., Mirror image phage display – Generating stable
therapeutically and diagnostically active peptides with biotechnological means. Journal of
Biotechnology 2012, 161 (2), 121-125.
23
8.
Lam, K. S.; Lebl, M.; Krchňák, V., The “One-Bead-One-Compound” Combinatorial Library
Method. Chemical Reviews 1997, 97 (2), 411-448.
9.
Agnew, H. D.; Rohde, R. D.; Millward, S. W.; Nag, A.; Yeo, W.-S.; Hein, J. E.; Pitram, S. M.;
Tariq, A. A.; Burns, V. M.; Krom, R. J.; Fokin, V. V.; Sharpless, K. B.; Heath, J. R., Iterative In Situ
Click Chemistry Creates Antibody-like Protein-Capture Agents. Angewandte Chemie
International Edition 2009, 48 (27), 4944-4948.
10.
Kolb, H. C.; Finn, M. G.; Sharpless, K. B., Click Chemistry: Diverse Chemical Function from
a Few Good Reactions. Angewandte Chemie International Edition 2001, 40 (11), 2004-2021.
11.
Lewis, W. G.; Green, L. G.; Grynszpan, F.; Radić, Z.; Carlier, P. R.; Taylor, P.; Finn, M. G.;
Sharpless, K. B., Click Chemistry In Situ: Acetylcholinesterase as a Reaction Vessel for the
Selective Assembly of a Femtomolar Inhibitor from an Array of Building Blocks. Angewandte
Chemie International Edition 2002, 41 (6), 1053-1057.
12.
Millward, S. W.; Henning, R. K.; Kwong, G. A.; Pitram, S.; Agnew, H. D.; Deyle, K. M.; Nag,
A.; Hein, J.; Lee, S. S.; Lim, J.; Pfeilsticker, J. A.; Sharpless, K. B.; Heath, J. R., Iterative in situ click
chemistry assembles a branched capture agent and allosteric inhibitor for Akt1. Journal of the
American Chemical Society 2011, 133 (45), 18280-8.
13.
Pfeilsticker, J. A.; Umeda, A.; Farrow, B.; Hsueh, C. L.; Deyle, K. M.; Kim, J. T.; Lai, B. T.;
Heath, J. R., A Cocktail of Thermally Stable, Chemically Synthesized Capture Agents for the
Efficient Detection of Anti-Gp41 Antibodies from Human Sera. PLoS ONE 2013, 8 (10), e76224.
14.
Farrow, B.; Hong, S. A.; Romero, E. C.; Lai, B.; Coppock, M. B.; Deyle, K. M.; Finch, A. S.;
Stratis-Cullum, D. N.; Agnew, H. D.; Yang, S.; Heath, J. R., A Chemically Synthesized Capture
Agent Enables the Selective, Sensitive, and Robust Electrochemical Detection of Anthrax
Protective Antigen. ACS Nano 2013, 7 (10), 9452-9460.
15.
Nag, A.; Das, S.; Yu, M. B.; Deyle, K. M.; Millward, S. W.; Heath, J. R., A Chemical EpitopeTargeting Strategy for Protein Capture Agents: The Serine 474 Epitope of the Kinase Akt2.
Angewandte Chemie International Edition 2013, 52 (52), 13975-13979.
16.
Mardis, E. R., A decade's perspective on DNA sequencing technology. Nature 2011, 470
(7333), 198-203.
17.
Chong, C. R.; Janne, P. A., The quest to overcome resistance to EGFR-targeted therapies
in cancer. Nat Med 2013, 19 (11), 1389-1400.
18.
Tjin Tham Sjin, R.; Lee, K.; Walter, A. O.; Dubrovskiy, A.; Sheets, M.; St Martin, T.;
Labenski, M. T.; Zhu, Z.; Tester, R.; Karp, R.; Medikonda, A.; Chaturvedi, P.; Ren, Y.; Haringsma,
H.; Etter, J.; Raponi, M.; Simmons, A. D.; Harding, T. C.; Niu, D.; Nacht, M.; Westlin, W. F.; Petter,
R. C.; Allen, A.; Singh, J., In vitro and In vivo Characterization of Irreversible Mutant-Selective
EGFR Inhibitors that are Wild-type Sparing. Molecular Cancer Therapeutics 2014.
19.
Capper, D.; Zentgraf, H.; Balss, J.; Hartmann, C.; von Deimling, A., Monoclonal antibody
specific for IDH1 R132H mutation. Acta neuropathologica 2009, 118 (5), 599-601.
20.
Capper, D.; Preusser, M.; Habel, A.; Sahm, F.; Ackermann, U.; Schindler, G.; Pusch, S.;
Mechtersheimer, G.; Zentgraf, H.; von Deimling, A., Assessment of BRAF V600E mutation status
by immunohistochemistry with a mutation-specific monoclonal antibody. Acta neuropathologica
2011, 122 (1), 11-9.
21.
Marschall, A. L. J.; Frenzel, A.; Schirrmann, T.; Schüngel, M.; Dubel, S., Targeting
antibodies to the cytoplasm. mAbs 2011, 3 (1), 3-16.
22.
Rondon, I. J.; Marasco; A., W., Intracellular AntibodiesS (Intrabodies) For Gene Therapy
Of Infectious Diseases. Annual Review of Microbiology 1997, 51 (1), 257-283.
23.
Millward, S. W.; Henning, R. K.; Kwong, G. A.; Pitram, S.; Agnew, H. D.; Deyle, K. M.; Nag,
A.; Hein, J.; Lee, S. S.; Lim, J.; Pfeilsticker, J. A.; Sharpless, K. B.; Heath, J. R., Iterative in Situ Click
24
Chemistry Assembles a Branched Capture Agent and Allosteric Inhibitor for Akt1. Journal of the
American Chemical Society 2011, 133 (45), 18280-18288.
24.
Millward, S. W.; Agnew, H. D.; Pitram, S.; Lai, B. T.; Rohde, R. D.; Hardman, N., Protein
catalysed capture agents for molecular imaging. Internation Hospital Equipment and Solutions
2013.
25.
Wang, L.; Xie, J.; Schultz, P. G., Expanding the Genetic Code. Annual Review of Biophysics
and Biomolecular Structure 2006, 35 (1), 225-249.
26.
Tian, F.; Tsao, M. L.; Schultz, P. G., A phage display system with unnatural amino acids. J
Am Chem Soc 2004, 126 (49), 15962-3.
25
Chapter 2
Evolution of the OBOC Peptide Library
Screening Protocol
26
2.1
Introduction
2.1.1
Iterative In Situ Click Chemistry for Protein-Catalyzed Capture (PCC) Agent
Development
Previous work in the Heath lab demonstrated that the flexibility of chemically synthesized
One-Bead, One-Compound (OBOC) peptide libraries could be combined with the selective power
of the in situ click process to develop multi-peptide ligand capture agents that can serve as dropin antibody replacements in assays1. These peptide ligands can be made in large quantities
entirely by robots, making the scale-up cheap and robust. They are also highly stable agents that
can be used in a variety of assays, removing the need for the gold-standard antibodies in a variety
of protein detection techniques2,3.
The iterative in situ click screen to develop a capture agent starts with the discovery of a
peptide ligand that binds to a protein target through the use of OBOC library screening. Once a
peptide has been discovered, labeled the “anchor peptide,” it is appended with a click handle and
screened again against the protein in the presence of a new OBOC library that contains the
opposing click handle, as seen in Figure 2-1. When a library member binds to the surface of the
protein in close proximity to the anchor ligand and is held in place through a high-affinity for the
protein target, a click reaction between the anchor and library-bound ligand can occur without
the use of the Cu(I) catalyst. The addition of this new ligand, the secondary ligand, forms a
“biligand” in complex with the original anchor. This selection technique allows the protein target
itself to catalyze the formation of the peptide ligands that bind to it with the highest affinity and
selectivity. This iterative process can be performed as many times as necessary to produce a
ligand with the desired affinity and specificity for the target, and serves as the basis for the
iterative in situ click chemistry technique for protein-catalyzed capture (PCC) agent production.
After a PCC agent has been discovered using this technique, the Cu(I) catalyst can be brought back
in order to scale-up the final click triazole-containing product in high quantities.
27
The technology as presented by Agnew, et al1 provided a solid foundation for the
construction of these PCC agents, but the methods, discussed in section 2.3.1, were timeconsuming and labor-intensive, making rapid ligand discovery very difficult. After this BCAii proofof-concept PCC agent was completed, the next stage of technology development required an
optimization of the techniques involved in order to increase the robustness and output of the
overall process. This chapter describes the transformation of the OBOC iterative in situ click
technology into an efficient and robust technique.
2.1.2
Prostate Specific Antigen (PSA)
Prostate Specific Antigen (PSA) is a serum protease produced by the prostate. The
accurate detection of PSA levels in the blood can be a strong indicator of the presence of prostate
cancer, but this result is confounded by the elevated PSA levels also seen in Benign Prostate
Hyperplasia (BPH), a non-cancerous condition4. In serum, PSA is partially in complex with α1antichymotrypsin (ACT), with 60-95% generally found as a PSA-ACT complex while the rest of the
PSA remains free. It has also been discovered that the PSA-ACT fraction is larger in prostate
cancer, whereas BPH has more PSA free in serum4. It was hypothesized, therefore, that a better
PSA detection test could be designed to measure this through the use of PCC agents, and much
of the screening strategies developed in this chapter were focused on the design of this agent.
28
Anchor
X
Biligand
screen
Target
protein
X
OBOC
>1 million element library
X
Triligand
screen
X
X
Figure 2-1: Iterative In Situ Click Screening Core Technology.
An anchor ligand that binds to the protein target can be appended with a click handle. In the presence
of the protein and a OBOC library appended with the opposite click handle, the anchor can click onto
the library to form a biligand. The click only occurs when the anchor and library bead are held long
enough on the protein surface, so the protein selects ligands with high affinities and selectivities. This
process can be repeated as many times as necessary.
29
2.2
Materials and Methods
2.2.1
Standard Materials
All amino acids were purchased from Aapptec as the FMOC carboxylic acid with the
standard TFA side-chain protecting groups. HATU (2-(7-Aza-1H-benzotriazole-1-yl)-1,1,3,3tetramethyluronium hexafluorophosphate) and PEG5 (Fmoc-NH-PEG5-CH2CH2COOH, Fmoc-18amino-4,7,10,13,16-pentaoxaoctadecanoic acid) were purchased from ChemPep. DIEA
(diisoproylethylamine), TES (triethylsilane), and TFA (trifluoroacetic acid) were purchased from
Sigma. TentaGel beads were purchased as 90μm S-NH2 beads, 0.29mmol/g, 2.86x10⁶ beads/g
from Rapp Polymere (Germany), and Rink Amide resin was purchased from Anaspec.
2.2.2
Peptide Library Construction
Peptides and peptide libraries were synthesized by
hand until the summer of 2009, when they were then
synthesized on a Titan 357 split-and-mix automated peptide
synthesizer (Aapptec) via standard FMOC SPPS coupling
chemistry5 using 90μm TentaGel S-NH2 beads.
Libraries
Figure 2-2: OBOC Peptide Library
constructed on TentaGel Resin.
Where X is comprised of all of the
naturally occurring D – amino
acids except Cys and Met.
contain 18 D-stereoisomers of the natural amino acids, minus cysteine and methionine (unless
otherwise stated), at each of five randomized positions and an azide or alkyne in situ click handle.
At least a five-fold excess of beads is used when synthesizing libraries to ensure efficient
oversampling of each sequence. Amino acid side-chains are protected by TFA labile protecting
groups that are removed all at once following library synthesis.
30
2.2.3
Bulk Peptide Synthesis
Bulk synthesis of peptide sequences was performed using standard FMOC SPPS peptide
chemistry on either the Titan 357 automated peptide synthesizer (AAPPTEC) or a Liberty 1
microwave peptide synthesizer (CEM Corporation). The typical scale was 300mg on Rink Amide
Resin, unless otherwise noted.
Peptides were cleaved from the beads with side-chains
deprotected using a 95:5:5 ratio of TFA: H2O: TES. The peptides were purified on a prep-scale
Dionex U3000 HPLC with a reverse-phase C18 column (Phenomenex).
2.2.4
Detection
Typical Screening Protocol for Fluorescent Dye-labeled Protein Target
Hit beads in the initial OBOC screens were detected via a fluorescent probe attached to
the protein target of interest. The target protein was labeled using an Alexa-Fluor 647 Microscale
Protein Labeling Kit, following all manufacturer’s instructions. The activity of the target enzymes
was then tested before screening to ensure that the dye label did not disturb function or folding.
Screens were conducted using a OBOC library of 5-amino-acid-long peptides composed
of the D - isomers of 19 naturally occurring amino acids (no Cys, for stability reasons). 100mg of
dried library was weighed for screening (~280,000 unique sequences, ~42% sampling of sequence
space) and swelled in 1xTBS buffer (25mM Tris, 150mM NaCl, 10mM MgCl2, pH = 7.5) containing
0.05% NaN3, 0.1% BSA, and 0.1% Tween-20 (TBSTBNaN3). The library was then blocked for one
hour in this buffer, then 50nM protein in 1.5mL TBSTBNaN3 was added, the screen wrapped in foil
to protect the light-sensitive dye label, and incubated overnight on a 180° shaking arm. In the
morning, the buffer containing the protein was drained from the beads, which were then washed
three times with TBSTBNaN3, three times with TBS + 0.1% Tween-20 (TBST), then three times with
1xTBS. The beads were then dried on a vacuum and spread to a monolayer on approximately 10
clean microscope slides for about 10mgs of beads per slide. The slides were imaged on a GenePix
31
Pro 5.1 microarray scanner at 635nm to view beads containing bound fluorescent protein target.
The dye saturated the color signal of the GenePix, and the hit “beads” that were considered
appeared white in a sea of red, due to the background auto fluorescence of the TentaGel library
(Figure 2-4). These hit beads were then removed from the microscope slides using a needle,
stripped of protein with 7.5M pH = 2.0 Guanadine-HCl buffer, rinsed in water, and sequenced via
Edman degradation on an Applied Biosystems Procise CLC 494 system.
2.2.5
Screens
Typical Screening Protocol for Antibody Signal Amplification Target Only
100mg of library beads were prepared, washed and blocked for one hour as for the
fluorescent detection screen. The library was then incubated with about 50nM, which differed
slightly based on the exact screen, of protein overnight at room temperature. In the morning, the
library was washed five times with 1xTBS + 0.1% BSA + 0.1% Tween-20 (1xTBSTB). The primary
anti-protein target antibody was incubated with the library for 1 hour, washed five times with the
1xTBSTB buffer, then incubated with the secondary anti-mouse alkaline-phosphatase antibody
for one hour. The library was then washed five times with the TBSTB buffer, three times five
minutes each in high salt buffer (1xTBS + 600mM NaCl), and five times in 1xTBS. The screen was
developed with a two part BCIP/NBT system: 10mL TBS + 26 μL BCIP + 13 μL NBT. This detection
cocktail was mixed with the library beads, which were poured into a large polystyrene dish for
visualization of the color change under an optical microscope. Hit library members appear as dark
purple among the normally clear beads (Figure 2-6), and are removed using a pipet. They are
washed, stripped, and sequenced as above.
32
2.2.6
Typical Screening Protocol for an Anti-Screen
The library beads (typically 250-500mg) swelled in 1xTBS were blocked 2 hours to
overnight in 5% milk in 1xTBS, washed three times with 1x TBS, then incubated with an off-target
protein in 0.5% milk in 1xTBS for one hour on the shaking arm at room temperature. The beads
were washed three times with 1x TBS, then incubated with the anti-off-target protein - alkaline
phosphatase conjugated antibody in 0.5% milk for one hour at room temperature. The antibody
used here must be the same antibody used in the target screen in order to ensure that the library
members that bind to this antibody are removed and not mistaken for hits. The library resin was
then washed three times with high salt buffer and let shake for one hour in high salt at room
temperature before being washed three times with BCIP buffer (100mM Tris-Cl, 150mM NaCl,
1mM MgCl2, pH = 9.0) and developed by adding 15mL BCIP buffer plus 13μL BCIP and 26μL NBT.
The beads that turned purple bound to both mutant and wildtype protein or to the detection
antibodies, and were discarded. The beads that remained clear after this step were picked and
washed with guanidine-HCl to remove any bound proteins.
The off-target protein can be a different version of the target, such as a wildtype protein
when detecting for a mutation, or a protein lacking a certain domain or post-translational
modification of interest, such as a phosphorylation site or glycosylation. Anti-screens can also be
designed to clear against any number of interferents, such as whole human serum, to remove any
generally sticky peptide sequences. For these anti-screens, the antibody used for detection is an
anti-whole human serum antibody followed by a secondary alkaline-phosphatase conjugated
antibody.
33
2.2.7
Typical Target Screening Procedure During a Multi-Step Screen (Figure 2-3)
The library beads were blocked in 5% milk in 1x TBS for two hours to overnight. They
were then washed three times with 1x TBS. The target protein and anchor peptide or small
molecule targeting agent6 were pre-incubated in 3-5mL of 0.5% milk in an approximately a 10:1
ratio, ensuring the same concentration of anchor peptide used in the preclear. This solution was
added to the blocked library beads and incubated for either 5 hours or overnight to allow an in
situ click reaction to occur. In the morning, the beads were washed three times with 1x TBS, then
incubated with the same dilution of an anti-target alkaline phosphatase conjugated antibody that
was used in the anti-screen in 0.5% milk for one hour. The beads were then washed three times
with a high salt TBS, then incubated on the shaking arm for one hour with the high salt buffer.
They were then washed three times with BCIP buffer and developed as previously. Hit beads
turned purple and were removed and washed in NMP for four hours to decolorize, then
guanidine-HCl to denature and remove and remaining protein.
Figure 2-3: Typical Antibody-Detected Target Screen. The library is incubated with the protein target, which is detected
via antibodies conjugated to alkaline phosphatase. The screen is developed with BCIP/NBT, and hit beads turn purple.
2.2.8
Typical Screening Protocol for a Preclear
Swelled library beads (250-500mg) were blocked overnight in 5% w/v dried non-fat milk
in 1x TBS, then washed with 1x TBS three times. The beads were incubated with a μM solution of
any anchor peptide or small molecule for one hour, then washed 3x with 1xTBS. Five milliliters of
either a 1:10,000 dilution of streptavidin-alkaline phosphatase conjugate in 0.5% milk in TBS or an
anti-biotin antibody were added to the beads and incubated with shaking at room temperature
for one hour. If the anti-biotin antibody was used, a secondary antibody conjugated to alkaline
34
phosphatase was then incubated with the library for 1 hour after it was washed three times in
1xTBS. The beads were washed with a high-salt TBS buffer three times, then were left to shake
in high salt buffer for one hour. The beads were then washed three times with BCIP and
developed as for the anti-screen. After one hour, the purple beads were removed by pipette and
discarded. The remaining beads were incubated in NMP 4 hours to remove trace purple
precipitate from the BCIP/NBT reaction, then were washed five times with methanol, five times
with water, five times with TBS and blocked overnight in 5% milk.
2.2.9
Typical Screening Protocol for a Click Product Screen
The beads that pass through the target and anti-screen were washed three times with 1x
TBS. They were then incubated with a 1:10,000 dilution of either streptavidin – alkaline
phosphatase conjugate or anti-biotin antibody (whichever was used in the preclear) in 0.5% milk
for one hour. The beads were washed three times with high salt TBS then let shake for one hour
with high salt buffer before being washed three times with BCIP buffer and developed as
previously. The beads that turned purple contained the anchor peptide covalently bound to the
bead and had formed a protein-catalyzed in situ click reaction. These beads were collected and
stripped with guanidine-HCl for one hour, washed ten times with water, and sequenced via Edman
degradation.
2.2.10
Peptide Sequencing Strategies
The OBOC peptide library sequencing method most commonly used by Caltech is Edman
degradation.
This process involves treating a peptide with a free amine terminus with
phenylisothiocyanate, which reacts stoichiometricly with the N-terminus of the peptide to form a
phenylthiocarbamyl (PTC)-peptide derivative. This PTC derivative is then treated with TFA to
cleave it off from the rest of the peptide, leaving behind a new N-terminus to react during the
35
next cycle. Meanwhile, the PTC amino acid is then analyzed via HPLC, and the peak is compared
to standards of all of the PTC-amino acids in order to determine the residue. One cycle per amino
acid residue is performed and analyzed, providing the sequence of the peptide on the hit library
bead7. This method is slow, but highly accurate and has been automated by Applied Biosystems
into the Procise CLC 494 Automated Edman Degradation machine used by Caltech.
Hit peptide sequences can also be determined through MALDI-TOF/TOF MS. For this
method, the library must be specially made. The peptide must be attached to the library through
a methionine amino acid, and no other methionine can be present in the library. The isobaric
amino acids, isoleucine and leucine, lysine and glutamine, are doped by anther amino acid in order
to properly call the sequence by mass. Glutamine is doped with a 6% molar equivalent of glycine,
and isoleucine is doped with a 7% molar equivalent of alanine. While reading the mass of these
amino acids on the MALDI, any residue that has one of these amino acids can be distinguished by
the presence or absence of the small satellite parent mass corresponding to the same sequence
plus glycine or alanine8.
In order to sequence the library hit by MALDI-TOF/TOF, the bead is first treated with
cyanogen bromide in order to cleave the peptide from the bead at the methionine amino acid. It
can then be dissolved in MALDI matrix and spotted onto the plate. The peptide parent peak is
first discovered using MALDI-TOF, then is fragmented again in order to break it up into smaller
amino acid ions. These ions can be analyzed using standard peptide MS techniques to determine
the sequence8.
36
2.3
Results and Discussion
2.3.1
Screening via Fluorescent Dye-labeled Protein Target Detection
The initial OBOC peptide screening strategies
developed by Heather Agnew1 relied on a fluorescent
dye-labeled protein in order to detect hit binding. The
target protein of interest was labeled with a dye, and any
library beads that bound to the target were detected on
a GenePix microarray reader. As seen in Figure 2-4, the
TentaGel library beads also auto-fluoresce, meaning that
all screens conducted in this fashion were highly
subjective, and the hit quantity depended entirely on the
gain settings of the microarray. AlexaFluor-647 was also
the only dye that was used, as the beads auto fluoresce
Figure 2-4: Image of Hit Beads on GenePix
Microarray Scanner. The bright white beads
are saturating the fluorescence and are
considered “hits” above the background
TentaGel auto fluorescence.
the least in the range of this dye. These hits were mostly
picked using a light microscope, meaning that the images
from the microarray had to be used as a “map” to guide
the bead picker to the correct clear bead on a slide of thousands. This process was highly
inefficient, requiring up to an hour to pick each individual hit bead. These picked hits were always
imaged again on the GenePix to ensure that each bead that had been selected was a highly
fluorescent bead, indicating that the correct one had been chosen based on the map. It was
possible to use a COPAS automatic bead sorter to separate out the hit beads, though one was not
available at Caltech.
The sequences from a typical fluorescent target screen are shown in Table 2-1. The hits
were generally dominated by the positively charged residues, arginine and lysine.
This
overwhelming charged signal is most likely due to the overall (-3) charge on the AlexaFluor 647
37
dye,9 which is attracting the positively charged amino acid sequences and creating a significant
level of noise in the final hits. Most screens had to be run many times in order to find enough
quality hit sequences, meaning ones that did not contain almost exclusively arginine and lysine
residues, because of this high background. Generally, a hit that contained 3 or more positively
charged amino acids was considered background and removed from the pool. One screen rarely
yielded more than a handful of hits that appeared to be binding to the surface of the protein and
not just to the dye.
Focused screens were also
Position X2
used in order to hone in on target-
Frequency
6
4
binding peptide sequences.
2
focused libraries used in these screens
0
i
h
w
q
a
t
The
were designed based on histograms of
Amino Acid
the amino acids that were seen at each
Figure 2-5: Histogram of Position X2 in PSA Screens. The hits from
multiple PSA screens were pooled and analyzed. This sample chart
shows the frequency of an amino acid at position X2 in the library,
and is used to synthesize the focused library.
library position, meaning X1 -> X5 as
seen in Figure 2-2, after the removal of
the dye label background sequences. As can be seen in Figure 2-5, in this particular PSA screen,
there were only six amino acids that were seen at position 2, so only these six amino acids were
built into the focused library at position 2. This reduction in total amino acids present in each
position allowed for the synthesis of a much smaller library that could be oversampled in each
screen to permit a more thorough sampling of the sequence space. Only about 100mg of beads
were usually screened, but 100mg could frequently oversample the sequence space of a focused
library, compared to that of naïve libraries where less than half of the space was sampled. Due
to this increase in sequence space sampling, focused libraries were generally extended by one or
two amino acid positions in the hopes that a slightly longer peptide would have a higher affinity
38
and selectivity for the protein target. The screening was then repeated with the focused libraries,
and the same process for analyzing hits was repeated until the peptide sequences converged in
sequence homology and produced a peptide ligand that showed near μM affinity for the protein
target.
This convergence frequently required the use of two to three separate focused libraries
with accompanying screening and sequencing. The overall time required to determine one
peptide ligand that bound to the target protein of interest could easily take more than six months.
These ligands also regularly bound in the range of low μM affinities, which are generally
considered to be fairly weak binders.
Table 2-1: Screens from Sample Target Screen Using Fluorescent Protein Detection. This screen
was performed against PSA protein labeled with AlexaFluor 647 dye. Note the high prevalence of “r” and “k”
positively charged amino acids. See Figure 2-2 for a visualization of the X amino acid positions on bead.
X1
y
r
r
r
m
r
r
r
r
r
l
r
r
r
f
r
k
X2
r
i
f
r
r
r
r
r
l
f
s
r
r
r
y
k
r
X3
r
f
l
k
r
r
w
r
r
r
r
r
m
k
r
w
r
X4
r
r
r
r
w
w
i
f
w
i
r
y
r
p
r
l
m
X5
r
r
a
f
r
p
r
l
r
r
r
t
w
r
r
w
r
39
2.3.2
Screening via Antibody Signal Amplification Target Only Screens
Detecting hit peptides via fluorescence was a very time-consuming process in which the
high
noise
from
the
overwhelming
presence of positively charged amino acids
meant that very little meaningful output
was obtained.
For this reason, a new
method of screening was developed using
a tag-less protein to switch the screening
Figure 2-6: Image of Hit Bead Developed with BCIP/NBT.
High background lighter purple surrounding beads could be
removed through later preclear and antiscreen steps.
focus from the charged dye label back to
the target. This technique relied on anti-target antibodies conjugated to alkaline phosphatase,
which is an enzyme that can form a dark purple precipitate in the presence of its BCIP/NBT
substrate. This meant that any “hit” now showed up as a very dark purple bead in a sea of clear.
The label-less detection technique, therefore, provided the additional benefit of a colorimetric
readout of a hit, allowing for the much easier separation of these beads from the rest of the
library.
As can be seen in sample screen results in Table 2-2, the high prevalence of positively
charged amino acids is gone. In fact, the comparison between Table 2-1 and Table 2-2 is startling,
considering that the only difference between these two screens is the target detection method.
This demonstrates that the dye label was having a dramatic effect on the quality of hit sequences
and was responsible for much of the large time investment that was devoted to screening. This
huge reduction in noise now meant an instant reduction in the number of screens that needed to
be run and sequenced in order to see homology. The colorimetric hit visualization also permitted
larger numbers of beads to be screened much faster, so the overall number of library sequences
that were sampled went up even though fewer screens were run. One BCIP/NBT-developed
screen could sample the same number of beads as up to five different fluorescent screens in less
40
time, as all of the hits could be picked in the time it used to take to pick one. With this increase
in both sampled sequence space and in the overall signal to noise seen in the sequences, hit
quality and screening speed improved dramatically in a much shorter overall time.
Table 2-2: Screens from Sample Antibody Amplification Screen Using BCIP/NBT Protein
Detection. Screen was performed against unlabeled (PSA), detected with PS2 mouse mAb anti-PSA antibody
and anti-mouse-AP secondary antibody with BCIP/NBT readout.
X1
n
e
w
s
a
n
G
e
f
e
v
e
d
i
y
d
e
2.3.3
X2
g
t
t
e
n
y
n
d
e
i
e
h
e
w
d
d
n
X3
m
q
d
d
d
d
m
v
n
n
f
d
t
n
d
e
t
X4
e
m
e
d
e
p
d
l
d
e
G
a
a
m
s
a
i
X5
d
d
m
t
e
e
d
i
a
l
e
y
t
e
l
G
d
Introduction of an Anti-screen
The antibody development technique dramatically improved the quality of hit peptides
by visual inspection (Table 2-1 versus Table 2-2), but also introduced a hidden source of noise into
the screens. The presence of several different antibodies and a new detection agent in the screen
itself provided more “off-target” sources of library binding. This was conclusively demonstrated
by Steve Millward while screening for an Akt capture agent. He developed a biligand using the
standard in situ click chemistry technique with antibody development, and proceeded to test the
affinity of this ligand via SPR. The SPR was set up to immobilize an anti-FLAG antibody (the same
used in screening) to the flow cell in order to capture the much less stable Akt protein that might
41
not survive the required EDC/NHS coupling step. A blank flow cell of only Anti-FLAG antibody
without Akt was used as a chip blank. The data from these SPRs is seen in Figure 2-7. The
sensorgram on the right shows binding to the Akt, as to be expected, but the sensorgram from
the blank flow cell on the left shows an identical signal. In conjunction with data (not shown)
from the anchor ligand that has almost no binding to the anti-FLAG flow cell, we can conclude
that the biligand is actually binding to the anti-FLAG antibody, present in both of those flow cells,
and not to the desired Akt target protein. It is only logical that we would see “hits” of peptide
sequences that bind to these antibodies, because the presence of the detection antibody bound
to a library bead would show BCIP precipitation exactly like the presence of the target protein. A
new screening step was needed that would remove the signal seen from the binding of these
other proteins used in the screening process.
Figure 2-7: SPR Data from Akt Biligand. Data from Steve Millward’s Akt Biligand Capture Agent. An anti-FLAG
antibody was immobilized onto an SPR chip via standard EDC/NHS coupling techniques. It was used to capture a FLAGtagged Akt protein for testing. As seen from the figure on the left, the capture agent bound equally as well to the flow
cell immobilized with only Anti-FLAG antibody, supposed to be the chip blank, as to the one on the right that also
contained immobilized Akt indicating that the biligand’s affinity actually stems from the Anti-FLAG antibody and not the
Akt protein target.
Around this time, there was interest in developing capture agents for proteins containing
post-translational modifications, such as phosphorylations or glycosylations. It was hypothesized
that hits specific for a post-translational modification could be discovered by screening against
the protein target containing the modification, then anti-screening against the protein target with
42
the post-translational modification removed, since everything else in the screen would be
identical (Figure 2-8). These screens entailed first “target screening,” as per usual antibody
detection screens, to find all of the hit beads that have an affinity for the target. These beads
were then be stripped of their purple color and bound proteins and incubated with the off-target
protein that had the post-translational modification removed. Any purple hits from the antiscreen were thrown out as not specific for the modification, since they demonstrated binding in
a screen that did not contain the site of interest. This new screening step has the added benefit
of removing all of the hits that also have an affinity for the antibodies or developing solution that
was used in the screen. An anti-screen like this would have prevented the development of a
biligand with an affinity for the anti-FLAG antibody, as these hits would have been detected in
both the target and the anti-target screen, and would have been discarded.
The anti-screen is an important step that is now incorporated into each screen that is run
in the lab, and is responsible for a significant reduction in background hits. For example, an antiscreen that was run for the PSA protein eliminated 91% of the hit beads from the target screen,
indicating that approximately 91% of what was previously considered to be a target hit was just
background. For visualization purposes (Table 2-3), this means that a screen run with 250mg of
beads went from 167 hits down to 15 after this step. This cut down on not only sequencing and
hit analysis/testing time, but also eliminated the time that was usually spent trying to tease out
signal from noise. Focused screens were also no longer necessary, as that step was designed to
help enrich for signal, eliminating a significant chunk of time necessary for developing a capture
agent.
Current screening protocols have evolved significantly to include stringent anti-serum
anti-screens in order to make capture agents that can function in the most complex mediums,
such as out of blood and in cells. For these anti-screens, the decolorized target hit beads are
43
incubated with anywhere from 1% - 25% human serum to remove even the marginally sticky
peptides from the pool of potential candidates.
Figure 2-8: Sample Anti-Screen Step. The target hits are stripped of target, decolorized, and incubated with an offtarget or general interferent such as human serum. The off-target is detected with an off-target antibody (the target
antibody should also be included if it is different), and these purple beads are non-specific binders, which are removed.
The clear beads are specific for the target.
2.3.4
Introduction of a Click Product Screen
The in situ screening process has an inherent screening advantage that had not yet been
exploited. A covalently-linked product is formed on the surface of the bead during the screen
that can be detected separately from target binding. This means that in addition to probing the
library for beads that bind to the target, the library can be searched additionally for the presence
of the in situ click product – a completely complementary screen.
Once an anchor ligand has been discovered, the next step in the in situ screening process
(Figure 2-1) involves the clicking of a new peptide ligand onto this anchor ligand. In order to
accomplish this, the anchor peptide is appended with a click handle and pre-incubated with the
target protein, and then both are incubated with the OBOC library. This step searches for a library
peptide that binds in close proximity to the anchor peptide on the surface of the protein target,
and will “click” onto the anchor if held in position long enough. This click reaction covalently
attaches the anchor peptide onto the library bead. By first appending the anchor peptide with a
biotin tag, the presence of the anchor peptide on bead, or the ability of this library candidate to
“click” to the anchor, can be probed independently of the presence of the target on bead. These
screens involve harsh, denaturing wash steps that ensure that everything not covalently attached
44
to the library will be removed and not detected by either the streptavidin conjugated to alkaline
phosphatase or an anti-biotin antibody. These detection agents will bind to the biotin label on
the anchor that will only be present after a covalent reaction has occurred, and can therefore
detect which library members have formed a click product (Figure 2-9).
Continuing the comparison with the
Table 2-3: PSA Screening Statistics. These hit bead statistics
are taken from a screen against PSA. The percent column
indicates the percent of beads that passed from one stage of
the screen to the next.
Start
Target Screen
Anti-screen
Product Screen
Beads
375,500
167
15
7
PSA screens from above, only 7 of the 15
Percent
remaining beads after the anti-screen showed
0.04%
9%
47%
the presence of a click product. The other 8
beads could very easily have been hits that
would be a different anchor ligand – a peptide ligand that is binding specifically to the target
protein, but is not close enough to the original anchor for a click to form. The sequences from
these hits, shown in Table 2-4, are very nearly identical peptides, and contrast sharply with the
previously identified hits from the anti-screen in Table 2-2. This indicates that the sequences are
more than likely all binding very strongly to the exact same location and in close proximity to the
anchor ligand, allowing for the formation of the click product.
Table 2-4: PSA Hit Bead Sequences from Product Screen. The product hits shown in Table 2-3 were
sequenced. There is an enormous sequence homology, meaning that the same part of the target is
being targeted. The end of the last sequence and the 7th hit were lost due to machine error.
X1
Y
Y
L
e
a
a
X2
G
d
G
G
d
G
X3
w
w
w
w
w
-
X4
r
r
r
r
r
-
X5
e
q
e
e
q
-
The product screen is an elegant step in the screening process that allows for the very
specific narrowing of the sequence space. It has become such a huge part of the success of the
OBOC capture agent development process that naïve anchor screens, which inherently cannot
45
include product screens, have been completely eliminated. This switch to all in situ click screens
has greatly increased both the specificity and affinity of the original anchor ligands, dramatically
improving the quality of the final PCC agent. Details of the rationale and results from these more
targeted screens can be seen in Chapter 3.
Figure 2-9: Sample Product Screening Step. The specific hits that survive the anti-screen are stripped of all non-covalent
binders and incubated with anti-biotin alkaline phosphatase (or streptavidin). The purple hits from this screen indicate
those in which a click reaction has covalently attached the anchor ligand onto the library bead.
2.3.5
Introduction of a Preclear
Three of the candidates from Table 2-4 were scaled up. In order to do this, the secondary
arm is clicked to the original anchor using Cu(I) to form a “biligand,” and is tested for binding to
the PSA protein. Unfortunately, none of the biligand candidates shown in Table 2-4 demonstrated
binding to the PSA protein in either ELISA assays or SPR, even though the anchor ligand by itself
was still able to bind (indicating that all of the parts of the assays were working). The secondary
ligands themselves also did not show any binding to the PSA protein, independent of the anchor
ligand. These ligand sequences from the click screen, however, were very homologous, indicating
that they were all binding in the same place, which was somewhere they could click onto the
anchor peptide. It would be impossible to see that level of similarity in the hit sequences,
otherwise. Unfortunately, during the screening process, the anchor ligand itself is present in ten
times higher quantity than the protein target, and can also bind to the library beads. It was
hypothesized, therefore, that the anchor ligand itself bound to those library sequences tightly
enough to catalyze the click product that was detected in the final screen. This scenario would
46
explain why the biligands showed no binding to the protein – the anchor could no longer even
bind to the target with another ligand, potentially blocking those binding sites. It also explains
why the secondary ligands showed no affinity for PSA. They were not ligands that bound to the
target, and wouldn’t have an affinity for it.
To counter this effect, a new screening step was added at the beginning of the process to
remove all of the library peptides that bound to the anchor ligand before the anchor ligand even
saw the target protein (Figure 2-10). These screens still detect the biotin label on the anchor
ligand, and the detection with streptavidin or anti-biotin in this “preclear” step eliminates the
need to use these detection agents in the anti-screen. The preclear screens generally remove 110% of the library beads, depending on the library, and also reduce the percentage of beads that
need to be removed in the anti-screen.
Figure 2-10: Sample Preclear Screening Step. The library is incubated with an anchor or biligand, which is then detected
with an anti-biotin alkaline phosphatase conjugated antibody (or streptavidin), and developed with BCIP. The purple
beads from this screen bind to either the initial ligand or the detection antibody.
2.3.6
Use of Alkyne Versus Azide Libraries
Throughout the course of technology development, certain seemingly trivial details
become important. For the OBOC screens, different libraries and slightly different conditions
produced vastly different results. The first issue with the propargylglycine alkyne-containing
amino acids surfaced initially after the addition of multiple stages to the screening process. After
undergoing more than three rounds of screening, washing and denaturing, the libraries containing
the alkyne were no longer able to be successfully sequenced via any method - Edman degradation
or MALDI TOF/TOF. The Edman spectra were entirely blank, indicating that the amino acid
47
residues were probably not cleaving from the beads, and the MALDI TOF/TOF was unable to
identify a parent peak that contained the fixed alkyne amino acid. The alkyne-containing amino
acid was the N-terminal residue, the first residue that needed to cleave via Edman, and anything
modifying this amino acid would affect the cleavage. It was hypothesized that the BCIP/NBT
developing solution was modifying these amino acids, which was confirmed by the use of Cterminal alkyne libraries. Even after undergoing four screening steps, the libraries still sequenced
correctly using Edman degradation up to the alkyne amino acid. These same library hits, though,
were not able to be sequenced using MALDI-TOF/TOF. Because the TOF/TOF would be greatly
affected by an unknown change to an amino acid, it was assumed that the alkyne was somehow
being modified during these screening steps. For this reason, azide-containing libraries are now
always used when undergoing more than three screening steps, unless a C-terminal alkyne library
with Edman degradation sequencing is appropriate.
It was also noticed that the libraries that contained a propargylglycine seemed to have
more difficult preclears, meaning more purple hits to remove, than the libraries that contained
the Lys(N3) azide amino acid. To test this, two libraries, identical except for their N-terminal azide
or alkyne click handle, were blocked in 5% milk in TBS. The libraries were washed three times in
TBS, then developed with the BCIP/NBT solution used in the methods section. After 45 minutes,
about 5% of the beads in the alkyne library turned bright yellow, indicating binding of the NBT
substrate. The azide library did not show this background substrate turnover/binding, and it was
assumed that this was related to the sequencing issues with the alkyne libraries. If the NBT
substrate is somehow changing or appending to the propargylglycine amino acid, it could explain
why the sequences no longer appear as they should during screening.
48
2.3.7
Typical Flow of Screening
With a multi-stage screening process now in place, the some of the steps need to be
conducted in a certain order to achieve the correct results. The first step is the preclear. This
occurs before the anchor ligand sees the protein target, and has a chance to form legitimate
clicked-hit peptides on bead. These screens look for anything that binds to streptavidin, alkalinephosphatase, BCIP/NBT, and the anchor peptides. Usually, a screen begins with 300-500mg of
library beads, and 1-10% are removed. Typically, any bead that has turned even the lightest shade
of purple is removed in order to reduce the overall background as much as possible. This means
that any bead that passes through this stage of the screening process has remained clear.
The next step is the target and click-catalyzed screen. The beads that remained clear in
the preclear are incubated with the target of interest and the anchor ligand overnight for a click
reaction to occur. These beads are then probed for the presence of target. Any bead bound to
target will turn purple, and passes through to the next stage of screening. Even though the onbead click has occurred during this screen, probing for the click product occurs at a later stage.
The hits from the target screen are then decolorized and incubated with an off-target
protein or proteins. Any library bead that binds and turns purple in this screen demonstrates offtarget interactions with other proteins, and is removed from the pool. At the end of this screen,
only beads that remain entirely clear are kept. Even slight purple can indicate undesirable
interactions and background binding, and are removed from the pool of hits.
The final screening stage probes for the presence of the clicked product on bead. After
harsh denaturing and washing conditions, the beads are probed for the presence of biotin. These
beads will turn purple only if biotin is linked to the bead, which is only possible if the in situ click
reaction was successful. These purple hits have proven to have no affinity to the screening agents
in the preclear, an affinity for the target but not off-target interactions in the target and antiscreens, and then have also shown involvement in the covalent click reaction. The clear-purple-
49
clear-purple pattern of hit detection also ensures that the beads are behaving properly at each
stage in the process.
Screens following this pattern now have several produced high-affinity ligands that are
very selective to their target of interest. This methodology has an incredibly high success rate
that is only getting better as the process continues to grow and develop.
2.4
Conclusions
Over the past ten years in which the project has been in existence, protein-catalyzed
capture (PCC) agents have proven to be highly effective detection agents that are incredibly stable
and easy to synthesize1,2,3,6,10. These agents can be made almost entirely with robotics for ease of
scale-up, and the capture agents are highly modular, so the addition of labeling tags is trivial. The
exact chemical structures of each of these capture agents are known, eliminating the batch to
batch variability that is common with antibodies and can cause multiplexed assays to be expensive
and difficult to produce. A spin-off company, InDi Molecular, is in place for commercialization of
these agents. PCC agents are also completely stable, demonstrating no degradation upon
incubation with mouse liver enzymes, and full functionality after being stored at 65°C as a powder
for weeks2, demonstrating their excellence for use in anything from clinical work to detection of
diseases in third world countries3. The technology development discussed in this chapter has
revolutionized how screening for PCC agents occurs, and the robustness of these techniques has
provided a solid foundation for the rapid discovery of a multitude of additional agents for a wide
range of purposes 1,2,3,6,10.
50
2.5
Acknowledgements
The work described in this chapter was done in conjunction with Heather Agnew and
Steve Millward. The initial OBOC screening techniques used were developed by Heather, and the
colorimetric screening development was done by Steve. The rest of the work described herein
was performed in conjunction with both Heather and Steve, as well as Arundhati Nag and
Rosemary Rohde.
2.6
References
1.
Agnew, H. D.; Rohde, R. D.; Millward, S. W.; Nag, A.; Yeo, W.-S.; Hein, J. E.; Pitram, S. M.;
Tariq, A. A.; Burns, V. M.; Krom, R. J.; Fokin, V. V.; Sharpless, K. B.; Heath, J. R., Iterative In Situ
Click Chemistry Creates Antibody-like Protein-Capture Agents. Angewandte Chemie
International Edition 2009, 48 (27), 4944-4948.
2.
Farrow, B.; Hong, S. A.; Romero, E. C.; Lai, B.; Coppock, M. B.; Deyle, K. M.; Finch, A. S.;
Stratis-Cullum, D. N.; Agnew, H. D.; Yang, S.; Heath, J. R., A Chemically Synthesized Capture
Agent Enables the Selective, Sensitive, and Robust Electrochemical Detection of Anthrax
Protective Antigen. ACS Nano 2013, 7 (10), 9452-9460.
3.
Pfeilsticker, J. A.; Umeda, A.; Farrow, B.; Hsueh, C. L.; Deyle, K. M.; Kim, J. T.; Lai, B. T.;
Heath, J. R., A Cocktail of Thermally Stable, Chemically Synthesized Capture Agents for the
Efficient Detection of Anti-Gp41 Antibodies from Human Sera. PLoS ONE 2013, 8 (10), e76224.
4.
Stenman, U.-H.; Leinonen, J.; Zhang, W.-M.; Finne, P., Prostate-specific antigen.
Seminars in Cancer Biology 1999, 9 (2), 83-93.
5.
Coin, I.; Beyermann, M.; Bienert, M., Solid-phase peptide synthesis: from standard
procedures to the synthesis of difficult sequences. Nature protocols 2007, 2 (12), 3247-56.
6.
Nag, A.; Das, S.; Yu, M. B.; Deyle, K. M.; Millward, S. W.; Heath, J. R., A Chemical EpitopeTargeting Strategy for Protein Capture Agents: The Serine 474 Epitope of the Kinase Akt2.
Angewandte Chemie International Edition 2013, 52 (52), 13975-13979.
7.
Procise Protein Sequencing System.
http://tools.lifetechnologies.com/content/sfs/manuals/cms_041125.pdf (accessed May 1).
8.
Lee, S. S.; Lim, J.; Tan, S.; Cha, J.; Yeo, S. Y.; Agnew, H. D.; Heath, J. R., Accurate MALDITOF/TOF sequencing of one-bead-one-compound peptide libraries with application to the
identification of multiligand protein affinity agents using in situ click chemistry screening. Anal
Chem 2010, 82 (2), 672-9.
9.
Sobek, D. J.; Aquino, C.; Schlapbach, D. R., Analyzing the Properties of Fluorescent Dyes
Used for Labeling DNA in Microarray Experiments. In BioFiles, Simga-Aldrich: Online, 2011; Vol.
6.3.
10.
Millward, S. W.; Henning, R. K.; Kwong, G. A.; Pitram, S.; Agnew, H. D.; Deyle, K. M.; Nag,
A.; Hein, J.; Lee, S. S.; Lim, J.; Pfeilsticker, J. A.; Sharpless, K. B.; Heath, J. R., Iterative in situ click
chemistry assembles a branched capture agent and allosteric inhibitor for Akt1. Journal of the
American Chemical Society 2011, 133 (45), 18280-8.
51
Chapter 3
Development of a PCC Agent Selective for the
E17K Mutant Akt1 Protein
52
3.1
Introduction
3.1.1
The E17K Mutation in the Pleckstrin Homology Domain of Akt1
Akt1 kinase plays a critical role in the PI3K signaling pathway,1 the activation of which is
closely linked to tumor development and cancer cell survival2. The phosphorylation of
regulatory amino acids (Ser474 and Thr308) on Akt occur through the localization of Akt to the
cell membrane through its membrane-binding Pleckstrin Homology Domain (PH Domain). These
phosphorylations activate the Akt protein, which can then activate many other downstream
signaling pathways2. The recently discovered E17K mutation in the PH Domain of Akt1 results in
an increased affinity for the phosphatidylinositol-3,4,5-trisphosphate (PtdIns(3,4,5)P3, or PIP3)
substrate at the cell membrane (Figure 3-1)3. This switch from a negatively charged glutamic
acid to a positively charged lysine amino acid in the PIP3 binding pocket causes this mutant
protein to have a four times higher affinity for the PIP3 substrate. This increased affinity causes
the Akt1 to be bound to the cell membrane, and hence activated four times longer than in
healthy, wildtype cells. Consequently, this deregulated recruitment of Akt1 to the cell
membrane causes constitutive activation of the PI3K pathway, which has been shown to be
sufficient to induce leukemia in mice3. The oncogenic properties of the driving E17K single point
mutation make it a target for specific detection and inhibition.
Figure 3-1: PH Domain Binding Pocket Changes upon E17K Mutation: a.) Interaction between Lys14 and Glu17 in
binding pocket of wildtype PHD, b.) repellent interaction between Lys14 and Lys17 in the binding pocket of the E17K
mutant, and c.) new hydrogen bonds to water with the E17K mutation in complex with the PIP3 substrate.3
53
3.1.2
Proteins
A General Strategy for Targeting Single Amino Acid Point Mutations in
Targeting single amino acid point mutations in proteins is becoming a necessary step in
the era of personalized medicine, and methods for the detection of these mutant protein
biomarkers are highly desirable for guiding treatment decisions4. Thus, there is a need for an
approach to identify small molecules that can be generally targeted against epitopes containing
single amino acid point mutations, and can also potentially be developed into cell-penetrant
inhibitors. Previously, a strategy was developed for targeting the phospho-epitopes by chemically
synthesizing the surrounding chunk of protein and focusing the site of the in situ click screen by
attaching an azide click handle to a phosphate chelating group.5
This method has been
generalized by directly substituting an alkyne click handle into the chemically synthesized peptide
epitope. For this work, the peptide represents the epitope of Akt1 containing the E17K mutation,
an attractive target due to the oncogenic nature of this mutation3. That target is subjected to an
in situ click screen against an OBOC peptide library of 5-mers (comprehensive in 18 amino acids),
each terminated in an azide presenting amino acid.
This generalized technique allows us to focus our PCC agent development to a location
on the PH Domain that is adjacent to the E17K oncogenic mutation. The approach yielded a 5-mer
peptide that exhibited a 10:1 selectivity for E17K Akt1 relative to wild-type (WT). We exploited
the chemical flexibility and modularity of the PCC agent to append a dye and a cell penetrating
peptide. The resultant ligand could selectivity image the E17K Akt1 protein in live cells, again with
high selectivity relative to WT. The technique for epitope targeting described herein provides a
general approach for the synthesis of small molecule peptides that are capable of selectively
distinguishing between WT and mutant proteins in cancer. These small molecule peptides would
be useful tools for disease detection assays, as well as provide a path towards the inhibition of
their target proteins.
54
3.2
Materials and Methods
3.2.1
Akt1 PH Domain Expressions
Akt1 Pleckstrin Homology Domain DNA was purchased from DNA2.0, and the codons
were optimized for expression in E.coli. The first 124 N-terminal amino acids from full-length Akt1
were used as the PH Domain DNA, and a 6-his tag separated by a thrombin cleavage site was
added at the C-terminus of the protein for purification. In order to make the E17K mutant of the
PH Domain, the glutamic acid in position 17 was mutated to a lysine via QuikChange (Stratagene),
following all of the manufacturer’s protocols. The DNA was synthesized in a pJexpress 414 vector
containing an ampicillin resistant gene to be expressed in E.coli cells. Protein expression was
performed by the Protein Expression Center at Caltech using their standard bacterial expression
protocol, and purified via Ni-NTA column. The proteins expressed in this manner were used for
the pull-down assays confirming the anchor binding via immunoprecipitation assays, and for the
biligand screens. These PH Domain proteins were unsuitable for long-term storage under a large
variety of tested conditions, so a GST tag was added to hopefully improve the long term stability.
For that reason, the DNA from DNA 2.0 was amplified out of the pJExpress vector using
polymerase chain reaction (PCR) to insert the restriction enzyme sites EcoRI and NotI for insertion
into a pGEX-4T-1 vector containing a GST tag. The primers used were:
5’ - AGAGAATCCATGTCCGACGTCGCGATCGTAAAGGAAGGG – 3’
5’ - TCTGCGGCCGCTTAGTGGTGATGATG – 3’
Both the wildtype and E17K mutant DNA were amplified out of the pJExpress vector,
restriction enzyme digested, and ligated overnight into a pGEX-4T-1 vector that attached an Nterminal GST tag to the PH Domain protein. BL21-DE3-pLys cells were transformed with the DNA,
confirmed correct via sequencing. An overnight starter colony from each protein was grown in
5mL LB + 100 μg/mL Amp overnight. 4mL of this starter culture was used to inoculate 500mL of
LB+Amp, and grown to mid-log phase. The cultures were inoculated with 1mM IPTG and grown
55
5 hours at 28°C. The cells were spun down for 10 minutes at 8,000 RPM and lysed with lysis buffer
(1x TBS, 1mM DTT, 1mg/mL Lysozyme, 1% Triton-X), and left for 30 minutes on ice before flash
freezing in liquid nitrogen. Upon thawing on ice, the lysate was sonicated for 5 minutes, then
centrifuged for 30 minutes at 10,000 RPM to remove cellular debris. The supernatant was then
purified on a HisPur Co column (Pierce) using the recommended protocol. These GST-tagged
proteins were used to confirm the biligand binding via immunoprecipitation assays, and for the
triligand screens. They were also used to obtain the full ELISA curves of all three ligands. These
proteins, however, were also not suitable for long term storage and needed to be re-expressed
for all assays.
The imaging experiments required that the PH Domain protein be expressed in
mammalian cells and have a GFP tag for visualization. Because of this, Akt1 DNA with codons
optimized for use in mammalian cells was obtained from InvivoGen as a pUNO-hAKT1 plasmid.
The DNA was mutated via QuikChange as before so that both a wildtype and E17K version were
on hand. The primers used to clone the DNA from this vector into a TOPO C-terminal GFP
mammalian vector (Life Technologies) were:
5’ – AAGATGGGGATGAGCGACGTGGCT – 3’
5’ – TCCCCGACCGGAAGTCCATCTCCTC – 3’
Cloning into the TOPO vector was performed by following all of the manufacturer’s
recommended instructions. Because the GST-PH Domain proteins expressed in E.coli were still
not stable for long term storage, this DNA was used to express the PH Domain in mammalian cells
to test the storage suitability of this recombinant fusion protein. The expressions were performed
by transfecting a suspension culture of HEK-293-6E cells with XtremeGene HD by the Protein
Expression Center at Caltech following their standard protocols. These proteins were not purified,
56
and were used as-is out of cell lysates. This protein was used in triligand pull-down and inhibition
assays, and was still not stable for long term storage.
3.2.2
Design and Synthesis of Epitope-Targeting Anchor/Target Peptide
Epitope targeting for the point mutation of the PH Domain of Akt1 was accomplished by
screening against a 33-mer peptide fragment derived from the N-terminus of the PH Domain,
highlighted in Figure 3-6, that contained the E17K point mutation as well as a propargylglycine
(Pra) alkyne click-handle substitution (I19[Pra]) for directing the in situ click reaction near the
mutated site. The peptide fragment epitope sequence used in these studies was:
MSDVAIVKEGWLKKRGKY[Pra]KTWRPRYFLLKNDG
This 33-mer fragment was capped with an N-terminal biotin label for detection in the
screen, and was purified on a prep-scale Dionex U3000 HPLC with a reverse-phase C4 column
(Phenomenex). MALTI-TOF MS showed a peak for m/z = 4215.93 for the pure product, expected
m/z = 4219.9.
3.2.3
CD Spectroscopy of 33-mer Target Peptide Epitope
Lyophilized powder of the 33-mer biotin-tagged target fragment that was used for
screening was dissolved in 500μL of 1x PBS to a concentration of 0.5mg/mL. Concentrations were
estimated by weight, and confirmed by A280 measurement on a NanoDrop. Experiments were
performed using an Aviv 62 CD Spectrometer. The machine was purged for 20 minutes with N2;
then, the 1xPBS blank in a 500μL 1cm cuvette was added, and the machine was purged with N2
for another five minutes. The spectra was acquired by taking three measurements/minute from
wavelengths 199-250nM. The 33mer fragment sample was then added, purged for 5 minutes,
and was measured exactly as the blank. The 33mer cuvette was then removed, and 500μL of
57
7.0M Guanadine-HCl (pH = 2.0) was added to denature the sample. This spectra was acquired as
above.
To work up the data, the signal in ΔA from the sample was subtracted from the blank at
each wavelength. Then the mean residue molar circular dichroism ΔεMR was calculated from this
readout using the number of residues in the fragment (33) and the concentration in mg/mL (0.5
for the folded sample, or 0.25 for the denatured sample, since it was diluted with Guanadine-HCl)
using the equation: ΔεMR= ΔA/((residue # x concentration mg/mL) x l)6. The spectra were
graphed by plotting this number against the wavelength.
3.2.4
Screen for Initial Anchor Ligand Peptide
Screens were performed using a library containing 100% Met coupled at the C-terminus
for potential MALDI TOF/TOF sequencing7. The peptide library was a comprehensive 5-mer
containing 18 unnatural D-amino acids, excluding Met and Cys due to stability reasons. The Nterminus consisted of an azide click handle with varying carbon chain lengths – 2 carbon, 4 carbon
and 8 carbon – for in vivo click with the Pra on the target 33-mer epitope fragment. Screens were
completed using with 300mg of dried library beads swelled at least six hours in 1x TBS (25mM
Tris-Cl, 150mM NaCl, 10mM MgCl2, pH = 7.5) buffer.
Preclear (Figure 3-2a):
Swelled library beads were blocked overnight in 5% w/v dried non-fat milk in 1x TBS, then
washed with 1x TBS three times. Five milliliters of a 1:10,000 dilution of streptavidin-alkaline
phosphatase conjugate in 0.5% milk in TBS was added to the beads, and incubated shaking at
room temperature for one hour. The beads were washed with a high-salt TBS buffer (1x TBS with
750mM NaCl) three times, then let shake in high salt buffer for one hour. The beads were then
58
washed three times with BCIP buffer (100mM Tris-Cl, 150mM NaCl, 1mM MgCl2, pH = 9.0) and
developed by adding 15mL BCIP buffer plus 13μL BCIP and 26μL NBT (Two part system, Promega).
After one hour, the purple beads were removed by pipette and discarded. The remaining library
beads were incubated in NMP for four hours to remove trace purple precipitate from the
BCIP/NBT reaction, then were washed five times with methanol, five times with water, five times
with TBS and blocked overnight in 5% milk.
Product Screen (Figure 3-2b):
Beads remaining from the preclear were washed three times with 1x TBS, then incubated
with 5 mL of a 100 nM dilution of the 33-mer epitope target in 0.5% milk for either 5 hours or 12
hours to allow for an in situ click reaction to occur. The beads were then washed three times with
1x TBS, and incubated for one hour with a 7M Guanadine-HCl buffer (pH = 2.0) to remove all of
the 33-mer epitope target that was not attached covalently to the beads. These beads were then
washed ten times with 1x TBS, blocked for two hours in 5% milk, then incubated for one hour with
a 1:10,000 dilution of streptavidin- alkaline phosphatase conjugate in 0.5% milk in TBS to detect
for the presence of the 33-mer epitope target clicked to a bead. The beads were washed three
times with a high-salt TBS buffer, then let shake in high salt buffer for one hour. Afterwards, the
beads were again washed three times in BCIP buffer, and developed as per the preclear. Purple
beads are removed from the screen via pipette, and are considered hit beads. These hits were
incubated in the guanidine-HCl buffer to remove attached streptavidin, washed ten times with
water, and sequenced via Edman degradation on a Procise CLC 494 system from Applied
Biosystems. See Table 3-2 for the 5-hour sequences and Table 3-3 for the 16 hour, overnight
sequences.
59
Figure 3-2: Screening Strategy for Anchor Ligand Determination (a) Preclear: Library beads are incubated with
streptavidin - alkaline phosphatase conjugate to remove any library beads that bind to this or the BCIP reagents. (b)
Product Screen: Precleared library beads are incubated with the 33-mer target peptide containing an azide in situ click
handle. The fragment catalyzes triazole formation between the alkyne on the 33-mer target and the azide on beads
that contain peptide sequences that bind specifically to the 33-mer in a close enough proximity to the alkyne substitution
for a click reaction to occur without copper. The unclicked peptide is then stripped from the beads, and the remaining
covalently attached 33-mer is detected by streptavidin – alkaline phosphatase with BCIP development.
3.2.5
Hit Library Bead Sequence Analysis
Hit sequences were segregated based on their hydrophobicity and sequence homology
using principal component analysis.
The algorithm analyzes a series of peptides via
hydrophobicity and sequence homology, and graphs them on a 2D sequence map (Figure 3-7).
Clusters of hits were circled, and one peptide from each cluster was scaled-up and tested for
binding to both wildtype and E17K mutant PH domain. The ligands chosen for scale-up were:
dqntr, ypwve, eefef, yleaf, and elnhy. Any ligand candidates that were difficult to call on the
sequencing were not chosen for scale-up and testing.
3.2.6
Affinity
Streptavidin-Agarose Immunoprecipitation (Pull-down) Assays for Binding
Pull-down assays were done on streptavidin agarose resin (Invitrogen). The resin was
incubated with N-terminal biotinylated anchor peptide candidates identified via the principle
component analysis seen in Figure 3-7. The anchor candidate-coated beads were then incubated
with both wildtype and E17K mutant protein to compare the selectivity of the ligands as well as
the binding ability.
60
Assays were performed using 50μL of streptavidin-agarose slurry (25μL resin) in Spin-X
tubes (Sigma) to allow for the easy removal of the solutions. Resin was aliquotted into 14 tubes
– six ligands plus a blank tested against two different proteins – then washed three times with 1x
TBST (1x TBS + 0.1% Tween-20). Each set of tubes was incubated with a 10x excess of the
appropriate biotinylated ligand to streptavidin binding sites in 200 μL 1x TBS or plain buffer for
the blank. Ligand binding was done for one hour at room temperature, and then resin was
washed three times with 1x TBS. Resin was blocked with 1x TBS with 5% BSA for two hours. The
anchor-coated resin was then incubated with either wildtype or mutant expressed PH domain
protein overnight (~16 hours) in cold room (4°C). Protein was spun out of tubes, and the resin
was washed three times with high salt TBS, then incubated for five minutes in the high salt buffer.
The resin was then washed three times with the 1x TBS buffer, and spun out to dry completely.
Fifty μL of denaturing SDS gel loading buffer with 10% B-mercaptoethanol was added to the
sample,s and they were incubated at 95° C for ten minutes to denature from the resin. The gel
loading buffer was spun out of the Spin-X tubes, and the samples were run on an Any KD BioRad
Premade Gel under denaturing conditions. Gel was transferred to nitrocellulose membrane,
blocked for one hour in 5% milk (4°C), and western blotted8. Proteins were detected using rabbit
polyclonal anti-Akt1 antibody (ab64148, Abcam) and an anti-rabbit HRP conjugated secondary
anti-body (Cell Signaling), then developed with West Pico Chemilluminescent substrate (Pierce).
Relative protein band sizes were analyzed to compare binding between the anchor candidates,
and were used to determine selectivity for either wildtype or mutant PH Domain.
61
3.2.7
Verification)
Point ELISAs with Anchor Ligand and 33-mer Epitope (Epitope Targeting
The 33-mer epitope used in screening was resynthesized without the alkyne click handle
and with a 6-His tag as an orthogonal tag to the biotin on the anchor ligand. This tag was added
after a PEG5 on the N-terminus of the peptide, and was made and purified as was previously
described. The mutant fragment had an expected m/z of 5160.72, observed MALDI-TOF MS m/z
for [M+H] of 5161.61. The WT fragment has an expected m/z of 5161.72, and an observed MALDITOF MS for [M+H] of 5162.78.
For these assays, 100nM BiotinPEG5-yleaf-Pra (Figure 3-3) was
immobilized for one hour on a
Neutravidin-coated ELISA plate
Figure 3-3: Biotin – PEG5 – yleaf – Pra Anchor ligand: As analyzed by
MALDI-TOF MS, expected m/z = 1298.62, observed [M+Na] = 1319.89.
(Pierce). The plate was blocked in
5% BSA in 1xTBS for one hour, then again overnight at room temperature. The immobilized
anchor was then incubated with either 1μM or 100nM wildtype 33-mer epitope or 1μM or 100nM
E17K mutant 33-mer epitope for one hour. The plate was washed three times with 1xTBS + 0.1%
Tween-20, and tapped dry. The epitope was then detected by a 1:1,000 dilution of an anti-his
mouse mAb (ab18184, Abcam) for one hour, washed as above, and then detected with 1:10,000
dilution of an anti-mouse HRP-conjugated goat pAb (Abcam) for one hour. The plate was once
again washed and developed with a 1:1 TMB substrate (KPL) for 15 minutes. To graph the data,
the blank (epitope and antibodies binding to plate with no anchor ligand present) was subtracted
from the triplicate sample values. The fraction bound was found by setting the highest value to
100% and normalizing the rest accordingly. The triplicate values were then graphed with their
error bars, and the p-values were calculated by GraphPad using a two-way ANOVA test.
62
3.2.8
Verification)
HPLC-Detected Immunoprecipitation (Pull-down) Assays (Epitope Targeting
Pull-down assays with the biotinylated anchor and his-tagged 33-mer epitope were
performed to verify epitope targeting. As with the full-protein assays, the biotinylated anchor
ligand was incubated for one hour with 50μL of streptavidin agarose slurry that had been washed
three times with 1xTBS. The anchor ligand was washed out, and the resin was blocked for an hour
in 5% BSA in 1xTBS. Two hundred μL of a 50μM solution of his-tagged 33-mer epitope in 1xTBS
was added to the blocked resin, and this was incubated overnight (~16 hours) at 4°C. Because
small peptide fragments like the 33-mer epitope are difficult to transfer to and detect on the
nitrocellulose membrane as for a traditional Western blot, the amount of binding in these assays
was detected via HPLC. In order to do this, the bound 33-mer peptide fragments were washed
three times with 1xTBS + 0.5% BSA, and one time with 1xTBS. The resin was then incubated with
200μL of the 7M guanadine-HCl (pH = 2.0) buffer used to strip beads in the screen. The guanidine
buffer was spun out of the beads in Spin-X tubes and injected onto a Beckman Coulter semi-prep
HPLC with a reverse phase C18 analytical column. The peak seen on the HPLC illustrated how
much of the 33-mer epitope bound to either the yleaf anchor or to blank beads.
3.2.9
Ligand-Directed Tosyl Labeling Experiments
For these assays, the yleaf anchor was appended with an N-terminal FMOC-piperidine-4carboxylic acid (pip) as a linker on 300mg of rink amide resin in NMP using standard FMOC amino
acid coupling techniques. The resin was equilibrated in anhydrous DCM, and 250μL of 3(chlorosulfonyl)benzylchloride (tosyl) was added with 450μL of DIEA and shaken for 30 minutes
at room temperature. Then, 250μL of 2-(2-(2-aminoethoxy)ethoxy)ethanol (EG), 450μL of DIEA
and 19mg DMAP in anhydrous DMC were added and shaken overnight. The resin was washed
and equilibrated in NMP, and 2eq Cy5 carboxylic acid (Lumiprobe) was coupled at 37°C overnight
63
using standard FMOC coupling techniques. The resin was washed, TFA cleaved and HPLC purified
as usual; see Figure 3-4 for image.
In order to label the
protein, 50μL of full-length
GST-E17K PH Domain from
SignalChem was treated
with 10x molar excess of the
anchor ligand with the
tosylate
Figure 3-4: TAT – PEG5 – yleaf – pip- tosyl – EG – Cy5: Labeling experiments were
performed using a yleaf anchor ligand (blue) that was built onto a TAT peptide
(red) with a PEG spacer (black). The labeling arm consisted of a pip spacer, tosyl
labeling group, and EG spacer (green) with a Cy5 dye (pink) payload. MALDI-TOF
MS, expected m/z = 3316, observed m/z [M+H} = 3317.50.
dye
label
and
incubated for two days at
room temperature.
mixture
was
The
lyophilized
after two days, and then denatured by boiling in SDS-PAGE loading buffer. The labeled protein
was run alongside an unlabeled control on an Any-KD gel (Biorad), then imaged on an Odyssey
fluorescent gel reader (Figure 3-13). After confirming that labeling had occurred, the gel was
stained with BioSafe Coomassie blue stain (BioRad), and the blue protein bands were cut out. The
gel pieces were trypsin digested using the Pierce In-gel Digest Kit, following all of the
manufacturer’s instructions. The tryptic fragments from both the unlabeled and labeled protein
digests were lyophilized to concentrate them, taken up in 2μL of 50% H2O/50% Acetonitrile, and
were analyzed by MALDI TOF MS.
Initially, analyses were performed by considering any peak that was present in the labeled
protein sample that was not present in the unlabeled sample. The weight of the dye labeling arm
– 552.3 g/mol – was subtracted from these peaks, and the corresponding tryptic fragment was
located. This provided four potential fragment candidates that were all located near the 33-mer
64
epitope in the PH domain of the protein. Next, every MALDI peak in the labeled sample was
analyzed by subtracting the weight of the dye label and comparing it to a potential tryptic
fragment. One other fragment was identified using this method, and corresponded to the doubly
labeled peak of one of the previously identified labeled fragments. These results confirmed
multiple previous experiments done using LC/MS techniques that proved not strong enough to
fragment the tryptic peptides into individual amino acids.
These tryptic peptide samples were then analyzed by MALDI TOF/TOF MS to identify the
exact amino acid that contained the dye label. Only YFLLK was able to be successfully fragmented,
and the TOF/TOF confirmed that the tyrosine was the label-containing amino acid. This confirms
the results, seen in the original publication,9 that only Y, H, and E nucleophilic amino acids are
labeled using this technique. The remaining tryptic fragments all contain at least one of these
amino acids, with the doubly-labeled fragment containing two.
The labeling sites were then plotted onto a Pymol image that combined the Akt1 protein
(PDB ID: 3096) and the E17K PH Domain (PDB ID: 2UZR) with the N-terminal GST tag (PDB ID:
1UA5) that was present on the full-length protein from SignalChem that was used in these labeling
assays. This Pymol-made fusion protein was used to approximate what the commercial protein
looked like in solution and give an idea of the extent of the selectivity of this assay. The
concentration of labeling sites only surrounding the epitope demonstrate the exclusive binding of
this ligand in solution.
3.2.10
Details of the MALDI-TOF Analysis of Tryptic Peptide Fragments
All of the peaks from the MALDI-TOF spectra of the labeled tryptic digests were analyzed
for their potential to contain a dye label. The MALDI spectra were manually calibrated to ensure
the least possible error. Each peak was then analyzed by zooming in on the spectra on the
65
computer and obtaining the exact mass for the monoisotopic peak, which is recorded as “MALDI
peak” in Table 3-1 below. The mass of the dye, 552.37g/mol, was subtracted from this peak, and
it was compared to the closest possible theoretical tryptic digest fragment (“Digest”). The
“expected” mass of the digest plus the dye was calculated and subtracted from the observed
mass, “MALDI peak,” and the absolute value of this difference was recorded in “P/M 1.” The peak
area was obtained from the MALDI data and added to the spreadsheet as “Peak Area” to allow
for a cutoff (4500) of any peaks that looked to be within the noise. Any peak below this value is
shown in red italics, and was not considered for this study. Any peak that was within 0.1% of the
mass of the expected digest mass was considered to be within error of the instrument, was
considered a hit dye-labeled fragment, and colored blue in the table. There were no more new
peaks seen using this method than were discovered by looking for peaks that grew in from the
unlabeled MALDI to the labeled MALDI. The labeled sites seen in this MALDI-TOF experiment
were all seen previously in at least 2 LC/ESI-MS experiments attempting to identify the labeled
region.
66
Table 3-1: Excel Table of Tryptic Fragment Analysis
MALDI
Peak
Peak dye
Expected
Digest
Corresponding
Fragment
500.78 1051.6349
1090.15
537.78 1114.6007 562.2307
1118.11
565.74 1114.6007 562.2307 12649.91
3.5093
1142.16
589.79 1132.6993
580.329
4217.63
9.4607
1179.14
626.77 1173.6565
621.287
4393.2
5.4835
1194.14
641.77
1201.732
649.362
5139.51
7.592
1202.16
649.79
1201.732
649.362
4103.69
0.428
1234.66
682.29 1234.7826 682.4126
8193.47
1300.08
747.71 1303.7273 751.3573
6445.8
3.6473
1302.09
749.72 1303.7273
751.357
4496.81
1.6373
1308.09
755.72 1303.7525 751.3825
5926.62
4.3375
1320.57
768.2 1320.7691 768.3991
7886.31
0.1991 EGWLHK
1440.11
887.74 1447.8246 895.4546
6406.74
7.7146
1475.16
922.79 1477.9158 925.5458 10131.17
2.7558
1493.13
940.76 1477.9158 925.5458
9276.21 15.2142
1499.13
946.76
1507.814
955.444
4112.05
8.684
1515.1
962.73
1507.814
955.444
4687.71
7.286
1567.65 1015.28 1565.8591 1013.489
7907.73
1.7909
1093.57 21961.13
6.7403
1148.64
12923.9
6.5199
1791.09 1238.72 1795.9606 1243.591
5200.25
4.8706
1802.79 1250.42 1800.0105 1247.641
8149.76
2.7795
1851.79 1299.42 1841.9813
1289.61
4331.77
9.8087
1995.47
1404.78
4368.22 38.3241
1707.53 1155.16 1701.0101
1443.1 1957.1459
4296.69
P/M 1
1053.15
1639.2 1086.83 1645.9403
499.265
Peak
Area
1.5151
5813.86 24.4507
0.1226 YFLLK
2212.04 1659.67
2213.208 1660.838 95735.94
2225.51 1673.14
2213.208 1660.838 17712.89
12.302
2233.95 1681.58
2213.208 1660.838 12256.12
20.742
2284.12 1731.75
2344.242 1791.872
5711.7
60.122
2306.92 1754.55
2344.242 1791.872
6553.24
37.322
2344.23 1791.86
2344.242 1791.872
4506.1
2383.46 1831.09 2362.2571 1809.887
2406.7 1854.33 2362.2571
1809.89
1.168 EEWTTAIQTVADGLK
0.012 EAPLNNFSVAQCQLMK
8608.79 21.2029
4338.6 44.4429
67
The peak at ~2212 was not seen on the unlabeled mass spec, but is seen on the labeled
fragment, and was considered a hit. The peak at 2211 is also, however, a common mass seen for
trypsin. We do see this particular unlabeled fragment fly in the MALDI-TOF MS (1659), and know
that this is a site that can be labeled, based on the ESI-MS experiments that were conducted with
a biotin and not Cy5 labeling arm (which therefore have a different labeled mass) that this is a site
that can be labeled. In attempting to zoom in for the monoisotopic mass, we see a broad peak
with no clearly-identifiable mass peak – unlike all of the other peaks in the spectrum, which
showed the distribution of masses very clearly. This led us to believe that we are, in fact, seeing
this peak labeled in the MALDI, especially since this site was seen as labeled by the ESI, and that
the MALDI spectra is showing an overlap of the trypsin peak with the labeled fragment. The ESI
labeling experiments were done using the biotin labeling arm, so this mass did not overlap with
trypsin in these experiments, which confirms this. We just cannot exactly call this mass in the
MALDI due to the similarity of this peak to that of trypsin.
3.2.11
Images of Anchor Ligand in HEK-293T Cells Expressing PH Domains
Figure 3-5: yleaf – PEG5 – TAT – Cy5: The yleaf anchor ligand (red) was appended with a TAT cell penetrating
peptide (blue) and a Cy5 dye (pink) separated by a PEG5 linker (black). MALDI-TOF MS, expected m/z: 2937.72,
observed m/z = 2937.83.
These experiments were designed to visualize the dye-labeled anchor ligand in cells
overlapping with the GFP-labeled PH Domain proteins. For this reason, the yleaf anchor ligand
was synthesized with an N-terminal PEG5, TAT (YGRKKRRQRR), and Cy5 dye (Figure 3-5). GFP-
68
tagged protein DNA was also cloned as described above. HEK-293T cells were grown in DMEM
media supplemented with 10% FBS (both Invitrogen), 100x non-essential amino acid solution
(Sigma), and PenStrep antibiotic (Invitrogen). Once the cells reached ~80% confluency, they were
treated with trypsin to remove from the plate and split into a 12-well flat bottom cell culture plate
with a D-poly-lysine (BD) coverslip at approximately a 50% confluency in 1mL total volume. The
cells were allowed to attach to the coverslips for approximately 24 hours, then were transfected
to express either wildtype GFP-PH domain or E17K mutant GFP-PH domain proteins using
XtremeGene HD transfection agent at a ratio of 3:1 transfection agent to DNA. Several wells were
left untreated as no protein blanks. The cells were given 24 hours to express protein. They were
then serum starved for one hour in DMEM media prepared as above, but without the FBS. After
one hour, the Cy5-labeled anchor was added to the wells to a final concentration of 50nM. As the
HEK-293T cells express endogenous Akt1 protein, this level was adjusted to give the lowest
background signal possible. The protein blank cells were also incubated with 50nM of the yleaf
anchor to ensure that binding was due to the presence of the E17K mutant protein. A blank of
PEG5-TAT-Cy5 was also added to wells expressing either wildtype or E17K mutant to ensure that
ligand binding was due to the presence of the yleaf anchor. After a one-hour incubation with the
peptide, the cells were washed once in serum starved media, then incubated thirty minutes in
serum starved media to wash out any excess peptide. During this time, the cells were also treated
with 10μg of Hoescht 33342 dye to stain the nuclei. After the thirty-minute period, one well of
each wildtype or mutant protein with peptide was activated with PDGF for 10 minutes. The cells
were then washed twice with cold PBS buffer, fixed with 10% Neutral Buffered Formalin Solution
(Sigma) and glued onto microscope slides. Images were taken on a Zeiss LSM 510 Meta NLO with
Coherent Chameleon confocal microscope. A 40x Plan-apochromat lens was used. The laser
69
intensity and gain were fixed for all pairs of images between wildtype and mutant samples to
ensure that the differences seen were not artificially created.
3.3
Results and Discussion
3.3.1
In situ Click Epitope-Targeted Screening Strategy for E17K PH DomainSpecific Ligand
Using FMOC SPPS peptide synthesis techniques,10 a peptide epitope representing
residues 1-32 of the E17K PH Domain of Akt1 was synthesized. From the crystal structure (PDB
ID: 2UZR), these residues form a β-sheet around the E17K mutation (blue). The epitope fragment
was appended with an N-terminal PEG5-biotin to serve as a detection handle when screening.
This manual synthesis of the epitope allowed for an I19Pra substitution (Pra – propargylglycine)
to provide an alkyne click handle on the most proximal side-chain residue to the E17K mutation.
Following
chromatographic
purification,
characterization
and
via
mass
spectrometry, HPLC and circular
dichroism, the modified epitope
was ready for screening.
A single generation in
situ click screen can yield ligands
with a high selectivity for the
target. Hits from such a screen
are those library elements that
Figure 3-6: Design of Screening Target Epitope: PH Domain (green) with
highlighted screening target epitope (pink). The epitope was designed to
surround the E17K mutation shown in blue. The amino acid in position 19 was
substituted with a propargylglycine (Pra) alkyne-containing amino acid
(yellow) for focusing the site of the in situ click screen.
are covalently coupled to the synthetic epitope through a triazole linkage. The in situ click
reaction itself is low yielding12, but the biotin handle on the synthetic epitope permits enzymatic
70
amplification of those hit beads using a colorimetric streptavidin-linked alkaline phosphatase
assay. The basic screening strategy is shown in Figure 3-2. Out of the 1.5 million library members
that were screened against the alkyne-containing 33-mer E17K PH Domain fragment, only 21
beads (0.0014%) showed the presence of the covalently coupled epitope. These beads were
sequenced using Edman degradation (
Table 3-2, Table 3-3). The hits were segregated based on their hydrophobicity and
sequence homology using principal component analysis (Figure 3-7). Based upon this analysis,
five ligands that represented the diversity of hits (circled in Figure 3-7) were scaled-up with a
biotin tag and tested for binding to both E17K and WT full-length PH Domain. These hits were
dqntr, ypwve, eefef, yleaf, and elnhy. Here, the lowercase sequence letters indicate that the
amino acids that comprise the peptide are non-natural D-stereoisomers.
Table 3-2: Hit Sequences from Anchor Screen against 33-mer peptide epitope (5hr click screen):
Az2
Az8
Az4
Az2
Az8
Az4
Az8
Az8
Az8
G
y
i
p
d
a
f
f
e
v
h
s
h
l
r
k/l
e
e
e
e
e
w
l
s
i
p
k
w
y
l/k
t
d
G
q
d/n
f
f
e
f
f
f
t
f
71
Table 3-3: Hit sequences from Anchor screen against 33-mer peptide fragment (16hr screen):
Az4
Az8
Az2
Az2
Az2
Az4
Az4
Az2
Az4
Az8
Az2
Az8
e
f
e
h
h
n
n
a
p
n
y
e
e
l
a
e
w
l
r
l
r
l
f
e
n
r
w
y
v
r
n
a
y
e
e
a
h
h
v
a
p
r
s
y
v
a
f
i
y
q
t
w
n
f
k
h
r
f
Figure 3-7: Clustering of Anchor Sequence Ligands by AA Similarity: Hit sequences from the anchor screen were
segregated based on their hydrophobicity and sequence homology using principal component analysis. Circled clusters
indicate regions where a peptide was selected and scaled-up as a possible anchor sequence. The potential anchor
sequences that were tested are: dqntr, ypwve, eefef, yleaf and elnhy.
Streptavidin – agarose immunoprecipitation assays (Figure 3-8) were used to probe for
the ability of the anchor candidates to recognize and bind to the proteins in buffer. One ligand
72
candidate showed a distinctively stronger binding to the E17K protein relative to the WT, seen in
Lane 5.
This peptide sequence, “yleaf,” (Figure 3-3) was carried forward for additional
investigations. Two out of the four other candidates, though, also showed a preference for the
E17K mutant protein. One candidate showed a preference for the WT protein, and one candidate
showed no strong binding to either fragment. This result was to be expected, because it is
possible for a ligand to bind to the fragment in a way that is not directly accessible on the surface
of the full protein. It can also be hypothesized that the three fragments that showed a preference
for the E17K fragment bound at or around the site of the mutation, and the peptide that shows
binding to the WT protein must bind away from the mutation.
Figure 3-8: Streptavidin-Agarose Pull-down Assays for Anchor Ligand Binding Affinity:
Streptavidin-agarose was incubated with a panel of potential anchor sequences that were
synthesized with biotin tags. These resins were then incubated with either wildtype or E17K
Mutant PH Domain to measure the amount of protein that is pulled down by each potential
anchor ligand.
3.3.2
CD Spectroscopy of 33-mer Target Peptide Epitope
In order to determine whether the epitope used in the screen would retain the
secondary structure of the full protein, CD spectroscopy was performed (Figure 3-9). The biotintagged, alkyne-containing fragment that was used as a screening target was tested, and the
resultant spectra do show the presence of secondary structure. This result is confirmed by the
73
disappearance of this structural signature upon the addition of a denaturing guanidine-HCl
buffer. More importantly, the characteristic dip at 217nM of the blue, fully-natured fragment
spectra is the signature of a β-sheet, which is the expected structure of this part of the full
protein. We can assume, then, that this fragment is maintaining a structure similar to that of
the natured protein, even with the incorporation of the click handle. Therefore, peptide binding
to the E17K fragment should see a surface similar to that of the full-length PH Domain protein.
The messiness of the spectra from 200 – 210 nm could be due to the biotin label that has been
attached to the fragment, or be due to the absence of the rest of the protein, causing random
coiling or unfolding.
Figure 3-9: CD Spectra of 33mer Epitope Fragment used in Screening: The blue spectra indicates the 33mer target
fragment that was used in screening; the red indicates the denatured epitope.
3.3.3
Verification of the Epitope Targeting Strategy
The biotin-modified yleaf peptide (Figure 3-3) was subjected to a variety of binding assays
against the synthesized WT and E17K 33-mer PH Domain fragments prepared without the biotin
label and alkyne click handle. These assays were instead labeled with an N-terminal 6-His tag in
74
order to have an alternative detection handle to the anchor ligand. First, the yleaf peptide was
used in immunoprecipitation assays to pull-down either the WT or E17K mutant 6His-tagged 33mer peptide fragments, as opposed to the full-length proteins that were used to initially validate
the candidates. Typical immunoprecipitation assays involve western blotting to estimate the
amount of protein binding, but peptide fragments are too small to be consistently captured or
quantified on a blot. Because of this, the amount of peptide epitope precipitated in these assays
was quantified via injection onto an analytical HPLC. These unique immunoprecipitation assays
further confirmed preferential yleaf ligand binding to the E17K mutation relative to the WT
epitope (Figure 3-10). As an assay control, another candidate ligand that, in initial testing, did not
exhibit preferential E17K binding to the full protein (lane 4, Figure 3-8), was tested, and yielded
consistent results to the full-protein pull-down assays (Figure 3-8). The first immunoprecipitation
assays demonstrated that the anchor bound selectively to the full-protein, and these HPLCdetected pull-downs confirm that the binding and the selectivity are due to the interaction
between the anchor and 33-mer epitope.
75
― yleaf, E17K 33mer
― eefef, E17K 33mer
― yleaf, WT 33mer
― blank, E17K 33mer
33-mer
yleaf
eefef
Figure 3-10: HPLC-detected Immunoprecipitation Assay for Epitope Targeting Verification. The HPLC traces show
the quantity of the 33-mer fragment that was pulled-down in the assay. The anchor ligand, yleaf, pulls down the
most E17K 33-me,r and the least WT 33-mer. The amount of pull-down by the eefef discarded anchor candidate
demonstrates the validity of the assay. This corroborates what was seen in the full-protein pull-downs in Figure
3-8.
The selectivity of the yleaf peptide for the E17K 33-mer epitope was also tested in an
ELISA assay format. For these assays, the WT or E17K 33-mer peptide fragments were captured
using the PEG-biotin-modified yleaf ligand
1.5
yleaf ligand exhibited significant selectivity for
the E17K fragment over the WT across a 100 nM
– 1 μM concentration range (Figure 3-11),
further demonstrating the binding of this ligand
to the specific epitope of interest and providing
additional validation of the epitope targeting
strategy.
Fraction Bound
immobilized on a Neutravidin-coated plate. The
***
1.0
WT epitope
E17K epitope
*
0.5
0.0
-0.5
1 mM
100 nM
Figure 3-11: ELISA Assay Verification of Epitope Targeting.
The WT and E17K 33-mer fragments were incubated with
the yleaf anchor immobilized on an ELISA plate. Strong
preference for the E17K fragment is demonstrated.
76
3.3.4
Ligand-Directed Labeling Experiment to Confirm Epitope Targeting and
Ligand Selectivity
The selectivity of the yleaf anchor ligand
was further verified using the directed labeling
technique reported by Tsukiji et al9.
The
approach yields information relative to the
binding location of the ligand on the protein
target. For this method, a payload is attached
Figure 3-12: Ligand-Directed Labeling Diagram,
modified from Tsukiji et al9. The anchor (red) with the
Cy5 dye (pink) attached through an electrophilic tosyl
group. The reaction with nucleophilic side-chains on the
protein can indicate where the ligand is binding. These
sites can be confirmed through trypsin digestion and MS.
to the N-terminus of the targeting yleaf ligand
through an electrophilic tosylate linker. Upon
ligand binding to the protein target, the payload
is transferred onto the protein through a nucleophilic SN2 reaction with proximal nucleophilic
amino acid side chains (Figure 3-12). The protein can then be trypsin-digested, and the identity
of the fragments containing the payload can be
1.
mapped on the protein surface using mass
2.
spectrometry (MS). Thus, the site of ligand binding
can be estimated.
The assay also serves as an
independent validation of the immunoprecipitation
and ELISA binding assays discussed above.
For the assay, yleaf was modified at the Nterminus to contain a tosylate linker attached to a
Figure 3-13: Fluorescent Gel Image to Confirm Cy5
Labeling. Lane 1 shows the control protein with no
label, and Lane 2 shows the labeled protein. The
large band corresponds to the labeled GST-E17KAkt1.
Cy5 dye molecule to enable easy identification of the
labeled and digested protein fragments (Figure 3-4).
A Glutathione S-Transferase (GST)-
Akt1(E17K) protein (SignalChem) was incubated with the Cy5-appended yleaf peptide. The
labeling of the protein target was initially confirmed by visualization on a fluorescent gel reader
77
(Figure 3-13). The labeled protein and an unlabeled control were then trypsin-digested from the
gel, and were analyzed by matrix-assisted laser desorption/ionization time-of-flight (MALDI-TOF)
MS (Figure 3-14). Five peaks appeared in the MS of the labeled protein that were not present in
the unlabeled protein digests, which all corresponded to an expected trypsin fragment plus the
weight of the linker and dye.
Figure 3-14: Images of Labeled and Unlabeled MALDI-TOF Spectra of Unlabeled (top) and Labeled (bottom) Proteins.
These peaks were then analyzed by MALDI TOF/TOF MS to extract sequence information
for the labeled regions of the protein. All but one of the dye-labeled peptides were difficult to
fragment, as is characteristic of cationic peptide labels11. The labeled digest YFLLK could be
fragmented, and indicated the presence of the dye on the Y amino acid (Figure 3-15). This is
consistent with the original literature on the labeling technique,9 which showed that Y, E and H
amino acids are the nucleophiles that can be labeled. The other labeled Akt1 fragments that were
identified contain at least one of these amino acids. One fragment contains two such amino acids
and, in fact, there were MALDI peaks corresponding to the masses of both the singly-and doubly-
78
labeled fragments. Figure 3-16 shows the location of the labeled fragments in the PH Domain
sequence, as well as the amino acids that should contain the label.
Figure 3-15: MALDI-TOF/TOF Cy5 Dye-Labeled YFLLK Fragmentation: The YFLLK – Cy5 Labeled trypsin fragment
analyzed by MALDI-TOF/TOF MS. The fragments shown above demonstrate that the Cy5-dye is on the Y amino acid,
which corresponds to the results found by authors of the original technique9.
The labeling sites were then mapped on a composite crystal structure of GST (PDB ID:
1UA5) and Akt(E17K) (Akt PDB ID: 3096, E17K PDB ID: 2UZR) (Figure 3-17). All labeled sites
surround the anticipated binding site of the
yleaf ligand. A thorough search of the entire
Figure 3-16: Trypsin-Digested Sequence of PH Domain
Protein. The red dashed lines show where the trypsin cuts are
located. The fragments highlighted in red are the ones that
showed labels, and the amino acids colored in cyan are the
ones containing the labels.
MALDI spectra was conducted to identify
any other labeled fragments anywhere on
the large protein, but none were found.
Thus, this labeling experiment demonstrates that only sites around the expected N-terminal
binding site of the yleaf ligand are labeled, confirming the very specific binding of the peptide
ligand at the site directed by the epitope-targeted in situ click screening process.
79
Figure 3-17: Compiled Crystal Structure of Fully Labeled Protein. The cyan amino acids labeled in cyan are all clustered
immediately around the pink 33-mer fragment of the blue PH Domain. No labeled sites were found in any other part of
the large fusion protein.
3.3.5
In Cell Imaging
Live cell-based assays can provide a demanding environment for demonstrating the
selectivity of the yleaf PCC agent to the E17K Akt1. In addition, they also can demonstrate the
value of a small, epitope targeted ligand relative to a similarly targeted antibody, since antibodies
cannot enter live cells. To demonstrate target binding in live cells, HEK-293T cells were
transfected to express GFP-tagged E17K or GFP-tagged WT PH Domain proteins. The yleaf ligand
was then labeled with both a Tat cell-penetrating peptide and a Cy5 dye (Figure 3-5). The
combination of the GFP label on the protein, and the Cy5 label on the dye, permitted the use of
multi-color fluorescence microscopy for interrogating any spatial registry between the two
80
fluorescent labels. Live HEK-293T cells expressing these GFP-tagged proteins were exposed to
varying concentrations of the modified yleaf ligand for one hour. The cells were then thoroughly
washed with PBS to equilibrate the concentration, and fixed for fluorescence microscopy
measurements.
Figure 3-18: Images of Anchor Ligand in GFP-tagged WT and E17K PH Domain. The green fluorescence shows the
equivalent expression of the WT and Mut proteins in cells. The pink anchor ligand is distributed throughout almost all
of the E17K – expressing proteins, but shows only background binding to the WT – expressing cells.
Confocal microscopy images of the two differentially-expressing Akt1 PH Domain cells
showed a consistent level of expression between
the GFP-WT PH Domain and GFP-E17K PH Domain.
However, the level of the PCC agent retained by
the cells was substantially different (Figure 3-18).
Nearly all of the cells expressing the mutant
protein show some level of capture agent
retention and demonstrate co-localization of
Figure 3-19: Image Demonstrating Co-Localization of
Cy5 - PCC Agent with GFP - tagged PH Domain proteins
in cells.
capture agent and GFP-PH Domain protein (Figure
3-19). The GFP-WT cells, however, show very low levels of capture agent retention, and do not
81
seem to have any co-localization of the two. These measurements demonstrate the selectivity of
the E17K capture agent for its target within the demanding environment of live cells.
3.4
Conclusions
The in situ click-focused epitope screen for capture agent development presents a rapid
strategy for discovering peptide ligands that bind to any site of interest on a protein surface. This
method is not limited to conserved binding pockets, post-translational modifications, or
structured regions of proteins. By only accepting hits wherein the target epitope catalyzed the
formation of a covalent bond, it was ensured not only that the candidate ligands bound to the site
of interest, but that they also bound tightly and in an exact orientation so that this triazole could
form. In this way, the in situ click screen became not only a screen for ligand affinity, but also for
ligand specificity. The peptide hits developed using this method are very specific for the exact
location on the protein where the click reaction was centered. The PCC Anchor, yleaf, developed
using this technique has demonstrated the ability to detect the E17K mutant PH Domain in
conditions ranging from simple assays in buffer to complex imaging experiments in cells. Assays
validating the peptide-peptide binding of the epitope target and the yleaf anchor ligand also
highlight the exquisite selectivity of this ligand for the E17K mutation. This technology provides
an ideal solution for the discovery of selective ligands to an area of interest on a protein surface,
and demonstrates the ability to produce agents capable of distinguishing even the slightest
change in protein structure – a single point mutation.
3.5
Acknowledgements
The labeling and imaging experiments shown were done with Blake Farrow. Steve
Millward and Aiko Umeda assisted with the protein expression and cell culture. Ying Qiao Hee
and Jeremy Work made many of the peptides used in these experiments. Bert Lai performed the
82
MALDI-TOF/TOF sequencing of the tryptic fragments. Jost Vielmetter, Angela Ho, and Sravya
Keremane of the Protein Expression Center were indispensable in the expression of these
proteins. Felicia Rusnak and Jie Zhou performed the trypsin digests and LC/MS for the protein
labeling experiments. The advice from Mona Shahgholi on MS techniques and experimental setup was essential to the success of the labeling experiments.
3.6
References
1.
Testa, J. R.; Tsichlis, P. N., AKT signaling in normal and malignant cells. Oncogene 2005,
24 (50), 7391-3.
2.
Vivanco, I.; Sawyers, C. L., The phosphatidylinositol 3-Kinase-AKT pathway in human
cancer. Nat Rev Cancer 2002, 2 (7), 489-501.
3.
Carpten, J. D.; Faber, A. L.; Horn, C.; Donoho, G. P.; Briggs, S. L.; Robbins, C. M.;
Hostetter, G.; Boguslawski, S.; Moses, T. Y.; Savage, S.; Uhlik, M.; Lin, A.; Du, J.; Qian, Y.-W.;
Zeckner, D. J.; Tucker-Kellogg, G.; Touchman, J.; Patel, K.; Mousses, S.; Bittner, M.; Schevitz, R.;
Lai, M.-H. T.; Blanchard, K. L.; Thomas, J. E., A transforming mutation in the pleckstrin homology
domain of AKT1 in cancer. Nature 2007, 448 (7152), 439-444.
4.
Rusling, J. F.; Kumar, C. V.; Gutkind, J. S.; Patel, V., Measurement of biomarker proteins
for point-of-care early detection and monitoring of cancer. Analyst 2010, 135 (10), 2496-2511.
5.
Nag, A.; Das, S.; Yu, M. B.; Deyle, K. M.; Millward, S. W.; Heath, J. R., A Chemical EpitopeTargeting Strategy for Protein Capture Agents: The Serine 474 Epitope of the Kinase Akt2.
Angewandte Chemie International Edition 2013, 52 (52), 13975-13979.
6.
Corrêa, D. H.; Ramos, C. H., The use of circular dichroism spectroscopy to study protein
folding, form and function. African J Biochem Res 2009, 3 (5), 164-173.
7.
Lee, S. S.; Lim, J.; Tan, S.; Cha, J.; Yeo, S. Y.; Agnew, H. D.; Heath, J. R., Accurate MALDITOF/TOF sequencing of one-bead-one-compound peptide libraries with application to the
identification of multiligand protein affinity agents using in situ click chemistry screening. Anal
Chem 2010, 82 (2), 672-9.
8.
Towbin, H.; Staehelin, T.; Gordon, J., Electrophoretic transfer of proteins from
polyacrylamide gels to nitrocellulose sheets: procedure and some applications. Proceedings of
the National Academy of Sciences 1979, 76 (9), 4350-4354.
9.
Tsukiji, S.; Miyagawa, M.; Takaoka, Y.; Tamura, T.; Hamachi, I., Ligand-directed tosyl
chemistry for protein labeling in vivo. Nat Chem Biol 2009, 5 (5), 341-343.
10.
Coin, I.; Beyermann, M.; Bienert, M., Solid-phase peptide synthesis: from standard
procedures to the synthesis of difficult sequences. Nature protocols 2007, 2 (12), 3247-56.
11.
Pashkova, A.; Moskovets, E.; Karger, B. L., Coumarin Tags for Improved Analysis of
Peptides by MALDI-TOF MS and MS/MS. 1. Enhancement in MALDI MS Signal Intensities.
Analytical Chemistry 2004, 76 (15), 4550-4557.
83
Chapter 4
Expansion of E17K Selective Anchor Ligand into
an Inhibitor
84
4.1
Introduction
As described in previous chapters, there is increased interest in compounds that can
selectively inhibit a disease-associated mutant protein target while sparing the wildtype (WT)
variant1. PHD inhibiting compounds2,3 with selectivity for the E17K variant of Akt have not been
reported. The specificity of the yleaf anchor ligand described in Chapter 3 for the E17K Akt1 in live
cells, coupled with the proximity of the E17K mutation to the PIP3 binding site, prompted the
consideration of further developing this PCC Agent into a compound capable of blocking the E17K
PH Domain interaction with its PIP3 substrate. The yleaf anchor peptide itself did not exhibit
evidence of inhibition (Figure 4-11). It was reasoned that a similarly targeted, but bulkier PCC
Agent might serve as a steric blocker of the PH Domain - PIP3 interaction. To this end, two cycles
of iterative in situ click chemistry screens, as described in Chapter 2, were executed in order to
develop the yleaf ligand into a biligand and then a triligand, which was capable of successfully
blocking this binding interaction. This showed that these larger PCC Agents could serve as highly
selective inhibitors of E17K Akt1 by blocking binding of the Pleckstrin Homology Domain of Akt1
to the PIP3 substrate.
4.2
Materials and Methods
4.2.1
Screen for Biligand Peptide
The anchor determined above – yleaf – was scaled up with a biotin on the N-terminus for
detection, a PEG5 linker between the biotin and the peptide, and a d-propargylglycine (Pra) on the
C-terminus as the in situ click handle (Biotin-PEG5-yleaf-Pra). Screens were performed using a
library with 100% Met coupled at the C-terminus for potential MALDI TOF/TOF sequencing. The
library consisted of a comprehensive 5-mer containing 18 unnatural D-amino acids, excluding Met
and Cys due to stability reasons. The N-terminus of the library was appended with an azide click
handle with a 4 carbon chain (Lys(N3))– for in vivo click with the Pra on the anchor peptide.
85
Screens were performed with 300mg of dried library beads swelled at least six hours in 1x TBS
(25mM Tris-Cl, 150mM NaCl, 10mM MgCl2, pH = 7.5) buffer.
Preclear (Figure 5a):
Swelled library beads
were blocked overnight in 5%
w/v dried non-fat milk in 1x
TBS, then washed with 1x TBS
Figure 4-1: Biotin – PEG5 – yleaf – Pra: Biligand screens were performed
using the yleaf anchor (red) with a PEG5 spacer (black) and a biotin tag
(blue). MALDI-TOF MS, expected [M+Na] 1319.62, observed 1319.89.
three times. The beads were
incubated with a 7.15μM solution of the anchor peptide - Biot-PEG5-yleaf-Pra for one hour, then
washed three times with 1xTBS. Five milliliters of a 1:10,000 dilution of streptavidin-alkaline
phosphatase conjugate in 0.5% milk in TBS was added to the beads, and incubated with shaking
at room temperature for one hour. The beads were washed with a high-salt TBS buffer (1x TBS
plus 600mM NaCl) three times, then let shake in high salt buffer for one hour. The beads were
then washed three times with BCIP buffer (100mM Tris-Cl, 150mM NaCl, 1mM MgCl2, pH = 9.0)
and developed by adding 15mL BCIP buffer plus 13μL BCIP and 26μL NBT to the beads in a 150mm
polystyrene tray. After one hour, the purple beads were removed by pipette and discarded. The
remaining beads were incubated in NMP for four hours to remove trace purple precipitate from
the BCIP/NBT reaction, then were washed five times with methanol, five times with water, five
times with TBS and blocked overnight in 5% milk.
Target Screen (Figure 5b):
The clear beads remaining from the preclear were blocked in 5% milk in 1x TBS for two
hours. They were then washed three times with 1x TBS. A pre-incubated solution of E17K mutant
86
protein (715nM) and anchor ligand (7.15μM) in 3mL of 0.5% milk was added to the blocked library
beads and incubated for either five hours or overnight to allow an in situ click reaction to occur.
In the morning, the beads were washed three times with 1x TBS, then incubated with a 1:4,000
dilution of an anti-His Alkaline Phosphatase conjugated antibody (Abcam) in 0.5% milk for one
hour. The beads were then washed three times with a high salt TBS, then incubated on the
shaking arm for one hour with the high salt buffer. They were then washed three times with BCIP
buffer, and developed as previously. Hit beads turned purple and were removed and washed in
NMP for four hours to decolorize, then guanidine-HCl to denature and remove and remaining
protein. The beads were then washed ten times with water and blocked in 5% milk overnight.
Off-Target Anti-Screen (Figure 5c):
The beads from the target screen were washed three times with 1x TBS, then incubated
with the off-target, wildtype PHD protein in 0.5% milk for one hour on the shaking arm at room
temperature. The beads were washed three times with 1x TBS, then incubated with a 1:4,000
dilution of Anti-His Alkaline Phosphatase conjugated antibody in 0.5% milk for one hour at room
temperature. They were then washed three times with high salt buffer and let shake for one hour
in high salt at room temperature before being washed three times with BCIP buffer and developed
as previously. The beads that turned purple bind to both mutant and wildtype protein or to the
anti-his antibody, and were set aside. The beads that remained clear were picked and washed
with guanidine-HCl to remove any bound proteins, and blocked in 5% milk overnight.
Product Screen (Figure 5d):
The beads specific for the mutant PH domain were washed three times with 1x TBS. They
were then incubated with a 1:10,000 dilution of Streptavidin – Alkaline Phosphatase conjugate in
87
0.5% milk for one hour. The beads were washed three times with high salt TBS, then let shake for
one hour with high salt buffer before being washed three times with BCIP buffer and developed
as previously. The beads that turned purple contained the anchor peptide covalently bound to
the bead, and had formed a protein-catalyzed in situ click reaction. These beads were collected
and stripped with guanidine-HCl for one hour, washed ten times with water, and sequenced via
Edman degradation as per the anchor candidate hits. There were 22 total hit beads.
88
Figure 4-2: Screening Strategy for Biligand Determination: (a) Preclear: Any library beads that bind to the screening
reagents are removed. (b) Target Screen: Precleared beads are incubated with the target and anchor ligand and allowed
to “click.” The presence of the his-tagged PH Domain is detected via an anti-His antibody. (c) Anti-Screen: Hit beads
from the target screen are incubated with the off-target PH Domain and anti-his antibody. These hit beads bind to both
the target and off-target (WT and E17K mutant). (d) Product Screen: The beads are probed with streptavidin-alkaline
phosphatase to determine which contain the click product and, thereby, have shown biligand formation.
4.2.2
Streptavidin-Agarose Immunoprecipitation (Pull-down) Assays to Test
Biligand Candidates (Figure 4-6)
Four biligand candidates were segregated based on their hydrophobicity and sequence
homology using principal component analysis as for the anchor ligands screened in Chapter 3.
Biligands were synthesized by coupling the 2° ligand onto Rink Amide Resin on the Titan peptide
synthesizer. The amide group on the end of the Lys(N3) was capped by shaking the resin with 2mL
acetic anhydride, 2mL NMP and 0.5mL DIEA for three times for 10 minutes each time, then
washed with NMP. FMOC-Propargylglycine-Otbu (Pra) was clicked onto the Lys(N3) on the 2°
ligand by incubating 2 equivalents of the Pra amino acid with 2 equivalents of CuI and 2
equivalents of ascorbic acid with 1 equivalent of azide on the resin in 20% piperidine/NMP for 3
89
hours. The resin was washed five times with 4 mL of a chelating solution consisting of 1g sodium
diethyldithiocarbamate in 20mL NMP and 1mL DIEA. The anchor was then built onto the 2° ligand
on bead, and an N-terminal PEG5-biotin tag were added.
Assays were performed exactly as for the anchor ligands, except for two key differences. The
biligand assays were performed using 6ug of GST-tagged PHD protein, instead of the untagged
PHD that was used in the anchor pull downs. The pull-downs were also conducted out of 1%
serum in 1x TBS, as opposed to just 1x TBS. This is a much more demanding assay that tests not
only the affinity, but also the selectivity of the ligands because they need to be able to bind to
their target protein in a very complex medium. The performance of the biligand candidates in
this challenging assay indicates that they have little off-target interactions with a multitude of
other proteins, and would perform well in the condition in which they will need to be detecting
these ligands – in cells and out of cell lysates.
Figure 4-3: Lys(N3) - yleaf - Tz - yksy - PEG5 – Biotin: MALDI-TOF MS
expected 2248.1, observed [M+H] 2249.1.
90
4.2.3
Screen for Triligand Peptide
The best biligand candidate as determined in immunoprecipitation assays – yleaf–(triazole,
Tz)-yksy - was scaled up (Figure 4-3) with a C-terminal PEG5-biotin for detection during the assay
by coupling PEG5 onto NovaTag Biotin resin (EMD). Lys(N3)-yksy was coupled onto the resin on
the Titan peptide synthesizer, and FMOC-Pra-Otbu was clicked on as previously. The remaining
“Lys(N3)-yleaf” portion was then synthesized on the Titan, the Lys(N3) serving as the click handle
for the triligand screen. The screens (Figure 4-4) were completed using a random 5 D-amino acid
library with a C-terminal D-propargylglycine alkyne click handle, and were otherwise performed
exactly as for the biligand, including all concentrations. Three hit beads were discovered in this
screen, and the first hit had a nonsensical sequence, so it could not be used. Both of the usable
hits were scaled up and tested for binding using ELISA assays.
91
Figure 4-4: Screening Strategy for Triligand Determination: (a) Preclear: Any library beads that bind to the screening
reagents are removed. (b) Target Screen: Precleared beads are incubated with the target and biligand and allowed to
“click.” The presence of the his-tagged PH Domain is detected via an anti-His antibody. (c) Anti-Screen: Hit beads from
the target screen are incubated with the off-target PH Domain and anti-his antibody. These hit beads bind to both the
target and off-target (WT and E17K mutant). (d) Product Screen: The remaining beads are probed with streptavidin to
determine which contain the click product and, thereby, have shown triligand formation.
4.2.4
Full ELISA Curves for Ligands
The full curve ELISAs were obtained using streptavidin coated ELISA plates (Pierce). The
ligands – anchor, biligand, two triligand candidates (ivdae and iryrn) and “eflya” scrambled anchor
peptide blank - were laid down on the plate at a concentration of 1μM for one hour. Two lanes
of each ligand were used on the plate for both proteins – WT and E17K GST-PHD. The plates were
blocked with 5% BSA for two hours. Dilutions of both WT and E17K GST-PHD proteins were made
in 0.5% BSA in 1xTBS ranging from 1μM down to 0.5nM by serially diluting 1:2 down a series of 8
samples. For each ligand, a no protein blank was also used. The proteins were incubated with
92
the blocked plate for one hour, washed three times with 1xTBST + 0.5% BSA and tapped dry, then
detected with a 1:10,000 dilution of an HRP conjugated anti-GST ab. The plate was again washed
three times with 1xTBST and tapped dry. It was developed with a 1:1 solution of TMB substrate,
and development was stopped with 1M H2SO4 and read on a plate reader. The curves were
plotted by normalizing the signal by the blank wells, and were fitted by a Hill function in GraphPad
using a common saturation and slope (Bmax = 1.466 +/- 0.03, h = 0.7383 +/- 0.025).
4.2.5
Point ELISA Assays for Triligand Binding to Akt1 and Akt2 Wildtype and
E17K Mutant Proteins
These assays were conducted to test the binding of the triligand to the off-target Akt2
wildtype and mutant proteins. For this assay, all samples were taken in triplicate for statistical
purposes. Triligand peptide was first immobilized onto Neutravidin ELISA plates (Pierce) for one
hour. A scrambled anchor peptide, eflya, was used as the no-ligand blank, as the GST proteins
have significant background binding to a blank Neutravidin plate. The plates were then blocked
with 5% BSA overnight. Protein was laid down on the plate at a concentration of 100nM for
samples wells and the blank, scrambled peptide wells. GST protein alone (Abcam) was also
incubated with the triligand and scrambled peptide as a control. The proteins were incubated for
one hour, then washed three times with 1xTBST. The protein was then detected with 1:10,000
anti-GST mouse mAb (Fisher, #MA4-004) for one hour, washed three times with 1xTBST, and
developed with a 1:1 mixture of TMB substrate for ten minutes. The samples were plotted by
subtracting the blanks and averaging the sample wells. The highest signal was considered 100%
binding, and the other samples were normalized accordingly.
93
4.2.6
PIP3 Agarose Inhibition Assays
PIP3 Agarose beads (Echelon) were used to detect for the inhibition of PH Domain binding
to its substrate, PIP3, upon incubation with the anchor candidate peptide ligands. To test the
inhibition of each of the ligands, anchor biligand and triligand, 20μL of resin slurry was added to
each of four tubes, and washed three times with 1x TBS. Protein, 2μg (234nM) of E17K mutant,
was pre-incubated for one hour at room temperature with either DMSO (no peptide ligand blank),
anchor, biligand or triligand at 2.38μM (10x in relation to protein) in 200μL of 1x TBS. For the
control, mutant PH Domain was incubated with 1x TBS and 1μL DMSO to mimic the ligand
conditions. These protein samples were then added to PIP3 agarose in a Spin-X tube and
incubated at room temperature for two hours. The resin was washed three times with 1x TBS
with 0.25% IGEPAL CA-630, spun out to dry completely, then denatured with 50μL 3x SDS gel
loading buffer for 10 min at 95°C. The gel loading buffer was spun out of the resin and detected
via western blot as per the streptavidin – agarose pull downs. Inhibition was indicated by a
decrease in the amount of PH Domain that was pulled down by the resin.
Expanded inhibition blots with either wildtype of E17K mutant protein were performed in a
similar fashion. Twelve tubes of 20μL of PIP3 agarose were washed three times with 1x TBS. 2μg
of either wildtype or mutant PHD-GFP protein (234nM) in 200uL 1xTBS were pre-incubated for 30
minutes with differing concentrations of triligand: 0.1eq (23.4nM), 1eq (234nM), 10eq (2.34μM),
100eq (23.4μM), and 1000eq (234μM). The protein and triligand solutions were then incubated
with the PIP3 resin for 2 hours at room temperature. The resins were washed, eluted, and blotted
as per all PH Domain western blots.
94
4.3
Results and Discussion
4.3.1
Biligand Development
It was hypothesized that a similarly targeted, but bulkier PCC Agent might serve as a steric
blocker of the PHD-PIP3 interaction. To this end, two cycles of iterative in situ click chemistry
screens were designed to develop the yleaf ligand into a biligand and then a triligand. To identify
the biligand (the first iterative cycle, Figure 4-2), the yleaf ligand was modified to present an
alkyne at the C-terminus, and a PEG5-biotin group at the N-terminus (Figure 4-1). This modified
ligand (called an anchor ligand) was then co-incubated with an alkyne-presenting OBOC library
and the (unmodified) E17K PHD. Successful hits are those in which the E17K PHD promotes the
click coupling of the anchor ligand onto a library peptide, and those hits are detected by screening
for the formation of this clicked product (Figure 4-2). Those hits are candidate 2o ligands (Table
4-1). As with the discovery of the anchor ligands, the biligand hits are clustered according to their
hydrophobicity and sequence homology using principle component analysis. These hits cluster
into groups, as seen in Figure 4-5, and unique clusters are circled. Hits from these different
clusters, thus representing the sequence diversity of the screen, were chosen to be scaled up and
tested for both affinity and selectivity to the E17K mutant PH Domain protein. For testing, the 2o
ligand candidates are appended to the yleaf anchor ligand via a Cu(I) catalyzed 1,4 triazole, to
mimic the triazole formed by the protein target during the screen to form a biligand. The biligand
candidates are then subjected to immunoprecipitation assays (pull down) to identify a candidate
biligand in a manner that is similar to what was done to identify the original yleaf ligand (Figure
4-6). The biligand in lane 6 in Figure 4-6, yleaf – yksy, shows the highest affinity for the E17K
mutant protein while still maintaining the selectivity over the wildtype protein. This sequence
was chosen as the biligand.
95
Figure 4-5: Clustering of Biligand Sequence Ligands by AA Similarity: Hit sequences from the biligand screen were
analyzed by their hydrophobicity and sequence homology using principal component analysis. Clusters circled in green
indicate clustered regions, and the cyan circles indicate the peptide that was selected and scaled-up as a possible
biligand sequence. The potential biligand sequences that were tested are: yleaf-ywrl, yleaf-yksy, yleaf-rdyr, and yleafhyrw, where “yleaf” is the anchor ligand and the “-“ indicates the location of the triazole linkage.
96
Table 4-1: Hit Sequences from Biligand Screen
Az4
h
w
p
r
Az4
n
v
y
l
Az4
h
y
r
w
Az4
r
d
y
r
Az4
y
n
y
k
Az4
y
k
t
w
Az4
s
r
f
y
Az4
y
k
s
y
Az4
y
y
s
r
Az4
r
h
w
s
Az4
p
w
w
r
Az4
n
f
r
y
Az4
y
w
r
l
Az4
y
w
k
G
Az4
a
y
l
y
Az4
h
w
r
w
Az4
n
w
r
l
Az4
a
a
r
w
Az4
G
r
w
y
Az4
w
f
r
i
Az4
r
p
y
y
Az4
v
w
f
r
Figure 4-6: Pull-down Assay Results for Biligand Candidates: Note that all of the biligand candidates improve
upon the binding of the anchor ligand, but yleaf-yksy shows the greatest signal in binding the E17K protein and
the lowest in binding the WT protein. This biligand was chosen as the candidate biligand and carried on to
triligand screening.
97
4.3.2
Triligand Development
Once a candidate biligand has been identified, it is then similarly modified to form a new
anchor ligand (Figure 4-3), which is then similarly screened (Figure 4-4) to identify a triligand.
There were only 3 hit sequences from this triligand screen, and one sequence was not able to be
called due to low signal and an irregular sequence, seen in Table 4-2. Because there were only
two valid hits from this screen, both were scaled up and tested in a full-curve ELISA assay (Figure
4-7). The iryrn triligand showed significantly improved affinity for the E17K PH Domain, but this
benefit was offset by the drastic increase in affinity for the wildtype PH Domain. The ivdae
triligand maintains the selectivity seen in the anchor ligand and was chosen as the triligand, whose
structure is shown in Figure 4-8.
Table 4-2: Hit Sequences from Triligand Screen
G
l
-
-
m
-
i
r
y
r
n
Pra
i
v
d
a
e
Pra
Figure 4-7: ELISA assays for affinity and selectivity of triligand candidates. The iryrn triligand seen in red
shows a significant affinity increase, but loses much of the selectivity for the E17K mutant PH Domain
(triangles). The ivdae maintains the selectivity and affinity of the anchor ligand, and was carried forward
as the triligand.
98
Figure 4-8: Structure of final triligand: ivdae – Pra – Lys (N3) – yleaf – Pra – Lys (N3) - yksy
Binding curves that compare the yleaf ligand with the biligand and triligand PCC agents
are shown in Figure 4-9. Likely because the expanded binding site for these larger PCC agents
grows away from the location of the E17K point mutation, increasing the affinity while
maintaining the selectivity of the final PCC agent upon the addition of these secondary and
tertiary arms proved challenging. For example, the biligand exhibited an increase in affinity for
the E17K mutant protein, but this is offset by an even larger increase in affinity for the WT protein.
However, at the triligand stage, the selectivity for E17K Akt1 relative to WT Akt1 is largely
recovered.
Additionally, there is a slight preference for E17K Akt1 relative to E17K Akt2 (Figure 4-10).
The homology of the PHD between these isoforms is 79%, as calculated by a pairwise sequence
analysis using Blast2Seq between the Akt1 E17K structure (PDB ID: 2UZR) and the Akt2 PH Domain
structure (PDB ID: 1P6S). The binding curves of 4B yield EC50 values for the E17K Akt1 of 61nM,
19nM, and 45nM for the yleaf ligand, the biligand and the triligand, respectively.
99
Anchor
Biligand
Triligand
1.5
Wildtype
E17K
A450
1.0
0.5
0.0
10-10
10-9
10-8
10-7
10-6
10-5
[PHD]
Figure 4-9: Full ELISA curves of Anchor, Biligand, and Triligand. The ELISAs show that
the biligand (red) has an increased affinity for the E17K PH Domain from the anchor ligand
(blue), but also for the wildtype protein. The triligand (green) restores the affinity and
selectivity of the anchor ligand.
Fraction Bound
***
1.0
WT protein
E17K protein
*
0.5
2
kt
A
A
kt
1
0.0
Figure 4-10: Point ELISA of Triligand binding to Akt1 and Akt2.
The binding to both the wildtype and E17K mutant PH Domains
was tested for both Akt1 and Akt2. The triligand maintains the
selectivity for the E17K in both proteins, and shows only a slight
preference for the Akt1 isoform.
100
4.3.3
Inhibition Assays
The yleaf ligand, the biligand, and the triligand were all tested for their ability to block the
E17K PHD binding with PIP3 (Figure 4-11). For this test,
PIP3-coated resin (Echelon Biosciences) was used to
mimic the PHD interaction with the cell membrane, and
could be used to bind the protein as in an
Figure 4-11: PH Domain membrane binding
in the presence of each ligand. The first lane,
blank, shows the amount of protein binding to
PIP3 with no ligand. Anchor ligand in respect
to protein shows no decrease in binding, but
binding is starting to be blocked with the
biligand and triligands.
immunoprecipitation assay3.
The presence of an
effective blocking compound would reduce the ability
of the resin to capture the protein, and would thus
appear as a diminished signal in the corresponding western blot assay. A control lane containing
no capture agent was used to show baseline binding of the protein to the PIP3 resin. As
mentioned above, the yleaf ligand produced no change in E17K binding ability, but both the
biligand and triligand exhibited the ability to block the PHD-PIP3 interaction, with the triligand
being the most effective (Fig 4D). In an expanded study, we compared the amount of E17K and
WT PHD binding relative to the amount of added triligand. This assay shows significant selective
inhibition (by around 103) of the E17K mutant relative to the WT.
Figure 4-12: Expanded Inhibition Assay. The wildtype or E17K mutant PH Domains were
incubated with varying amounts of triligand. The wildtype protein shows very little
reduction in binding until 1000x triligand to protein. The E17K PH Domain, however, shows
a significant drop in binding almost immediately.
101
4.4
Conclusions
The epitope-targeting strategy allowed for such selective targeting of the E17K mutant PH
Domain that selectively blocking the oncogenic activation of this protein was the logical next step.
Bulking up the original anchor into a triligand covered more of the PH Domain PIP3 binding pocket,
therefore blocking PIP3 binding. By ensuring that the triligand maintained its selectivity for the
E17K mutant PH Domain, the ligand demonstrates significantly reduced interference with the
wildtype PH Domain protein. The blocking of the E17K protein binding to the cell membrane
demonstrates the ability of this click-focused epitope screening technology to produce not only
selective binding agents, but also potential therapeutics that could show significantly decreased
toxic side-effects due to the reduction in off-target and healthy-cell interactions.
4.5
Acknowledgements
Ying Qiao Hee and Jeremy Work made many of the peptides used in these experiments. Blake
Farrow graphed several of the images in GraphPad and fitted the curves.
4.6
References
1. Chong, C. R.; Janne, P. A., The quest to overcome resistance to EGFR-targeted therapies in
cancer. Nat Med 2013, 19 (11), 1389-1400.
2. Mahadevan, D.; Powis, G.; Mash, E. A.; George, B.; Gokhale, V. M.; Zhang, S.; Shakalya, K.; DuCuny, L.; Berggren, M.; Ali, M. A.; Jana, U.; Ihle, N.; Moses, S.; Franklin, C.; Narayan, S.;
Shirahatti, N.; Meuillet, E. J., Discovery of a novel class of AKT pleckstrin homology domain
inhibitors. Molecular Cancer Therapeutics 2008, 7 (9), 2621-2632.
3. Hiromura, M.; Okada, F.; Obata, T.; Auguin, D.; Shibata, T.; Roumestand, C.; Noguchi, M.,
Inhibition of Akt kinase activity by a peptide spanning the betaA strand of the proto-oncogene
TCL1. The Journal of biological chemistry 2004, 279 (51), 53407-18.
102
Chapter 5
Extending OBOC in situ Click Chemistry into a
Phage Display System
103
5.1
Introduction
5.1.1
Azide-Containing Phage Display Libraries
Recent advances in chemical biology have made it possible
to incorporate unnatural amino acids into recombinant proteins1.
Schultz et al. has shown that through the use of amber suppression,
azide-containing amino acids can be incorporated at specific
locations into the pIII coat protein on an M13 phage2. The goal of
this project is to synthesize a randomized 7-amino acid phage display
Figure 5-1: Azido - phenyl
alanine amino acid to be
incorporated in phage
library.
peptide library containing an azide amino acid at a fixed position coded by an amber stop codon
(TAG) to translate the click product screening technology into a biological library screening, and
to demonstrate the use of resulting azide-phage library in in situ click screening.
The 7-randomized amino acid library will dramatically increase the number of peptide
sequences that can be panned in each screen. For comparison, a complete OBOC library of 5
amino acids is sampled in 660 mg of library beads. To sample each sequence one time in a library
the size of the 7-mer, it would require 447g of beads –-a practically impossible task using our
current methods! In the phage display screen, however, it is trivial to completely oversample this
7-mer library 100 times in each screen–a huge advantage of the biological display technique. The
strategies for discovering PCC agents with these libraries should be nearly identical to those
previously developed for the OBOC click libraries, except that a much greater sequence space can
be sampled with each screen due to the physical size of the library, and screening and sequencing
steps can be performed significantly faster.
104
5.1.2
Mirror-Image Phage Display
One of the disadvantages common to
phage display is that the library will contain
exclusively L-amino acids, and will therefore
produce a peptide sequence that is susceptible
to protease cleavage. In order to avoid this
Figure 5-2: Mirror-Image Phage Display Technique3.
potential problem, a technique called “mirror-
image phage display” (Figure 5-2) has been developed. In this technique, an L-amino acid phage
library is screened against a target synthesized from D-amino acids in order to find a D-peptide
that binds to the L-target4, where the D-target forms an exact mirror image of the L-target.
Therefore, screening against a mirror image of the target and reversing the stereochemistry of
the hit peptide binder produces a D-ligand that binds to the original L-target. With the epitopetargeting strategy currently used for PCC agent discovery in the lab, where a chemicallysynthesized portion of the protein is used as a target for screening, it is trivial to prepare a Damino acid epitope for use in a mirror image phage display screen. Using this technique, an azidecontaining phage library can be screened in order to develop D-amino acid PCC agents, effectively
converting the click screening so crucial to our success in PCC ligand discovery from an expensive
and time-consuming OBOC library method to a simpler, quicker biological screening process.
5.1.3
G6PD Capture for Malaria Eradication
The Bill and Melinda Gates foundation is calling for the eradication of malaria, but this is
a serious challenge that can only be addressed through the elimination of asymptomatic and
chronic infections5. There exists currently a family of drugs, the 8–aminoquinolines such as
primaquine, which can completely clear a person of infection (termed a “radical cure” regimen)
and can thereby reduce the transmission of the disease6. Unfortunately, people with a glucose–
105
6–phosphate dehydrogenase (G6PD) deficiency, the most common enzymatic deficiency in the
world, risk severe and life-threatening reactions to the standard treatment with this medication,
which in turn requires a significantly different dosing method to effectively cure patients with a
G6PD deficiency7. Therefore, in order to successfully employ the primaquine “radical cure”
strategy for malaria eradication, effective methods to rapidly determine a patient’s G6PD activity
need to be developed immediately so that it is possible to administer the appropriate dose of the
medication as quickly as possible6.
The G6PD is found in red blood cells, and assists in the formation of NADPH from NADP+,
conferring protection from oxidative stress. Deficiencies normally arise from mutations in the
G6PD gene that produce proteins with less than optimal function, reducing the overall enzymatic
activity6. There are about 140 known mutations of this protein, most of which are single base
changes, which can adversely affect the G6PD activity7. Current gold standard assays measure a
deficiency by performing enzymatic tests on blood samples, measuring the amount of converted
NADPH per unit of blood. Unfortunately, patients who have recently undergone a hemolytic
event, causing a mass death of old red blood cells, show a false normal test. This is due to the
higher than normal prevalence of young red blood cells, which express a higher G6PD copy
number than mature red blood cells, compensating for the reduced activity of the enzyme caused
by the mutation6.
The goal of this project is to develop a capture agent that universally detects G6PD in all
of the possible mutant forms in order to capture the protein to a chip where the concentration
and the activity of the G6PD in the blood can be measured simultaneously. Such a diagnostic test
can normalize the G6PD activity to protein copy number as opposed to activity per unit of blood,
resulting in much fewer false positives and faster treatment of malaria. This combination test
106
should help reduce the number of false normal blood test results, allowing for significant progress
toward the eradication of malaria.
5.2
Materials and Methods
5.2.1
Preparation of Plasmid for Incorporation of Azidophenylalanine and Amp
Resistant Gene
The plasmid pAC-DHPheRS-6TRN (Figure 5-3) containing the coding sequences for
Methanococcus jannaschii amber suppressor tRNATyr (MjtRNA) and the mutant M.jannaschii
tyrosyl-tRNA synthetase (MjTyrRS) was a gift from Dr. Zhiwen Zhang at Santa Clara University.
This plasmid was originally designed for the site-specific incorporation of 3,4-dihydroxy-Lphenylalanine (DOPA); its mutant MjtRNA recognizes TAG as a codon, and the mutant MjTryRS
recognizes DOPA as a substrate. It also harbors a tetracycline-resistance selection marker. Since
the host E. coli strains used for the phage production and in subsequent studies carry a TetR
marker in their F’ episomes, the TetR gene in this plasmid was first replaced with a beta-lactamase
(AmpR) gene for ampicillin selection, to be compatible with the antibiotic resistance of the host.
Nine point mutations based on the description by Tian et al.2 were then introduced into the
MjTyrRS synthetase so that the resultant synthetase recognizes the azidophenylalanine amino
acid instead of the DOPA.
To perform the TetR -> AmpR switch, the AmpR gene was amplified from a pET-3a plasmid
by polymerase chain reaction (PCR) using the primers shown in Table 5-1. The PCR product and
the original TetR-containing suppression plasmid were digested with HindIII and EagI, and ligated
to produce slow-growing colonies on an LB-agar plate supplemented with 100 µg/mL ampicillin.
Final clones were confirmed by DNA sequencing (Laragen).
107
Table 5-1: Primers for AmpR Switch.
Primer
Hind_bla_5
Sequence
Eag_bla_3
ATA CGG CCG TTA CCA ATG CTT AAT CAG TGA GGC ACC TAT CTC AGC G
GCG AAG CTT TAA TGC GGT AGT TTA TCA CAG TTA AAT TGC TAA CGC
AGT CAG GCA CCG TGT ATG AGT ATT CAA CAT TTC CGT GTC GCC C
Based on the previous work by Tian et al.2, nine point mutations were introduced into the
mutant MjTyrRS gene to change its substrate specificity from DOPA to azidophenylalanine: E25K,
L32T, S67A, N70H, E107N, D158P, I159L, L162Q, and Q167A. All mutagenesis reactions were
carried out using QuikChange Kit (Stratagene) according to the manufacturer’s instructions. Table
5-2 lists the primers used in the order of performed reaction. Each QuikChange reaction was
independently verified for the correct sequence, and the final plasmid was completely sequenced
to ensure correctness. The resulting final plasmid was named pAC-AzPherS-6TRN.
108
Figure 5-3: pAC-DHPheRS-6TRN Plasmid. Plasmid for the incorporation of Azidophenylalanine. Red boxes are the six
copies of the M. jannaschii tRNATyrCUA. Green indicates the synthetase. Blue is the Amp resistant gene, and the pink
is the Chloramphenicol resistant marker containing an amber codon used to indicate successful incorporation.
109
Table 5-2: Primers used for the DOPA -> Azidophenylalanine Synthetase QuikChange Reactions. The
number in the primer name indicates the order in which the QuikChanges were performed, and the mutation is
included in the name of the primer.
Primer Name/Mutation
1_G73A_Upper
Sequence
AGG AAG AGT TAA GAG AGG TTT TAA AAA AAG ATG AAA
AGT CTG CTC T
1_G73A_Lower
AGA GCA GAC TTT TCA TCT TTT TTT AAA ACC TCT CTT AAC
TCT TCC T
2_G319A_A321C_U
TTA AAG GCA AAA TAT GTT TAT GGA AGT AAC TTC CAG
CTT GAT AAG GAT TAT ACA CTG
2_G319A_A321C_L
CAG TGT ATA ATC CTT ATC AAG CTG GAA GTT ACT TCC
ATA AAC ATA TTT TGC CTT TAA
3_T199G_A208C_U
TGC TGG ATT TGA TAT AAT TAT ATT GTT GGC TGA TTT
ACA TGC CTA TTT AAA CCA GAA AGG AG
3_T199G_A208C_L
CTC CTT TCT GGT TTA AAT AGG CAT GTA AAT CAG CCA
ACA ATA TAA TTA TAT CAA ATC CAG CA
4_C94A_T95C_T96C_U
GAG GTT TTA GAA AAA GAT GAA AAG TCT GCT ACC ATA
GGT TTT GAA CCA AGT GGT AAA ATA CAT
4_C94A_T95C_T96C_L
ATG TAT TTT ACC ACT TGG TTC AAA ACC TAT GGT AGC
AGA CTT TTC ATC TTT TTC TAA AAC CTC
5_G472C_A473C_T474G_A475C_U GGT TGC TGA AGT TAT CTA TCC AAT AAT GCA GGT TAA
TCC GCT TCA TTA TTT AGG CGT CGA TGT
5_G472C_A473C_T474G_A475C_L ACA TCG ACG CCT AAA TAA TGA AGC GGA TTA ACC TGC
ATT ATT GGA TAG ATA ACT TCA GCA ACC
6_T484C_T485A_U
TAT CCA ATA ATG CAG GTT AAT GAT ATT CAT TAT CAA
GGC GTC GAT GTT CAG G
6_T484C_T485A_L
CCT GAA CAT CGA CGC CTT GAT AAT GAA TAT CAT TAA
CCT GCA TTA TTG GAT A
7_C499G_A500C_U
CAT TAT TTA GGC GTC GAT GTT GCG GTT GGA GGG ATG
GAG C
7_C499G_A500C_L
GCT CCA TCC CTC CAA CCG CAA CAT CGA CGC CTA AAT
AAT G
110
5.2.2
Test of Azidophenylalanine Incorporation into a Protein in E.coli
The ampicillin-resistant vector pAC-AzPheRS-6TRN developed above also carries a
chloramphenicol acetyltransferase (CAT or CmR) gene where residue D112 is mutated to an amber
stop codon. E. coli TOP10-F’ cells were transformed with pAC-AzPheRS-6TRN plasmid and plated
on an LB agar plate supplemented with ampicillin (100 µg/mL and tetracycline (12.5 µg/mL).
Colonies were slow-growing, and were therefore incubated for 24 hours at 37C°. An LB broth
culture of 5 mL supplemented with ampicillin (100 µg/mL) and tetracycline (12.5 µg/mL) was
inoculated with a single colony and grown overnight at 37°C. The overnight culture (1 mL each)
was diluted into two 7 mL cultures with appropriate antibiotics. An azidophenylalanine stock
solution was prepared freshly by dissolving the amino acid in 50% DMSO and 50% acidic water
(pH = 2.0 with HCl). A blank stock solution containing only the DMSO/acid without amino acid was
also prepared. The amino acid (or blank) stock solution was added to the diluted culture to the
final concentration of 2 mM (or 0 mM) azidophenylalanine. After incubating at 37°C for two hours,
34 µg/mL of chloramphenicol was added to each culture. Each culture was allowed to grow
further at 37°C, and the level of growth was assessed by OD600 at 6 and 18 hours of incubation.
5.2.3
Test of Azidophenylalanine Incorporation into M13KE Phage
Four phage clones with variable display sequences of [Amber]-AHEATH, [Amber]-SHEATH,
[Amber]-RHEATH, [Amber]–THEATH in M13KE phagemid were purchased from Antibody Design
Labs. M13KE phagemid also contains the lacZα gene for blue/white plaque screening. A naturallyamber-suppressing strain of E. coli XL1 Blue was transformed with each individual clone, and
plated on LA agar plate supplemented with tetracycline (12.5 µg/mL), IPTG (50 µg/mL) and X-gal
(40 µg/mL) in top agar following the procedure described in Ph.D. Phage Display Libraries Manual
(New England Biolabs, ref). An overnight starter culture of E. coli Top10-F’ transformed with pACAzPheRS-6TRN was diluted 10-fold into 10 mL of LB supplemented with ampicillin (100 µg/mL)
111
and tetracycline (12.5 µg/mL ) and grown at 37°C in the presence of 2mM azidophenylalanine for
two hours. A blue plaque from each individual clone was added to the culture from the fresh
plates, and cultures were further incubated for five hours. The cultures were centrifuged at 4500
rpm to remove the cells, and the phages were precipitated overnight at 4°C by collecting the top
8 mL of the supernatant and mixing it with 1.6 mL of 20% (w/v) PEG-8000 in 2.5M NaCl (PEG/NaCl).
An alkyne-labeled TAMRA dye was clicked onto the azide moiety on the azidophenylalaninecontaining phages using the Click-It Kit (Invitrogen) according to the manufacturer’s instructions,
and the resulting phages were resolved by SDS-PAGE. The gel was then imaged on a Typhoon
imager using the preset settings for TAMRA dyes.
5.2.4
Synthesis of M13KE Azidophenylalanine-Terminated 7-mer Random Library
The peptide library was designed to have the following sequence when expressed on the
surface of the pIII coat protein of the M13KE phage: A-[Amber]–X1X2X3X4X5X6X7–G-L-V-P-R-G-S-pIII
protein. The N-terminus of the display sequence has a fixed alanine amino acid to provide a noncharged spacer at the signaling peptide cleavage site to ensure proper expression of the azideincorporated final pIII protein.
The amber codon, the site of the azidophenylalanine
incorporation, follows the N-terminal alanine, and precedes then the randomized 7-mer amino
acid region. This library sequence is separated from the rest of the pIII protein by a thrombin
cleavage site (LVPRGS) to allow the enzymatic cleavage of a “clicked” phage hit from a matriximmobilized target.
The phage library was built by Antibody Design Labs using standard NNK codon, where N
encodes an equimolar amount of cytosine, guanine, thymine or adenine bases, and K encodes
only guanine or thymine. By designing the library in this fashion, some of the redundancy of the
third codon as well as two of the three possible stop codons, TAA and TGA, are eliminated.
112
The final DNA library contained about 7.65 x 10⁸ total transformants, and about 90% of
that library contained inserts for a total sequence diversity of 6.9 x 10⁸. It should be noted that
there is a significant prevalence for guanine at the first position of a codon, as can be seen in
Figure 5-4. This leads to a greater prevalence of the Glycine (G) amino acid in the overall
distribution (Figure 5-5). Stop codons and Cysteine (C) amino acids are repressed since the
production of functional phages is prohibited with these sequences, which is to our benefit. The
statistical distribution of the library sequences is otherwise unremarkable.
Figure 5-4: Distribution of Random Nucleotides. There is a significant prevalence for G in
the first position, for unknown reasons. Recall that the third position is limited to T and G
due to the NNK format of the library.
113
Figure 5-5: Distribution of Amino Acids. The high prevalence of the G base pair in the first position lead to a
much higher prevalence of the G amino acid than was expected. Otherwise, the distribution is as to be
expected.
5.2.5
Design and Synthesis of G6PD Target and Scrambled Target for Screening
The capture agent that will effectively detect G6PD in clinical settings must be able to bind
to a site on the protein surface that has
the least rate of mutation in order to
ensure the most efficient capture of the
protein with diverse sequence variance.
As seen in Figure 5-6, exons 2 and 3 have
the least number of total mutations
identified in the polypeptide sequence.
Figure 5-6: Location of G6PD Mutations in protein. Exons 2 and
3 show the least number of mutations and no Class I mutations,
so provide an ideal location to target.
There are also no Class I mutations that correlate to the most severe deficiencies in enzymatic
activity. Therefore, these two exons are the ideal location to target in order to capture the most
diverse pool of mutant G6PD proteins. The region that is targeted by the capture agent should
114
also be distant from the NADP+ binding site in order not to interfere with the enzyme activity after
capture. In the crystal structure (PDB ID: 1QKI) in Figure 5-8, the region encoded by exons 2 and
3 is unstructured in red in the bottom right of the protein. This region is far from the active site
seen in complex with the NADP+ at the top left of the protein, and the enzyme is expected to
retain its original level of activity after being captured at this position.
The region including these exons, seen in Figure 5-7, has a few sites commonly mutated,
which are shown in red. Therefore, the capture agent must be targeted to the amino acids shown
in black in order to ensure it is not binding to a highly mutated section of the protein. The epitope
that was selected for screening consists of amino acids 20 – 31 corresponding to the sequence
LFQGDAFGQSDT, and was synthesized on TentaGel resin using D – amino acids in order to use the
mirror image phage display technique to produce a D - amino acid peptide to bind to the L - G6PD
protein. The synthetic target epitope was appended with propargylglycine (Pra) residue at the Nterminus, providing an alkyne click handle. A scrambled epitope also made of D – amino acids,
[Pra]-GDAHSFQDTLQF, was synthesized on TentaGel as well, to be used in a preclear/antiscreen
step for the library. The target and scrambled target on TentaGel resin will allow the phage library
to click onto the permanently-immobilized target so that very harsh washing conditions can be
used to remove all but the covalently bound phages. These peptide sequences were tested for
their correctness and purity via Edman degradation sequencing.
Figure 5-7: Amino Acid Sequence of Exons 1 and 2 of G6PD. The amino acids highlighted in red
indicate frequently mutated positions, and the residues in black are generally conserved.
115
Figure 5-8: Crystal Structure of G6PD (1QKI). This mutant G6PD in complex with NADP+ indicates that the
unstructured regions encoded by exons 2 and 3 (bottom right in red, not entirely present in structure) are far from the
active site of the protein. Capturing the protein at this location should not affect enzyme activity.
5.2.6
Optimized Phage Library Target Screening Conditions
General protocols for phage library screening procedures including phage titering, scaling
up, and sequencing as well as preparation of materials such as buffers, PEG/NaCl solution and top
agar adopted from the NEB Ph.D. Phage Display Library System manual for M13KE, unless
otherwise noted.
The library from Antibody Design Labs was produced in a naturally-suppressing strain of
E. coli TG1 that inserts Glu, or E, at the site of amber codon. This library cannot be used for click
screening, as there is no azide amino acid, but can be used for “target” screening to find peptide
116
sequences that bind to the G6PD epitope. The target screening must be completed first, also
because approximately 35% of this phage pool contains no insert, or “naked phages.” Naked
phages have a significant selection advantage over those that would require the amber
suppression. The target screen is designed, therefore, to enrich for phage containing the library
insert, and remove the naked phage from the phage pool before incorporation of
azidophenylalanine is performed.
The TentaGel beads containing the target and scrambled epitopes are stored in the form
of 50% (v/v) slurry in 1:1 ethanol:water solution. One hundred μL each slurry of the target and
scrambled epitopes were washed with 1 mL Tris-buffered saline (TBS, 25mM Tris-HCl, 150mM
NaCl, 10mM MgCl2) with 0.1 % Tween-20 (TBST), then blocked with 1mL of 5% (w/v) bovine serum
albumin (BSA) in TBS for one hour at room temperature. An antiscreen was performed by
incubating the scrambled peptide resin with a phage screening solution containing 2 μL sterile
filtered human serum, 2 μL of the original library (~5 x 10¹¹ total phages), and 196 μL TBS for 30
minutes at room temperature. The beads are spun down and the supernatant, containing the
phage that did not bind to the scrambled peptide, is added to the target epitope resin and
incubated for one hour at room temperature. Extensive washes are performed to ensure that the
least number of non-specific and naked phages remain: five times with TBST, 30 minutes shaking
in TBST, five times with TBST, five times with high salt TBS (2.5 M NaCl), 30 minutes shaking in
high salt TBS, five times with high salt TBS, five times with TBST, five times with TBS, 10 minute
shaking with TBS, five times with TBS, and two times with CaCl2 thrombin buffer (1 mM CaCl2 in
TBS). The last wash step is retained and titered to ensure no phage are eluting. The target beads
are then incubated with 4 units of thrombin in 200 μL CaCl2 buffer for 24 hours at room
temperature to elute hit phages. This step should elute only the phages that have a thrombin
cleavage tag. After incubation, the 200 μL of thrombin cleavage cocktail was removed from the
117
beads, and the beads were washed five times with 200 μL TBS to remove all of the cleaved phages.
The washes were combined with the thrombin eluent. The target beads are then acid-bumped
by adding 1mL of 0.2 M glycine-HCl + 1mg/mL BSA buffer (pH = 2.0) for 10 minutes in order to
ensure that all thrombin cleaved peptides were removed previously, and that only naked phage
remain. The 1mL of acid eluent was removed from the beads and neutralized with 150 μL of 1 M
Tris (pH = 9.1). Both the thrombin cleavage and acid bump eluents are titered to determine the
number of phages eluted in each step.
5.2.7
Testing Phage Plaques for Library Inserts
The titered phage from a library or final eluent of a screen can be rapidly assessed for the
presence of library inserts by plaque PCR before sequencing each individual clone from titered
plaques. The first two primers listed in Table 5-3 were designed by Antibody Design Labs, to
recognize the DNA sequence on the M13KE phagmid on the either side of the cloning site, allowing
the screening for the presence of insert based on the increased size of the PCR product compared
to the one from a naked phage. The last PCR primer is an alternate 3’ primer designed to recognize
part of the insert DNA sequence, and therefore, a positive PCR reaction only occurs when the
template phage contains the insert, and not with a naked phage. At each stage of the screening
process, plaques were picked, and plaque PCR was performed to determine the percent of naked
phage.
Table 5-3: Primers for Colony PCR of Inserts. The first two primers show a slightly heavier PCR band if the insert
is present. The last primer is an alternate 3’ primer designed to sit inside the insert and, therefore, the PCR will show
nothing if the insert is not present.
Primer Name
M13gV_5
Psi_3
Thrombin_3
Sequence
GTC AGG GCA AGC CTT ATT CAC TG
GCG TAA CGA TCT AAA GTT TTG TCG
CGA ACC ACG CGG AAC CAG AC
118
5.2.8
Incorporation of Azidophenylalanine into Phage Libraries
The TOP10-F’ cells transformed with the suppressor plasmid pAC-AzES-6TRN were
streaked from a glycerol stock on an LB agar plate supplemented with ampicillin (100 µg/mL) and
tetracycline (12.5 µg/mL). A single colony was inoculated into LB broth with appropriate
antibiotics, and grown overnight at 37°C. The starter culture was diluted 100-fold into 20mL of
LB + 12.5 μg/mL Tet + 100 μg/mL Amp, and allowed to grow for two hours at 37°C to early log
phase (OD600 = ~0.1). A stock solution of azidophenylalanine was freshly prepared by dissolving 8
mg of amino acid in 250 μL of DMSO and 250 μL of acidic water (pH = 2.0) The entire volume of
the stock azidophenylalanine solution was added to the culture to achieve the final concentration
of 2 mM. For a control culture with no amino acid, only the 250 μL DMSO and 250 μL pH = 2.0
water are added. The cultures were then allowed to grow for additional one hour before the
phage stock was added. For the target screen hits, the entire 1.2 mL phage elution was added to
the growing culture. For the previously amplified library, phage amounts of 100 times the library
diversity were added. The phage culture was then allowed to grow for 5 hours, centrifuged at
4500 rpm to remove the cells, and the top 80% of the supernatant was collected and precipitated
with 1/6th volume of PEG/NaCl overnight at 4°C. The mixture containing the precipitated phage
was centrifuged at 14,000 rpm for 15 minutes. The pellet was dissolved in 200 μL TBS and spun
down again at 14,000 rpm to remove cellular debris. The total number of recovered phages was
estimated before titering by measuring the absorbance at
269 nm and 320 nm with a NanoDrop spectrophotometer
Figure 5-9: Formula for Estimation of Phage
Concentration.
and using the formula in Figure 5-9 from the Antibody
Design Laboratories website8, where the vector size was set to 7200bp for M13KE.
119
5.2.9
Optimized Phage Library Click Screening Conditions
The click phage screens were performed on the library containing the azidophenylalanine
after the incorporation step. These screens were performed exactly as the target screen, except
that the phage library was incubated with the target on resin overnight at room temperature to
allow sufficient time for the click reaction to occur. A diagram of this screen is seen in Figure 5-10.
Figure 5-10: Phage Click Screening Strategy. a.) The phage library is precleared for TentaGel and sticky binders by
preincubating the library with a scrambled epitope on resin. b.) The phage are then incubated with the target overnight
for a click to form, washed extensively, and eluted from the resin by thrombin cleavage for amplification in e.coli or
titering and sequencing.
5.3
Results and Discussion
5.3.1
Test of Azidophenylalanine Incorporation into a Protein in E.coli
The first test was to determine whether, and if so, in which condition the suppressor
plasmid pAC-AzPheRS-6TRN created by the series of mutagenesis described in 5.2.1 is effective in
incorporating azidophenylalanine into a recombinant protein in E. coli in response to an amber
codon. Because the plasmid contains a chloramphenicol resistant marker (CmR) with an amber
codon in its coding sequence (CAT-D112TAG), this antibiotic resistance is only conferred upon
successful suppression of amber codon to synthesize the full-length protein. When grown in the
presence of chloramphenicol in a liquid medium, only the culture containing the
120
azidophenylalanine amino acid was able to survive, as seen in Figure 5-11, with measured ODs of
0.639 with added azidophenylalanine as opposed to 0.108 with control. This result indicates that
the mutated MjTyrRS for azidophenylalanine is functional and incorporating azidophenylalanine
amino acid into the amber stop codon of the protein. It also indicates that the conditions used
for this incorporation are sufficient to keep the background
suppression without the unnatural amino acid to a negligible
level.
5.3.2
Test of Azidophenylalanine Incorporation
into M13KE Phage
After
the
successful
incorporation
of
the
azidophenylalanine amino acid into a protein in E.coli, the
incorporation was tested using a small number of M13KE phage
Figure 5-11: Test of
incorporation in e.coli.
azide
clones that contain representative display peptide sequences
similar to the library that was designed for the subsequent in situ click screening.
The
azidophenylalanine incorporation was performed using four phage clones individually, and the
presence of azide moiety in the collected phages was tested by clicking on an alkyne-containing
TAMRA dye using a Click-It Kit (Invitrogen). This allowed for the fluorescence visualization of the
dye-labeled pIII protein resolved by SDS-PAGE. As seen in Figure 5-12, there is one band across
three of the four lanes corresponding to ~65kDa, or the running weight of the pIII phage coat
protein, indicating that three of the four phage clones showed incorporation of the
azidophenylalanine. The fourth phage could have been incorporating improperly or could have
been lost in the multiple steps of the experiment, since the quantities of phage used were very
small. Also, there are no other bands present in the gel which would indicate nonspecific azide
incorporation in other proteins in the phage.
This suggests that the incorporation of
121
azidophenylalanine is specific to the pIII protein where amber codon is introduced, and that
peptides containing azidophenylalanine at a precise location can be displayed on the phage
surface.
5.3.3
and Results
Phage Library Screening Conditions
The original phage library produced by Antibody
Design Labs contained about 35% naked phage
determined by titering followed by plaque PCR, and
cannot be directly carried onto the azidophenylalanine
incorporation. The high prevalence of naked phage in
the
library
azidophenylalanine
complicates
incorporation,
the
as
subsequent
the
rapidly
infecting naked phages that do not require suppression
of the amber codon have a significant growth advantage
Figure 5-12: Click-It Kit Visualization of Azide in
pIII Coat Protein. The band seen above
corresponds to ~65kDa, the known running
mass of the pIII protein.
over the properly-inserted phages, and can overwhelm the relatively slow synthesis of
azidophenylalanine-containing phages by amber suppression. For this reason, the traditional
phage display screening methods–“target” screens searching only for binding of the library
component to the target of interest–were used to minimize the number of naked phages present
in the incorporation step. The target screens eluted with thrombin cleavage were able to reduce
the total amount of naked phage seen on titer plates to about 18%. Unfortunately, when this
pool of eluted target hits was amplified using a naturally-suppressing E. coli strain XL1-Blue, this
number rose to 85%-too high to use for any incorporation. An enrichment strategy that can
reduce the number of naked phage to a manageable level has yet to be achieved.
122
5.3.4
Focused Library Screening
Because the amount of naked phages cannot
be reduced to a level that would allow for successful
azidophenylalanine
incorporation,
a
“focused”
library was designed from the insert-containing hit
phages isolated from a target screen. Figure 5-13
Figure 5-13: Gel Image of Colony PCR. This test for
library insert shows only 3 naked phage, lanes 2, 4,
and 6. Out of 16 plaques total (not all shown on
this gel), 13 contained an insert, and were used for
the “focused” library.
shows a result from the plaque PCR that was
completed after a target screen to search for phages
containing inserts. In this gel, each lane represents a
single hit clone, and lanes 2, 4, and 6 show naked phages, as indicated by the PCR product of lower
molecular weight. The phage plaques that were tested in this PCR were also individually amplified
in 1mL cultures in order to create a small pool of each sequence. The 13 insert-containing plaques
were then sequenced to ensure that each one contained an insert. As can be seen in Table 5-4,
only 11 of the 13 hits contained one clean sequence. The rest appeared to have multiple
sequences and may have had some naked phage contamination, and were thus eliminated from
our pool of potential hits. Therefore, out of this target screen, 11 of the amplified stocks that
contained inserts (Table 5-4) were pooled to create a “focused” library of phage that are known
to bind to the target. This focused library has the added advantage of containing no naked phage,
so it is the ideal library to be used to test the conditions for the azidophenylalanine incorporation.
It will also be used for the subsequent focused library click screen with the target to test the in
situ click on a phage library.
123
Table 5-4: Hits from 13 Insert-Containing Phages, Figure 5-13
#1
Amber
D
A
L
L
P
T
V
#3
Amber
N
S
T
Y
A
N
S
#4
Amber
I
S
A
Y
L
I
Q
#5
Uncallable, multiple sequence
#6
Amber
A
F
S
A
L
D
L
#8
Amber
M
L
V
P
L
K
P
#10
Amber
M
D
T
W
L
M
T
#11
Amber
T
L
M
G
Q
W
W
#12
Amber
S
Y
T
T
M
E
V
#13
Amber
G
V
G
G
P
G
P
#14
Uncallable, multiple sequence
#15
Amber
E
W
W
P
G
V
W
#16
Amber
V
L
H
G
G
R
A
5.4
Conclusions
The difficulties associated with the original library itself have delayed the testing of the
described technology, though a roundabout solution to that problem has been discovered. The
focused library is currently undergoing testing as the proof-of-concept for the click phage
screening.
Future libraries for azidophenylalanine incorporation should be built using a phage vector
that is out of frame, so that the insert is required in order to correctly synthesize the pIII coat
protein. This will entirely eliminate the problem with the naked phage, and the complicated
screening strategies will no longer be as important.
124
5.5
Acknowledgements
This ongoing work is being done in conjunction with Dr. Aiko Umeda. JingXin Liang performed
the background research on the G6PD deficiency in malaria, and assisted in the selection of the
screening target.
5.6
References
1.
Wang, L.; Xie, J.; Schultz, P. G., EXPANDING THE GENETIC CODE. Annual Review of
Biophysics and Biomolecular Structure 2006, 35 (1), 225-249.
2.
Tian, F.; Tsao, M. L.; Schultz, P. G., A phage display system with unnatural amino acids. J
Am Chem Soc 2004, 126 (49), 15962-3.
3.
Funke, S. A.; Willbold, D., Mirror image phage display-a method to generate d-peptide
ligands for use in diagnostic or therapeutical applications. Molecular BioSystems 2009, 5 (8),
783-786.
4.
Schumacher, T. N. M.; Mayr, L. M.; Minor, D. L.; Milhollen, M. A.; Burgess, M. W.; Kim, P.
S., Identification of d-Peptide Ligands Through Mirror-Image Phage Display. Science 1996, 271
(5257), 1854-1857.
5.
Liu, J.; Modrek, S.; Gosling, R. D.; Feachem, R. G. A., Malaria eradication: is it possible? Is
it worth it? Should we do it? The Lancet Global Health 2013, 1 (1), e2-e3.
6.
Domingo, G. J.; Satyagraha, A. W.; Anvikar, A.; Baird, K.; Bancone, G.; Bansil, P.; Carter,
N.; Cheng, Q.; Culpepper, J.; Eziefula, C.; Fukuda, M.; Green, J.; Hwang, J.; Lacerda, M.; McGray,
S.; Menard, D.; Nosten, F.; Nuchprayoon, I.; Oo, N. N.; Bualombai, P.; Pumpradit, W.; Qian, K.;
Recht, J.; Roca, A.; Satimai, W.; Sovannaroth, S.; Vestergaard, L. S.; Von Seidlein, L., G6PD testing
in support of treatment and elimination of malaria: recommendations for evaluation of G6PD
tests. Malaria journal 2013, 12, 391.
7.
Cappellini, M. D.; Fiorelli, G., Glucose-6-phosphate dehydrogenase deficiency. Lancet
2008, 371 (9606), 64-74.
8.
Phage Concentration Calculator. http://www.abdesignlabs.com/technicalresources/phage-calculator/ (accessed May 2).
125
Appendix A
Use, Care and Maintenance of Procise 494 CLC
Edman Degradation Protein Sequencer
126
A.1
Regular Use
A.1.1
Loading a Bead
There are 4 cartridges on the Edman, and each can be loaded with a bead. The cartridge
is unscrewed from the machine, and the lid with the hose coming out of the top should ALWAYS
be rested on the cartridge holder, and not left to dangle. This stretches out that hose, and it will
need to be replaced. The cartridge top unscrews. Inside, there are two quartz sample holders,
and the bead fits in between them. With gloves on, use a finger on each side of the cartridge to
hold the second quartz sample holder in place while you turn the cartridge upside-down and let
the top part slide out. These quartz sample holders are VERY expensive, and chip easily. Do not
drop them, and be very careful when handling them. Once the top sample holder is out, there
should be a used filter and cartridge seal that can be removed and thrown out. A new cartridge
seal is slid into the cartridge on top of the bottom sample holder that was left in place. A new
filter gets tapped into the groove in the top sample holder that was removed. It can be gently
tapped in place with tweezers. The bead is placed onto this filter, and the whole cartridge is then
turned upside down, with the bottom sample holder and cartridge seal held in place by a finger
on each side of the cartridge and slid down on top of the top sample holder that has the bead on
top. Then, the cartridge can be turned right-side-up, the lid can be screwed back on, and it can
be placed back into its slot on the Edman.
The run is set up on the Procise software on the computer. Each run should be set to use
the “PulsedLiquid cLC” method, unless a special one is required. The cycles should be set to equal
the number of desired amino acids plus 3 – one warm-up cycle, one blank cycle and one standard
cycle – that run automatically. All of the solvent bottles should be checked to ensure that the
levels are appropriate for running the desired amount of cycles. You can check the amount of
127
each solvent required by clicking the button on the bottom of the screen. It will provide an
amount in mL required to run the set cartridges and cycles.
A.1.2
Solvents
Most of the solvents used are purchased from somewhere other than Applied Biosystems,
and mixed in house. See
Table A-1 for details. When refilling solvents, the bottle should be screwed on until you hear three
clicks. Over-tightening can damage the assembly, such as the R1 bottle. To loosen or tighten this
bottle, you must first push up hard on the rachet assembly to hold it in place while you screw or
unscrew the bottle.
Table A-1: Solvent Compositions
Letter
Name
HPLC Solvents
B2
Acetonitrile in Isopropanol
A3
THF in water
Machine Solvents
R1
PITC in Heptane
R2B
N-methylpiperidine/MeOH/H2O
R3
TFA, neat
R4A
25% TFA in Water, DTT
R5
S1
S2B
S3
S4B
Composition
9:1 Acetonitrile:Isopropanol
3.5% THF in water, 100uL stock Na2PO4, 1mL
1% Acetone, 10mL Buffer premix, 20uL TFA
2.5mL PITC in 50mL heptane
purchased from Sigma
12.5mL TFA in 37.5mL water with 0.01% DTT
(32uL 1M stock)
Acetonitrile with 0.0001% DTT
N-heptane
Ethyl Acetate
N-Butyl Chloride
20% Acetonitrile in water
purchased from Sigma
450mL Ethyl Acetate with 225uL 1M DTT
purchased from Sigma
20% Acetonitrile in water
Na2PO4 stock
2g in 15mL 3.5% THF in water
1M DTT stock
0.231g in 1.5mL Ethyl acetate or water
Stocks
128
A.1.3
Ordering
Table A-2: Parts and Chemicals Commonly Ordered from Applied Biosystems
Part/Chemical
Premix Buffer Concentrate, 100mL
R5B, Acetonitrile/n-Acetylcysteine, 40 mL
Seal, Cylinder Head
Seal, 5mm Micro Pump
Procise Cartridge Seals (50/pk)
PTH-C18 Column, 0.8mm x 250mm
PTH Amino Acid Standards
R2C, N-Methylpiperidine in isopropanol,
butanol, water
9mm TFA Filters
Part Number
401446
4340966
200240
201399
401611
401882
4340968
4310689
401111
Table A-3: Parts and Chemicals Commonly Ordered from Sigma Aldrich
Part/Chemical
Ethyl Acetate CHROMASOLV® Plus, 99.9%
Phenyl Isothiocyanate
Heptane, CHROMASOLV Plus, 99.9%
2L Chromasolve N-Butyl Chloride for HPLC
Trifluoroacetic Acid, 99% reagent plus
A.1.4
Part Number
650528-4L
78780
650536-4L
34958-2L
T6508-1L
Contacting AB
The number to call to place a service call with Applied Biosystems is (800) – 831 – 6844,
press #4, then #1. Our serial number is 4CL000092. Ask for service on the instrument and get a
reference number for the call. Type this onto the purchase order, and have the purchasing
department fax it to (650) – 554 – 2193. Include a description of the problem on the purchase
order.
129
A.1.5
Idle machine
The machine should never be left completely idle, or the column can dry out and will need
to be replaced. If the machine is not running, press the “Manual” button on the front of the
pumps. It should turn the pumps on to 5uL/min at 50%B, and the bottom of that window will
change to say “free running.” This low flow of solvent keeps the solvents moving, and the column
wet.
A.1.6
Settings
These are our common settings for the machine in the off chance that something is lost
or rest and needs to be reprogrammed. These are also the settings used for all of the amino acid
sequencing in this thesis.
Table A-4: PulsedLiquid cLC Method
130
Figure A-1: Temperature and Pressure Settings
131
Figure A-2: Normal1 cLC Gradient
A.2
Troubleshooting
A.2.1
Computer Errors, Freezing, or Not Saving Spectra
The computer needs to be restarted frequently, more so when people use the computer
for other uses. Try to restart the computer once a week to prevent the loss of spectra, and keep
people from using the computer for any other purpose, especially while the machine is running.
If a computer error occurs, or the computer or sequencer freeze, shut down the computer and
both the Procise machine and the pumps. Turn them both back on, and they should sync up
properly and continue running.
132
A.2.2
Machine Bottle Runs Dry
When a bottle on the machine runs dry, air bubbles can get into the lines, and it will not
be able to detect the solvent even after the bottle is refilled. In order to fix this, the line will need
to be backflushed. After the solvent bottle has been refilled, go to the tab in the Procise software
called “Manual Control” and find the solvent bottle that needs to be backflushed in either the
“Flask Functions” tab or “Cartridge Functions” tab. For example, in Figure A-3, the Flask Function
“Backflush S3” is highlighted. Once it is highlighted, click “execute” on the bottom of the screen,
and watch the bottom of the hose in the solvent bottle until bubbles can be seen coming out.
Then press “All Off” to shut off the backflush, and the solvent should now be detected. The run
can now be restarted.
A.2.3
HPLC Bottle Runs Dry
Sometimes the HPLC solvent bottles run dry, and this is not as easily fixed as the machine
bottles. First, the HPLC bottles need to be refilled. Then the pump must be purged manually
using the buttons on the front of the pumps. Push the function key for purge, then select the
pump to be purged. When the purge is complete, push “Manual” on the front of the pump to
turn the pumps on to free running. The pumps should be allowed to run freely until bubbles are
no longer coming from the end of the column (as seen in the waste line). If the machine is needed
immediately, the flow rate can be turned up to move this process along faster.
Everything should be done to minimize the times that these bottles are allowed to run
dry, so that the pumps are not pumping dry and the column does not dry out.
133
Figure A-3: Procise Screen for Backflushing a Line
A.2.4
Baseline Errors – Dip at front of Spectra
A dip at the front of the spectra, as seen in Figure A-4, causing difficulty in reading the
amino acid sequence, is a fairly common problem that indicates that the pump seals need to be
changed. In order to do this, you must unscrew the grey metal screw going into the pump
cylinder, then unscrew the black ring around the top of the cylinder. Remove the cylinder by using
the purge function of the pumps to purge the pump you are working on, and PUSH the cylinder
out. NEVER PULL the cylinder out – it could damage the pumps, which are nearly impossible to
replace on this machine. Once the cylinder has been pushed out fully and starts getting pulled
back in, push stop to keep it out. Gently pull the cylinder off of the post. One of the pump seals
that needs to be changed is the one on the end of the post. It is frequently hard to remove, and
134
can be sliced off or yanked with pliers. The second pump seal is the ring inside of the metal part
at the top of the cylinder – pull this off to expose the seal.
To put the cylinder back onto the post, do NOT just push. If it is not aligned correctly, this
can damage the inside of the cylinder, which cannot be replaced. Use the metal alignment tool
in the spare parts drawer. This part has two pieces that come together to form a tunnel that fits
onto the end of the cylinder, through which you can slide the cylinder post. Before doing this,
take a piece of Parafilm to cover the hole into the pump cylinder. If one of the metal alignment
pieces falls in, it will be VERY difficult to remove. Then, while holding the metal pieces to the end
of the cylinder, align this with the post, and apply steady but hard pressure to push the cylinder
onto the post. You will feel a click when it is on properly, and it will not pull back off if you tug on
it. Then, by tilting the cylinder back and forth, pull off the metal alignment pieces, then the
Parafilm. Use the purge function to pull this cylinder back down into the pump. One that is in, it
will need twisted so that it aligns properly and slides into place. There is a notch it must fit into.
Then, the black ring can be screwed back on, followed by the metal screw.
135
Figure A-4: Dip at Front of Spectra Indicative of Bad Pump Seal
A.2.5
Baseline Errors – Stretched Out Amino Acid Standards
If the amino acid standards look very stretched out and are not completing by the end of
the HPLC run, or if the DPTU peak is shifting from cycle to cycle, there is most likely a leak in the
pumps. This is a fairly easy fix, which requires looking at all of the screws around the pumps. One
of them will more than likely have a ring of salt around it. Wash the salt off, and tighten the screw
¼ turn. It should fix the spectra problems immediately.
A.2.6
Pressure Errors – Change Bottle Seals
Occasionally, when the machine has difficulty adding a solvent, it is due to a faulty rachet
cap assembly, or the part that the bottle screws into on the machine. In order to test this, go to
the “Test Procedure” tab on the Procise software, and select “Leak” test. Scroll down to the
appropriate bottle, and try a leak test. If it fails, but the bottle is screwed in tightly, this assembly
should be replaced. See page 9-19 in the User Manual for details on this procedure. Once this
136
assembly has been replaced, the seal should no longer leak, and the solvent delivery should
function as normal.
Figure A-5: Leak Test Procise Software Screen
A.2.7
Pressure Errors – Clogged Lines
Overpressure errors on the Edman can sometimes be related to a clogged line. Use the
error message to try to find the line that might be clogged. The line can either be replaced by
new line from stocks in the spare-parts drawers, or flushed clear with methanol.