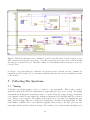
1
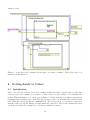
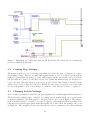
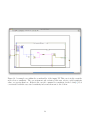
can be seen in Figure 4 and will continue to run while the wired condition is true or false. This
can be changed by clicking on the condition in the lower right hand corner to set it either equal
to stop on true or continue on true. The lower left corner holds the variable i which is the loop
iteration starting at zero. The loop in Figure 4 can be seen is wired as a stop on true condition
so when the ok button is pressed it will pass a true to the stop condition ending the loop and
quitting the VI since there is no block code to the right. The next important loop is a for loop.
This operates similarly except that it has a variable N in the upper left corner which is the number
of iterations to complete. When N iterations have been completed the loop quits. This loop is
represented graphically similar to a stack of pages surrounding the code to be executed. A stacked
structure is the next structure used in the interface and looks like a film strip surrounding the code
with a selector on the top. The selector at the top chooses what level in the stacked structure you
are viewing and the code executes in sequence. So level zero in the stack is executed and then
level 1 and so on. A case structure is the same as a case statement in programming but is used in
this interface as a substitute for an if statement. The case selector is on the left of the structure
halfway up and whatever this is wired to will determine what case is executed. The case structure
is used however with a boolean being wired to the case selector so that each case statement has
only two options, which can be selected at the top, either true or false. The event handler is the
final structure used and was the main improvement to the functionality of the new interface and
will be discussed in detail in section 7.
Some useful tools for debugging include the addition of breakpoints and the use of the wire probe
Figure 4: A basic VI which allows the user to change a displayed value and quits when the OK
button is pressed.
which allows for a user to see values within a wire at a breakpoint and the highlight execution tool.
The highlighting execution tool is similar to using the wire probe tool but works on all wires as the
program runs. This tool highlights each wire and displays the value as it is being sent through this
wire. This is a great tool for understand how loops work and execution order. This tool was most
useful when debugging the interface as a whole since the signals can be followed and it can be seen
exactly where the problem occurred.
8