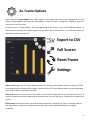
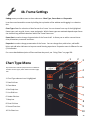
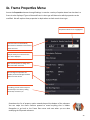
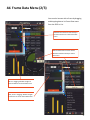
1
5a. Definition & Topology (1/2)
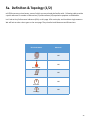
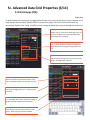
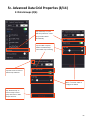
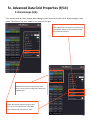
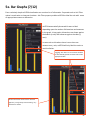
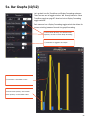
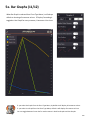
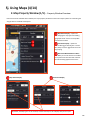
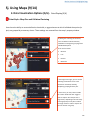
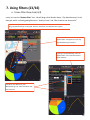
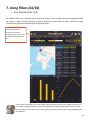
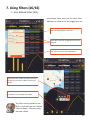
miVEDiX uses many visual assets, some of which you may already be familiar with. Following table provides
a quick reference for number of dimensions (D) and measures (M) required to populate a visualization.
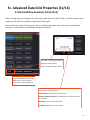
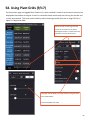
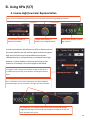
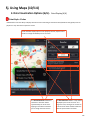
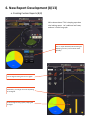
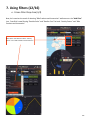
Let’s look at Key Performance Indicators (KPIs) on this page. KPIs are simple, and visualize a single measure.
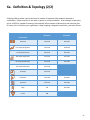
We will look at other chart types on the next page. They visualize both Measures and Dimensions.
KPI Visualization
Measures
1M
Bullet
1M
Thermometer
Trend
1M
1M
Rev Meter
Fuel Gage
1M
44