1
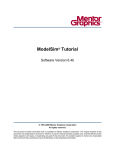
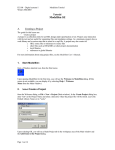
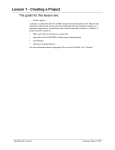
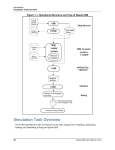
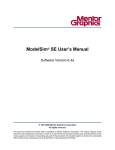
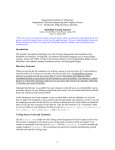
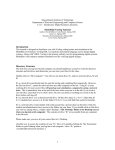
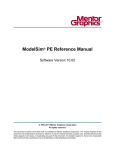
Chapter 3
Basic Simulation
Introduction
In this lesson you will go step-by-step through the basic simulation flow:
1. Create the Working Design Library
2. Compile the Design Units
3. Load the Design
4. Run the Simulation
Design Files for this Lesson
The sample design for this lesson is a simple 8-bit, binary up-counter with an associated test
bench. The pathnames are as follows:
Verilog – <install_dir>/examples/tutorials/verilog/basicSimulation/counter.v and tcounter.v
VHDL – <install_dir>/examples/tutorials/vhdl/basicSimulation/counter.vhd and tcounter.vhd
This lesson uses the Verilog files counter.v and tcounter.v. If you have a VHDL license, use
counter.vhd and tcounter.vhd instead. Or, if you have a mixed license, feel free to use the
Verilog test bench with the VHDL counter or vice versa.
Related Reading
User’s Manual Chapters: Design Libraries, Verilog and SystemVerilog Simulation, and VHDL
Simulation.
Reference Manual commands: vlib, vmap, vlog, vcom, view, and run.
Create the Working Design Library
Before you can simulate a design, you must first create a library and compile the source code
into that library.
1. Create a new directory and copy the design files for this lesson into it.
Start by creating a new directory for this exercise (in case other users will be working
with these lessons).
ModelSim Tutorial, v6.6c
15
Basic Simulation
Create the Working Design Library
Verilog: Copy counter.v and tcounter.v files from
/<install_dir>/examples/tutorials/verilog/basicSimulation to the new directory.
VHDL: Copy counter.vhd and tcounter.vhd files from
/<install_dir>/examples/tutorials/vhdl/basicSimulation to the new directory.
2. Start ModelSim if necessary.
a. Type vsim at a UNIX shell prompt or use the ModelSim icon in Windows.
Upon opening ModelSim for the first time, you will see the Welcome to ModelSim
dialog. Click Close.
b. Select File > Change Directory and change to the directory you created in step 1.
3. Create the working library.
a. Select File > New > Library.
This opens a dialog where you specify physical and logical names for the library
(Figure 3-1). You can create a new library or map to an existing library. We’ll be
doing the former.
Figure 3-1. The Create a New Library Dialog
b. Type work in the Library Name field (if it isn’t already entered automatically).
c. Click OK.
ModelSim creates a directory called work and writes a specially-formatted file
named _info into that directory. The _info file must remain in the directory to
distinguish it as a ModelSim library. Do not edit the folder contents from your
operating system; all changes should be made from within ModelSim.
16
ModelSim Tutorial, v6.6c
Basic Simulation
Compile the Design Units
ModelSim also adds the library to the Library window (Figure 3-2) and records the
library mapping for future reference in the ModelSim initialization file
(modelsim.ini).
Figure 3-2. work Library Added to the Library Window
When you pressed OK in step 3c above, the following was printed to the Transcript window:
vlib work
vmap work work
These two lines are the command-line equivalents of the menu selections you made. Many
command-line equivalents will echo their menu-driven functions in this fashion.
Compile the Design Units
With the working library created, you are ready to compile your source files.
You can compile by using the menus and dialogs of the graphic interface, as in the Verilog
example below, or by entering a command at the ModelSim> prompt.
1. Compile counter.v and tcounter.v.
a. Select Compile > Compile. This opens the Compile Source Files dialog
(Figure 3-3).
If the Compile menu option is not available, you probably have a project open. If so,
close the project by making the Library window active and selecting File > Close
from the menus.
b. Select both counter.v and tcounter.v modules from the Compile Source Files dialog
and click Compile. The files are compiled into the work library.
c. When compile is finished, click Done.
ModelSim Tutorial, v6.6c
17
Basic Simulation
Load the Design
Figure 3-3. Compile Source Files Dialog
2. View the compiled design units.
a. In the Library window, click the ’+’ icon next to the work library and you will see
two design units (Figure 3-4). You can also see their types (Modules, Entities, etc.)
and the path to the underlying source files.
Figure 3-4. Verilog Modules Compiled into work Library
Load the Design
1. Load the test_counter module into the simulator.
a. In the Library window, click the ‘+’ sign next to the work library to show the files
contained there.
b. Double-click test_counter to load the design.
18
ModelSim Tutorial, v6.6c
Basic Simulation
Load the Design
You can also load the design by selecting Simulate > Start Simulation in the menu
bar. This opens the Start Simulation dialog. With the Design tab selected, click the
’+’ sign next to the work library to see the counter and test_counter modules. Select
the test_counter module and click OK (Figure 3-5).
Figure 3-5. Loading Design with Start Simulation Dialog
When the design is loaded, a Structure window opens (labeled sim). This window
displays the hierarchical structure of the design as shown in Figure 3-6. You can
navigate within the design hierarchy in the Structure (sim) window by clicking on
any line with a ’+’ (expand) or ’-’ (contract) icon.
ModelSim Tutorial, v6.6c
19
Basic Simulation
Load the Design
Figure 3-6. The Design Hierarchy
In addition, an Objects window and a Processes window opens (Figure 3-7). The
Objects window shows the names and current values of data objects in the current
region selected in the Structure (sim) window. Data objects include signals, nets,
registers, constants and variables not declared in a process, generics, parameters.
The Processes window displays a list of HDL processes in one of four viewing
modes: Active, In Region, Design, and Hierarchical. The Design view mode is
intended for primary navigation of ESL (Electronic System Level) designs where
processes are a foremost consideration. By default, this window displays the active
processes in your simulation (Active view mode).
Figure 3-7. The Object Window and Processes Window
20
ModelSim Tutorial, v6.6c
Basic Simulation
Run the Simulation
Run the Simulation
We’re ready to run the simulation. But before we do, we’ll open the Wave window and add
signals to it.
1. Open the Wave window.
a. Enter view wave at the command line.
The Wave window opens in the right side of the Main window. Resize it so it is
visible.
You can also use the View > Wave menu selection to open a Wave window. The
Wave window is just one of several debugging windows available on the View
menu.
2. Add signals to the Wave window.
a. In the Structure (sim) window, right-click test_counter to open a popup context
menu.
b. Select Add > To Wave > All items in region (Figure 3-8).
All signals in the design are added to the Wave window.
Figure 3-8. Using the Popup Menu to Add Signals to Wave Window
3. Run the simulation.
a. Click the Run icon.
The simulation runs for 100 ns (the default simulation length) and waves are
drawn in the Wave window.
b. Enter run 500 at the VSIM> prompt in the Transcript window.
The simulation advances another 500 ns for a total of 600 ns (Figure 3-9).
ModelSim Tutorial, v6.6c
21
Basic Simulation
Set Breakpoints and Step through the Source
Figure 3-9. Waves Drawn in Wave Window
c. Click the Run -All icon on the Main or Wave window toolbar.
The simulation continues running until you execute a break command or it
hits a statement in your code (e.g., a Verilog $stop statement) that halts the
simulation.
d. Click the Break icon
to stop the simulation.
Set Breakpoints and Step through the Source
Next you will take a brief look at one interactive debugging feature of the ModelSim
environment. You will set a breakpoint in the Source window, run the simulation, and then step
through the design under test. Breakpoints can be set only on executable lines, which are
indicated with red line numbers.
1. Open counter.v in the Source window.
a. Select View > Files to open the Files window.
b. Click the + sign next to the sim filename to see the contents of vsim.wlf dataset.
c. Double-click counter.v (or counter.vhd if you are simulating the VHDL files) to
open the file in the Source window.
2. Set a breakpoint on line 36 of counter.v (or, line 39 of counter.vhd for VHDL).
a. Scroll to line 36 and click in the Ln# (line number) column next to the line number.
A red ball appears in the line number column at line number 36 (Figure 3-10),
indicating that a breakpoint has been set.
22
ModelSim Tutorial, v6.6c
Basic Simulation
Set Breakpoints and Step through the Source
Figure 3-10. Setting Breakpoint in Source Window
3. Disable, enable, and delete the breakpoint.
a. Click the red ball to disable the breakpoint. It will become a black ball.
b. Click the black ball again to re-enable the breakpoint. It will become a red ball.
c. Click the red ball with your right mouse button and select Remove Breakpoint 36.
d. Click in the line number column next to line number 36 again to re-create the
breakpoint.
4. Restart the simulation.
a. Click the Restart icon to reload the design elements and reset the simulation
time to zero.
The Restart dialog that appears gives you options on what to retain during
the restart (Figure 3-11).
Figure 3-11. Setting Restart Functions
ModelSim Tutorial, v6.6c
23
Basic Simulation
Set Breakpoints and Step through the Source
b. Click the Restart button in the Restart dialog.
c. Click the Run -All icon.
The simulation runs until the breakpoint is hit. When the simulation hits the
breakpoint, it stops running, highlights the line with a blue arrow in the
Source view (Figure 3-12), and issues a Break message in the Transcript window.
Figure 3-12. Blue Arrow Indicates Where Simulation Stopped.
When a breakpoint is reached, typically you want to know one or more signal
values. You have several options for checking values:
•
look at the values shown in the Objects window (Figure 3-13)
Figure 3-13. Values Shown in Objects Window
24
•
set your mouse pointer over a variable in the Source window and a yellow box
will appear with the variable name and the value of that variable at the time of
the selected cursor in the Wave window
•
highlight a signal, parameter, or variable in the Source window, right-click it,
and select Examine from the pop-up menu to display the variable and its current
value in a Source Examine window (Figure 3-14)
ModelSim Tutorial, v6.6c
Basic Simulation
Set Breakpoints and Step through the Source
Figure 3-14. Parameter Name and Value in Source Examine Window
•
use the examine command at the VSIM> prompt to output a variable value to
the Transcript window (i.e., examine count)
5. Try out the step commands.
a. Click the Step icon on the Main window toolbar.
This single-steps the debugger.
Experiment on your own. Set and clear breakpoints and use the Step, Step Over, and
Continue Run commands until you feel comfortable with their operation.
Lesson Wrap-Up
This concludes this lesson. Before continuing we need to end the current simulation.
1. Select Simulate > End Simulation.
2. Click Yes when prompted to confirm that you wish to quit simulating.
ModelSim Tutorial, v6.6c
25