1
ModelSim® SE Tutorial
Software Version 6.3a
June 2007
© 1991-2007 Mentor Graphics Corporation
All rights reserved.
This document contains information that is proprietary to Mentor Graphics Corporation. The original recipient of this
document may duplicate this document in whole or in part for internal business purposes only, provided that this entire
notice appears in all copies. In duplicating any part of this document, the recipient agrees to make every reasonable
effort to prevent the unauthorized use and distribution of the proprietary information.
This document is for information and instruction purposes. Mentor Graphics reserves the right to make
changes in specifications and other information contained in this publication without prior notice, and the
reader should, in all cases, consult Mentor Graphics to determine whether any changes have been
made.
The terms and conditions governing the sale and licensing of Mentor Graphics products are set forth in
written agreements between Mentor Graphics and its customers. No representation or other affirmation
of fact contained in this publication shall be deemed to be a warranty or give rise to any liability of Mentor
Graphics whatsoever.
MENTOR GRAPHICS MAKES NO WARRANTY OF ANY KIND WITH REGARD TO THIS MATERIAL
INCLUDING, BUT NOT LIMITED TO, THE IMPLIED WARRANTIES OF MERCHANTABILITY AND
FITNESS FOR A PARTICULAR PURPOSE.
MENTOR GRAPHICS SHALL NOT BE LIABLE FOR ANY INCIDENTAL, INDIRECT, SPECIAL, OR
CONSEQUENTIAL DAMAGES WHATSOEVER (INCLUDING BUT NOT LIMITED TO LOST PROFITS)
ARISING OUT OF OR RELATED TO THIS PUBLICATION OR THE INFORMATION CONTAINED IN IT,
EVEN IF MENTOR GRAPHICS CORPORATION HAS BEEN ADVISED OF THE POSSIBILITY OF
SUCH DAMAGES.
RESTRICTED RIGHTS LEGEND 03/97
U.S. Government Restricted Rights. The SOFTWARE and documentation have been developed entirely
at private expense and are commercial computer software provided with restricted rights. Use,
duplication or disclosure by the U.S. Government or a U.S. Government subcontractor is subject to the
restrictions set forth in the license agreement provided with the software pursuant to DFARS 227.72023(a) or as set forth in subparagraph (c)(1) and (2) of the Commercial Computer Software - Restricted
Rights clause at FAR 52.227-19, as applicable.
Contractor/manufacturer is:
Mentor Graphics Corporation
8005 S.W. Boeckman Road, Wilsonville, Oregon 97070-7777.
Telephone: 503.685.7000
Toll-Free Telephone: 800.592.2210
Website: www.mentor.com
SupportNet: supportnet.mentor.com/
Send Feedback on Documentation: supportnet.mentor.com/user/feedback_form.cfm
TRADEMARKS: The trademarks, logos and service marks ("Marks") used herein are the property of
Mentor Graphics Corporation or other third parties. No one is permitted to use these Marks without the
prior written consent of Mentor Graphics or the respective third-party owner. The use herein of a thirdparty Mark is not an attempt to indicate Mentor Graphics as a source of a product, but is intended to
indicate a product from, or associated with, a particular third party. A current list of Mentor Graphics’
trademarks may be viewed at: www.mentor.com/terms_conditions/trademarks.cfm.
Table of Contents
Chapter 1
Introduction. . . . . . . . . . . . . . . . . . . . . . . . . . . . . . . . . . . . . . . . . . . . . . . . . . . . . . . . . . . . . . .
Assumptions. . . . . . . . . . . . . . . . . . . . . . . . . . . . . . . . . . . . . . . . . . . . . . . . . . . . . . . . . . . . . .
Where to Find Our Documentation . . . . . . . . . . . . . . . . . . . . . . . . . . . . . . . . . . . . . . . . . . . .
Download a Free PDF Reader With Search . . . . . . . . . . . . . . . . . . . . . . . . . . . . . . . . . . . .
Technical Support and Updates . . . . . . . . . . . . . . . . . . . . . . . . . . . . . . . . . . . . . . . . . . . . . . .
Before you Begin . . . . . . . . . . . . . . . . . . . . . . . . . . . . . . . . . . . . . . . . . . . . . . . . . . . . . . . . . .
Example Designs . . . . . . . . . . . . . . . . . . . . . . . . . . . . . . . . . . . . . . . . . . . . . . . . . . . . . . . .
13
13
13
14
14
15
15
Chapter 2
Conceptual Overview . . . . . . . . . . . . . . . . . . . . . . . . . . . . . . . . . . . . . . . . . . . . . . . . . . . . . . .
Design Optimizations. . . . . . . . . . . . . . . . . . . . . . . . . . . . . . . . . . . . . . . . . . . . . . . . . . . . . . .
Basic Simulation Flow. . . . . . . . . . . . . . . . . . . . . . . . . . . . . . . . . . . . . . . . . . . . . . . . . . . . . .
Project Flow . . . . . . . . . . . . . . . . . . . . . . . . . . . . . . . . . . . . . . . . . . . . . . . . . . . . . . . . . . . . . .
Multiple Library Flow . . . . . . . . . . . . . . . . . . . . . . . . . . . . . . . . . . . . . . . . . . . . . . . . . . . . . .
Debugging Tools . . . . . . . . . . . . . . . . . . . . . . . . . . . . . . . . . . . . . . . . . . . . . . . . . . . . . . . . . .
17
17
17
19
20
21
Chapter 3
Basic Simulation . . . . . . . . . . . . . . . . . . . . . . . . . . . . . . . . . . . . . . . . . . . . . . . . . . . . . . . . . . .
Create the Working Design Library. . . . . . . . . . . . . . . . . . . . . . . . . . . . . . . . . . . . . . . . . . . .
Run the Simulation . . . . . . . . . . . . . . . . . . . . . . . . . . . . . . . . . . . . . . . . . . . . . . . . . . . . . . . .
Set Breakpoints and Step through the Source . . . . . . . . . . . . . . . . . . . . . . . . . . . . . . . . . . . .
Navigating the Interface. . . . . . . . . . . . . . . . . . . . . . . . . . . . . . . . . . . . . . . . . . . . . . . . . . . . .
23
24
27
29
32
Chapter 4
Projects. . . . . . . . . . . . . . . . . . . . . . . . . . . . . . . . . . . . . . . . . . . . . . . . . . . . . . . . . . . . . . . . . . .
Create a New Project . . . . . . . . . . . . . . . . . . . . . . . . . . . . . . . . . . . . . . . . . . . . . . . . . . . . . . .
Add Objects to the Project . . . . . . . . . . . . . . . . . . . . . . . . . . . . . . . . . . . . . . . . . . . . . . . . .
Changing Compile Order (VHDL) . . . . . . . . . . . . . . . . . . . . . . . . . . . . . . . . . . . . . . . . . . .
Organizing Projects with Folders. . . . . . . . . . . . . . . . . . . . . . . . . . . . . . . . . . . . . . . . . . . . . .
Add Folders. . . . . . . . . . . . . . . . . . . . . . . . . . . . . . . . . . . . . . . . . . . . . . . . . . . . . . . . . . . . .
Moving Files to Folders . . . . . . . . . . . . . . . . . . . . . . . . . . . . . . . . . . . . . . . . . . . . . . . . . . .
Simulation Configurations . . . . . . . . . . . . . . . . . . . . . . . . . . . . . . . . . . . . . . . . . . . . . . . . . . .
39
39
40
42
45
45
47
48
Chapter 5
Working With Multiple Libraries. . . . . . . . . . . . . . . . . . . . . . . . . . . . . . . . . . . . . . . . . . . . .
Creating the Resource Library . . . . . . . . . . . . . . . . . . . . . . . . . . . . . . . . . . . . . . . . . . . . . . . .
Creating the Project . . . . . . . . . . . . . . . . . . . . . . . . . . . . . . . . . . . . . . . . . . . . . . . . . . . . . . . .
Linking to the Resource Library . . . . . . . . . . . . . . . . . . . . . . . . . . . . . . . . . . . . . . . . . . . . . .
Linking in Verilog. . . . . . . . . . . . . . . . . . . . . . . . . . . . . . . . . . . . . . . . . . . . . . . . . . . . . . . .
Linking in VHDL . . . . . . . . . . . . . . . . . . . . . . . . . . . . . . . . . . . . . . . . . . . . . . . . . . . . . . . .
53
53
55
56
57
58
ModelSim SE Tutorial, v6.3a
June 2007
3
Table of Contents
Permanently Mapping VHDL Resource Libraries . . . . . . . . . . . . . . . . . . . . . . . . . . . . . . . .
60
Chapter 6
Simulating Designs With SystemC . . . . . . . . . . . . . . . . . . . . . . . . . . . . . . . . . . . . . . . . . . . .
Setting up the Environment . . . . . . . . . . . . . . . . . . . . . . . . . . . . . . . . . . . . . . . . . . . . . . . . . .
Preparing an OSCI SystemC design . . . . . . . . . . . . . . . . . . . . . . . . . . . . . . . . . . . . . . . . . . .
Compiling a SystemC-only Design . . . . . . . . . . . . . . . . . . . . . . . . . . . . . . . . . . . . . . . . . . . .
Mixed SystemC and HDL Example . . . . . . . . . . . . . . . . . . . . . . . . . . . . . . . . . . . . . . . . . . .
Viewing SystemC Objects in the GUI . . . . . . . . . . . . . . . . . . . . . . . . . . . . . . . . . . . . . . . . . .
Setting Breakpoints and Stepping in the Source Window . . . . . . . . . . . . . . . . . . . . . . . . .
Examining SystemC Objects and Variables . . . . . . . . . . . . . . . . . . . . . . . . . . . . . . . . . . . .
Removing a Breakpoint . . . . . . . . . . . . . . . . . . . . . . . . . . . . . . . . . . . . . . . . . . . . . . . . . . .
63
64
64
68
69
73
74
76
77
Chapter 7
Analyzing Waveforms . . . . . . . . . . . . . . . . . . . . . . . . . . . . . . . . . . . . . . . . . . . . . . . . . . . . . .
Loading a Design . . . . . . . . . . . . . . . . . . . . . . . . . . . . . . . . . . . . . . . . . . . . . . . . . . . . . . . . . .
Add Objects to the Wave Window . . . . . . . . . . . . . . . . . . . . . . . . . . . . . . . . . . . . . . . . . . . .
Zooming the Waveform Display . . . . . . . . . . . . . . . . . . . . . . . . . . . . . . . . . . . . . . . . . . . . . .
Using Cursors in the Wave Window . . . . . . . . . . . . . . . . . . . . . . . . . . . . . . . . . . . . . . . . . . .
Working with a Single Cursor . . . . . . . . . . . . . . . . . . . . . . . . . . . . . . . . . . . . . . . . . . . . . .
Working with Multiple Cursors . . . . . . . . . . . . . . . . . . . . . . . . . . . . . . . . . . . . . . . . . . . . .
Saving and Reusing the Window Format . . . . . . . . . . . . . . . . . . . . . . . . . . . . . . . . . . . . . . .
79
80
80
82
82
83
85
86
Chapter 8
Creating Stimulus With Waveform Editor . . . . . . . . . . . . . . . . . . . . . . . . . . . . . . . . . . . . .
Load a Design Unit . . . . . . . . . . . . . . . . . . . . . . . . . . . . . . . . . . . . . . . . . . . . . . . . . . . . . . . .
Create Graphical Stimulus with a Wizard . . . . . . . . . . . . . . . . . . . . . . . . . . . . . . . . . . . . . . .
Edit Waveforms in the Wave Window . . . . . . . . . . . . . . . . . . . . . . . . . . . . . . . . . . . . . . . . .
Save and Reuse the Wave Commands. . . . . . . . . . . . . . . . . . . . . . . . . . . . . . . . . . . . . . . . . .
Exporting the Created Waveforms. . . . . . . . . . . . . . . . . . . . . . . . . . . . . . . . . . . . . . . . . . . . .
Simulating with the Testbench File . . . . . . . . . . . . . . . . . . . . . . . . . . . . . . . . . . . . . . . . . . . .
Importing an EVCD File . . . . . . . . . . . . . . . . . . . . . . . . . . . . . . . . . . . . . . . . . . . . . . . . . . . .
87
87
88
91
94
95
97
98
Chapter 9
Debugging With The Dataflow Window. . . . . . . . . . . . . . . . . . . . . . . . . . . . . . . . . . . . . . . .
Exploring Connectivity . . . . . . . . . . . . . . . . . . . . . . . . . . . . . . . . . . . . . . . . . . . . . . . . . . . . .
Tracing Events . . . . . . . . . . . . . . . . . . . . . . . . . . . . . . . . . . . . . . . . . . . . . . . . . . . . . . . . . . . .
Tracing an X (Unknown) . . . . . . . . . . . . . . . . . . . . . . . . . . . . . . . . . . . . . . . . . . . . . . . . . . . .
Displaying Hierarchy in the Dataflow Window . . . . . . . . . . . . . . . . . . . . . . . . . . . . . . . . . .
101
102
105
108
110
Chapter 10
Viewing And Initializing Memories . . . . . . . . . . . . . . . . . . . . . . . . . . . . . . . . . . . . . . . . . . .
View a Memory and its Contents. . . . . . . . . . . . . . . . . . . . . . . . . . . . . . . . . . . . . . . . . . . . . .
Navigate Within the Memory . . . . . . . . . . . . . . . . . . . . . . . . . . . . . . . . . . . . . . . . . . . . . . .
Export Memory Data to a File . . . . . . . . . . . . . . . . . . . . . . . . . . . . . . . . . . . . . . . . . . . . . . . .
Initialize a Memory . . . . . . . . . . . . . . . . . . . . . . . . . . . . . . . . . . . . . . . . . . . . . . . . . . . . . . . .
Interactive Debugging Commands . . . . . . . . . . . . . . . . . . . . . . . . . . . . . . . . . . . . . . . . . . . .
113
114
118
120
121
124
4
ModelSim SE Tutorial, v6.3a
June 2007
Table of Contents
Chapter 11
Analyzing Performance With The Profiler . . . . . . . . . . . . . . . . . . . . . . . . . . . . . . . . . . . . . 129
View Profile Details. . . . . . . . . . . . . . . . . . . . . . . . . . . . . . . . . . . . . . . . . . . . . . . . . . . . . . . . 134
Filtering and Saving the Data . . . . . . . . . . . . . . . . . . . . . . . . . . . . . . . . . . . . . . . . . . . . . . . . 135
Chapter 12
Simulating With Code Coverage . . . . . . . . . . . . . . . . . . . . . . . . . . . . . . . . . . . . . . . . . . . . . .
Coverage Statistics in the Main window . . . . . . . . . . . . . . . . . . . . . . . . . . . . . . . . . . . . . . . .
Coverage Statistics in the Source Window . . . . . . . . . . . . . . . . . . . . . . . . . . . . . . . . . . . . . .
Toggle Statistics in the Objects Pane. . . . . . . . . . . . . . . . . . . . . . . . . . . . . . . . . . . . . . . . . . .
Excluding Lines and Files from Coverage Statistics . . . . . . . . . . . . . . . . . . . . . . . . . . . . . . .
Creating Code Coverage Reports. . . . . . . . . . . . . . . . . . . . . . . . . . . . . . . . . . . . . . . . . . . . . .
139
143
145
147
148
149
Chapter 13
Comparing Waveforms . . . . . . . . . . . . . . . . . . . . . . . . . . . . . . . . . . . . . . . . . . . . . . . . . . . . .
Creating the Reference Dataset . . . . . . . . . . . . . . . . . . . . . . . . . . . . . . . . . . . . . . . . . . . . . . .
Creating the Test Dataset . . . . . . . . . . . . . . . . . . . . . . . . . . . . . . . . . . . . . . . . . . . . . . . . . . . .
Comparing the Simulation Runs . . . . . . . . . . . . . . . . . . . . . . . . . . . . . . . . . . . . . . . . . . . . . .
Viewing Comparison Data. . . . . . . . . . . . . . . . . . . . . . . . . . . . . . . . . . . . . . . . . . . . . . . . . . .
Comparison Data in the Wave window . . . . . . . . . . . . . . . . . . . . . . . . . . . . . . . . . . . . . . .
Comparison Data in the List Window . . . . . . . . . . . . . . . . . . . . . . . . . . . . . . . . . . . . . . . .
Saving and Reloading Comparison Data . . . . . . . . . . . . . . . . . . . . . . . . . . . . . . . . . . . . . . . .
153
154
154
156
157
157
158
159
Chapter 14
Automating Simulation . . . . . . . . . . . . . . . . . . . . . . . . . . . . . . . . . . . . . . . . . . . . . . . . . . . . .
Creating a Simple DO File. . . . . . . . . . . . . . . . . . . . . . . . . . . . . . . . . . . . . . . . . . . . . . . . . . .
Running in Command-Line Mode . . . . . . . . . . . . . . . . . . . . . . . . . . . . . . . . . . . . . . . . . . . . .
Using Tcl with the Simulator. . . . . . . . . . . . . . . . . . . . . . . . . . . . . . . . . . . . . . . . . . . . . . . . .
163
163
164
167
Index
End-User License Agreement
ModelSim SE Tutorial, v6.3a
June 2007
5
List of Examples
6
ModelSim SE Tutorial, v6.3a
June 2007
List of Figures
Figure 2-1. Basic Simulation Flow - Overview Lab . . . . . . . . . . . . . . . . . . . . . . . . . . . . . . .
Figure 2-2. Project Flow . . . . . . . . . . . . . . . . . . . . . . . . . . . . . . . . . . . . . . . . . . . . . . . . . . . .
Figure 2-3. Multiple Library Flow. . . . . . . . . . . . . . . . . . . . . . . . . . . . . . . . . . . . . . . . . . . . .
Figure 3-1. Basic Simulation Flow - Simulation Lab . . . . . . . . . . . . . . . . . . . . . . . . . . . . . .
Figure 3-2. The Create a New Library Dialog. . . . . . . . . . . . . . . . . . . . . . . . . . . . . . . . . . . .
Figure 3-3. work Library in the Workspace. . . . . . . . . . . . . . . . . . . . . . . . . . . . . . . . . . . . . .
Figure 3-4. Compile Source Files Dialog . . . . . . . . . . . . . . . . . . . . . . . . . . . . . . . . . . . . . . .
Figure 3-5. Verilog Modules Compiled into work Library . . . . . . . . . . . . . . . . . . . . . . . . . .
Figure 3-6. Workspace and Objects Panes Showing a Verilog Design. . . . . . . . . . . . . . . . .
Figure 3-7. Using the Popup Menu to Add Signals to Wave Window . . . . . . . . . . . . . . . . .
Figure 3-8. Waves Drawn in Wave Window. . . . . . . . . . . . . . . . . . . . . . . . . . . . . . . . . . . . .
Figure 3-9. Setting Breakpoint in Source Window . . . . . . . . . . . . . . . . . . . . . . . . . . . . . . . .
Figure 3-10. Setting Restart Functions . . . . . . . . . . . . . . . . . . . . . . . . . . . . . . . . . . . . . . . . .
Figure 3-11. Blue Arrow Indicates Where Simulation Stopped. . . . . . . . . . . . . . . . . . . . . . .
Figure 3-12. Values Shown in Objects Window . . . . . . . . . . . . . . . . . . . . . . . . . . . . . . . . . .
Figure 3-13. Parameter Name and Value in Source Examine Window . . . . . . . . . . . . . . . .
Figure 3-14. The Main Window . . . . . . . . . . . . . . . . . . . . . . . . . . . . . . . . . . . . . . . . . . . . . .
Figure 3-15. Window/Pane Control Icons . . . . . . . . . . . . . . . . . . . . . . . . . . . . . . . . . . . . . . .
Figure 3-16. zooming in on Workspace Pane . . . . . . . . . . . . . . . . . . . . . . . . . . . . . . . . . . . .
Figure 3-17. Panes Rearranged in Main Window . . . . . . . . . . . . . . . . . . . . . . . . . . . . . . . . .
Figure 4-1. Create Project Dialog - Project Lab . . . . . . . . . . . . . . . . . . . . . . . . . . . . . . . . . .
Figure 4-2. Adding New Items to a Project . . . . . . . . . . . . . . . . . . . . . . . . . . . . . . . . . . . . . .
Figure 4-3. Add file to Project Dialog . . . . . . . . . . . . . . . . . . . . . . . . . . . . . . . . . . . . . . . . . .
Figure 4-4. Newly Added Project Files Display a “?” for Status . . . . . . . . . . . . . . . . . . . . .
Figure 4-5. Compile Order Dialog. . . . . . . . . . . . . . . . . . . . . . . . . . . . . . . . . . . . . . . . . . . . .
Figure 4-6. Library Tab with Expanded Library . . . . . . . . . . . . . . . . . . . . . . . . . . . . . . . . . .
Figure 4-7. Structure Tab for a Loaded Design . . . . . . . . . . . . . . . . . . . . . . . . . . . . . . . . . . .
Figure 4-8. Adding New Folder to Project . . . . . . . . . . . . . . . . . . . . . . . . . . . . . . . . . . . . . .
Figure 4-9. A Folder Within a Project . . . . . . . . . . . . . . . . . . . . . . . . . . . . . . . . . . . . . . . . . .
Figure 4-10. Creating Subfolder . . . . . . . . . . . . . . . . . . . . . . . . . . . . . . . . . . . . . . . . . . . . . .
Figure 4-11. A folder with a Sub-folder . . . . . . . . . . . . . . . . . . . . . . . . . . . . . . . . . . . . . . . .
Figure 4-12. Changing File Location via the Project Compiler Settings Dialog. . . . . . . . . .
Figure 4-13. Simulation Configuration Dialog . . . . . . . . . . . . . . . . . . . . . . . . . . . . . . . . . . .
Figure 4-14. A Simulation Configuration in the Project Tab . . . . . . . . . . . . . . . . . . . . . . . .
Figure 4-15. Transcript Shows Options for Simulation Configurations . . . . . . . . . . . . . . . .
Figure 5-1. Creating New Resource Library . . . . . . . . . . . . . . . . . . . . . . . . . . . . . . . . . . . . .
Figure 5-2. Compiling into the Resource Library . . . . . . . . . . . . . . . . . . . . . . . . . . . . . . . . .
Figure 5-3. VHDL Simulation Warning Reported in Main Window . . . . . . . . . . . . . . . . . .
Figure 5-4. Specifying a Search Library in the Simulate Dialog. . . . . . . . . . . . . . . . . . . . . .
Figure 5-5. Mapping to the parts_lib Library . . . . . . . . . . . . . . . . . . . . . . . . . . . . . . . . . . . .
7
18
19
20
23
24
25
26
26
27
28
29
30
31
31
32
32
33
34
35
36
40
41
41
42
43
44
45
46
46
46
47
47
49
50
50
54
55
57
58
59
ModelSim SE Tutorial, v6.3a
June 2007
List of Figures
Figure 5-6. Adding LIBRARY and USE Statements to the Testbench. . . . . . . . . . . . . . . . .
Figure 6-1. SystemC Code Before and After Modifications . . . . . . . . . . . . . . . . . . . . . . . . .
Figure 6-2. Editing the SystemC Header File.. . . . . . . . . . . . . . . . . . . . . . . . . . . . . . . . . . . .
Figure 6-3. The ringbuf.h File.. . . . . . . . . . . . . . . . . . . . . . . . . . . . . . . . . . . . . . . . . . . . . . . .
Figure 6-4. The test_ringbuf.cpp File . . . . . . . . . . . . . . . . . . . . . . . . . . . . . . . . . . . . . . . . . .
Figure 6-5. The test_ringbuf Design . . . . . . . . . . . . . . . . . . . . . . . . . . . . . . . . . . . . . . . . . . .
Figure 6-6. SystemC Objects in the work Library. . . . . . . . . . . . . . . . . . . . . . . . . . . . . . . . .
Figure 6-7. SystemC Objects in the sim Tab of the Workspace . . . . . . . . . . . . . . . . . . . . . .
Figure 6-8. Active Breakpoint in a SystemC File . . . . . . . . . . . . . . . . . . . . . . . . . . . . . . . . .
Figure 6-9. Simulation Stopped at Breakpoint . . . . . . . . . . . . . . . . . . . . . . . . . . . . . . . . . . .
Figure 6-10. Stepping into a Separate File. . . . . . . . . . . . . . . . . . . . . . . . . . . . . . . . . . . . . . .
Figure 6-11. Output of show Command . . . . . . . . . . . . . . . . . . . . . . . . . . . . . . . . . . . . . . . .
Figure 6-12. SystemC Primitive Channels in the Wave Window . . . . . . . . . . . . . . . . . . . . .
Figure 7-1. Panes of the Wave Window . . . . . . . . . . . . . . . . . . . . . . . . . . . . . . . . . . . . . . . .
Figure 7-2. Undocking the Wave Window . . . . . . . . . . . . . . . . . . . . . . . . . . . . . . . . . . . . . .
Figure 7-3. Zooming in with the Mouse Pointer . . . . . . . . . . . . . . . . . . . . . . . . . . . . . . . . . .
Figure 7-4. Working with a Single Cursor in the Wave Window . . . . . . . . . . . . . . . . . . . . .
Figure 7-5. Renaming a Cursor . . . . . . . . . . . . . . . . . . . . . . . . . . . . . . . . . . . . . . . . . . . . . . .
Figure 7-6. Interval Measurement Between Two Cursors. . . . . . . . . . . . . . . . . . . . . . . . . . .
Figure 7-7. A Locked Cursor in the Wave Window . . . . . . . . . . . . . . . . . . . . . . . . . . . . . . .
Figure 8-1. Initiating the Create Pattern Wizard from the Objects Pane . . . . . . . . . . . . . . . .
Figure 8-2. Create Pattern Wizard . . . . . . . . . . . . . . . . . . . . . . . . . . . . . . . . . . . . . . . . . . . . .
Figure 8-3. Specifying Clock Pattern Attributes . . . . . . . . . . . . . . . . . . . . . . . . . . . . . . . . . .
Figure 8-4. The clk Waveform. . . . . . . . . . . . . . . . . . . . . . . . . . . . . . . . . . . . . . . . . . . . . . . .
Figure 8-5. The reset Waveform . . . . . . . . . . . . . . . . . . . . . . . . . . . . . . . . . . . . . . . . . . . . . .
Figure 8-6. Edit Insert Pulse Dialog . . . . . . . . . . . . . . . . . . . . . . . . . . . . . . . . . . . . . . . . . . .
Figure 8-7. Signal reset with an Inserted Pulse . . . . . . . . . . . . . . . . . . . . . . . . . . . . . . . . . . .
Figure 8-8. Edit Stretch Edge Dialog. . . . . . . . . . . . . . . . . . . . . . . . . . . . . . . . . . . . . . . . . . .
Figure 8-9. Stretching an Edge on the clk Signal. . . . . . . . . . . . . . . . . . . . . . . . . . . . . . . . . .
Figure 8-10. Deleting an Edge on the clk Signal . . . . . . . . . . . . . . . . . . . . . . . . . . . . . . . . . .
Figure 8-11. The Export Waveform Dialog. . . . . . . . . . . . . . . . . . . . . . . . . . . . . . . . . . . . . .
Figure 8-12. The counter Waveform Reacts to Stimulus Patterns. . . . . . . . . . . . . . . . . . . . .
Figure 8-13. The export Testbench Compiled into the work Library . . . . . . . . . . . . . . . . . .
Figure 8-14. Waves from Newly Created Testbench. . . . . . . . . . . . . . . . . . . . . . . . . . . . . . .
Figure 8-15. EVCD File Loaded in Wave Window . . . . . . . . . . . . . . . . . . . . . . . . . . . . . . .
Figure 8-16. Simulation results with EVCD File . . . . . . . . . . . . . . . . . . . . . . . . . . . . . . . . .
Figure 9-1. A Signal in the Dataflow Window . . . . . . . . . . . . . . . . . . . . . . . . . . . . . . . . . . .
Figure 9-2. Expanding the View to Display Connected Processes . . . . . . . . . . . . . . . . . . . .
Figure 9-3. The test Net Expanded to Show All Drivers. . . . . . . . . . . . . . . . . . . . . . . . . . . .
Figure 9-4. The embedded wave viewer pane . . . . . . . . . . . . . . . . . . . . . . . . . . . . . . . . . . . .
Figure 9-5. Signals Added to the Wave Viewer Automatically . . . . . . . . . . . . . . . . . . . . . .
Figure 9-6. Cursor in Wave Viewer Marks Last Event . . . . . . . . . . . . . . . . . . . . . . . . . . . . .
Figure 9-7. Tracing the Event Set . . . . . . . . . . . . . . . . . . . . . . . . . . . . . . . . . . . . . . . . . . . . .
Figure 9-8. A Signal with Unknown Values . . . . . . . . . . . . . . . . . . . . . . . . . . . . . . . . . . . . .
Figure 9-9. ChaseX Identifies Cause of Unknown on t_out . . . . . . . . . . . . . . . . . . . . . . . . .
8
60
66
67
70
70
72
73
73
74
75
76
77
78
79
81
82
83
84
85
85
89
89
90
90
91
91
92
92
93
93
95
96
97
98
99
99
103
103
104
105
106
107
107
108
109
ModelSim SE Tutorial, v6.3a
June 2007
List of Figures
Figure 9-10. Displaying Hierarchy in the Dataflow Window . . . . . . . . . . . . . . . . . . . . . . . .
Figure 10-1. Viewing the Memories Tab in the Main Window Workspace . . . . . . . . . . . . .
Figure 10-2. The mem Tab in the MDI Frame Shows Addresses and Data . . . . . . . . . . . . .
Figure 10-3. The Memory Display Updates with the Simulation . . . . . . . . . . . . . . . . . . . . .
Figure 10-4. Changing the Address Radix. . . . . . . . . . . . . . . . . . . . . . . . . . . . . . . . . . . . . . .
Figure 10-5. New Address Radix and Line Length . . . . . . . . . . . . . . . . . . . . . . . . . . . . . . . .
Figure 10-6. Goto Dialog. . . . . . . . . . . . . . . . . . . . . . . . . . . . . . . . . . . . . . . . . . . . . . . . . . . .
Figure 10-7. Editing the Address Directly. . . . . . . . . . . . . . . . . . . . . . . . . . . . . . . . . . . . . . .
Figure 10-8. Searching for a Specific Data Value . . . . . . . . . . . . . . . . . . . . . . . . . . . . . . . . .
Figure 10-9. Export Memory Dialog . . . . . . . . . . . . . . . . . . . . . . . . . . . . . . . . . . . . . . . . . . .
Figure 10-10. Import Memory Dialog . . . . . . . . . . . . . . . . . . . . . . . . . . . . . . . . . . . . . . . . . .
Figure 10-11. Initialized Memory from File and Fill Pattern . . . . . . . . . . . . . . . . . . . . . . . .
Figure 10-12. Data Increments Starting at Address 251 . . . . . . . . . . . . . . . . . . . . . . . . . . . .
Figure 10-13. Original Memory Content . . . . . . . . . . . . . . . . . . . . . . . . . . . . . . . . . . . . . . . .
Figure 10-14. Changing Memory Content for a Range of Addresses . . . . . . . . . . . . . . . . . .
Figure 10-15. Random Content Generated for a Range of Addresses. . . . . . . . . . . . . . . . . .
Figure 10-16. Changing Memory Contents by Highlighting. . . . . . . . . . . . . . . . . . . . . . . . .
Figure 10-17. Entering Data to Change . . . . . . . . . . . . . . . . . . . . . . . . . . . . . . . . . . . . . . . . .
Figure 10-18. Changed Memory Contents for the Specified Addresses . . . . . . . . . . . . . . . .
Figure 11-1. Sampling Reported in the Transcript . . . . . . . . . . . . . . . . . . . . . . . . . . . . . . . .
Figure 11-2. The Profile Window . . . . . . . . . . . . . . . . . . . . . . . . . . . . . . . . . . . . . . . . . . . . .
Figure 11-3. Expand the Hierarchical Function Call Tree. . . . . . . . . . . . . . . . . . . . . . . . . . .
Figure 11-4. The Source Window Showing a Line from the Profile Data . . . . . . . . . . . . . .
Figure 11-5. Profile Details of the Function Tcl_Close. . . . . . . . . . . . . . . . . . . . . . . . . . . . .
Figure 11-6. Profile Details of Function sm_0. . . . . . . . . . . . . . . . . . . . . . . . . . . . . . . . . . . .
Figure 11-7. The Profiler Toolbar . . . . . . . . . . . . . . . . . . . . . . . . . . . . . . . . . . . . . . . . . . . . .
Figure 11-8. The Filtered Profile Data. . . . . . . . . . . . . . . . . . . . . . . . . . . . . . . . . . . . . . . . . .
Figure 11-9. The Profile Report Dialog. . . . . . . . . . . . . . . . . . . . . . . . . . . . . . . . . . . . . . . . .
Figure 11-10. The calltree.rpt Report . . . . . . . . . . . . . . . . . . . . . . . . . . . . . . . . . . . . . . . . . .
Figure 12-1. Enable Code Coverage . . . . . . . . . . . . . . . . . . . . . . . . . . . . . . . . . . . . . . . . . . .
Figure 12-2. Code Coverage Columns in the Main Window Workspace . . . . . . . . . . . . . . .
Figure 12-3. Missed Coverage Pane . . . . . . . . . . . . . . . . . . . . . . . . . . . . . . . . . . . . . . . . . . .
Figure 12-4. Instance Coverage Pane . . . . . . . . . . . . . . . . . . . . . . . . . . . . . . . . . . . . . . . . . .
Figure 12-5. Details Pane. . . . . . . . . . . . . . . . . . . . . . . . . . . . . . . . . . . . . . . . . . . . . . . . . . . .
Figure 12-6. Current Exclusions Pane . . . . . . . . . . . . . . . . . . . . . . . . . . . . . . . . . . . . . . . . . .
Figure 12-7. Right-click a Column Heading to Hide or Show Columns. . . . . . . . . . . . . . . .
Figure 12-8. Coverage Statistics in the Source Window . . . . . . . . . . . . . . . . . . . . . . . . . . . .
Figure 12-9. Coverage Numbers Shown by Hovering the Mouse Pointer . . . . . . . . . . . . . .
Figure 12-10. Toggle Coverage in the Objects Pane . . . . . . . . . . . . . . . . . . . . . . . . . . . . . . .
Figure 12-11. Excluding a File Using Menus in the Workspace. . . . . . . . . . . . . . . . . . . . . .
Figure 12-12. Coverage Report Dialog . . . . . . . . . . . . . . . . . . . . . . . . . . . . . . . . . . . . . . . . .
Figure 13-1. First dialog of the Waveform Comparison Wizard. . . . . . . . . . . . . . . . . . . . . .
Figure 13-2. Second dialog of the Waveform Comparison Wizard . . . . . . . . . . . . . . . . . . .
Figure 13-3. Comparison information in the Workspace and Objects panes . . . . . . . . . . . .
Figure 13-4. Comparison objects in the Wave window. . . . . . . . . . . . . . . . . . . . . . . . . . . . .
ModelSim SE Tutorial, v6.3a
June 2007
110
115
115
116
117
117
118
119
119
120
122
123
124
125
125
126
126
127
127
131
131
133
134
134
135
135
136
136
137
140
141
141
142
142
143
144
145
146
147
148
150
156
156
157
158
9
List of Figures
Figure 13-5. The compare icons . . . . . . . . . . . . . . . . . . . . . . . . . . . . . . . . . . . . . . . . . . . . . .
Figure 13-6. Compare differences in the List window . . . . . . . . . . . . . . . . . . . . . . . . . . . . .
Figure 13-7. Coverage data saved to a text file . . . . . . . . . . . . . . . . . . . . . . . . . . . . . . . . . . .
Figure 13-8. Displaying Log Files in the Open dialog . . . . . . . . . . . . . . . . . . . . . . . . . . . . .
Figure 13-9. Reloading saved comparison data. . . . . . . . . . . . . . . . . . . . . . . . . . . . . . . . . . .
Figure 14-1. A Dataset in the Main Window Workspace . . . . . . . . . . . . . . . . . . . . . . . . . . .
Figure 14-2. Buttons Added to the Main Window Toolbar. . . . . . . . . . . . . . . . . . . . . . . . . .
10
158
159
160
161
161
166
168
ModelSim SE Tutorial, v6.3a
June 2007
List of Tables
Table 1-1. Documentation List . . . . . . . . . . . . . . . . . . . . . . . . . . . . . . . . . . . . . . . . . . . . . . . 13
Table 3-1. The Main Window . . . . . . . . . . . . . . . . . . . . . . . . . . . . . . . . . . . . . . . . . . . . . . . . 33
Table 6-1. Supported Operating Systems for SystemC . . . . . . . . . . . . . . . . . . . . . . . . . . . . 64
Table 11-1. Columns in the Profile Window . . . . . . . . . . . . . . . . . . . . . . . . . . . . . . . . . . . . 132
Table 12-1. Coverage Icons in the Source Window . . . . . . . . . . . . . . . . . . . . . . . . . . . . . . . 145
ModelSim SE Tutorial, v6.3a
June 2007
11
List of Tables
12
ModelSim SE Tutorial, v6.3a
June 2007
Chapter 1
Introduction
Assumptions
We assume that you are familiar with the use of your operating system. You should also be
familiar with the window management functions of your graphic interface: OpenWindows,
OSF/Motif, CDE, KDE, GNOME, or Microsoft Windows 2000/XP.
We also assume that you have a working knowledge of the language in which your design
and/or testbench is written (i.e., VHDL, Verilog, SystemC, etc.). Although ModelSim™ is an
excellent tool to use while learning HDL concepts and practices, this document is not written to
support that goal.
Where to Find Our Documentation
ModelSim documentation is available from our website at
www.model.com/support
or from the tool by selecting Help :
Table 1-1. Documentation List
Document
Format
How to get it
Installation & Licensing
Guide
PDF
Help > PDF Bookcase
HTML and PDF
Help > InfoHub
Quick Guide
(command and feature
quick-reference)
PDF
Help > PDF Bookcase
and
Help > InfoHub
Tutorial
PDF
Help > PDF Bookcase
HTML and PDF
Help > InfoHub
PDF
Help > PDF Bookcase
HTML and PDF
Help > InfoHub
PDF
Help > PDF Bookcase
HTML and PDF
Help > InfoHub
PDF
Help > PDF Bookcase
HTML
Help > InfoHub
User’s Manual
Reference Manual
Foreign Language
Interface Manual
ModelSim SE Tutorial, v6.3a
June 2007
13
Introduction
Technical Support and Updates
Table 1-1. Documentation List
Document
Format
How to get it
Std_DevelopersKit User’s
Manual
PDF
www.model.com/support/documentation/BOO
K/sdk_um.pdf
The Standard Developer’s Kit is for use with
Mentor Graphics QuickHDL.
Command Help
ASCII
type help [command name] at the prompt in
the Transcript pane
Error message help
ASCII
type verror <msgNum> at the Transcript or
shell prompt
Tcl Man Pages (Tcl
manual)
HTML
select Help > Tcl Man Pages, or find
contents.htm in \modeltech\docs\tcl_help_html
Technotes
HTML
available from the support site
Download a Free PDF Reader With Search
ModelSim PDF documentation requires an Adobe Acrobat Reader for viewing. The Reader is
available without cost from Adobe at
www.adobe.com.
Technical Support and Updates
Support
Online and email technical support options, maintenance renewal, and links to international
support contacts:
www.model.com/support/default.asp
Updates
Access to the most current version of ModelSim:
www.model.com/downloads/default.asp
Latest Version Email
Place your name on our list for email notification of news and updates:
ww.model.com/products/informant.asp
14
ModelSim SE Tutorial, v6.3a
June 2007
Introduction
Before you Begin
Before you Begin
Preparation for some of the lessons leaves certain details up to you. You will decide the best
way to create directories, copy files, and execute programs within your operating system.
(When you are operating the simulator within ModelSim’s GUI, the interface is consistent for
all platforms.)
Examples show Windows path separators - use separators appropriate for your operating system
when trying the examples.
Example Designs
ModelSim comes with Verilog and VHDL versions of the designs used in these lessons. This
allows you to do the tutorial regardless of which license type you have. Though we have tried to
minimize the differences between the Verilog and VHDL versions, we could not do so in all
cases. In cases where the designs differ (e.g., line numbers or syntax), you will find languagespecific instructions. Follow the instructions that are appropriate for the language you use.
ModelSim SE Tutorial, v6.3a
June 2007
15
Introduction
Before you Begin
16
ModelSim SE Tutorial, v6.3a
June 2007
Chapter 2
Conceptual Overview
Introduction
ModelSim is a verification and simulation tool for VHDL, Verilog, SystemVerilog, SystemC,
and mixed-language designs.
This lesson provides a brief conceptual overview of the ModelSim simulation environment. It is
divided into five topics, which you will learn more about in subsequent lessons.
•
Design Optimizations — Refer to the Optimizing Designs with vopt chapter in the
User’s Manual.
•
Basic simulation flow — Refer to Chapter 3 Basic Simulation.
•
Project flow — Refer to Chapter 4 Projects.
•
Multiple library flow — Refer to Chapter 5 Working With Multiple Libraries.
•
Debugging tools — Refer to remaining lessons.
Design Optimizations
Before discussing the basic simulation flow, it is important to understand design optimization.
By default, ModelSim optimizations are automatically performed on all designs. These
optimizations are designed to maximize simulator performance, yielding improvements up to
10X, in some Verilog designs, over non-optimized runs.
Global optimizations, however, may have an impact on the visibility of the design simulation
results you can view – certain signals and processes may not be visible. If these signals and
processes are important for debugging the design, it may be necessary to customize the
simulation by removing optimizations from specific modules.
It is important, therefore, to make an informed decision as to how best to apply optimizations to
your design. The tool that performs global optimizations in ModelSim is called vopt. Please
refer to the Optimizing Designs with vopt chapter in the ModelSim User’s Manual for a
complete discussion of optimization trade-offs and customizations. For details on command
syntax and usage, please refer to vopt in the Reference Manual.
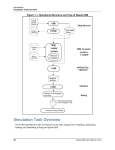
Basic Simulation Flow
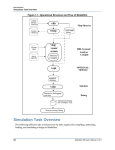
The following diagram shows the basic steps for simulating a design in ModelSim.
ModelSim SE Tutorial, v6.3a
June 2007
17
Conceptual Overview
Basic Simulation Flow
Figure 2-1. Basic Simulation Flow - Overview Lab
Create a working library
Compile design files
Load and Run simulation
Debug results
•
Creating the Working Library
In ModelSim, all designs are compiled into a library. You typically start a new
simulation in ModelSim by creating a working library called "work". "Work" is the
library name used by the compiler as the default destination for compiled design units.
•
Compiling Your Design
After creating the working library, you compile your design units into it. The ModelSim
library format is compatible across all supported platforms. You can simulate your
design on any platform without having to recompile your design.
•
Loading the Simulator with Your Design and Running the Simulation
With the design compiled, you load the simulator with your design by invoking the
simulator on a top-level module (Verilog) or a configuration or entity/architecture pair
(VHDL).
Assuming the design loads successfully, the simulation time is set to zero, and you enter
a run command to begin simulation.
•
Debugging Your Results
If you don’t get the results you expect, you can use ModelSim’s robust debugging
environment to track down the cause of the problem.
18
ModelSim SE Tutorial, v6.3a
June 2007
Conceptual Overview
Project Flow
Project Flow
A project is a collection mechanism for an HDL design under specification or test. Even though
you don’t have to use projects in ModelSim, they may ease interaction with the tool and are
useful for organizing files and specifying simulation settings.
The following diagram shows the basic steps for simulating a design within a ModelSim
project.
Figure 2-2. Project Flow
Create a project
Add files to the project
Compile design files
Run simulation
Debug results
As you can see, the flow is similar to the basic simulation flow. However, there are two
important differences:
•
You do not have to create a working library in the project flow; it is done for you
automatically.
•
Projects are persistent. In other words, they will open every time you invoke ModelSim
unless you specifically close them.
ModelSim SE Tutorial, v6.3a
June 2007
19
Conceptual Overview
Multiple Library Flow
Multiple Library Flow
ModelSim uses libraries in two ways: 1) as a local working library that contains the compiled
version of your design; 2) as a resource library. The contents of your working library will
change as you update your design and recompile. A resource library is typically static and
serves as a parts source for your design. You can create your own resource libraries, or they
may be supplied by another design team or a third party (e.g., a silicon vendor).
You specify which resource libraries will be used when the design is compiled, and there are
rules to specify in which order they are searched. A common example of using both a working
library and a resource library is one where your gate-level design and testbench are compiled
into the working library, and the design references gate-level models in a separate resource
library.
The diagram below shows the basic steps for simulating with multiple libraries.
Figure 2-3. Multiple Library Flow
Create a working library
Compile design files
Link to resource libraries
Run simulation
Debug results
You can also link to resource libraries from within a project. If you are using a project, you
would replace the first step above with these two steps: create the project and add the testbench
to the project.
20
ModelSim SE Tutorial, v6.3a
June 2007
Conceptual Overview
Debugging Tools
Debugging Tools
ModelSim offers numerous tools for debugging and analyzing your design. Several of these
tools are covered in subsequent lessons, including:
•
Using projects
•
Working with multiple libraries
•
Simulating with SystemC
•
Setting breakpoints and stepping through the source code
•
Viewing waveforms and measuring time
•
Exploring the "physical" connectivity of your design
•
Viewing and initializing memories
•
Creating stimulus with the Waveform Editor
•
Analyzing simulation performance
•
Testing code coverage
•
Comparing waveforms
•
Automating simulation
ModelSim SE Tutorial, v6.3a
June 2007
21
Conceptual Overview
Debugging Tools
22
ModelSim SE Tutorial, v6.3a
June 2007
Chapter 3
Basic Simulation
Introduction
In this lesson you will go step-by-step through the basic simulation flow:
Figure 3-1. Basic Simulation Flow - Simulation Lab
Create a working library
Compile design units
Run simulation
Debug results
Design Files for this Lesson
The sample design for this lesson is a simple 8-bit, binary up-counter with an associated
testbench. The pathnames are as follows:
Verilog – <install_dir>/examples/tutorials/verilog/basicSimulation/counter.v and tcounter.v
VHDL – <install_dir>/examples/tutorials/vhdl/basicSimulation/counter.vhd and tcounter.vhd
This lesson uses the Verilog files counter.v and tcounter.v. If you have a VHDL license, use
counter.vhd and tcounter.vhd instead. Or, if you have a mixed license, feel free to use the
Verilog testbench with the VHDL counter or vice versa.
Related Reading
User’s Manual Chapters: Design Libraries, Verilog and SystemVerilog Simulation, and VHDL
Simulation.
Reference Manual commands: vlib, vmap, vlog, vcom, vopt, view, and run.
ModelSim SE Tutorial, v6.3a
June 2007
23
Basic Simulation
Create the Working Design Library
Create the Working Design Library
Before you can simulate a design, you must first create a library and compile the source code
into that library.
1. Create a new directory and copy the design files for this lesson into it.
Start by creating a new directory for this exercise (in case other users will be working
with these lessons).
Verilog: Copy counter.v and tcounter.v files from
/<install_dir>/examples/tutorials/verilog/basicSimulation to the new directory.
VHDL: Copy counter.vhd and tcounter.vhd files from
/<install_dir>/examples/tutorials/vhdl/basicSimulation to the new directory.
2. Start ModelSim if necessary.
a. Type vsim at a UNIX shell prompt or use the ModelSim icon in Windows.
Upon opening ModelSim for the first time, you will see the Welcome to ModelSim
dialog. Click Close.
b. Select File > Change Directory and change to the directory you created in step 1.
3. Create the working library.
a. Select File > New > Library.
This opens a dialog where you specify physical and logical names for the library
(Figure 3-2). You can create a new library or map to an existing library. We’ll be
doing the former.
Figure 3-2. The Create a New Library Dialog
b. Type work in the Library Name field (if it isn’t already entered automatically).
24
ModelSim SE Tutorial, v6.3a
June 2007
Basic Simulation
Create the Working Design Library
c. Click OK.
ModelSim creates a directory called work and writes a specially-formatted file
named _info into that directory. The _info file must remain in the directory to
distinguish it as a ModelSim library. Do not edit the folder contents from your
operating system; all changes should be made from within ModelSim.
ModelSim also adds the library to the list in the Workspace (Figure 3-3) and records
the library mapping for future reference in the ModelSim initialization file
(modelsim.ini).
Figure 3-3. work Library in the Workspace
When you pressed OK in step 3c above, the following was printed to the Transcript:
vlib work
vmap work work
These two lines are the command-line equivalents of the menu selections you made. Many
command-line equivalents will echo their menu-driven functions in this fashion.
Compile the Design
With the working library created, you are ready to compile your source files.
You can compile by using the menus and dialogs of the graphic interface, as in the Verilog
example below, or by entering a command at the ModelSim> prompt.
1. Compile counter.v and tcounter.v.
a. Select Compile > Compile. This opens the Compile Source Files dialog
(Figure 3-4).
If the Compile menu option is not available, you probably have a project open. If so,
close the project by making the Workspace pane active and selecting File > Close
from the menus.
ModelSim SE Tutorial, v6.3a
June 2007
25
Basic Simulation
Create the Working Design Library
b. Select both counter.v and tcounter.v modules from the Compile Source Files dialog
and click Compile. The files are compiled into the work library.
c. When compile is finished, click Done.
Figure 3-4. Compile Source Files Dialog
2. View the compiled design units.
a. On the Library tab, click the ’+’ icon next to the work library and you will see two
design units (Figure 3-5). You can also see their types (Modules, Entities, etc.) and
the path to the underlying source files (scroll to the right if necessary).
Figure 3-5. Verilog Modules Compiled into work Library
Load the Design
1. Load the test_counter module into the simulator.
a. Enter the following command at the ModelSim> prompt in the Transcript window:
vsim -voptargs="+acc" test_counter
26
ModelSim SE Tutorial, v6.3a
June 2007
Basic Simulation
Run the Simulation
The -voptargs=”+acc” argument for the vsim command provides visibility into the
design for debugging purposes.
Note
By default, ModelSim optimizations are performed on all designs (see Optimizing
Designs with vopt).
When the design is loaded, you will see a new tab in the Workspace named sim that
displays the hierarchical structure of the design (Figure 3-6). You can navigate
within the hierarchy by clicking on any line with a ’+’ (expand) or ’-’ (contract)
icon. You will also see a tab named Files that displays all files included in the
design.
Figure 3-6. Workspace and Objects Panes Showing a Verilog Design
The Objects pane opens, by default, when a design is loaded. The Objects pane
shows the names and current values of data objects in the current region (selected in
the Workspace). Data objects include signals, nets, registers, constants and variables
not declared in a process, generics, parameters, and member data variables of a
SystemC module.
You may open other windows and panes with the View menu. See Navigating the
Interface.
Run the Simulation
Now you will open the Wave window, add signals to it, then run the simulation.
1. Open the Wave debugging window.
a. Enter view wave at the command line.
You can also use the View > Wave menu selection to open a Wave window.
The Wave window is one of several windows available for debugging. To see a list
of the other debuggin windows, select the View menu. You may need to move or
ModelSim SE Tutorial, v6.3a
June 2007
27
Basic Simulation
Run the Simulation
resize the windows to your liking. Window panes within the Main window can be
zoomed to occupy the entire Main window or undocked to stand alone. For details,
see Navigating the Interface.
2. Add signals to the Wave window.
a. In the Workspace pane, select the sim tab.
b. Right-click test_counter to open a popup context menu.
c. Select Add > Add All Signals to Wave (Figure 3-7).
All signals in the design are added to the Wave window.
Figure 3-7. Using the Popup Menu to Add Signals to Wave Window
3. Run the simulation.
a. Click the Run icon in the Main or Wave window toolbar.
The simulation runs for 100 ns (the default simulation length) and waves are
drawn in the Wave window.
b. Enter run 500 at the VSIM> prompt in the Main window.
The simulation advances another 500 ns for a total of 600 ns (Figure 3-8).
28
ModelSim SE Tutorial, v6.3a
June 2007
Basic Simulation
Set Breakpoints and Step through the Source
Figure 3-8. Waves Drawn in Wave Window
c. Click the Run -All icon on the Main or Wave window toolbar.
The simulation continues running until you execute a break command or it
hits a statement in your code (e.g., a Verilog $stop statement) that halts the
simulation.
d. Click the Break icon.
The simulation stops running.
Set Breakpoints and Step through the Source
Next you will take a brief look at one interactive debugging feature of the ModelSim
environment. You will set a breakpoint in the Source window, run the simulation, and then step
through the design under test. Breakpoints can be set only on lines with red line numbers.
1. Open counter.v in the Source window.
a. Select the Files tab in the Main window Workspace.
b. Click the + sign next to the sim filename to see the contents of vsim.wlf.
c. Double-click counter.v to open it in the Source window.
2. Set a breakpoint on line 36 of counter.v (or, line 36 of counter.vhd if you are simulating
the VHDL files).
a. Scroll to line 36 and click in the BP (breakpoint) column next to the line number.
ModelSim SE Tutorial, v6.3a
June 2007
29
Basic Simulation
Set Breakpoints and Step through the Source
A red ball appears in the BP column at line number 36 (Figure 3-9), indicating that a
breakpoint has been set.
Figure 3-9. Setting Breakpoint in Source Window
3. Disable, enable, and delete the breakpoint.
a. Click the red ball to disable the breakpoint. It will become a black ball.
b. Click the black ball again to re-enable the breakpoint. It will become a red ball.
c. Click the red ball with your right mouse button and select Remove Breakpoint 36.
d. Click in the BP column next to line number 36 again to re-create the breakpoint.
4. Restart the simulation.
a. Click the Restart icon to reload the design elements and reset the simulation
time to zero.
The Restart dialog that appears gives you options on what to retain during
the restart (Figure 3-10).
30
ModelSim SE Tutorial, v6.3a
June 2007
Basic Simulation
Set Breakpoints and Step through the Source
Figure 3-10. Setting Restart Functions
b. Click the Restart button in the Restart dialog.
c. Click the Run -All icon.
The simulation runs until the breakpoint is hit. When the simulation hits the
breakpoint, it stops running, highlights the line with a blue arrow in the
Source view (Figure 3-11), and issues a Break message in the Transcript pane.
Figure 3-11. Blue Arrow Indicates Where Simulation Stopped.
When a breakpoint is reached, typically you want to know one or more signal
values. You have several options for checking values:
•
look at the values shown in the Objects window (Figure 3-12).
ModelSim SE Tutorial, v6.3a
June 2007
31
Basic Simulation
Navigating the Interface
Figure 3-12. Values Shown in Objects Window
•
set your mouse pointer over a variable in the Source window and a yellow box
will appear with the variable name and the value of that variable at the time of
the selected cursor in the Wave window
•
highlight a signal, parameter, or variable in the Source window, right-click it,
and select Examine from the pop-up menu to display the variable and its current
value in a Source Examine window (Figure 3-13)
Figure 3-13. Parameter Name and Value in Source Examine Window
•
use the examine command at the VSIM> prompt to output a variable value to
the Main window Transcript (i.e., examine count)
5. Try out the step commands.
a. Click the Step icon on the Main window toolbar.
This single-steps the debugger.
Experiment on your own. Set and clear breakpoints and use the Step, Step Over, and
Continue Run commands until you feel comfortable with their operation.
Navigating the Interface
The Main window is composed of a number of "panes" and sub-windows that display various
types of information about your design, simulation, or debugging session. You can also access
other tools from the Main window that display in stand-alone windows (e.g., the Dataflow
window).
32
ModelSim SE Tutorial, v6.3a
June 2007
Basic Simulation
Navigating the Interface
Figure 3-14. The Main Window
MDI frame
Workspace
Transcript
The following table describes some of the key elements of the Main window.
Table 3-1. The Main Window
Window/pane
Description
Workspace
This pane comprises multiple tabs that contain
various sorts of information about the current
project or design. Once a design is loaded,
additional tabs will appear. Refer to the
section Workspace in the User’s Manual for
more information.
Transcript
The Transcript pane provides a command-line
interface and serves as an activity log
including status and error messages. Refer to
the section Transcript Window in the User’s
Manual for more information.
ModelSim SE Tutorial, v6.3a
June 2007
33
Basic Simulation
Navigating the Interface
Table 3-1. The Main Window
Window/pane
Description
MDI frame
The Multiple Document Interface (MDI)
frame holds windows for which there can be
multiple instances. These include Source
editor windows, Wave windows, and Memory
content windows. Refer to the section
Multiple Document Interface (MDI) Frame in
the User’s Manual for more information.
Here are a few important points to keep in mind about the ModelSim interface:
•
Windows/panes can be resized, moved, zoomed, undocked, etc. and the changes are
persistent.
You have a number of options for re-sizing, re-positioning, undocking/redocking, and
generally modifying the physical characteristics of windows and panes. When you exit
ModelSim, the current layout is saved so that it appears the same the next time you
invoke the tool. Refer to the Main Window section in the User’s Manual for more
information.
•
Menus are context sensitive.
The menu items that are available and how certain menu items behave depend on which
pane or window is active. For example, if the sim tab in the Workspace is active and you
choose Edit from the menu bar, the Clear command is disabled. However, if you click in
the Transcript pane and choose Edit, the Clear command is enabled. The active pane is
denoted by a blue title bar.
Let us try a few things.
1. Zoom and undock panes.
a. Click the Zoom/Unzoom icon in the upper right corner of the Workspace pane
(Figure 3-15).
Figure 3-15. Window/Pane Control Icons
The pane fills the entire Main window (Figure 3-16).
34
ModelSim SE Tutorial, v6.3a
June 2007
Basic Simulation
Navigating the Interface
Figure 3-16. zooming in on Workspace Pane
b. Click the Unzoom icon in the Workspace.
c. Click the Undock icon in the upper right corner of the Transcript pane.
The Transcript becomes a stand-alone window.
d. Click the Dock icon on the Transcript.
e. Click the Hide pane icon in the Workspace.
f. Select View > Workspace from the menus to re-open the Workspace.
2. Move and resize panes.
a. Hover your mouse pointer in the center of the Transcript title bar, where the two
parallel lines are interrupted by 3 lines of small dots. This is the handle for the pane.
When the cursor is over the pane handle it becomes a four-headed arrow.
b. Click and drag the Transcript up and to the right until you see a gray outline on the
right-hand side of the MDI frame.
When you let go of the mouse button, the Transcript is moved and the MDI frame
and Workspace panes shift to the left (Figure 3-17).
ModelSim SE Tutorial, v6.3a
June 2007
35
Basic Simulation
Navigating the Interface
Figure 3-17. Panes Rearranged in Main Window
c. Select Layout > Reset.
The layout returns to its original setting.
Tip: Moving panes can get confusing, and you may not always obtain the results you
expect. Practice moving a pane around, watching the gray outline to see what happens
when you drop it in various places. Your layout will be saved when you exit ModelSim
and will reappear when you next open ModelSim. (It’s a good idea to close all panes in
the MDI frame at the end of each lesson in this tutorial so only files relevant to each
lesson will be displayed.)
As you practice, notice that the MDI frame cannot be moved in the same manner as the
panes. It does not have a handle in its header bar.
Selecting Layout > Reset is the easiest way to rectify an undesired layout.
d. Hover your mouse pointer on the border between two panes so it becomes a doubleheaded arrow.
e. Click-and-drag left and right or up and down to resize the pane.
f. Select Layout > Reset.
3. Observe context sensitivity of menu commands.
a. Click anywhere in the Workspace.
b. Select the Edit menu and notice that the Clear command is disabled.
36
ModelSim SE Tutorial, v6.3a
June 2007
Basic Simulation
Navigating the Interface
c. Click in the Transcript and select Edit > Clear.
This command applies to the Transcript pane but not the Workspace pane.
d. Click on a design object in the sim tab of the Workspace and select File > Open.
e. Notice that the Open dialog filters to show Log files (*.wlf).
f. Now click on a filename in the Files tab of the Workspace and select File > Open.
Notice that the Open dialog filters to show HDL file types instead.
Lesson Wrap-Up
This concludes this lesson. Before continuing we need to end the current simulation.
1. Select Simulate > End Simulation.
2. Click Yes when prompted to confirm that you wish to quit simulating.
ModelSim SE Tutorial, v6.3a
June 2007
37
Basic Simulation
Navigating the Interface
38
ModelSim SE Tutorial, v6.3a
June 2007
Chapter 4
Projects
Introduction
In this lesson you will practice creating a project.
At a minimum, projects contain a work library and a session state that is stored in a .mpf file. A
project may also consist of:
•
HDL source files or references to source files
•
other files such as READMEs or other project documentation
•
local libraries
•
references to global libraries
Design Files for this Lesson
The sample design for this lesson is a simple 8-bit, binary up-counter with an associated
testbench. The pathnames are as follows:
Verilog – <install_dir>/examples/tutorials/verilog/projects/counter.v and tcounter.v
VHDL – <install_dir>/examples/tutorials/vhdl/projects/counter.vhd and tcounter.vhd
This lesson uses the Verilog files tcounter.v and counter.v. If you have a VHDL license, use
tcounter.vhd and counter.vhd instead.
Related Reading
User’s Manual Chapter: Projects.
Create a New Project
1. Create a new directory and copy the design files for this lesson into it.
Start by creating a new directory for this exercise (in case other users will be working
with these lessons).
Verilog: Copy counter.v and tcounter.v files from
/<install_dir>/examples/tutorials/verilog/projects to the new directory.
VHDL: Copy counter.vhd and tcounter.vhd files from
/<install_dir>/examples/tutorials/vhdl/projects to the new directory.
ModelSim SE Tutorial, v6.3a
June 2007
39
Projects
Create a New Project
2. If you just finished the previous lesson, ModelSim should already be running. If not,
start ModelSim.
a. Type vsim at a UNIX shell prompt or use the ModelSim icon in Windows.
b. Select File > Change Directory and change to the directory you created in step 1.
3. Create a new project.
a. Select File > New > Project (Main window) from the menu bar.
This opens the Create Project dialog where you can enter a Project Name, Project
Location (i.e., directory), and Default Library Name (Figure 4-1). You can also
reference library settings from a selected .ini file or copy them directly into the
project. The default library is where compiled design units will reside.
b. Type test in the Project Name field.
c. Click the Browse button for the Project Location field to select a directory where the
project file will be stored.
d. Leave the Default Library Name set to work.
e. Click OK.
Figure 4-1. Create Project Dialog - Project Lab
Add Objects to the Project
Once you click OK to accept the new project settings, you will see a blank Project tab in the
Workspace area of the Main window and the Add items to the Project dialog will appear
(Figure 4-2). From this dialog you can create a new design file, add an existing file, add a folder
for organization purposes, or create a simulation configuration (discussed below).
40
ModelSim SE Tutorial, v6.3a
June 2007
Projects
Create a New Project
Figure 4-2. Adding New Items to a Project
1. Add two existing files.
a. Click Add Existing File.
This opens the Add file to Project dialog (Figure 4-3). This dialog lets you browse to
find files, specify the file type, specify a folder to which the file will be added, and
identify whether to leave the file in its current location or to copy it to the project
directory.
Figure 4-3. Add file to Project Dialog
b. Click the Browse button for the File Name field. This opens the “Select files to add
to project” dialog and displays the contents of the current directory.
c. Verilog: Select counter.v and tcounter.v and click Open.
VHDL: Select counter.vhd and tcounter.vhd and click Open.
This closes the “Select files to add to project” dialog and displays the selected files
in the “Add file to Project” dialog (Figure 4-3).
d. Click OK to add the files to the project.
ModelSim SE Tutorial, v6.3a
June 2007
41
Projects
Create a New Project
e. Click Close to dismiss the Add items to the Project dialog.
You should now see two files listed in the Project tab of the Workspace pane
(Figure 4-4). Question mark icons (?) in the Status column indicate that the file has
not been compiled or that the source file has changed since the last successful
compile. The other columns identify file type (e.g., Verilog or VHDL), compilation
order, and modified date.
Figure 4-4. Newly Added Project Files Display a “?” for Status
Changing Compile Order (VHDL)
By default ModelSim performs default binding of VHDL designs when you load the design
with vsim. However, you can elect to perform default binding at compile time. (For details,
refer to the section Default Binding in the User’s Manual.) If you elect to do default binding at
compile, then the compile order is important. Follow these steps to change compilation order
within a project.
1. Change the compile order.
a. Select Compile > Compile Order.
This opens the Compile Order dialog box (Figure 4-5).
42
ModelSim SE Tutorial, v6.3a
June 2007
Projects
Create a New Project
Figure 4-5. Compile Order Dialog
move up / down buttons
b. Click the Auto Generate button.
ModelSim "determines" the compile order by making multiple passes over the files.
It starts compiling from the top; if a file fails to compile due to dependencies, it
moves that file to the bottom and then recompiles it after compiling the rest of the
files. It continues in this manner until all files compile successfully or until a file(s)
can’t be compiled for reasons other than dependency.
Alternatively, you can select a file and use the Move Up and Move Down buttons to
put the files in the correct order.
c. Click OK to close the Compile Order dialog.
Compile the Design
1. Compile the files.
a. Right-click anywhere in the Project tab and select Compile > Compile All from the
pop-up menu.
ModelSim compiles both files and changes the symbol in the Status column to a
green check mark. A check mark means the compile succeeded. If compile fails, the
symbol will be a red ’X’, and you will see an error message in the Transcript pane.
2. View the design units.
a. Click the Library tab in the workspace (Figure 4-6).
b. Click the "+" icon next to the work library.
You should see two compiled design units, their types (modules in this case), and the
path to the underlying source files.
ModelSim SE Tutorial, v6.3a
June 2007
43
Projects
Create a New Project
Figure 4-6. Library Tab with Expanded Library
Load the Design
1. Load the test_counter design unit.
a. Enter the following command at the ModelSim> prompt in the Transcript pane.
vsim -voptargs="+acc" test_counter
The -voptargs=”+acc” argument for the vsim command provides visibility into the
design for debugging purposes.
Note
By default, ModelSim optimizations are performed on all designs (see Optimizing
Designs with vopt).
You should see 3 new tabs in the Main window Workspace. The sim tab displays the
structure of the test_counter design unit (Figure 4-7). The Files tab contains
information about the underlying source files. The Memories tab lists all memories
in the design.
44
ModelSim SE Tutorial, v6.3a
June 2007
Projects
Organizing Projects with Folders
Figure 4-7. Structure Tab for a Loaded Design
At this point you would typically run the simulation and analyze or debug your
design like you did in the previous lesson. For now, you’ll continue working with
the project. However, first you need to end the simulation that started when you
loaded test_counter.
2. End the simulation.
a. Select Simulate > End Simulation.
b. Click Yes.
Organizing Projects with Folders
If you have a lot of files to add to a project, you may want to organize them in folders. You can
create folders either before or after adding your files. If you create a folder before adding files,
you can specify in which folder you want a file placed at the time you add the file (see Folder
field in Figure 4-3). If you create a folder after adding files, you edit the file properties to move
it to that folder.
Add Folders
As shown previously in Figure 4-2, the Add items to the Project dialog has an option for adding
folders. If you have already closed that dialog, you can use a menu command to add a folder.
1. Add a new folder.
a. Right-click inside the Projects tab of the Workspace and select Add to Project >
Folder.
b. Type Design Files in the Folder Name field (Figure 4-8).
ModelSim SE Tutorial, v6.3a
June 2007
45
Projects
Organizing Projects with Folders
Figure 4-8. Adding New Folder to Project
c. Click OK.
d. Select the Project tab to see the new folder (Figure 4-9).
Figure 4-9. A Folder Within a Project
2. Add a sub-folder.
a. Right-click anywhere in the Project tab and select Add to Project > Folder.
b. Type HDL in the Folder Name field (Figure 4-10).
Figure 4-10. Creating Subfolder
c. Click the Folder Location drop-down arrow and select Design Files.
d. Click OK.
A ’+’ icon appears next to the Design Files folder in the Project tab (Figure 4-11).
46
ModelSim SE Tutorial, v6.3a
June 2007
Projects
Organizing Projects with Folders
Figure 4-11. A folder with a Sub-folder
e. Click the ’+’ icon to see the HDL sub-folder.
Moving Files to Folders
If you don’t place files into a folder when you first add the files to the project, you can move
them into a folder using the properties dialog.
1. Move tcounter.v and counter.v to the HDL folder.
a. Select both counter.v and tcounter.v in the Project tab of the Workspace.
b. Right-click either file and select Properties.
This opens the Project Compiler Settings dialog (Figure 4-12), which allows you to
set a variety of options on your design files.
Figure 4-12. Changing File Location via the Project Compiler Settings Dialog
c. Click the Place In Folder drop-down arrow and select HDL.
d. Click OK.
ModelSim SE Tutorial, v6.3a
June 2007
47
Projects
Simulation Configurations
The selected files are moved into the HDL folder. Click the ’+’ icon next to the HDL
folder to see the files.
The files are now marked with a ’?’ in the Status column because you moved the
files. The project no longer knows if the previous compilation is still valid.
Simulation Configurations
A Simulation Configuration associates a design unit(s) and its simulation options. For example,
let’s say that every time you load tcounter.v you want to set the simulator resolution to
picoseconds (ps) and enable event order hazard checking. Ordinarily, you would have to specify
those options each time you load the design. With a Simulation Configuration, you specify
options for a design and then save a "configuration" that associates the design and its options.
The configuration is then listed in the Project tab and you can double-click it to load tcounter.v
along with its options.
1. Create a new Simulation Configuration.
a. Right-click in the Projects tab and select Add to Project > Simulation
Configuration from the popup menu.
This opens the Add Simulation Configuration dialog (Figure 4-13). The tabs in this
dialog present a myriad of simulation options. You may want to explore the tabs to
see what is available. You can consult the ModelSim User’s Manual to get a
description of each option.
48
ModelSim SE Tutorial, v6.3a
June 2007
Projects
Simulation Configurations
Figure 4-13. Simulation Configuration Dialog
b. Type counter in the Simulation Configuration Name field.
c. Select HDL from the Place in Folder drop-down.
d. Click the ’+’ icon next to the work library and select test_counter.
e. Click the Resolution drop-down and select ps.
f. Uncheck the Enable optimization selection box.
g. For Verilog, click the Verilog tab and check Enable hazard checking (-hazards).
h. Click Save.
The Project tab now shows a Simulation Configuration named counter in the HDL
folder (Figure 4-14).
ModelSim SE Tutorial, v6.3a
June 2007
49
Projects
Simulation Configurations
Figure 4-14. A Simulation Configuration in the Project Tab
2. Load the Simulation Configuration.
a. Double-click the counter Simulation Configuration in the Project tab.
In the Transcript pane of the Main window, the vsim (the ModelSim simulator)
invocation shows the -hazards and -t ps switches (Figure 4-15). These are the
command-line equivalents of the options you specified in the Simulate dialog.
Figure 4-15. Transcript Shows Options for Simulation Configurations
Lesson Wrap-Up
This concludes this lesson. Before continuing you need to end the current simulation and close
the current project.
1. Select Simulate > End Simulation. Click Yes.
2. Select the Project tab in the Main window Workspace.
3. Right-click in this tab to open a popup menu and select Close Project.
4. Click OK.
50
ModelSim SE Tutorial, v6.3a
June 2007
Projects
Simulation Configurations
If you do not close the project, it will open automatically the next time you start
ModelSim.
ModelSim SE Tutorial, v6.3a
June 2007
51
Projects
Simulation Configurations
52
ModelSim SE Tutorial, v6.3a
June 2007
Chapter 5
Working With Multiple Libraries
Introduction
In this lesson you will practice working with multiple libraries. You might have multiple
libraries to organize your design, to access IP from a third-party source, or to share common
parts between simulations.
You will start the lesson by creating a resource library that contains the counter design unit.
Next, you will create a project and compile the testbench into it. Finally, you will link to the
library containing the counter and then run the simulation.
Design Files for this Lesson
The sample design for this lesson is a simple 8-bit, binary up-counter with an associated
testbench. The pathnames are as follows:
Verilog – <install_dir>/examples/tutorials/verilog/libraries/counter.v and tcounter.v
VHDL – <install_dir>/examples/tutorials/vhdl/libraries/counter.vhd and tcounter.vhd
This lesson uses the Verilog files tcounter.v and counter.v in the examples. If you have a VHDL
license, use tcounter.vhd and counter.vhd instead.
Related Reading
User’s Manual Chapter: Design Libraries.
Creating the Resource Library
Before creating the resource library, make sure the modelsim.ini in your install directory is
“Read Only.” This will prevent permanent mapping of resource libraries to the master
modelsim.ini file. See Permanently Mapping VHDL Resource Libraries.
1. Create a directory for the resource library.
Create a new directory called resource_library. Copy counter.v from
<install_dir>/examples/tutorials/verilog/libraries to the new directory.
2. Create a directory for the testbench.
ModelSim SE Tutorial, v6.3a
June 2007
53
Working With Multiple Libraries
Creating the Resource Library
Create a new directory called testbench that will hold the testbench and project files.
Copy tcounter.v from <install_dir>/examples/tutorials/verilog/libraries to the new
directory.
You are creating two directories in this lesson to mimic the situation where you receive
a resource library from a third-party. As noted earlier, we will link to the resource
library in the first directory later in the lesson.
3. Start ModelSim and change to the resource_library directory.
If you just finished the previous lesson, ModelSim should already be running. If not,
start ModelSim.
a. Type vsim at a UNIX shell prompt or use the ModelSim icon in Windows.
If the Welcome to ModelSim dialog appears, click Close.
b. Select File > Change Directory and change to the resource_library directory you
created in step 1.
4. Create the resource library.
a. Select File > New > Library.
b. Type parts_lib in the Library Name field (Figure 5-1).
Figure 5-1. Creating New Resource Library
The Library Physical Name field is filled out automatically.
Once you click OK, ModelSim creates a directory for the library, lists it in the
Library tab of the Workspace, and modifies the modelsim.ini file to record this new
library for the future.
5. Compile the counter into the resource library.
54
ModelSim SE Tutorial, v6.3a
June 2007
Working With Multiple Libraries
Creating the Project
a. Click the Compile icon on the Main window toolbar.
b. Select the parts_lib library from the Library list (Figure 5-2).
Figure 5-2. Compiling into the Resource Library
c. Double-click counter.v to compile it.
d. Click Done.
You now have a resource library containing a compiled version of the counter
design unit.
6. Change to the testbench directory.
a. Select File > Change Directory and change to the testbench directory you created
in step 2.
Creating the Project
Now you will create a project that contains tcounter.v, the counter’s testbench.
1. Create the project.
a. Select File > New > Project.
b. Type counter in the Project Name field.
ModelSim SE Tutorial, v6.3a
June 2007
55
Working With Multiple Libraries
Linking to the Resource Library
c. Do not change the Project Location field or the Default Library Name field. (The
default library name is work.)
d. Make sure “Copy Library Mappings” is selected. The default modelsim.ini file will
be used.
e. Click OK.
2. Add the testbench to the project.
a. Click Add Existing File in the Add items to the Project dialog.
b. Click the Browse button and select tcounter.v in the “Select files to add to project”
dialog.
c. Click Open.
d. Click OK.
e. Click Close to dismiss the “Add items to the Project” dialog.
The tcounter.v file is listed in the Project tab of the Main window.
3. Compile the testbench.
a. Right-click tcounter.v and select Compile > Compile Selected.
Linking to the Resource Library
To wrap up this part of the lesson, you will link to the parts_lib library you created earlier. But
first, try simulating the testbench without the link and see what happens.
ModelSim responds differently for Verilog and VHDL in this situation.
Verilog
1. Simulate a Verilog design with a missing resource library.
a. Enter the following command at the ModelSim> prompt in the Transcript pane.
vsim -voptargs="+acc" test_counter
The -voptargs=”+acc” argument for the vsim command provides visibility into the
design for debugging purposes.
Note
By default, ModelSim optimizations are performed on all designs (see Optimizing
Designs with vopt).
The Main window Transcript reports an error loading the design because the counter
module is not defined.
56
ModelSim SE Tutorial, v6.3a
June 2007
Working With Multiple Libraries
Linking to the Resource Library
VHDL
1. Simulate a VHDL design with a missing resource library.
a. Enter the following command at the ModelSim> prompt in the Transcript pane.
vsim -voptargs="+acc" test_counter
The -voptargs=”+acc” argument for the vsim command provides visibility into the
design for debugging purposes.
Note
By default, ModelSim optimizations are performed on all designs (see Optimizing
Designs with vopt).
The Main window Transcript reports a warning (Figure 5-3). When you see a
message that contains text like "Warning: (vsim-3473)", you can view more detail
by using the verror command.
Figure 5-3. VHDL Simulation Warning Reported in Main Window
b. Type verror 3473 at the VSIM> prompt.
The expanded error message tells you that a component (’dut’ in this case) has not
been explicitly bound and no default binding can be found.
c. Type quit -sim to quit the simulation.
The process for linking to a resource library differs between Verilog and VHDL. If you are
using Verilog, follow the steps in Linking in Verilog. If you are using VHDL, follow the steps
in Linking in VHDL one page later.
Linking in Verilog
Linking in Verilog requires that you specify a "search library" when you invoke the simulator.
1. Specify a search library during simulation.
ModelSim SE Tutorial, v6.3a
June 2007
57
Working With Multiple Libraries
Linking to the Resource Library
a. Click the Simulate icon on the Main window toolbar.
b. Click the ’+’ icon next to the work library and select test_counter.
c. Uncheck the Enable optimization selection box.
d. Click the Libraries tab.
e. Click the Add button next to the Search Libraries field and browse to parts_lib in the
resource_library directory you created earlier in the lesson.
f. Click OK.
The dialog should have parts_lib listed in the Search Libraries field (Figure 5-4).
g. Click OK.
The design loads without errors.
Figure 5-4. Specifying a Search Library in the Simulate Dialog
Linking in VHDL
To link to a resource library in VHDL, you have to create a logical mapping to the physical
library and then add LIBRARY and USE statements to the source file.
1. Create a logical mapping to parts_lib.
58
ModelSim SE Tutorial, v6.3a
June 2007
Working With Multiple Libraries
Linking to the Resource Library
a. Select File > New > Library.
b. In the Create a New Library dialog, select a map to an existing library.
c. Type parts_lib in the Library Name field.
d. Click Browse to open the Select Library dialog and browse to parts_lib in the
resource_library directory you created earlier in the lesson.
e. Click OK to select the library and close the Select Library dialog.
f. The Create a New Library dialog should look similar to the one shown in Figure 5-5.
Click OK to close the dialog.
Figure 5-5. Mapping to the parts_lib Library
2. Add LIBRARY and USE statements to tcounter.vhd.
a. In the Library tab of the Main window, click the ’+’ icon next to the work library.
b. Right-click test_counter in the work library and select Edit.
c. This opens the file in the Source window.
d. Right-click in the Source window and uncheck Read Only.
e. Add these two lines to the top of the file:
LIBRARY parts_lib;
USE parts_lib.ALL;
The testbench source code should now look similar to that shown in Figure 5-6.
f. Select File > Save.
ModelSim SE Tutorial, v6.3a
June 2007
59
Working With Multiple Libraries
Permanently Mapping VHDL Resource Libraries
Figure 5-6. Adding LIBRARY and USE Statements to the Testbench
3. Recompile and simulate.
a. In the Project tab of the Workspace, right-click tcounter. vhd and select Compile >
Compile Selected.
b. Enter the following command at the ModelSim> prompt in the Transcript pane.
vsim -voptargs="+acc" test_counter
c. The design loads without errors.
Permanently Mapping VHDL Resource Libraries
If you reference particular VHDL resource libraries in every VHDL project or simulation, you
may want to permanently map the libraries. Doing this requires that you edit the master
modelsim.ini file in the installation directory. Though you won’t actually practice it in this
tutorial, here are the steps for editing the file:
1. Locate the modelsim.ini file in the ModelSim installation directory
(<install_dir>/modeltech/modelsim.ini).
2. IMPORTANT - Make a backup copy of the file.
3. Change the file attributes of modelsim.ini so it is no longer "read-only."
4. Open the file and enter your library mappings in the [Library] section. For example:
parts_lib = C:/libraries/parts_lib
60
ModelSim SE Tutorial, v6.3a
June 2007
Working With Multiple Libraries
Permanently Mapping VHDL Resource Libraries
5. Save the file.
6. Change the file attributes so the file is "read-only" again.
Lesson Wrap-Up
This concludes this lesson. Before continuing we need to end the current simulation and close
the project.
1. Select Simulate > End Simulation. Click Yes.
2. Select the Project tab of the Main window Workspace.
3. Select File > Close. Click OK.
ModelSim SE Tutorial, v6.3a
June 2007
61
Working With Multiple Libraries
Permanently Mapping VHDL Resource Libraries
62
ModelSim SE Tutorial, v6.3a
June 2007
Chapter 6
Simulating Designs With SystemC
Introduction
ModelSim treats SystemC as just another design language. With only a few exceptions in the
current release, you can simulate and debug your SystemC designs the same way you do HDL
designs.
Note
The functionality described in this lesson requires a systemc license feature in your
ModelSim license file. Please contact your Mentor Graphics sales representative if you
currently do not have such a feature.
Design Files for this Lesson
There are two sample designs for this lesson. The first is a very basic design, called "basic",
containing only SystemC code. The second design is a ring buffer where the testbench and toplevel chip are implemented in SystemC and the lower-level modules are written in HDL.
The pathnames to the files are as follows:
SystemC – <install_dir>/examples/systemc/sc_basic
SystemC/Verilog – <install_dir>/examples/systemc/sc_vlog
SystemC/VHDL – <install_dir>/examples/systemc/sc_vhdl
This lesson uses the SystemC/Verilog version of the ringbuf design in the examples. If you have
a VHDL license, use the VHDL version instead. There is also a mixed version of the design, but
the instructions here do not account for the slight differences in that version.
Related Reading
User’s Manual Chapters: SystemC Simulation, Mixed-Language Simulation, and C Debug.
Reference Manual command: sccom.
ModelSim SE Tutorial, v6.3a
June 2007
63
Simulating Designs With SystemC
Setting up the Environment
Setting up the Environment
SystemC is a licensed feature. You need the systemc license feature in your ModelSim license
file to simulate SystemC designs. Please contact your Mentor Graphics sales representatives if
you currently do not have such a feature.
The table below shows the supported operating systems for SystemC and the corresponding
required versions of a C compiler.
Table 6-1. Supported Operating Systems for SystemC
Platform
Supported compiler versions
HP-UX 11.0 or later
aCC 3.45 with associated patches
RedHat Linux 7.2 and 7.3
RedHat Linux Enterprise version
2.1
gcc 3.2.3, gcc 4.0.2
AMD64 / SUSE Linux Enterprise
Server 9.0, 9.1 or Red Hat
Enterprise Linux 3, 4
gcc 4.0.2
VCO is linux (32-bit binary)
VCO is linux_x86_64 (64-bit binary)
Solaris 8, 9, 10
gcc 3.3
Windows 2000 and XP
Minimalist GNU for Windows
(MinGW) gcc 3.3.1
See SystemC simulation in the ModelSim User’s Manual for further details.
Preparing an OSCI SystemC design
For an OpenSystemC Initiative (OSCI) compliant SystemC design to run on ModelSim, you
must first:
•
Replace sc_main() with an SC_MODULE, potentially adding a process to contain any
testbench code
•
Replace sc_start() by using the run command in the GUI
•
Remove calls to sc_initialize()
•
Export the top level SystemC design unit(s) using the SC_MODULE_EXPORT macro
In order to maintain portability between OSCI and ModelSim simulations, we recommend that
you preserve the original code by using #ifdef to add the ModelSim-specific information. When
the design is analyzed, sccom recognizes the MTI_SYSTEMC preprocessing directive and
handles the code appropriately.
For more information on these modifications, Refer to the section Modifying SystemC Source
Code in the User’s Manual.
64
ModelSim SE Tutorial, v6.3a
June 2007
Simulating Designs With SystemC
Preparing an OSCI SystemC design
1. Create a new directory and copy the tutorial files into it.
Start by creating a new directory for this exercise (in case other users will be working
with these lessons). Create the directory, then copy all files from
<install_dir>/examples/systemc/sc_basic into the new directory.
2. Start ModelSim and change to the exercise directory.
If you just finished the previous lesson, ModelSim should already be running. If not,
start ModelSim.
a. Type vsim at a UNIX shell prompt or use the ModelSim icon in Windows.
If the Welcome to ModelSim dialog appears, click Close.
b. Select File > Change Directory and change to the directory you created in step 1.
3. Use a text editor to view and edit the basic_orig.cpp file. To use ModelSim’s editor,
from the Main Menu select File > Open. Change the files of type to C/C++ files then
double-click basic_orig.cpp.
a. Using the #ifdef MTI_SYSTEMC preprocessor directive, add the
SC_MODULE_EXPORT(top); to the design as shown in Figure 6-1. (The left side
of Figure 6-1 is the original code; the right side is the modified code.) Close the
preprocessing directive with #else.
The original code in the .cpp file follows directly after #else. End that section of the
file with #endif.
b. Save the file as basic.cpp.
ModelSim SE Tutorial, v6.3a
June 2007
65
Simulating Designs With SystemC
Preparing an OSCI SystemC design
Figure 6-1. SystemC Code Before and After Modifications
A correctly modified copy of the basic.cpp is also available in the sc_basic/gold
directory.
4. Edit the basic_orig.h header file as shown in Figure 6-2.
a. Add a ModelSim specific SC_MODULE (top) as shown in lines 52 through 65 of
Figure 6-2.
The declarations that were in sc_main are placed here in the header file, in
SC_MODULE (top). This creates a top level module above mod_a, which allows
the tool’s automatic name binding feature to properly associate the primitive
channels with their names.
66
ModelSim SE Tutorial, v6.3a
June 2007
Simulating Designs With SystemC
Preparing an OSCI SystemC design
Figure 6-2. Editing the SystemC Header File.
ModelSim SE Tutorial, v6.3a
June 2007
67
Simulating Designs With SystemC
Compiling a SystemC-only Design
b. Save the file as basic.h.
A correctly modified copy of the basic.h is also available in the sc_basic/gold
directory.
You have now made all the edits that are required for preparing the design for compilation.
Compiling a SystemC-only Design
With the edits complete, you are ready to compile the design. Designs that contain only
SystemC code are compiled with sccom.
1. Set the working library.
a. Type vlib work in the ModelSim Transcript window to create the working library.
2. Compile and link all SystemC files.
a. Type sccom -g basic.cpp at the ModelSim> prompt.
The -g argument compiles the design for debug.
b. Type sccom -link at the ModelSim> prompt to perform the final link on the
SystemC objects.
You have successfully compiled and linked the design. The successful compilation verifies that
all the necessary file modifications have been entered correctly.
In the next exercise you will compile and load a design that includes both SystemC and HDL
code.
68
ModelSim SE Tutorial, v6.3a
June 2007
Simulating Designs With SystemC
Mixed SystemC and HDL Example
Mixed SystemC and HDL Example
In this next example, you have a SystemC testbench that instantiates an HDL module. In order
for the SystemC testbench to interface properly with the HDL module, you must create a stub
module, a foreign module declaration. You will use the scgenmod utility to create the foreign
module declaration. Finally, you will link the created C object files using sccom -link.
1. Create a new exercise directory and copy the tutorial files into it.
Start by creating a new directory for this exercise (in case other users will be working
with these lessons). Create the directory, then copy all files from
<install_dir>/examples/systemc/sc_vlog into the new directory.
If you have a VHDL license, copy the files in <install_dir>/examples/systemc/sc_vhdl
instead.
2. Start ModelSim and change to the exercise directory
If you just finished the previous lesson, ModelSim should already be running. If not,
start ModelSim.
a. Type vsim at a command shell prompt.
If the Welcome to ModelSim dialog appears, click Close.
b. Select File > Change Directory and change to the directory you created in step 1.
3. Set the working library.
a. Type vlib work in the ModelSim Transcript window to create the working library.
4. Compile the design.
a. Verilog:
Type vlog *.v in the ModelSim Transcript window to compile all Verilog source
files.
VHDL:
Type vcom -93 *.vhd in the ModelSim Transcript window to compile all VHDL
source files.
5. Create the foreign module declaration (SystemC stub) for the Verilog module ringbuf.
a. Verilog:
Type scgenmod -bool ringbuf > ringbuf.h at the ModelSim> prompt.
The -bool argument is used to generate boolean scalar port types inside the foreign
module declaration. See scgenmod for more information.
VHDL:
Type scgenmod ringbuf > ringbuf.h at the ModelSim> prompt.
The output is redirected to the file ringbuf.h (Figure 6-3).
ModelSim SE Tutorial, v6.3a
June 2007
69
Simulating Designs With SystemC
Mixed SystemC and HDL Example
Figure 6-3. The ringbuf.h File.
This file is included in test_ringbuf.h which is included in file test_ringbuf.cpp
(Figure 6-4).
Figure 6-4. The test_ringbuf.cpp File
6. Compile and link all SystemC files, including the generated ringbuf.h.
a. Type sccom -g test_ringbuf.cpp at the ModelSim> prompt.
70
ModelSim SE Tutorial, v6.3a
June 2007
Simulating Designs With SystemC
Mixed SystemC and HDL Example
The test_ringbuf.cpp file contains an include statement for test_ringbuf.h and a
required SC_MODULE_EXPORT(top) statement, which informs ModelSim that
the top-level module is SystemC.
b. Type sccom -link at the ModelSim> prompt to perform the final link on the
SystemC objects.
7. Load the design.
a. Enter the following command at the ModelSim> prompt in the Transcript pane.
vsim -voptargs="+acc" test_ringbuf
The -voptargs=”+acc” argument for the vsim command provides visibility into the
design for debugging purposes.
Note
By default, ModelSim optimizations are performed on all designs (see Optimizing
Designs with vopt).
8. If necessary, you may close the Locals, Profile, and Watch panes of the Main window.
Make sure the Objects and Active Processes panes are open, as shown in Figure 6-5. To
open or close these windows, use the View menu.
ModelSim SE Tutorial, v6.3a
June 2007
71
Simulating Designs With SystemC
Mixed SystemC and HDL Example
Figure 6-5. The test_ringbuf Design
72
ModelSim SE Tutorial, v6.3a
June 2007
Simulating Designs With SystemC
Viewing SystemC Objects in the GUI
Viewing SystemC Objects in the GUI
SystemC objects are denoted in the ModelSim GUI with a green ’S’ on the Library tab, a green
’C’ on the Files tab, and a green square, circle, or diamond icon elsewhere.
1. View Workspace and objects.
a. Click on the Library tab in the Workspace pane of the Main window.
SystemC objects have a green ’S’ next to their names (Figure 6-6).
Figure 6-6. SystemC Objects in the work Library
2. Observe window linkages.
a. Click on the sim tab in the Workspace pane of the Main window.
b. Select the clock instance in the sim tab (Figure 6-7).
The Objects window updates to show the associated SystemC or HDL objects.
Figure 6-7. SystemC Objects in the sim Tab of the Workspace
ModelSim SE Tutorial, v6.3a
June 2007
73
Simulating Designs With SystemC
Viewing SystemC Objects in the GUI
3. Add objects to the Wave window.
a. Right-click test_ringbuf in the sim tab of the Workspace and select Add > Add to
Wave.
Setting Breakpoints and Stepping in the Source Window
As with HDL files, you can set breakpoints and step through SystemC files in the Source
window. In the case of SystemC, ModelSim uses C Debug, an interface to the open-source gdb
debugger. Refer to the chapter C Debug in the User’s Manual for complete details.
1. Set a breakpoint.
a. Double-click test_ringbuf in the sim pane of the Workspace to open the source file.
b. In the Source window, scroll to near line 150 of test_ringbuf.h.
c. Click in the BP column next to the red line number of the line (shown in Figure 6-8)
containing:
Verilog:bool var_dataerror_newval = actual.read ...
VHDL: sc_logic var_dataerror_newval = acutal.read ...
ModelSim recognizes that the file contains SystemC code and automatically
launches C Debug. Once the debugger is running, ModelSim places a solid red ball
next to the line number (Figure 6-8).
Figure 6-8. Active Breakpoint in a SystemC File
2. Run and step through the code.
a. Type run 500 at the VSIM> prompt.
74
ModelSim SE Tutorial, v6.3a
June 2007
Simulating Designs With SystemC
Viewing SystemC Objects in the GUI
When the simulation hits the breakpoint, it stops running, highlights the line with a
blue arrow in the Source window (Figure 6-9), and issues a message like this in the
Transcript:
# C breakpoint c.1
# test_ringbuf:compare_data() (this=0x842f658) at
test_ringbuf.h:<line_number>
Figure 6-9. Simulation Stopped at Breakpoint
ModelSim SE Tutorial, v6.3a
June 2007
75
Simulating Designs With SystemC
Viewing SystemC Objects in the GUI
b. Click the Step icon on the toolbar.
This steps the simulation to the next statement. Because the next statement is a
function call, ModelSim steps into the function, which is in a separate file —
sc_signal.h (Figure 6-10).
Figure 6-10. Stepping into a Separate File
c. Click the Continue Run icon in the toolbar.
The breakpoint in test_ringbuf.h is hit again.
Examining SystemC Objects and Variables
To examine the value of a SystemC object or variable, you can use the examine command or
view the value in the Objects window.
1. View the value and type of an sc_signal.
a. Enter the show command at the CDBG > prompt to display a list of all design
objects, including their types, in the Transcript.
In this list, you’ll see that the type for dataerror is “boolean” (sc_logic for VHDL)
and counter is “int” (Figure 6-11).
76
ModelSim SE Tutorial, v6.3a
June 2007
Simulating Designs With SystemC
Viewing SystemC Objects in the GUI
Figure 6-11. Output of show Command
b. Enter the examine dataerror command at the CDBG > prompt.
The value returned is "true".
2. View the value of a SystemC variable.
a. Enter the examine counter command at the CDBG > prompt to view the value of
this variable.
The value returned is "-1".
Removing a Breakpoint
1. Return to the Source window for test_ringbuf.h and right-click the red ball in the BP
column. Select Remove Breakpoint from the popup menu.
2. Click the Continue Run button again.
The simulation runs for 500 ns and waves are drawn in the Wave window (Figure 6-12).
ModelSim SE Tutorial, v6.3a
June 2007
77
Simulating Designs With SystemC
Viewing SystemC Objects in the GUI
If you are using the VHDL version, you might see warnings in the Main window
transcript. These warnings are related to VHDL value conversion routines and can be
ignored.
Figure 6-12. SystemC Primitive Channels in the Wave Window
Lesson Wrap-up
This concludes the lesson. Before continuing we need to quit the C debugger and end the
current simulation.
1. Select Tools > C Debug > Quit C Debug.
2. Select Simulate > End Simulation. Click Yes when prompted to confirm that you wish
to quit simulating.
78
ModelSim SE Tutorial, v6.3a
June 2007
Chapter 7
Analyzing Waveforms
Introduction
The Wave window allows you to view the results of your simulation as HDL waveforms and
their values.
The Wave window is divided into a number of window panes (Figure 7-1). All window panes in
the Wave window can be resized by clicking and dragging the bar between any two panes.
Figure 7-1. Panes of the Wave Window
pathnames pane
cursor names pane
ModelSim SE Tutorial, v6.3a
June 2007
values pane
cursor values pane
waveform pane
cursor pane
79
Analyzing Waveforms
Loading a Design
Related Reading
User’s Manual sections: Wave Window and WLF Files (Datasets) and Virtuals.
Loading a Design
For the examples in this lesson, we have used the design simulated in Basic Simulation.
1. If you just finished the previous lesson, ModelSim should already be running. If not,
start ModelSim.
a. Type vsim at a UNIX shell prompt or use the ModelSim icon in Windows.
If the Welcome to ModelSim dialog appears, click Close.
2. Load the design.
a. Select File > Change Directory and open the directory you created in Lesson 2.
The work library should already exist.
b. Enter the following command at the ModelSim> prompt in the Transcript pane.
vsim -voptargs="+acc" test_counter
The -voptargs=”+acc” argument for the vsim command provides visibility into the
design for debugging purposes.
Note
By default, ModelSim optimizations are performed on all designs (see Optimizing
Designs with vopt).
ModelSim loads the design and adds sim and Files tabs to the Workspace.
Add Objects to the Wave Window
ModelSim offers several methods for adding objects to the Wave window. In this exercise, you
will try different methods.
1. Add objects from the Objects pane.
a. Select an item in the Objects pane of the Main window, right-click, and then select
Add to Wave > Signals in Region.
ModelSim adds several signals to the Wave window.
2. Undock the Wave window.
By default ModelSim opens Wave windows as a tab in the MDI frame of the Main
window. You can change the default via the Preferences dialog (Tools > Edit
80
ModelSim SE Tutorial, v6.3a
June 2007
Analyzing Waveforms
Add Objects to the Wave Window
Preferences). Refer to the section Simulator GUI Preferences in the User’s Manual for
more information.
a. Click the undock button on the Wave pane (Figure 7-2).
The Wave pane becomes a standalone, un-docked window. You may need to resize
the window.
Figure 7-2. Undocking the Wave Window
3. Add objects using drag-and-drop.
You can drag an object to the Wave window from many other windows and panes (e.g.,
Workspace, Objects, and Locals).
a. In the Wave window, select Edit > Select All and then Edit > Delete.
b. Drag an instance from the sim tab of the Main window to the Wave window.
ModelSim adds the objects for that instance to the Wave window.
c. Drag a signal from the Objects pane to the Wave window.
d. In the Wave window, select Edit > Select All and then Edit > Delete.
4. Add objects using a command.
a. Type add wave * at the VSIM> prompt.
ModelSim adds all objects from the current region.
b. Run the simulation for awhile so you can see waveforms.
ModelSim SE Tutorial, v6.3a
June 2007
81
Analyzing Waveforms
Zooming the Waveform Display
Zooming the Waveform Display
Zooming lets you change the display range in the waveform pane. There are numerous methods
for zooming the display.
1. Zoom the display using various techniques.
a. Click the Zoom Mode icon on the Wave window toolbar.
b. In the waveform pane, click and drag down and to the right.
You should see blue vertical lines and numbers defining an area to zoom in
(Figure 7-3).
Figure 7-3. Zooming in with the Mouse Pointer
c. Select View > Zoom > Zoom Last.
The waveform pane returns to the previous display range.
d. Click the Zoom In 2x icon a few times.
e. In the waveform pane, click and drag up and to the right.
You should see a blue line and numbers defining an area to zoom out.
f. Select View > Zoom > Zoom Full.
Using Cursors in the Wave Window
Cursors mark simulation time in the Wave window. When ModelSim first draws the Wave
window, it places one cursor at time zero. Clicking anywhere in the waveform pane brings that
cursor to the mouse location.
You can also add additional cursors; name, lock, and delete cursors; use cursors to measure time
intervals; and use cursors to find transitions.
82
ModelSim SE Tutorial, v6.3a
June 2007
Analyzing Waveforms
Using Cursors in the Wave Window
Working with a Single Cursor
1. Position the cursor by clicking and dragging.
a. Click the Select Mode icon on the Wave window toolbar.
b. Click anywhere in the waveform pane.
A cursor is inserted at the time where you clicked (Figure 7-4).
Figure 7-4. Working with a Single Cursor in the Wave Window
c. Drag the cursor and observe the value pane.
The signal values change as you move the cursor. This is perhaps the easiest way to
examine the value of a signal at a particular time.
d. In the waveform pane, drag the cursor to the right of a transition with the mouse
positioned over a waveform.
The cursor "snaps" to the transition. Cursors "snap" to a waveform edge if you click
or drag a cursor to within ten pixels of a waveform edge. You can set the snap
distance in the Window Preferences dialog (select Tools > Window Preferences).
e. In the cursor pane, drag the cursor to the right of a transition (Figure 7-4).
The cursor doesn’t snap to a transition if you drag in the cursor pane.
2. Rename the cursor.
a. Right-click "Cursor 1" in the cursor name pane, and select and delete the text.
b. Type A and press Enter.
The cursor name changes to "A" (Figure 7-5).
ModelSim SE Tutorial, v6.3a
June 2007
83
Analyzing Waveforms
Using Cursors in the Wave Window
Figure 7-5. Renaming a Cursor
3. Jump the cursor to the next or previous transition.
a. Click signal count in the pathname pane.
b. Click the Find Next Transition icon on the Wave window toolbar.
The cursor jumps to the next transition on the currently selected signal.
c. Click the Find Previous Transition icon on the Wave window toolbar.
The cursor jumps to the previous transition on the currently selected signal.
84
ModelSim SE Tutorial, v6.3a
June 2007
Analyzing Waveforms
Using Cursors in the Wave Window
Working with Multiple Cursors
1. Add a second cursor.
a. Click the Add Cursor icon on the Wave window toolbar.
b. Right-click the name of the new cursor and delete the text.
c. Type B and press Enter.
d. Drag cursor B and watch the interval measurement change dynamically (Figure 7-6).
Figure 7-6. Interval Measurement Between Two Cursors
2. Lock cursor B.
a. Right-click cursor B in the cursor pane and select Lock B.
The cursor color changes to red and you can no longer drag the cursor (Figure 7-7).
Figure 7-7. A Locked Cursor in the Wave Window
3. Delete cursor B.
a. Right-click cursor B and select Delete B.
ModelSim SE Tutorial, v6.3a
June 2007
85
Analyzing Waveforms
Saving and Reusing the Window Format
Saving and Reusing the Window Format
If you close the Wave window, any configurations you made to the window (e.g., signals added,
cursors set, etc.) are discarded. However, you can use the Save Format command to capture the
current Wave window display and signal preferences to a .do file. You open the .do file later to
recreate the Wave window as it appeared when the file was created.
Format files are design-specific; use them only with the design you were simulating when they
were created.
1. Save a format file.
a. In the Wave window, select File > Save.
b. In the Pathname field of the Save Format dialog, leave the file name set to wave.do
and click OK.
c. Close the Wave window.
2. Load a format file.
a. In the Main window, select View > Wave.
b. Undock the window.
All signals and cursor(s) that you had set are gone.
c. In the Wave window, select File > Load.
d. In the Open Format dialog, select wave.do and click Open.
ModelSim restores the window to its previous state.
e. Close the Wave window when you are finished by selecting File > Close Window.
Lesson Wrap-Up
This concludes this lesson. Before continuing we need to end the current simulation.
1. Select Simulate > End Simulation. Click Yes.
86
ModelSim SE Tutorial, v6.3a
June 2007
Chapter 8
Creating Stimulus With Waveform Editor
Introduction
The Waveform Editor creates stimulus for your design via interactive manipulation of
waveforms. You can then run the simulation with these edited waveforms or export them to a
stimulus file for later use.
In this lesson you will do the following:
•
Load the counter design unit without a testbench
•
Create waves via a wizard
•
Edit waves interactively in the Wave window
•
Export the waves to an HDL testbench and extended VCD file
•
Run the simulation
•
Re-simulate using the exported testbench and VCD file
Related Reading
User’s Manual Sections: Generating Stimulus with Waveform Editor and Wave Window.
Load a Design Unit
For the examples in this lesson, we will use part of the design simulated in Basic Simulation.
Note
You can also use the Waveform Editor prior to loading a design. Refer to the section
Using Waveform Editor Prior to Loading a Design in the User Manual for more
information.
1. If you just finished the previous lesson, ModelSim should already be running. If not,
start ModelSim.
a. Type vsim at a UNIX shell prompt or use the ModelSim icon in Windows.
If the Welcome to ModelSim dialog appears, click Close.
2. Open a Wave window.
a. Select View > Wave from the Main window menus.
ModelSim SE Tutorial, v6.3a
June 2007
87
Creating Stimulus With Waveform Editor
Create Graphical Stimulus with a Wizard
3. Load the counter design unit.
a. Select File > Change Directory and open the directory you created in Lesson 2.
The work library should already exist.
b. Enter the following command at the ModelSim> prompt in the Transcript pane.
vsim -voptargs="+acc" counter
The -voptargs=”+acc” argument for the vsim command provides visibility into the
design for debugging purposes.
Note
By default, ModelSim optimizations are performed on all designs (see Optimizing
Designs with vopt).
ModelSim loads the counter design unit and adds sim, Files, and Memories tabs to
the Workspace.
Create Graphical Stimulus with a Wizard
Waveform Editor includes a Create Pattern Wizard that walks you through the process of
creating editable waveforms.
1. Use the Create Pattern Wizard to create a clock pattern.
a. In the Objects pane, right click signal clk and select Create Wave (Figure 8-1).
88
ModelSim SE Tutorial, v6.3a
June 2007
Creating Stimulus With Waveform Editor
Create Graphical Stimulus with a Wizard
Figure 8-1. Initiating the Create Pattern Wizard from the Objects Pane
This opens the Create Pattern Wizard dialog where you specify the type of pattern
(Clock, Repeater, etc.) and a start and end time.
b. The default pattern is Clock, which is what we need, so click Next (Figure 8-2).
Figure 8-2. Create Pattern Wizard
c. In the second dialog of the wizard, enter 1 for Initial Value. Leave everything else as
is and click Finish (Figure 8-3).
ModelSim SE Tutorial, v6.3a
June 2007
89
Creating Stimulus With Waveform Editor
Create Graphical Stimulus with a Wizard
Figure 8-3. Specifying Clock Pattern Attributes
A generated waveform appears in the Wave window (Figure 8-4). Notice the small
red dot on the waveform icon and the prefix "Edit:". These items denote an editable
wave. (You may want to undock the Wave window.)
Figure 8-4. The clk Waveform
2. Create a second wave using the wizard.
a. Right-click signal reset in the Objects pane and select Create Wave from the popup
menu.
b. Select Constant for the pattern type and click Next.
c. Enter 0 for the Value and click Finish.
A second generated waveform appears in the Wave window (Figure 8-5).
90
ModelSim SE Tutorial, v6.3a
June 2007
Creating Stimulus With Waveform Editor
Edit Waveforms in the Wave Window
Figure 8-5. The reset Waveform
Edit Waveforms in the Wave Window
Waveform Editor gives you numerous commands for interactively editing waveforms (e.g.,
invert, mirror, stretch edge, cut, paste, etc.). You can access these commands via the menus,
toolbar buttons, or via keyboard and mouse shortcuts. You will try out several commands in this
part of the exercise.
1. Insert a pulse on signal reset.
a. Click the Edit Mode icon in the toolbar.
b. In the Wave window, click the reset signal so it is selected.
c. Click the Insert Pulse icon in the toolbar.
Or, in the waveform pane of the Wave window, right-click on the reset signal
waveform and select Wave > Insert Pulse.
d. In the Edit Insert Pulse dialog, enter 100 in the Duration field and 100 in the Time
field (Figure 8-6), and click OK.
Figure 8-6. Edit Insert Pulse Dialog
Signal reset now goes high from 100 ns to 200 ns (Figure 8-7).
ModelSim SE Tutorial, v6.3a
June 2007
91
Creating Stimulus With Waveform Editor
Edit Waveforms in the Wave Window
Figure 8-7. Signal reset with an Inserted Pulse
2. Stretch an edge on signal clk.
a. Click the signal clk waveform just to the right of the transition at 350 ns. The cursor
should snap to the transition at 350 ns.
b. Right-click that same transition and select Wave > Stretch Edge from the popup
menu.
If the command is dimmed out, the cursor probably isn’t on the edge at 350 ns.
c. In the Edit Stretch Edge dialog, enter 50 for Duration, make sure the Time field
shows 350, and then click OK (Figure 8-8).
Figure 8-8. Edit Stretch Edge Dialog
The wave edge stretches so it is high from 300 to 400 ns (Figure 8-9).
92
ModelSim SE Tutorial, v6.3a
June 2007
Creating Stimulus With Waveform Editor
Edit Waveforms in the Wave Window
Figure 8-9. Stretching an Edge on the clk Signal
Note the difference between stretching and moving an edge — the Stretch command
moves an edge by moving other edges on the waveform (either increasing waveform
duration or deleting edges at the beginning of simulation time); the Move command
moves an edge but does not move other edges on the waveform. You should see in
the Wave window that the waveform for signal clk now extends to 1050 ns.
3. Delete an edge.
a. Click signal clk just to the right of the transition at 400 ns.
The cursor should "snap" to 400 ns.
b. Click the Delete Edge icon.
This opens the Edit Delete Edge dialog. The Time is already set to 400 ns. Click
OK. The edge is deleted and clk now stays high until 500 ns (Figure 8-10).
Figure 8-10. Deleting an Edge on the clk Signal
4. Undo and redo an edit.
a. Click the Undo icon.
The Edit Undo dialog opens, allowing you to select the Undo Count - the number of
past actions to undo. Click OK with the Undo Count set to 1 and the deleted edge at
400 ns reappears.
ModelSim SE Tutorial, v6.3a
June 2007
93
Creating Stimulus With Waveform Editor
Save and Reuse the Wave Commands
b. Click the Redo icon.
The edge is deleted again. You can undo and redo any number of editing operations
except extending all waves and changing drive types. Those two edits cannot be
undone.
Save and Reuse the Wave Commands
You can save the commands that ModelSim used to create the waveforms. You can load this
"format" file at a later time to re-create the waves. In this exercise, we will save the commands,
quit and reload the simulation, and then open the format file.
1. Save the wave commands to a format file.
a. Select File > Close in the menu bar and you will be prompted to save the wave
commands.
b. Click Yes.
c. Type waveedit.do in the File name field of the Save Commands dialog that opens
and then click Save.
This saves a DO file named waveedit.do to the current directory and closes the Wave
window.
2. Quit and then reload the simulation.
a. In the Main window, select Simulate > End Simulation, and click Yes to confirm
you want to quit simulating.
b. To reload the simulation, enter the following command at the ModelSim> prompt.
vsim -voptargs="+acc" counter
3. Open the format file.
a. Select View > Wave to open the Wave window.
b. Select File > Load from the menu bar.
c. Double-click waveedit.do to open the file.
The waves you created earlier in the lesson reappear. If waves do not appear, you
probably did not load the counter design unit.
94
ModelSim SE Tutorial, v6.3a
June 2007
Creating Stimulus With Waveform Editor
Exporting the Created Waveforms
Exporting the Created Waveforms
At this point you can run the simulation or you can export the created waveforms to one of four
stimulus file formats. You will run the simulation in a minute but first let us export the created
waveforms so we can use them later in the lesson.
1. Export the created waveforms in an HDL testbench format.
a. Select File > Export > Waveform.
b. Select Verilog Testbench (or VHDL Testbench if you are using the VHDL sample
files).
c. Enter 1000 for End Time if necessary.
d. Enter export in the File Name field and click OK (Figure 8-11).
Figure 8-11. The Export Waveform Dialog
ModelSim creates a file named export.v (or export.vhd) in the current directory.
Later in the lesson we will compile and simulate the file.
2. Export the created waveforms in an extended VCD format.
a. Select File > Export > Waveform.
b. Select EVCD File.
c. Enter 1000 for End Time if necessary and click OK.
ModelSim creates an extended VCD file named export.vcd. We will import this file
later in the lesson.
Run the Simulation
Once you have finished editing the waveforms, you can run the simulation straight away.
ModelSim SE Tutorial, v6.3a
June 2007
95
Creating Stimulus With Waveform Editor
Exporting the Created Waveforms
1. Add a design signal.
a. In the Objects pane, right-click count and select Add to Wave > Selected Signals.
The signal is added to the Wave window.
2. Run the simulation.
a. Click the Run -All icon.
The simulation runs for 1000 ns and the waveform is drawn for
sim:/counter/count (Figure 8-12).
Figure 8-12. The counter Waveform Reacts to Stimulus Patterns
Look at the signal transitions for count from 300 ns to 500 ns. The transitions occur
when clk goes high, and you can see that count follows the pattern you created when
you edited clk by stretching and deleting edges.
3. Quit the simulation.
a. In the Main window, select Simulate > End Simulation, and click Yes to confirm
you want to quit simulating.
96
ModelSim SE Tutorial, v6.3a
June 2007
Creating Stimulus With Waveform Editor
Simulating with the Testbench File
Simulating with the Testbench File
Earlier in the lesson you exported the created waveforms to a testbench file. In this exercise you
will compile and load the testbench and then run the simulation.
1. Compile and load the testbench.
a. At the ModelSim prompt, enter vlog export.v (or vcom export.vhd if you are
working with VHDL files).
You should see a design unit named export appear in the Library tab (Figure 8-13).
Figure 8-13. The export Testbench Compiled into the work Library
b. Enter the following command at the ModelSim> prompt.
vsim -voptargs="+acc" export
2. Add waves and run the design.
a. At the VSIM> prompt, type add wave *.
b. Next type run 1000.
The waveforms in the Wave window match those you saw in the last exercise
(Figure 8-14).
ModelSim SE Tutorial, v6.3a
June 2007
97
Creating Stimulus With Waveform Editor
Importing an EVCD File
Figure 8-14. Waves from Newly Created Testbench
3. Quit the simulation.
a. In the Main window, select Simulate > End Simulation, and click Yes to confirm
you want to quit simulating.
Importing an EVCD File
Earlier in the lesson you exported the created waveforms to an extended VCD file. In this
exercise you will use that file to stimulate the counter design unit.
1. Load the counter design unit and add waves.
a. Enter the following command at the ModelSim> prompt.
vsim -voptargs="+acc" counter
b. In the Objects pane, right-click count and select Add to Wave > Selected Signals.
2. Import the VCD file.
a. Make sure the Wave window is active, then select File > Import > EVCD from the
menu bar.
b. Double-click export.vcd.
The created waveforms draw in the Wave window (Figure 8-15).
98
ModelSim SE Tutorial, v6.3a
June 2007
Creating Stimulus With Waveform Editor
Importing an EVCD File
Figure 8-15. EVCD File Loaded in Wave Window
c. Click the Run -All icon.
The simulation runs for 1000 ns and the waveform is drawn for
sim:/counter/count (Figure 8-16).
Figure 8-16. Simulation results with EVCD File
When you import an EVCD file, signal mapping happens automatically if signal
names and widths match. If they do not, you have to manually map the signals. Refer
to the section Signal Mapping and Importing EVCD Files in the User’s Manual for
more information.
Lesson Wrap-Up
This concludes this lesson. Before continuing we need to end the current simulation.
1. In the Main window, select Simulate > End Simulation. Click Yes.
ModelSim SE Tutorial, v6.3a
June 2007
99
Creating Stimulus With Waveform Editor
Importing an EVCD File
100
ModelSim SE Tutorial, v6.3a
June 2007
Chapter 9
Debugging With The Dataflow Window
Introduction
The Dataflow window allows you to explore the "physical" connectivity of your design; to trace
events that propagate through the design; and to identify the cause of unexpected outputs. The
window displays processes; signals, nets, and registers; and interconnect.
Note
The functionality described in this lesson requires a dataflow license feature in your
ModelSim license file. Please contact your Mentor Graphics sales representative if you
currently do not have such a feature.
Design Files for this Lesson
The sample design for this lesson is a testbench that verifies a cache module and how it works
with primary memory. A processor design unit provides read and write requests.
The pathnames to the files are as follows:
Verilog – <install_dir>/examples/tutorials/verilog/dataflow
VHDL – <install_dir>/examples/tutorials/vhdl/dataflow
This lesson uses the Verilog version in the examples. If you have a VHDL license, use the
VHDL version instead. When necessary, we distinguish between the Verilog and VHDL
versions of the design.
Related Reading
User’s Manual Sections: Debugging with the Dataflow Window and Dataflow Window.
Compile and Load the Design
In this exercise you will use a DO file to compile and load the design.
1. Create a new directory and copy the tutorial files into it.
Start by creating a new directory for this exercise (in case other users will be working
with these lessons). Create the directory and copy all files from
<install_dir>/examples/tutorials/verilog/dataflow to the new directory.
ModelSim SE Tutorial, v6.3a
June 2007
101
Debugging With The Dataflow Window
Exploring Connectivity
If you have a VHDL license, copy the files in
<install_dir>/examples/tutorials/vhdl/dataflow instead.
2. Start ModelSim and change to the exercise directory.
If you just finished the previous lesson, ModelSim should already be running. If not,
start ModelSim.
a. Type vsim at a UNIX shell prompt or use the ModelSim icon in Windows.
If the Welcome to ModelSim dialog appears, click Close.
b. Select File > Change Directory and change to the directory you created in step 1.
3. Execute the lesson DO file.
a. Type do run.do at the ModelSim> prompt.
The DO file does the following:
•
Creates the working library
•
Compiles the design files
•
Opens the Dataflow window
•
Adds signals to the Wave window
•
Logs all signals in the design
•
Runs the simulation
Feel free to open the DO file and look at its contents.
Exploring Connectivity
A primary use of the Dataflow window is exploring the "physical" connectivity of your design.
You do this by expanding the view from process to process. This allows you to see the
drivers/receivers of a particular signal, net, or register.
1. Add a signal to the Dataflow window.
a. Make sure instance p is selected in the sim tab of the Workspace pane.
b. Drag signal strb from the Objects pane to the Dataflow window (Figure 9-1).
102
ModelSim SE Tutorial, v6.3a
June 2007
Debugging With The Dataflow Window
Exploring Connectivity
Figure 9-1. A Signal in the Dataflow Window
2. Explore the design.
a. Double-click the net highlighted in red.
The view expands to display the processes that are connected to strb (Figure 9-2).
Figure 9-2. Expanding the View to Display Connected Processes
Select signal test on process #NAND#50 (labeled line_71 in the VHDL version) and
click the Expand net to all drivers icon.
ModelSim SE Tutorial, v6.3a
June 2007
103
Debugging With The Dataflow Window
Exploring Connectivity
Figure 9-3. The test Net Expanded to Show All Drivers
Notice that after the display expands, the signal line for strb is highlighted in green.
This highlighting indicates the path you have traversed in the design.
Select signal oen on process #ALWAYS#155(labeled line_84 in the VHDL version),
and click the Expand net to all readers icon.
Continue exploring if you wish.
When you are done, click the Erase All icon.
104
ModelSim SE Tutorial, v6.3a
June 2007
Debugging With The Dataflow Window
Tracing Events
Tracing Events
Another useful debugging feature is tracing events that contribute to an unexpected output
value. Using the Dataflow window’s embedded wave viewer, you can trace backward from a
transition to see which process or signal caused the unexpected output.
1. Add an object to the Dataflow window.
a. Make sure instance p is selected in the sim tab of the Main window.
b. Drag signal t_out from the Objects pane into the Dataflow window.
c. Undock the Dataflow window.
d. Select View > Show Wave in the Dataflow window to open the wave viewer
(Figure 9-4). You may need to increase the size of the Dataflow window and scroll
the panes to see everything.
Figure 9-4. The embedded wave viewer pane
2. Trace the inputs of the nand gate.
ModelSim SE Tutorial, v6.3a
June 2007
105
Debugging With The Dataflow Window
Tracing Events
a. Select process #NAND#50 (labeled line_71 in the VHDL version) in the dataflow
pane. All input and output signals of the process are displayed in the wave viewer
(Figure 9-5).
Figure 9-5. Signals Added to the Wave Viewer Automatically
b. In the wave view, scroll to time 2785 ns (the last transition of signal t_out).
c. Click just to the right of the last transition of signal t_out. The cursor should snap to
time 2785 ns.
d. Select Trace > Trace next event to trace the first contributing event.
ModelSim adds a cursor marking the last event, the transition of the strobe to 0 at
2745 ns, which caused the output of 1 on t_out (Figure 9-6).
106
ModelSim SE Tutorial, v6.3a
June 2007
Debugging With The Dataflow Window
Tracing Events
Figure 9-6. Cursor in Wave Viewer Marks Last Event
e. Select Trace > Trace next event two more times.
f. Select Trace > Trace event set.
The dataflow pane sprouts to the preceding process and shows the input driver of
signal strb (Figure 9-7). Notice too that the wave viewer now shows the input and
output signals of the newly selected process.
Figure 9-7. Tracing the Event Set
ModelSim SE Tutorial, v6.3a
June 2007
107
Debugging With The Dataflow Window
Tracing an X (Unknown)
You can continue tracing events through the design in this manner: select Trace
next event until you get to a transition of interest in the wave viewer, and then select
Trace event set to update the dataflow pane.
3. Select File > Close to close the Dataflow window.
Tracing an X (Unknown)
The Dataflow window lets you easily track an unknown value (X) as it propagates through the
design. The Dataflow window is linked to the stand-alone Wave window, so you can view
signals in the Wave window and then use the Dataflow window to track the source of a
problem. As you traverse your design in the Dataflow window, appropriate signals are added
automatically to the Wave window.
1. View t_out in the Wave and Dataflow windows.
a. Scroll in the Wave window until you can see /top/p/t_out.
t_out goes to an unknown state, StX, at 2065 ns and continues transitioning between
1 and unknown for the rest of the run (Figure 9-8). The red color of the waveform
indicates an unknown value.
Figure 9-8. A Signal with Unknown Values
b. Double-click the t_out waveform at the last transition of signal t_out at 2785 ns.
This automatically opens the Dataflow window and displays t_out, its associated
process, and its waveform. You may need to increase the size of the Dataflow
window and scroll the panes to see everything.
c. Move the cursor in the Wave window.
108
ModelSim SE Tutorial, v6.3a
June 2007
Debugging With The Dataflow Window
Tracing an X (Unknown)
As previously mentioned the Wave and Dataflow windows are designed to work
together. As you move the cursor in the Wave, the value of t_out changes in the
Dataflow window.
d. Move the cursor to a time when t_out is unknown (e.g., 2725 ns).
2. Trace the unknown.
a. In the Dataflow window, make sure t_out is selected and then select Trace >
ChaseX.
The design expands to show the source of the unknown (Figure 9-9). In this case
there is a HiZ (U in the VHDL version) on input signal test_in and a 0 on input
signal _rw (bar_rw in the VHDL version), so output signal test2 resolves to an
unknown.
Figure 9-9. ChaseX Identifies Cause of Unknown on t_out
Scroll to the bottom of the Wave window, and you will see that all of the signals
contributing to the unknown value have been added.
3. Clear the Dataflow window before continuing.
a. Click the Erase All icon to clear the Dataflow view.
b. Click the Show Wave icon to close the Wave view of the Dataflow window.
ModelSim SE Tutorial, v6.3a
June 2007
109
Debugging With The Dataflow Window
Displaying Hierarchy in the Dataflow Window
Displaying Hierarchy in the Dataflow Window
You can display connectivity in the Dataflow window using hierarchical instances. You enable
this by modifying the options prior to adding objects to the window.
1. Change options to display hierarchy.
a. Select Tools > Options from the Dataflow window menu bar.
b. Check Show Hierarchy and then click OK.
2. Add signal t_out to the Dataflow window.
a. Type add dataflow /top/p/t_out at the VSIM> prompt.
The Dataflow window will display t_out and all hierarchical instances (Figure 9-10).
Figure 9-10. Displaying Hierarchy in the Dataflow Window
110
ModelSim SE Tutorial, v6.3a
June 2007
Debugging With The Dataflow Window
Displaying Hierarchy in the Dataflow Window
Lesson Wrap-Up
This concludes this lesson. Before continuing we need to end the current simulation.
1. Type quit -sim at the VSIM> prompt.
ModelSim SE Tutorial, v6.3a
June 2007
111
Debugging With The Dataflow Window
Displaying Hierarchy in the Dataflow Window
112
ModelSim SE Tutorial, v6.3a
June 2007
Chapter 10
Viewing And Initializing Memories
Introduction
In this lesson you will learn how to view and initialize memories in ModelSim. ModelSim
defines and lists as memories any of the following:
•
reg, wire, and std_logic arrays
•
Integer arrays
•
Single dimensional arrays of VHDL enumerated types other than std_logic
Design Files for this Lesson
The ModelSim installation comes with Verilog and VHDL versions of the example design. The
files are located in the following directories:
Verilog – <install_dir>/examples/tutorials/verilog/memory
VHDL – <install_dir>/examples/tutorials/vhdl/memory
This lesson uses the Verilog version for the exercises. If you have a VHDL license, use the
VHDL version instead.
Related Reading
User’s Manual Section: Memory Panes.
Reference Manul commands: mem display, mem load, mem save, and radix.
Compile and Load the Design
1. Create a new directory and copy the tutorial files into it.
Start by creating a new directory for this exercise (in case other users will be working
with these lessons). Create the directory and copy all files from
<install_dir>/examples/tutorials/verilog/memory to the new directory.
If you have a VHDL license, copy the files in
<install_dir>/examples/tutorials/vhdl/memory instead.
2. Start ModelSim and change to the exercise directory.
ModelSim SE Tutorial, v6.3a
June 2007
113
Viewing And Initializing Memories
View a Memory and its Contents
If you just finished the previous lesson, ModelSim should already be running. If not,
start ModelSim.
a. Type vsim at a UNIX shell prompt or use the ModelSim icon in Windows.
If the Welcome to ModelSim dialog appears, click Close.
b. Select File > Change Directory and change to the directory you created in step 1.
3. Create the working library and compile the design.
a. Type vlib work at the ModelSim> prompt.
b. Verilog:
Type vlog sp_syn_ram.v dp_syn_ram.v ram_tb.v at the ModelSim> prompt.
VHDL:
Type vcom -93 sp_syn_ram.vhd dp_syn_ram.vhd ram_tb.vhd at the ModelSim>
prompt.
4. Load the design.
a. On the Library tab of the Main window Workspace, click the "+" icon next to the
work library.
b. Enter the following command at the ModelSim> prompt in the Transcript window.
vsim -voptargs="+acc" ram_tb
The -voptargs=”+acc” argument for the vsim command provides visibility into the
design for debugging purposes.
Note
By default, ModelSim optimizations are performed on all designs (see Optimizing
Designs with vopt).
View a Memory and its Contents
The Memories tab of the Main window lists all memories in the design (Figure 10-1) when the
design is loaded; with the range, depth, and width of each memory displayed.
114
ModelSim SE Tutorial, v6.3a
June 2007
Viewing And Initializing Memories
View a Memory and its Contents
Figure 10-1. Viewing the Memories Tab in the Main Window Workspace
VHDL: The radix for enumerated types is Symbolic. To change the radix to binary for the
purposes of this lesson, type the following command at the VSIM> prompt:
radix bin
1. Open a Memory instance to show its contents.
a. Double-click the /ram_tb/spram1/mem instance in the memories list to view its
contents in the MDI frame.
A mem tab is created in the MDI frame to display the memory contents. The data are
all X (0 in VHDL) since you have not yet simulated the design. The first column
(blue hex characters) lists the addresses (Figure 10-2), and the remaining columns
show the data values.
Figure 10-2. The mem Tab in the MDI Frame Shows Addresses and Data
b. Double-click instance /ram_tb/spram2/mem in the Memories tab of the Workspace,
This creates a new tab in the MDI frame called mem(1) that contains the addresses
and data for the spram2 instance. Each time you double-click a new memory
instance in the Workspace, a new tab is created for that instance in the MDI frame.
2. Simulate the design.
ModelSim SE Tutorial, v6.3a
June 2007
115
Viewing And Initializing Memories
View a Memory and its Contents
a. Click the run -all icon in the Main window.
b. Click the mem tab of the MDI frame to bring the /ram_tb/spram1/mem to the
foreground. The data fields now show values (Figure 10-3).
Figure 10-3. The Memory Display Updates with the Simulation
VHDL:
In the Transcript pane, you will see NUMERIC_STD warnings that can be ignored and
an assertion failure that is functioning to stop the simulation. The simulation itself has
not failed.
3. Change the address radix and the number of words per line for instance
/ram_tb/spram1/mem.
a. Right-click anywhere in the Memory Contents pane and select Properties.
b. The Properties dialog box opens (Figure 10-4).
116
ModelSim SE Tutorial, v6.3a
June 2007
Viewing And Initializing Memories
View a Memory and its Contents
Figure 10-4. Changing the Address Radix
c. For the Address Radix, select Decimal. This changes the radix for the addresses
only.
d. Select Words per line and type 1 in the field.
e. Click OK.
You can see the results of the settings in Figure 10-5. If the figure doesn’t match what
you have in your ModelSim session, check to make sure you set the Address Radix
rather than the Data Radix. Data Radix should still be set to Symbolic, the default.
Figure 10-5. New Address Radix and Line Length
ModelSim SE Tutorial, v6.3a
June 2007
117
Viewing And Initializing Memories
View a Memory and its Contents
Navigate Within the Memory
You can navigate to specific memory address locations, or to locations containing particular
data patterns. First, you will go to a specific address.
1. Use Goto to find a specific address.
a. Right-click anywhere in address column and select Goto (Figure 10-6).
The Goto dialog box opens in the data pane.
Figure 10-6. Goto Dialog
b. Type 30 in the Goto Address field.
c. Click OK.
The requested address appears in the top line of the window.
2. Edit the address location directly.
a. To quickly move to a particular address, do the following:
b. Double click address 38 in the address column.
c. Enter address 100 (Figure 10-7).
118
ModelSim SE Tutorial, v6.3a
June 2007
Viewing And Initializing Memories
View a Memory and its Contents
Figure 10-7. Editing the Address Directly
d. Press <Enter> on your keyboard.
The pane scrolls to that address.
3. Now, let’s find a particular data entry.
a. Right-click anywhere in the data column and select Find.
The Find in dialog box opens (Figure 10-8).
Figure 10-8. Searching for a Specific Data Value
b. Type 11111010 in the Find data: field and click Find Next.
The data scrolls to the first occurrence of that address. Click Find Next a few more
times to search through the list.
c. Click Close to close the dialog box.
ModelSim SE Tutorial, v6.3a
June 2007
119
Viewing And Initializing Memories
Export Memory Data to a File
Export Memory Data to a File
You can save memory data to a file that can be loaded at some later point in simulation.
1. Export a memory pattern from the /ram_tb/spram1/mem instance to a file.
a. Make sure /ram_tb/spram1/mem is open and selected in the MDI frame.
b. Select File > Export > Memory Data to bring up the Export Memory dialog box
(Figure 10-9).
Figure 10-9. Export Memory Dialog
c. For the Address Radix, select Decimal.
120
ModelSim SE Tutorial, v6.3a
June 2007
Viewing And Initializing Memories
Initialize a Memory
d. For the Data Radix, select Binary.
e. For the Line Wrap, set to 1 word per line.
f. Type data_mem.mem into the Filename field.
g. Click OK.
You can view the exported file in any editor.
Memory pattern files can be exported as relocatable files, simply by leaving out the
address information. Relocatable memory files can be loaded anywhere in a memory
because no addresses are specified.
2. Export a relocatable memory pattern file from the /ram_tb/spram2/mem instance.
a. Select the mem(1) tab in the MDI pane to see the data for the /ram_tb/spram2/mem
instance.
b. Right-click on the memory contents to open a popup menu and select Properties.
c. In the Properties dialog, set the Address Radix to Decimal; the Data Radix to
Binary; and the Line Wrap to 1 Words per Line. Click OK to accept the changes
and close the dialog.
d. Select File > Export > Memory Data to bring up the Export Memory dialog box.
e. For the Address Range, specify a Start address of 0 and End address of 250.
f. For the File Format, select MTI and click No addresses to create a memory pattern
that you can use to relocate somewhere else in the memory, or in another memory.
g. For Address Radix select Decimal, and for Data Radix select Binary.
h. For the Line Wrap, set 1 Words per Line.
i. Enter the file name as reloc.mem, then click OK to save the memory contents and
close the dialog. You will use this file for initialization in the next section.
Initialize a Memory
In ModelSim, it is possible to initialize a memory using one of three methods: from an exported
memory file, from a fill pattern, or from both.
First, let’s initialize a memory from a file only. You will use one you exported previously,
data_mem.mem.
1. View instance /ram_tb/spram3/mem.
a. Double-click the /ram_tb/spram3/mem instance in the Memories tab.
ModelSim SE Tutorial, v6.3a
June 2007
121
Viewing And Initializing Memories
Initialize a Memory
This will open a new tab – mem(2) – in the MDI frame to display the contents of
/ram_tb/spram3/mem. Scan these contents so you can identify changes once the
initialization is complete.
b. Right-click and select Properties to bring up the Properties dialog.
c. Change the Address Radix to Decimal, Data Radix to Binary, Line Wrap to 1
Words per Line, and click OK.
2. Initialize spram3 from a file.
a. Right-click anywhere in the data column and select Import to bring up the Import
Memory dialog box (Figure 10-10).
Figure 10-10. Import Memory Dialog
122
ModelSim SE Tutorial, v6.3a
June 2007
Viewing And Initializing Memories
Initialize a Memory
The default Load Type is File Only.
b. Type data_mem.mem in the Filename field.
c. Click OK.
The addresses in instance /ram_tb/spram3/mem are updated with the data from
data_mem.mem (Figure 10-11).
Figure 10-11. Initialized Memory from File and Fill Pattern
In this next step, you will experiment with importing from both a file and a fill pattern.
You will initialize spram3 with the 250 addresses of data you exported previously into
the relocatable file reloc.mem. You will also initialize 50 additional address entries with
a fill pattern.
3. Import the /ram_tb/spram3/mem instance with a relocatable memory pattern
(reloc.mem) and a fill pattern.
a. Right-click in the data column of the mem(2) tab and select Import to bring up the
Import Memory dialog box.
b. For Load Type, select Both File and Data.
c. For Address Range, select Addresses and enter 0 as the Start address and 300 as the
End address.
This means that you will be loading the file from 0 to 300. However, the reloc.mem
file contains only 251 addresses of data. Addresses 251 to 300 will be loaded with
the fill data you specify next.
d. For File Load, select the MTI File Format and enter reloc.mem in the Filename
field.
e. For Data Load, select a Fill Type of Increment.
f. In the Fill Data field, set the seed value of 0 for the incrementing data.
ModelSim SE Tutorial, v6.3a
June 2007
123
Viewing And Initializing Memories
Interactive Debugging Commands
g. Click OK.
h. View the data near address 250 by double-clicking on any address in the Address
column and entering 250.
You can see the specified range of addresses overwritten with the new data. Also, you
can see the incrementing data beginning at address 251 (Figure 10-12).
Figure 10-12. Data Increments Starting at Address 251
Now, before you leave this section, go ahead and clear the instances already being
viewed.
4. Right-click somewhere in the mem(2) pane and select Close All.
Interactive Debugging Commands
The memory panes can also be used interactively for a variety of debugging purposes. The
features described in this section are useful for this purpose.
1. Open a memory instance and change its display characteristics.
a. Double-click instance /ram_tb/dpram1/mem in the Memories tab.
b. Right-click in the memory contents pane and select Properties.
c. Change the Address and Data Radix to Hexadecimal.
d. Select Words per line and enter 2.
e. Click OK. The result should be as in Figure 10-13.
124
ModelSim SE Tutorial, v6.3a
June 2007
Viewing And Initializing Memories
Interactive Debugging Commands
Figure 10-13. Original Memory Content
2. Initialize a range of memory addresses from a fill pattern.
a. Right-click in the data column of /ram_tb/dpram1/mem contents pane and select
Change to open the Change Memory dialog (Figure 10-14).
Figure 10-14. Changing Memory Content for a Range of Addresses
b. Select Addresses and enter the start address as 0x00000006 and the end address as
0x00000009. The "0x" hex notation is optional.
c. Select Random as the Fill Type.
d. Enter 0 as the Fill Data, setting the seed for the Random pattern.
e. Click OK.
The data in the specified range are replaced with a generated random fill pattern
(Figure 10-15).
ModelSim SE Tutorial, v6.3a
June 2007
125
Viewing And Initializing Memories
Interactive Debugging Commands
Figure 10-15. Random Content Generated for a Range of Addresses
3. Change contents by highlighting.
You can also change data by highlighting them in the Address Data pane.
a. Highlight the data for the addresses 0x0000000c:0x0000000e, as shown in
Figure 10-16.
Figure 10-16. Changing Memory Contents by Highlighting
b. Right-click the highlighted data and select Change.
This brings up the Change memory dialog box (Figure 10-17). Note that the
Addresses field is already populated with the range you highlighted.
126
ModelSim SE Tutorial, v6.3a
June 2007
Viewing And Initializing Memories
Interactive Debugging Commands
Figure 10-17. Entering Data to Change
c. Select Value as the Fill Type.
d. Enter the data values into the Fill Data field as follows: 34 35 36
e. Click OK.
The data in the address locations change to the values you entered (Figure 10-18).
Figure 10-18. Changed Memory Contents for the Specified Addresses
4. Edit data in place.
To edit only one value at a time, do the following:
a. Double click any value in the Data column.
b. Enter the desired value and press <Enter> on your keyboard.
If you needed to cancel the edit function, press the <Esc> key on your keyboard.
ModelSim SE Tutorial, v6.3a
June 2007
127
Viewing And Initializing Memories
Interactive Debugging Commands
Lesson Wrap-Up
This concludes this lesson. Before continuing we need to end the current simulation.
1. Select Simulate > End Simulation. Click Yes.
128
ModelSim SE Tutorial, v6.3a
June 2007
Chapter 11
Analyzing Performance With The Profiler
Introduction
The Profiler identifies the percentage of simulation time spent in each section of your code as
well as the amount of memory allocated to each function and instance. With this information,
you can identify bottlenecks and reduce simulation time by optimizing your code. Users have
reported up to 75% reductions in simulation time after using the Profiler.
This lesson introduces the Profiler and shows you how to use the main Profiler commands to
identify performance bottlenecks.
Note
The functionality described in this tutorial requires a profile license feature in your
ModelSim license file. Please contact your Mentor Graphics sales representative if you
currently do not have such a feature.
Design Files for this Lesson
The example design for this lesson consists of a finite state machine which controls a behavioral
memory. The testbench test_sm provides stimulus.
The ModelSim installation comes with Verilog and VHDL versions of this design. The files are
located in the following directories:
Verilog – <install_dir>/examples/tutorials/verilog/profiler
VHDL – <install_dir>/examples/tutorials/vhdl/profiler_sm_seq
This lesson uses the Verilog version for the exercises. If you have a VHDL license, use the
VHDL version instead.
Related Reading
User’s Manual Chapters: Profiling Performance and Memory Use and Tcl and Macros (DO
Files).
Compile and Load the Design
1. Create a new directory and copy the tutorial files into it.
ModelSim SE Tutorial, v6.3a
June 2007
129
Analyzing Performance With The Profiler
Start by creating a new directory for this exercise (in case other users will be working
with these lessons). Create the directory and copy all files from
<install_dir>/examples/tutorials/verilog/profiler to the new directory.
If you have a VHDL license, copy the files in
<install_dir>/examples/tutorials/vhdl/profiler_sm_seq instead.
2. Start ModelSim and change to the exercise directory.
If you just finished the previous lesson, ModelSim should already be running. If not,
start ModelSim.
a. Type vsim at a UNIX shell prompt or use the ModelSim icon in Windows.
If the Welcome to ModelSim dialog appears, click Close.
b. Select File > Change Directory and change to the directory you created in step 1.
3. Create the work library.
a. Type vlib work at the ModelSim> prompt.
4. Compile the design files.
a. Verilog: Type vlog test_sm.v sm_seq.v sm.v beh_sram.v at the ModelSim>
prompt.
VHDL: Type vcom -93 sm.vhd sm_seq.vhd sm_sram.vhd test_sm.vhd at the
ModelSim> prompt.
5. Load the top-level design unit.
a. Enter vsim -voptargs="+acc" test_sm at the ModelSim> prompt of the Transcript
pane.
The -voptargs=”+acc” argument for the vsim command provides visibility into the
design for debugging purposes.
Note
By default, ModelSim optimizations are performed on all designs (see Optimizing
Designs with vopt).
Run the Simulation
You will now run the simulation and view the profiling data.
1. Enable the statistical sampling profiler.
a. Select Tools > Profile > Performance or click the Performance Profiling icon in
the toolbar.
130
ModelSim SE Tutorial, v6.3a
June 2007
Analyzing Performance With The Profiler
This must be done prior to running the simulation. ModelSim is now ready to collect
performance data when the simulation is run.
2. Run the simulation.
a. Type run 1 ms at the VSIM> prompt.
Notice that the number of samples taken is displayed both in the Transcript and the
Main window status bar (Figure 11-1). (Your results may not match those in the
figure.) Also, ModelSim reports the percentage of samples that were taken in your
design code (versus in internal simulator code).
Figure 11-1. Sampling Reported in the Transcript
3. Display the statistical performance data in the Profile pane.
a. Select View > Profiling > Profile.
The Profile pane (you may need to increase its size) displays three tab-selectable
views of the data–Ranked, Call Tree, and Structural (Figure 11-2). (Your results
may not match those in the figure.)
Figure 11-2. The Profile Window
ModelSim SE Tutorial, v6.3a
June 2007
131
Analyzing Performance With The Profiler
The table below gives a description of the columns in each tab. For more details on
each pane, refer to the section Profile Panes in the User’s Manual.
Table 11-1. Columns in the Profile Window
Column
Description
Under(raw)
the raw number of Profiler samples collected during the
execution of a function, including all support routines under
that function; or, the number of samples collected for an
instance, including all instances beneath it in the structural
hierarchy
In(raw)
the raw number of Profiler samples collected during a
function or instance
Under(%)
the ratio (as a percentage) of the samples collected during the
execution of a function and all support routines under that
function to the total number of samples collected; or, the ratio
of the samples collected during an instance, including all
instances beneath it in the structural hierarchy, to the total
number of samples collected
In(%)
the ratio (as a percentage) of the total samples collected
during a function or instance
%Parent (not in the the ratio (as a percentage) of the samples collected during the
Ranked view)
execution of a function or instance to the samples collected in
the parent function or instance
Data in the Ranked view is sorted by default from highest to lowest percentage in the
In(%) column. In the Call Tree and Structural views, data is sorted (by default)
according to the Under(%) column. You can click the heading of any column to sort
data by that column.
The "Tcl_*" entries are functions that are part of the internal simulation code. They
are not directly related to your HDL code.
b. Click the Call Tree tab to view the profile data in a hierarchical, function-call tree
display.
The results differ between the Verilog and VHDL versions of the design. In Verilog,
line 105 (test_sm.v:105) is taking the majority of simulation time. In VHDL,
test_sm.vhd:203 and sm.vhd:93 are taking the majority of the time.
132
ModelSim SE Tutorial, v6.3a
June 2007
Analyzing Performance With The Profiler
Note
Your results may look slightly different as a result of the computer you’re using and
different system calls that occur during the simulation. Also, the line number reported
may be one or two lines off in the actual source file. This happens due to how the
stacktrace is decoded on different platforms.
c. Verilog: Right-click test_sm.v:105 and select Expand All from popup menu. This
expands the hierarchy of test_sm.v:105 and displays the functions that call it
(Figure 11-3).
VHDL: Right-click test_sm.vhd:203 and select Expand All from popup menu. This
expands the hierarchy of test_sm.vhd:203 and displays the functions that call it.
Figure 11-3. Expand the Hierarchical Function Call Tree
4. View the source code of a line that is using a lot of simulation time.
a. Verilog: Double-click test_sm.v:105. The Source window opens in the MDI frame
with line 105 displayed (Figure 11-4).
VHDL: Double-click test_sm.vhd:203. The Source window opens in the MDI frame
with line 203 displayed.
ModelSim SE Tutorial, v6.3a
June 2007
133
Analyzing Performance With The Profiler
View Profile Details
Figure 11-4. The Source Window Showing a Line from the Profile Data
View Profile Details
The Profile Details pane increases visibility into simulation performance. Right-clicking any
function in the Ranked or Call Tree views in the Profile pane opens a popup menu that includes
a Function Usage selection. When you select Function Usage, the Profile Details pane opens
and displays all instances that use the selected function.
1. View the Profile Details of a function in the Call Tree view.
a. Right-click the Tcl_Close function and select Function Usage from the popup
menu.
The Profile Details pane displays all instances using function Tcl_Close
(Figure 11-5). The statistical performance data show how much simulation time is
used by Tcl_Close in each instance.
Figure 11-5. Profile Details of the Function Tcl_Close
When you right-click a selected function or instance in the Structural pane, the popup menu
displays either a Function Usage selection or an Instance Usage selection, depending on the
object selected.
1. View the Profile Details of an instance in the Structural view.
a. Select the Structural tab to change to the Structural view.
134
ModelSim SE Tutorial, v6.3a
June 2007
Analyzing Performance With The Profiler
Filtering and Saving the Data
b. Right-click test_sm and select Expand All from the popup menu.
c. Verilog: Right-click the sm_0 instance and select Instance Usage from the popup
menu. The Profile Details shows all instances with the same definition as
/test_sm/sm_seq0/sm_0 (Figure 11-6).
Figure 11-6. Profile Details of Function sm_0
VHDL: Right-click the dut instance and select Instance Usage from the popup
menu. The Profile Details shows all instances with the same definition as
/test_sm/dut.
Filtering and Saving the Data
As a last step, you will filter out lines that take less than 2% of the simulation time using the
Profiler toolbar, and then save the report data to a text file.
1. Filter lines that take less than 2% of the simulation time.
a. Click the Call Tree tab of the Profile pane.
b. Right-click somewhere in the pane and select Collapse All.
c. Change the Under(%) field to 2 (Figure 11-7).
Figure 11-7. The Profiler Toolbar
If you do not see these toolbar buttons, right-click in a blank area of the toolbar and
select Profile.
d. Click the Refresh Profile Data button.
ModelSim filters the list to show only those lines that take 2% or more of the
simulation time (Figure 11-8).
ModelSim SE Tutorial, v6.3a
June 2007
135
Analyzing Performance With The Profiler
Filtering and Saving the Data
Figure 11-8. The Filtered Profile Data
2. Save the report.
a. Click the save icon in the Profiler toolbar.
b. In the Profile Report dialog (Figure 11-9), select the Call Tree Type.
Figure 11-9. The Profile Report Dialog
c. In the Performance/Memory data section select Default (data collected).
d. Specify the Cutoff percent as 2%.
e. Select Write to file and type calltree.rpt in the file name field.
f. View file is selected by default when you select Write to file. Leave it selected.
g. Click OK.
136
ModelSim SE Tutorial, v6.3a
June 2007
Analyzing Performance With The Profiler
Filtering and Saving the Data
The calltree.rpt report file will open automatically in Notepad (Figure 11-10).
Figure 11-10. The calltree.rpt Report
You can also output this report from the command line using the profile report
command. See the ModelSim Command Reference for details.
Lesson Wrap-Up
This concludes this lesson. Before continuing we need to end the current simulation.
Select Simulate > End Simulation. Click Yes.
ModelSim SE Tutorial, v6.3a
June 2007
137
Analyzing Performance With The Profiler
Filtering and Saving the Data
138
ModelSim SE Tutorial, v6.3a
June 2007
Chapter 12
Simulating With Code Coverage
Introduction
ModelSim Code Coverage gives you graphical and report file feedback on which executable
statements, branches, conditions, and expressions in your source code have been executed. It
also measures bits of logic that have been toggled during execution.
Note
The functionality described in this lesson requires a coverage license feature in your
ModelSim license file. Please contact your Mentor Graphics sales representative if you
currently do not have such a feature.
Design Files for this Lesson
The sample design for this lesson consists of a finite state machine which controls a behavioral
memory. The testbench test_sm provides stimulus.
The ModelSim installation comes with Verilog and VHDL versions of this design. The files are
located in the following directories:
Verilog – <install_dir>/examples/tutorials/verilog/coverage
VHDL – <install_dir>/examples/tutorials/vhdl/coverage
This lesson uses the Verilog version in the examples. If you have a VHDL license, use the
VHDL version instead. When necessary, we distinguish between the Verilog and VHDL
versions of the design.
Related Reading
User’s Manual Chapter: Coverage.
Compile the Design
Enabling Code Coverage is a two step process. First, you identify which coverage statistics you
want and compile the design files. Second, you load the design and tell ModelSim to produce
those statistics.
1. Create a new directory and copy the tutorial files into it.
ModelSim SE Tutorial, v6.3a
June 2007
139
Simulating With Code Coverage
Start by creating a new directory for this exercise (in case other users will be working
with these lessons). Create the directory and copy all files from
<install_dir>/modeltech/examples/tutorials/verilog/coverage to the new directory.
If you have a VHDL license, copy the files in
<install_dir>/modeltech/examples/tutorials/vhdl/coverage instead.
2. Start ModelSim and change to the exercise directory.
If you just finished the previous lesson, ModelSim should already be running. If not,
start ModelSim.
a. Type vsim at a UNIX shell prompt or use the ModelSim icon in Windows.
If the Welcome to ModelSim dialog appears, click Close.
b. Select File > Change Directory and change to the directory you created in step 1.
3. Create the working library.
a. Type vlib work at the ModelSim> prompt.
4. Compile the design files.
a. For Verilog – Type vlog -cover bcsxf sm.v sm_seq.v beh_sram.v test_sm.v at the
ModelSim> prompt.
For VHDL – Type vcom -cover bcsxf sm.vhd sm_seq.vhd sm_sram.vhd
test_sm.vhd at the ModelSim> prompt.
The -cover bcsxf argument instructs ModelSim to collect branch, condition,
statement, extended toggle, and finite state machine coverage statistics. Refer to the
section Enabling Code Coverage in the User’s Manual for more information on the
available coverage types.
Load and Run the Design
1. Load the design.
Figure 12-1. Enable Code Coverage
a. Enter vsim -voptargs="+acc" -coverage test_sm at the ModelSim> prompt of the
Transcript pane.
The -voptargs=”+acc” argument for the vsim command provides visibility into the
design for debugging purposes.
140
ModelSim SE Tutorial, v6.3a
June 2007
Simulating With Code Coverage
Note
By default, ModelSim optimizations are performed on all designs (see Optimizing
Designs with vopt).
2. Run the simulation
a. Type run 1 ms at the VSIM> prompt.
When you load a design with Code Coverage enabled, ModelSim adds several columns to the
Files and sim tabs in the Workspace (Figure 12-2). Your results may not match those shown in
the figure.
Figure 12-2. Code Coverage Columns in the Main Window Workspace
By default, ModelSim also displays three Code Coverage panes in the Main window:
•
Missed Coverage
Displays the selected file’s un-executed statements, branches, conditions, expressions
and signals that have not toggled (Figure 12-3). It also includes missed states and
transitions in finite state machines.
Figure 12-3. Missed Coverage Pane
ModelSim SE Tutorial, v6.3a
June 2007
141
Simulating With Code Coverage
•
Instance Coverage
Displays statement, branch, condition, expression and toggle coverage statistics for each
instance in a flat, non-hierarchical view (Figure 12-4).
Figure 12-4. Instance Coverage Pane
•
Details
Shows coverage details for the item selected in the Missed Coverage pane. Details can
include truth tables for conditions and expressions, or toggle details (Figure 12-5).
Figure 12-5. Details Pane
Another coverage-related pane is the Current Exclusions pane. Select View > Coverage
> Current Exclusions to display that pane.
•
Current Exclusions
Lists all files and lines that are excluded from coverage statistics (Figure 12-6). See
Excluding Lines and Files from Coverage Statistics for more information.
142
ModelSim SE Tutorial, v6.3a
June 2007
Simulating With Code Coverage
Coverage Statistics in the Main window
Figure 12-6. Current Exclusions Pane
All coverage panes can be re-sized, rearranged, and undocked to make the data more easily
viewable. To resize a pane, click-and-drag on the top or bottom border. To move a pane, clickand-drag on the double-line to the right of the pane name. To undock a pane you can select it
then drag it out of the Main window, or you can click the Dock/Undock Pane button in the
header bar (top right). To redock the pane, click the Dock/Undock Pane button again.
We will look at these panes more closely in the next exercise. For complete details on each
pane, Refer to the section Code Coverage Panes in the User’s Manual.
Coverage Statistics in the Main window
Let’s take a look at the data in these various panes.
1. View statistics in the Workspace pane.
a. Select the sim tab in the Workspace and scroll to the right.
Coverage statistics are shown for each object in the design.
b. Select the Files tab in the Workspace and scroll to the right.
Each file in the design shows summary statistics for statements, branches,
conditions, expressions, and states.
c. Click the right-mouse button on any column name and select an object from the list
(Figure 12-7).
ModelSim SE Tutorial, v6.3a
June 2007
143
Simulating With Code Coverage
Coverage Statistics in the Main window
Figure 12-7. Right-click a Column Heading to Hide or Show Columns
All checked columns are displayed. Unchecked columns are hidden. The status of
every column, whether displayed or hidden, is persistent between invocations of
ModelSim.
2. View statistics in the Missed Coverage pane (see Figure 12-3 above).
a. Select different files from the Files tab of the Workspace. The Missed Coverage
pane updates to show statistics for the selected file.
b. Select any entry in the Statement tab to display that line in the Source window.
3. View statistics in the Details pane.
a. Select the Toggle tab in the Missed Coverage pane.
If the Toggle tab isn’t visible, you can do one of two things: 1) widen the pane by
clicking-and-dragging on the pane border; 2) if your mouse has a middle button,
click-and-drag the tabs with the middle mouse button.
144
ModelSim SE Tutorial, v6.3a
June 2007
Simulating With Code Coverage
Coverage Statistics in the Source Window
b. Select any object in the Toggle tab to see details in the Details pane (see Figure 12-5
above).
4. View instance coverage statistics.
The Instance Coverage pane displays coverage statistics for each instance in a flat, nonhierarchical view (see Figure 12-4 above). Select any instance in the Instance Coverage
pane to see its source code displayed in the Source window.
Coverage Statistics in the Source Window
In the previous section you saw that the Source window and the Main window coverage panes
are linked. You can select objects in the Main window panes to view the underlying source code
in the Source window. Furthermore, the Source window contains statistics of its own.
1. View coverage statistics for test_sm in the Source window.
a. Make sure test_sm is selected in the sim tab of the Workspace.
In the Statement tab of the Missed Coverage pane, expand test_sm.v if necessary and
select any line.
b. The Source window opens in the MDI frame with the line you selected highlighted
(Figure 12-8).
Figure 12-8. Coverage Statistics in the Source Window
c. Switch to the Source window.
The table below describes the various icons.
Table 12-1. Coverage Icons in the Source Window
Icon
Description
green checkmark
indicates a statement that has been executed
ModelSim SE Tutorial, v6.3a
June 2007
145
Simulating With Code Coverage
Coverage Statistics in the Source Window
Table 12-1. Coverage Icons in the Source Window
Icon
Description
red X
indicates that a statement in that line has not
been executed (zero hits)
green E
indicates a line that has been excluded from
code coverage statistics
red XT or XF
indicates that a true or false branch
(respectively) of a conditional statement has
not been executed
d. Hover your mouse pointer over a line of executable code with a green checkmark in
the Hits or BC columns.
The icons change to numbers that indicate how many times the statements and
branches in that line were executed (Figure 12-9).
Figure 12-9. Coverage Numbers Shown by Hovering the Mouse Pointer
In this case, the statement in line 22 was executed 28,119 times, the true branch of
the condition in this line executed 9,375 times, and the false branch executed 18,744
times.
e. Select Tools > Code Coverage > Show coverage numbers.
The icons are replaced by execution counts on every line. An ellipsis (...) is
displayed whenever there are multiple statements on the line. Hover the mouse
pointer over a statement to see the count for that statement.
f. Select Tools > Code Coverage > Show coverage numbers again to uncheck the
selection and return to icon display.
146
ModelSim SE Tutorial, v6.3a
June 2007
Simulating With Code Coverage
Toggle Statistics in the Objects Pane
Toggle Statistics in the Objects Pane
Toggle coverage counts each time a logic node transitions from one state to another. Earlier in
the lesson you enabled six-state toggle coverage by using the -cover x argument with the vlog
or vcom command. Refer to the section Toggle Coverage in the User’s Manual for more
information.
1. View toggle data in the Objects pane of the Main window.
a. Select test_sm in the sim tab of the Main window.
b. If the Objects pane isn’t open already, select View > Objects. Scroll to the right to
see the various toggle coverage columns, or undock and expand the pane until all
columns show (Figure 12-10).
Figure 12-10. Toggle Coverage in the Objects Pane
ModelSim SE Tutorial, v6.3a
June 2007
147
Simulating With Code Coverage
Excluding Lines and Files from Coverage Statistics
Excluding Lines and Files from Coverage
Statistics
ModelSim allows you to exclude lines and files from code coverage statistics. You can set
exclusions with the GUI, with a text file called an "exclusion filter file", or with "pragmas" in
your source code. Pragmas are statements that instruct ModelSim to not collect statistics for the
bracketed code. Refer to the section Excluding Objects from Coverage in the User’s Manual for
more details on exclusion filter files and pragmas.
1. Display the Current Exclusions pane if necessary.
a. Select View > Coverage > Current Exclusions.
2. Exclude a line via the Missed Coverage pane.
a. Right click a line in the Missed Coverage pane and select Exclude Selection. (You
can also exclude the selection for the current instance only by selecting Exclude
Selection For Instance <inst_name>.) The line will appear in the Current Exclusions
pane.
3. Exclude an entire file.
a. In the Files tab of the Workspace, locate sm.v (or sm.vhd if you are using the VHDL
example).
b. Right-click the file name and select Code Coverage > Exclude Selected File
(Figure 12-11).
Figure 12-11. Excluding a File Using Menus in the Workspace
The file is added to the Current Exclusions pane.
4. Cancel the exclusion of sm.v.
148
ModelSim SE Tutorial, v6.3a
June 2007
Simulating With Code Coverage
Creating Code Coverage Reports
a. Right-click sm.v in the Current Exclusions pane and select Cancel Selected
Exclusions.
Creating Code Coverage Reports
You can create reports on the coverage statistics using either the menus or by entering
commands in the Transcript pane. The reports are output to a text file regardless of which
method you use.
To create coverage reports via the menus, do one of the following:
•
select Tools > Code Coverage > Reports from the Main window menu
•
right-click any object in the sim or Files tab of the Workspace and select Code
Coverage > Code Coverage Reports
•
right-click any object in the Instance Coverage pane and select Code coverage reports
from the context menu
1. Create a report on all instances.
a. Select Tools > Code Coverage > Reports from the Main window toolbar.
This opens the Coverage Report dialog (Figure 12-12).
ModelSim SE Tutorial, v6.3a
June 2007
149
Simulating With Code Coverage
Creating Code Coverage Reports
Figure 12-12. Coverage Report Dialog
b. Make sure Report on all instances and No Filtering are selected and then click OK.
ModelSim creates a file report.txt in the current directory and displays the report in
Notepad.
c. Close Notepad when you have finished viewing the report.
2. Create a summary report on all design files from the Transcript pane.
a. Type coverage report -file cover.txt at the VSIM> prompt.
b. Type notepad cover.txt at the VSIM> prompt to view the report.
c. Close Notepad when you have finished viewing the report.
150
ModelSim SE Tutorial, v6.3a
June 2007
Simulating With Code Coverage
Creating Code Coverage Reports
Lesson Wrap-Up
This concludes this lesson. Before continuing we need to end the current simulation.
1. Type quit -sim at the VSIM> prompt.
ModelSim SE Tutorial, v6.3a
June 2007
151
Simulating With Code Coverage
Creating Code Coverage Reports
152
ModelSim SE Tutorial, v6.3a
June 2007
Chapter 13
Comparing Waveforms
Introduction
Waveform Compare computes timing differences between test signals and reference signals.
The general procedure for comparing waveforms has four main steps:
1. Select the simulations or datasets to compare
2. Specify the signals or regions to compare
3. Run the comparison
4. View the comparison results
In this exercise you will run and save a simulation, edit one of the source files, run the
simulation again, and finally compare the two runs.
Note
The functionality described in this tutorial requires a compare license feature in your
ModelSim license file. Please contact your Mentor Graphics sales representative if you
currently do not have such a feature.
Design Files for this Lesson
The sample design for this lesson consists of a finite state machine which controls a behavioral
memory. The testbench test_sm provides stimulus.
The ModelSim installation comes with Verilog and VHDL versions of this design. The files are
located in the following directories:
Verilog – <install_dir>/examples/tutorials/verilog/compare
VHDL – <install_dir>/examples/tutorials/vhdl/compare
This lesson uses the Verilog version in the examples. If you have a VHDL license, use the
VHDL version instead. When necessary, we distinguish between the Verilog and VHDL
versions of the design.
Related Reading
User’s Manual sections: Waveform Compare and WLF Files (Datasets) and Virtuals.
ModelSim SE Tutorial, v6.3a
June 2007
153
Comparing Waveforms
Creating the Reference Dataset
Creating the Reference Dataset
The reference dataset is the .wlf file that the test dataset will be compared against. It can be a
saved dataset, the current simulation dataset, or any part of the current simulation dataset.
In this exercise you will use a DO file to create the reference dataset.
1. Create a new directory and copy the tutorial files into it.
Start by creating a new directory for this exercise (in case other users will be working
with these lessons). Create the directory and copy all files from
<install_dir>/modeltech/examples/tutorials/verilog/compare to the new directory.
If you have a VHDL license, copy the files in
<install_dir>/modeltech/examples/tutorials/vhdl/compare instead.
2. Start ModelSim and change to the exercise directory.
If you just finished the previous lesson, ModelSim should already be running. If not,
start ModelSim.
a. Type vsim at a UNIX shell prompt or use the ModelSim icon in Windows.
If the Welcome to ModelSim dialog appears, click Close.
b. Select File > Change Directory and change to the directory you created in step 1.
3. Execute the lesson DO file.
a. Type do gold_sim.do at the ModelSim> prompt.
The DO file does the following:
•
Creates and maps the work library
•
Compiles the Verilog and VHDL files
•
Loads the simulator with optimizations turned off (vsim -novopt)
•
Runs the simulation and saves the results to a dataset named gold.wlf
•
Quits the simulation
Feel free to open the DO file and look at its contents.
Creating the Test Dataset
The test dataset is the .wlf file that will be compared against the reference dataset. Like the
reference dataset, the test dataset can be a saved dataset, the current simulation dataset, or any
part of the current simulation dataset.
154
ModelSim SE Tutorial, v6.3a
June 2007
Comparing Waveforms
Creating the Test Dataset
To simplify matters, you will create the test dataset from the simulation you just ran. However,
you will edit the testbench to create differences between the two runs.
Verilog
1. Edit the testbench.
a. Select File > Open and open test_sm.v.
b. Scroll to line 122, which looks like this:
@ (posedge clk) wt_wd('h10,'haa);
c. Change the data pattern ’aa’ to ’ab’:
@ (posedge clk) wt_wd('h10,'hab);
d. Select File > Save to save the file.
2. Compile the revised file and rerun the simulation.
a. Type do sec_sim.do at the ModelSim> prompt.
The DO file does the following:
•
Re-compiles the testbench
•
Adds waves to the Wave window
•
Loads the simulator with optimizations turned off (vsim -novopt)
•
Runs the simulation
VHDL
1. Edit the testbench.
a. Select File > Open and open test_sm.vhd.
b. Scroll to line 151, which looks like this:
wt_wd ( 16#10#, 16#aa#, clk, into );
c. Change the data pattern ’aa’ to ’ab’:
wt_wd ( 16#10#, 16#ab#, clk, into );
d. Select File > Save to save the file.
2. Compile the revised file and rerun the simulation.
a. Type do sec_sim.do at the ModelSim> prompt.
The DO file does the following:
•
Re-compiles the testbench
ModelSim SE Tutorial, v6.3a
June 2007
155
Comparing Waveforms
Comparing the Simulation Runs
•
Adds waves to the Wave window
•
Loads the simulator with optimizations turned off (vsim -novopt)
•
Runs the simulation
Comparing the Simulation Runs
ModelSim includes a Comparison Wizard that walks you through the process. You can also
configure the comparison manually with menu or command line commands.
1. Create a comparison using the Comparison Wizard.
a. Select Tools > Waveform Compare > Comparison Wizard.
b. Click the Browse button and select gold.wlf as the reference dataset (Figure 13-1).
Recall that gold.wlf is from the first simulation run.
Figure 13-1. First dialog of the Waveform Comparison Wizard
c. Leaving the test dataset set to Use Current Simulation, click Next.
d. Select Compare All Signals in the second dialog (Figure 13-2) and click Next.
Figure 13-2. Second dialog of the Waveform Comparison Wizard
156
ModelSim SE Tutorial, v6.3a
June 2007
Comparing Waveforms
Viewing Comparison Data
e. In the next three dialogs, click Next, Compute Differences Now, and Finish,
respectively.
ModelSim performs the comparison and displays the compared signals in the Wave
window.
Viewing Comparison Data
Comparison data is displayed in the Workspace, Transcript, Objects, Wave and List window
panes. Compare objects are denoted by a yellow triangle.
The Compare tab in the Workspace pane shows the region that was compared;
The Transcript pane shows the number of differences found between the reference and test
datasets;
The Objects pane shows comparison differences when you select the comparison object in the
Compare tab of the Workspace (Figure 13-3).
Figure 13-3. Comparison information in the Workspace and Objects panes
Comparison Data in the Wave window
The Wave window displays comparison information as follows:
•
timing differences are denoted by a red X’s in the pathnames column (Figure 13-4),
ModelSim SE Tutorial, v6.3a
June 2007
157
Comparing Waveforms
Viewing Comparison Data
Figure 13-4. Comparison objects in the Wave window
•
red areas in the waveform view show the location of the timing differences,
•
red lines in the scrollbars also show the location of timing differences,
•
and, annotated differences are highlighted in blue.
The Wave window includes six compare icons that let you quickly jump between differences
(Figure 13-5).
Figure 13-5. The compare icons
From left to right, the icons do the following: find first difference, find previous annotated
difference, find previous difference, find next difference, find next annotated difference, find
last difference. Use these icons to move the selected cursor.
The compare icons cycle through differences on all signals. To view differences in only a
selected signal, use <tab> and <shift> - <tab>.
Comparison Data in the List Window
You can also view the results of your waveform comparison in the List window.
1. Add comparison data to the List window.
158
ModelSim SE Tutorial, v6.3a
June 2007
Comparing Waveforms
Saving and Reloading Comparison Data
a. Select View > List from the Main window menu bar.
b. Drag the test_sm comparison object from the compare tab of the Main window to the
List window.
c. Scroll down the window.
Differences are noted with yellow highlighting (Figure 13-6). Differences that have
been annotated have red highlighting.
Figure 13-6. Compare differences in the List window
Saving and Reloading Comparison Data
You can save comparison data for later viewing, either in a text file or in files that can be
reloaded into ModelSim.
To save comparison data so it can be reloaded into ModelSim, you must save two files. First,
you save the computed differences to one file; next, you save the comparison configuration
rules to a separate file. When you reload the data, you must have the reference dataset open.
1. Save the comparison data to a text file.
a. In the Main window, select Tools > Waveform Compare > Differences > Write
Report.
ModelSim SE Tutorial, v6.3a
June 2007
159
Comparing Waveforms
Saving and Reloading Comparison Data
b. Click Save.
This saves compare.txt to the current directory.
c. Type notepad compare.txt at the VSIM> prompt to display the report
(Figure 13-7).
Figure 13-7. Coverage data saved to a text file
d. Close Notepad when you have finished viewing the report.
2. Save the comparison data in files that can be reloaded into ModelSim.
a. Select Tools > Waveform Compare > Differences > Save.
b. Click Save.
This saves compare.dif to the current directory.
c. Select Tools > Waveform Compare > Rules > Save.
d. Click Save.
This saves compare.rul to the current directory.
160
ModelSim SE Tutorial, v6.3a
June 2007
Comparing Waveforms
Saving and Reloading Comparison Data
e. Select Tools > Waveform Compare > End Comparison.
3. Reload the comparison data.
a. With the sim tab of the Workspace active, select File > Open.
b. Change the Files of Type to Log Files (*.wlf) (Figure 13-8).
Figure 13-8. Displaying Log Files in the Open dialog
c. Double-click gold.wlf to open the dataset.
d. Select Tools > Waveform Compare > Reload.
Since you saved the data using default file names, the dialog should already have the
correct Waveform Rules and Waveform Difference files specified (Figure 13-9).
Figure 13-9. Reloading saved comparison data
e. Click OK.
The comparison reloads. You can drag the comparison object to the Wave or List
window to view the differences again.
Lesson wrap-Up
This concludes this lesson. Before continuing we need to end the current simulation and close
the gold.wlf dataset.
1. Type quit -sim at the VSIM> prompt.
2. Type dataset close gold at the ModelSim> prompt.
ModelSim SE Tutorial, v6.3a
June 2007
161
Comparing Waveforms
Saving and Reloading Comparison Data
162
ModelSim SE Tutorial, v6.3a
June 2007
Chapter 14
Automating Simulation
Introduction
Aside from executing a couple of pre-existing DO files, the previous lessons focused on using
ModelSim in interactive mode: executing single commands, one after another, via the GUI
menus or Main window command line. In situations where you have repetitive tasks to
complete, you can increase your productivity with DO files.
DO files are scripts that allow you to execute many commands at once. The scripts can be as
simple as a series of ModelSim commands with associated arguments, or they can be full-blown
Tcl programs with variables, conditional execution, and so forth. You can execute DO files
from within the GUI or you can run them from the system command prompt without ever
invoking the GUI.
Note
This lesson assumes that you have added the <install_dir>/modeltech/<platform>
directory to your PATH. If you did not, you will need to specify full paths to the tools
(i.e., vlib, vmap, vlog, vcom, and vsim) that are used in the lesson.
Related Reading
User’s Manual Chapter: Tcl and Macros (DO Files).
Practical Programming in Tcl and Tk, Brent B. Welch, Copyright 1997
Creating a Simple DO File
Creating DO files is as simple as typing the commands in a text file. Alternatively, you can save
the Main window transcript as a DO file. In this exercise, you will use the transcript to create a
DO file that adds signals to the Wave window, provides stimulus to those signals, and then
advances the simulation.
1. Load the test_counter design unit.
a. If necessary, start ModelSim.
b. Change to the directory you created in Lesson 2.
c. In the Library tab of the Workspace pane, double-click the test_counter design unit
to load it.
ModelSim SE Tutorial, v6.3a
June 2007
163
Automating Simulation
Running in Command-Line Mode
2. Enter commands to add signals to the Wave window, force signals, and run the
simulation.
a. Select File > New > Source > Do to create a new DO file.
b. Enter the following commands into the source window:
add wave count
add wave clk
add wave reset
force -freeze clk 0 0, 1 {50 ns} -r 100
force reset 1
run 100
force reset 0
run 300
force reset 1
run 400
force reset 0
run 200
3. Save the file.
a. Select File > Save As.
b. Type sim.do in the File name: field and save it to the current directory.
4. Load the simulation again and use the DO file.
a. Enter quit -sim at the VSIM> prompt.
b. Enter vsim -voptargs="+acc" test_counter at the ModelSim> prompt.
The -voptargs=”+acc” argument for the vsim command provides visibility into the
design for debugging purposes.
Note
By default, ModelSim optimizations are performed on all designs (see Optimizing
Designs with vopt).
c. Enter do sim.do at the VSIM> prompt.
ModelSim executes the saved commands and draws the waves in the Wave window.
5. When you are done with this exercise, select File > Quit to quit ModelSim.
Running in Command-Line Mode
We use the term "command-line mode" to refer to simulations that are run from a DOS/ UNIX
prompt without invoking the GUI. Several ModelSim commands (e.g., vsim, vlib, vlog, etc.)
are actually stand-alone executables that can be invoked at the system command prompt.
Additionally, you can create a DO file that contains other ModelSim commands and specify that
file when you invoke the simulator.
164
ModelSim SE Tutorial, v6.3a
June 2007
Automating Simulation
Running in Command-Line Mode
1. Create a new directory and copy the tutorial files into it.
Start by creating a new directory for this exercise. Create the directory and copy the
following files into it:
•
/<install_dir>/examples/tutorials/verilog/automation/counter.v
•
/<install_dir>/examples/tutorials/verilog/automation/stim.do
This lesson uses the Verilog file counter.v. If you have a VHDL license, use the
counter.vhd and stim.do files in the /<install_dir>/examples/tutorials/vhdl/automation
directory instead.
2. Create a new design library and compile the source file.
Again, enter these commands at a DOS/ UNIX prompt in the new directory you created
in step 1.
a. Type vlib work at the DOS/ UNIX prompt.
b. For Verilog, type vlog counter.v at the DOS/ UNIX prompt. For VHDL, type vcom
counter.vhd.
3. Create a DO file.
a. Open a text editor.
b. Type the following lines into a new file:
# list all signals in decimal format
add list -decimal *
# read in stimulus
do stim.do
# output results
write list counter.lst
# quit the simulation
quit -f
c. Save the file with the name sim.do and place it in the current directory.
4. Run the batch-mode simulation.
a. Type vsim -voptargs="+acc"-c -do sim.do counter -wlf counter.wlf at the DOS/
UNIX prompt.
The -c argument instructs ModelSim not to invoke the GUI. The -wlf argument
saves the simulation results in a WLF file. This allows you to view the simulation
results in the GUI for debugging purposes.
5. View the list output.
ModelSim SE Tutorial, v6.3a
June 2007
165
Automating Simulation
Running in Command-Line Mode
a. Open counter.lst and view the simulation results. Output produced by the Verilog
version of the design should look like the following:
ns
delta
0
1
50
100
100
150
151
200
250
.
.
.
+0
+0
+0
+0
+1
+0
+0
+0
+0
/counter/count
/counter/clk
/counter/reset
x z *
0 z *
0 * *
0 0 *
0 0 0
0 * 0
1 * 0
1 0 0
1 * 0
The output may appear slightly different if you used the VHDL version.
6. View the results in the GUI.
Since you saved the simulation results in counter.wlf, you can view them in the GUI by
invoking VSIM with the -view argument.
Note
Make sure your PATH environment variable is set with the current version of ModelSim
at the front of the string.
a. Type vsim -view counter.wlf at the DOS/ UNIX prompt.
The GUI opens and a dataset tab named "counter" is displayed in the Workspace
(Figure 14-1).
Figure 14-1. A Dataset in the Main Window Workspace
166
ModelSim SE Tutorial, v6.3a
June 2007
Automating Simulation
Using Tcl with the Simulator
b. Right-click the counter instance and select Add > Add to Wave.
The waveforms display in the Wave window.
7. When you finish viewing the results, select File > Quit to close ModelSim.
Using Tcl with the Simulator
The DO files used in previous exercises contained only ModelSim commands. However, DO
files are really just Tcl scripts. This means you can include a whole variety of Tcl constructs
such as procedures, conditional operators, math and trig functions, regular expressions, and so
forth.
In this exercise you will create a simple Tcl script that tests for certain values on a signal and
then adds bookmarks that zoom the Wave window when that value exists. Bookmarks allow
you to save a particular zoom range and scroll position in the Wave window. The Tcl script also
creates buttons in the Main window that call these bookmarks.
1. Create the script.
a. In a text editor, open a new file and enter the following lines:
proc add_wave_zoom
echo "Bookmarking
bookmark add wave
100]" 0
add button "$num"
}
{stime num} {
wave $num"
"bk$num" "[expr $stime - 50] [expr $stime +
[list bookmark goto wave bk$num]
These commands do the following:
•
Create a new procedure called "add_wave_zoom" that has two arguments, stime
and num.
•
Create a bookmark with a zoom range from the current simulation time minus 50
time units to the current simulation time plus 100 time units.
•
Add a button to the Main window that calls the bookmark.
b. Now add these lines to the bottom of the script:
add wave -r /*
when {clk'event and clk="1"} {
echo "Count is [exa count]"
if {[exa count]== "00100111"} {
add_wave_zoom $now 1
} elseif {[exa count]== "01000111"} {
add_wave_zoom $now 2
}
}
These commands do the following:
•
Add all signals to the Wave window.
ModelSim SE Tutorial, v6.3a
June 2007
167
Automating Simulation
Using Tcl with the Simulator
•
Use a when statement to identify when clk transitions to 1.
•
Examine the value of count at those transitions and add a bookmark if it is a
certain value.
c. Save the script with the name "add_bkmrk.do."
Save it into the directory you created in Basic Simulation.
2. Load the test_counter design unit.
a. Start ModelSim.
b. Select File > Change Directory and change to the directory you saved the DO file
to in step 1c above.
c. In the Library tab of the Main window, expand the work library and double-click the
test_counter design unit.
3. Execute the DO file and run the design.
a. Type do add_bkmrk.do at the VSIM> prompt.
b. Type run 1500 ns at the VSIM> prompt.
The simulation runs and the DO file creates two bookmarks.
It also creates buttons (labeled "1" and "2") on the Main window toolbar that jump to
the bookmarks (Figure 14-2).
Figure 14-2. Buttons Added to the Main Window Toolbar
168
ModelSim SE Tutorial, v6.3a
June 2007
Automating Simulation
Using Tcl with the Simulator
c. Click the buttons and watch the Wave window zoom on and scroll to the time when
count is the value specified in the DO file.
Lesson Wrap-Up
This concludes this lesson.
1. Select File > Quit to close ModelSim.
ModelSim SE Tutorial, v6.3a
June 2007
169
Automating Simulation
Using Tcl with the Simulator
170
ModelSim SE Tutorial, v6.3a
June 2007
A B C D E F G H I J K L M N O P Q R S T U V W X Y Z
Index
—A—
—F—
aCC, 64
add dataflow command, 110
add wave command, 81
folders, in projects, 45
format, saving for Wave window, 86
—B—
gcc, 64
break icon, 29
breakpoints
in SystemC modules, 74
setting, 29
stepping, 32
—C—
C Debug, 74
Code Coverage
excluding lines and files, 148
reports, 149
Source window, 145
command-line mode, 164
compile order, changing, 42
compiling your design, 18, 25
-cover argument, 140
coverage report command, 150
cursors, Wave window, 82, 95
—D—
Dataflow window
displaying hierarchy, 110
expanding to drivers/readers, 102
options, 110
tracing events, 105
tracing unknowns, 108
dataset close command, 161
design library
working type, 20
design optimization, 17
documentation, 13
drivers, expanding to, 102
—E—
external libraries, linking to, 56
ModelSim SE Tutorial, v6.3a
June 2007
—G—
—H—
hierarchy, displaying in Dataflow window, 110
—L—
libraries
design library types, 20
linking to external libraries, 56
mapping to permanently, 60
resource libraries, 20
working libraries, 20
working, creating, 24
linking to external libraries, 56
—M—
manuals, 13
mapping libraries permanently, 60
memories
changing values, 125
initializing, 121
memory contents, saving to a file, 120
—N—
notepad command, 160
—O—
optimization, 17
options, simulation, 48
—P—
Performance Analyzer
filtering data, 135
physical connectivity, 102
Profiler
profile details, 134
viewing profile details, 134
171
A B C D E F G H I J K L M N O P Q R S T U V W X Y Z
projects
adding items to, 40
creating, 39
flow overview, 19
organizing with folders, 45
simulation configurations, 48
vlib command, 114
vlog command, 114
vsim command, 24
—W—
radix command, 115
reference dataset, Waveform Compare, 154
reference signals, 153
run -all, 29
run command, 28
Wave window
adding items to, 80, 88
cursors, 82, 95
measuring time with cursors, 82, 95
saving format, 86
zooming, 82, 91
Waveform Compare
reference signals, 153
saving and reloading, 159
test signals, 153
working library, creating, 18, 24
—S—
—X—
—Q—
quit command, 57
—R—
saving simulation options, 48
simulation
basic flow overview, 17
restarting, 30
running, 27
simulation configurations, 48
Standard Developer’s Kit User Manual, 14
stepping after a breakpoint, 32
Support, 14
SystemC
setting up the environment, 64
supported platforms, 64
viewing in the GUI, 73
X values, tracing, 108
—Z—
zooming, Wave window, 82, 91
—T—
Tcl, using in the simulator, 167
Technical support and updates, 14
test dataset, Waveform Compare, 154
test signals, 153
time, measuring in Wave window, 82, 95
toggle statistics, Signals window, 147
tracing events, 105
tracing unknowns, 108
—U—
unknowns, tracing, 108
—V—
vcom command, 114
172
ModelSim SE Tutorial, v6.3a
June 2007
End-User License Agreement
The latest version of the End-User License Agreement is available on-line at:
www.mentor.com/terms_conditions/enduser.cfm
IMPORTANT INFORMATION
USE OF THIS SOFTWARE IS SUBJECT TO LICENSE RESTRICTIONS. CAREFULLY READ THIS
LICENSE AGREEMENT BEFORE USING THE SOFTWARE. USE OF SOFTWARE INDICATES YOUR
COMPLETE AND UNCONDITIONAL ACCEPTANCE OF THE TERMS AND CONDITIONS SET FORTH
IN THIS AGREEMENT. ANY ADDITIONAL OR DIFFERENT PURCHASE ORDER TERMS AND
CONDITIONS SHALL NOT APPLY.
END-USER LICENSE AGREEMENT (“Agreement”)
This is a legal agreement concerning the use of Software between you, the end user, as an authorized
representative of the company acquiring the license, and Mentor Graphics Corporation and Mentor Graphics
(Ireland) Limited acting directly or through their subsidiaries (collectively “Mentor Graphics”). Except for license
agreements related to the subject matter of this license agreement which are physically signed by you and an
authorized representative of Mentor Graphics, this Agreement and the applicable quotation contain the parties'
entire understanding relating to the subject matter and supersede all prior or contemporaneous agreements. If you
do not agree to these terms and conditions, promptly return or, if received electronically, certify destruction of
Software and all accompanying items within five days after receipt of Software and receive a full refund of any
license fee paid.
1.
GRANT OF LICENSE. The software programs, including any updates, modifications, revisions, copies, documentation
and design data (“Software”), are copyrighted, trade secret and confidential information of Mentor Graphics or its
licensors who maintain exclusive title to all Software and retain all rights not expressly granted by this Agreement.
Mentor Graphics grants to you, subject to payment of appropriate license fees, a nontransferable, nonexclusive license to
use Software solely: (a) in machine-readable, object-code form; (b) for your internal business purposes; (c) for the license
term; and (d) on the computer hardware and at the site authorized by Mentor Graphics. A site is restricted to a one-half
mile (800 meter) radius. Mentor Graphics’ standard policies and programs, which vary depending on Software, license
fees paid or services purchased, apply to the following: (a) relocation of Software; (b) use of Software, which may be
limited, for example, to execution of a single session by a single user on the authorized hardware or for a restricted period
of time (such limitations may be technically implemented through the use of authorization codes or similar devices); and
(c) support services provided, including eligibility to receive telephone support, updates, modifications, and revisions.
2.
EMBEDDED SOFTWARE. If you purchased a license to use embedded software development (“ESD”) Software, if
applicable, Mentor Graphics grants to you a nontransferable, nonexclusive license to reproduce and distribute executable
files created using ESD compilers, including the ESD run-time libraries distributed with ESD C and C++ compiler
Software that are linked into a composite program as an integral part of your compiled computer program, provided that
you distribute these files only in conjunction with your compiled computer program. Mentor Graphics does NOT grant
you any right to duplicate, incorporate or embed copies of Mentor Graphics' real-time operating systems or other
embedded software products into your products or applications without first signing or otherwise agreeing to a separate
agreement with Mentor Graphics for such purpose.
3.
BETA CODE. Software may contain code for experimental testing and evaluation (“Beta Code”), which may not be used
without Mentor Graphics’ explicit authorization. Upon Mentor Graphics’ authorization, Mentor Graphics grants to you a
temporary, nontransferable, nonexclusive license for experimental use to test and evaluate the Beta Code without charge
for a limited period of time specified by Mentor Graphics. This grant and your use of the Beta Code shall not be construed
as marketing or offering to sell a license to the Beta Code, which Mentor Graphics may choose not to release
commercially in any form. If Mentor Graphics authorizes you to use the Beta Code, you agree to evaluate and test the
Beta Code under normal conditions as directed by Mentor Graphics. You will contact Mentor Graphics periodically
during your use of the Beta Code to discuss any malfunctions or suggested improvements. Upon completion of your
evaluation and testing, you will send to Mentor Graphics a written evaluation of the Beta Code, including its strengths,
weaknesses and recommended improvements. You agree that any written evaluations and all inventions, product
improvements, modifications or developments that Mentor Graphics conceived or made during or subsequent to this
Agreement, including those based partly or wholly on your feedback, will be the exclusive property of Mentor Graphics.
Mentor Graphics will have exclusive rights, title and interest in all such property. The provisions of this section 3 shall
survive the termination or expiration of this Agreement.
4.
RESTRICTIONS ON USE. You may copy Software only as reasonably necessary to support the authorized use. Each
copy must include all notices and legends embedded in Software and affixed to its medium and container as received from
Mentor Graphics. All copies shall remain the property of Mentor Graphics or its licensors. You shall maintain a record of
the number and primary location of all copies of Software, including copies merged with other software, and shall make
those records available to Mentor Graphics upon request. You shall not make Software available in any form to any
person other than employees and on-site contractors, excluding Mentor Graphics' competitors, whose job performance
requires access and who are under obligations of confidentiality. You shall take appropriate action to protect the
confidentiality of Software and ensure that any person permitted access to Software does not disclose it or use it except as
permitted by this Agreement. Except as otherwise permitted for purposes of interoperability as specified by applicable
and mandatory local law, you shall not reverse-assemble, reverse-compile, reverse-engineer or in any way derive from
Software any source code. You may not sublicense, assign or otherwise transfer Software, this Agreement or the rights
under it, whether by operation of law or otherwise (“attempted transfer”), without Mentor Graphics’ prior written consent
and payment of Mentor Graphics’ then-current applicable transfer charges. Any attempted transfer without Mentor
Graphics' prior written consent shall be a material breach of this Agreement and may, at Mentor Graphics' option, result in
the immediate termination of the Agreement and licenses granted under this Agreement. The terms of this Agreement,
including without limitation, the licensing and assignment provisions shall be binding upon your successors in interest
and assigns. The provisions of this section 4 shall survive the termination or expiration of this Agreement.
5.
LIMITED WARRANTY.
5.1. Mentor Graphics warrants that during the warranty period Software, when properly installed, will substantially
conform to the functional specifications set forth in the applicable user manual. Mentor Graphics does not warrant
that Software will meet your requirements or that operation of Software will be uninterrupted or error free. The
warranty period is 90 days starting on the 15th day after delivery or upon installation, whichever first occurs. You
must notify Mentor Graphics in writing of any nonconformity within the warranty period. This warranty shall not be
valid if Software has been subject to misuse, unauthorized modification or improper installation. MENTOR
GRAPHICS' ENTIRE LIABILITY AND YOUR EXCLUSIVE REMEDY SHALL BE, AT MENTOR GRAPHICS'
OPTION, EITHER (A) REFUND OF THE PRICE PAID UPON RETURN OF SOFTWARE TO MENTOR
GRAPHICS OR (B) MODIFICATION OR REPLACEMENT OF SOFTWARE THAT DOES NOT MEET THIS
LIMITED WARRANTY, PROVIDED YOU HAVE OTHERWISE COMPLIED WITH THIS AGREEMENT.
MENTOR GRAPHICS MAKES NO WARRANTIES WITH RESPECT TO: (A) SERVICES; (B) SOFTWARE
WHICH IS LICENSED TO YOU FOR A LIMITED TERM OR LICENSED AT NO COST; OR
(C) EXPERIMENTAL BETA CODE; ALL OF WHICH ARE PROVIDED “AS IS.”
5.2. THE WARRANTIES SET FORTH IN THIS SECTION 5 ARE EXCLUSIVE. NEITHER MENTOR GRAPHICS
NOR ITS LICENSORS MAKE ANY OTHER WARRANTIES, EXPRESS, IMPLIED OR STATUTORY, WITH
RESPECT TO SOFTWARE OR OTHER MATERIAL PROVIDED UNDER THIS AGREEMENT. MENTOR
GRAPHICS AND ITS LICENSORS SPECIFICALLY DISCLAIM ALL IMPLIED WARRANTIES OF
MERCHANTABILITY AND FITNESS FOR A PARTICULAR PURPOSE AND NON-INFRINGEMENT OF
INTELLECTUAL PROPERTY.
6.
LIMITATION OF LIABILITY. EXCEPT WHERE THIS EXCLUSION OR RESTRICTION OF LIABILITY
WOULD BE VOID OR INEFFECTIVE UNDER APPLICABLE LAW, IN NO EVENT SHALL MENTOR GRAPHICS
OR ITS LICENSORS BE LIABLE FOR INDIRECT, SPECIAL, INCIDENTAL, OR CONSEQUENTIAL DAMAGES
(INCLUDING LOST PROFITS OR SAVINGS) WHETHER BASED ON CONTRACT, TORT OR ANY OTHER
LEGAL THEORY, EVEN IF MENTOR GRAPHICS OR ITS LICENSORS HAVE BEEN ADVISED OF THE
POSSIBILITY OF SUCH DAMAGES. IN NO EVENT SHALL MENTOR GRAPHICS' OR ITS LICENSORS'
LIABILITY UNDER THIS AGREEMENT EXCEED THE AMOUNT PAID BY YOU FOR THE SOFTWARE OR
SERVICE GIVING RISE TO THE CLAIM. IN THE CASE WHERE NO AMOUNT WAS PAID, MENTOR
GRAPHICS AND ITS LICENSORS SHALL HAVE NO LIABILITY FOR ANY DAMAGES WHATSOEVER. THE
PROVISIONS OF THIS SECTION 6 SHALL SURVIVE THE EXPIRATION OR TERMINATION OF THIS
AGREEMENT.
7.
LIFE ENDANGERING ACTIVITIES. NEITHER MENTOR GRAPHICS NOR ITS LICENSORS SHALL BE
LIABLE FOR ANY DAMAGES RESULTING FROM OR IN CONNECTION WITH THE USE OF SOFTWARE IN
ANY APPLICATION WHERE THE FAILURE OR INACCURACY OF THE SOFTWARE MIGHT RESULT IN
DEATH OR PERSONAL INJURY. THE PROVISIONS OF THIS SECTION 7 SHALL SURVIVE THE
EXPIRATION OR TERMINATION OF THIS AGREEMENT.
8.
INDEMNIFICATION. YOU AGREE TO INDEMNIFY AND HOLD HARMLESS MENTOR GRAPHICS AND ITS
LICENSORS FROM ANY CLAIMS, LOSS, COST, DAMAGE, EXPENSE, OR LIABILITY, INCLUDING
ATTORNEYS' FEES, ARISING OUT OF OR IN CONNECTION WITH YOUR USE OF SOFTWARE AS
DESCRIBED IN SECTION 7. THE PROVISIONS OF THIS SECTION 8 SHALL SURVIVE THE EXPIRATION OR
TERMINATION OF THIS AGREEMENT.
9.
INFRINGEMENT.
9.1. Mentor Graphics will defend or settle, at its option and expense, any action brought against you alleging that
Software infringes a patent or copyright or misappropriates a trade secret in the United States, Canada, Japan, or
member state of the European Patent Office. Mentor Graphics will pay any costs and damages finally awarded
against you that are attributable to the infringement action. You understand and agree that as conditions to Mentor
Graphics' obligations under this section you must: (a) notify Mentor Graphics promptly in writing of the action;
(b) provide Mentor Graphics all reasonable information and assistance to defend or settle the action; and (c) grant
Mentor Graphics sole authority and control of the defense or settlement of the action.
9.2. If an infringement claim is made, Mentor Graphics may, at its option and expense: (a) replace or modify Software so
that it becomes noninfringing; (b) procure for you the right to continue using Software; or (c) require the return of
Software and refund to you any license fee paid, less a reasonable allowance for use.
9.3. Mentor Graphics has no liability to you if infringement is based upon: (a) the combination of Software with any
product not furnished by Mentor Graphics; (b) the modification of Software other than by Mentor Graphics; (c) the
use of other than a current unaltered release of Software; (d) the use of Software as part of an infringing process; (e) a
product that you make, use or sell; (f) any Beta Code contained in Software; (g) any Software provided by Mentor
Graphics’ licensors who do not provide such indemnification to Mentor Graphics’ customers; or (h) infringement by
you that is deemed willful. In the case of (h) you shall reimburse Mentor Graphics for its attorney fees and other costs
related to the action upon a final judgment.
9.4. THIS SECTION IS SUBJECT TO SECTION 6 ABOVE AND STATES THE ENTIRE LIABILITY OF MENTOR
GRAPHICS AND ITS LICENSORS AND YOUR SOLE AND EXCLUSIVE REMEDY WITH RESPECT TO
ANY ALLEGED PATENT OR COPYRIGHT INFRINGEMENT OR TRADE SECRET MISAPPROPRIATION
BY ANY SOFTWARE LICENSED UNDER THIS AGREEMENT.
10. TERM. This Agreement remains effective until expiration or termination. This Agreement will immediately terminate
upon notice if you exceed the scope of license granted or otherwise fail to comply with the provisions of Sections 1, 2, or
4. For any other material breach under this Agreement, Mentor Graphics may terminate this Agreement upon 30 days
written notice if you are in material breach and fail to cure such breach within the 30 day notice period. If Software was
provided for limited term use, this Agreement will automatically expire at the end of the authorized term. Upon any
termination or expiration, you agree to cease all use of Software and return it to Mentor Graphics or certify deletion and
destruction of Software, including all copies, to Mentor Graphics’ reasonable satisfaction.
11. EXPORT. Software is subject to regulation by local laws and United States government agencies, which prohibit export
or diversion of certain products, information about the products, and direct products of the products to certain countries
and certain persons. You agree that you will not export any Software or direct product of Software in any manner without
first obtaining all necessary approval from appropriate local and United States government agencies.
12. RESTRICTED RIGHTS NOTICE. Software was developed entirely at private expense and is commercial computer
software provided with RESTRICTED RIGHTS. Use, duplication or disclosure by the U.S. Government or a U.S.
Government subcontractor is subject to the restrictions set forth in the license agreement under which Software was
obtained pursuant to DFARS 227.7202-3(a) or as set forth in subparagraphs (c)(1) and (2) of the Commercial Computer
Software - Restricted Rights clause at FAR 52.227-19, as applicable. Contractor/manufacturer is Mentor Graphics
Corporation, 8005 SW Boeckman Road, Wilsonville, Oregon 97070-7777 USA.
13. THIRD PARTY BENEFICIARY. For any Software under this Agreement licensed by Mentor Graphics from Microsoft
or other licensors, Microsoft or the applicable licensor is a third party beneficiary of this Agreement with the right to
enforce the obligations set forth herein.
14. AUDIT RIGHTS. You will monitor access to, location and use of Software. With reasonable prior notice and during
your normal business hours, Mentor Graphics shall have the right to review your software monitoring system and
reasonably relevant records to confirm your compliance with the terms of this Agreement, an addendum to this
Agreement or U.S. or other local export laws. Such review may include FLEXlm or FLEXnet report log files that you
shall capture and provide at Mentor Graphics’ request. Mentor Graphics shall treat as confidential information all of your
information gained as a result of any request or review and shall only use or disclose such information as required by law
or to enforce its rights under this Agreement or addendum to this Agreement. The provisions of this section 14 shall
survive the expiration or termination of this Agreement.
15. CONTROLLING LAW, JURISDICTION AND DISPUTE RESOLUTION. THIS AGREEMENT SHALL BE
GOVERNED BY AND CONSTRUED UNDER THE LAWS OF THE STATE OF OREGON, USA, IF YOU ARE
LOCATED IN NORTH OR SOUTH AMERICA, AND THE LAWS OF IRELAND IF YOU ARE LOCATED
OUTSIDE OF NORTH OR SOUTH AMERICA. All disputes arising out of or in relation to this Agreement shall be
submitted to the exclusive jurisdiction of Portland, Oregon when the laws of Oregon apply, or Dublin, Ireland when the
laws of Ireland apply. Notwithstanding the foregoing, all disputes in Asia (except for Japan) arising out of or in relation to
this Agreement shall be resolved by arbitration in Singapore before a single arbitrator to be appointed by the Chairman of
the Singapore International Arbitration Centre (“SIAC”) to be conducted in the English language, in accordance with the
Arbitration Rules of the SIAC in effect at the time of the dispute, which rules are deemed to be incorporated by reference
in this section 15. This section shall not restrict Mentor Graphics’ right to bring an action against you in the jurisdiction
where your place of business is located. The United Nations Convention on Contracts for the International Sale of Goods
does not apply to this Agreement.
16. SEVERABILITY. If any provision of this Agreement is held by a court of competent jurisdiction to be void, invalid,
unenforceable or illegal, such provision shall be severed from this Agreement and the remaining provisions will remain in
full force and effect.
17. PAYMENT TERMS AND MISCELLANEOUS. You will pay amounts invoiced, in the currency specified on the
applicable invoice, within 30 days from the date of such invoice. Any past due invoices will be subject to the imposition
of interest charges in the amount of one and one-half percent per month or the applicable legal rate currently in effect,
whichever is lower. Some Software may contain code distributed under a third party license agreement that may provide
additional rights to you. Please see the applicable Software documentation for details. This Agreement may only be
modified in writing by authorized representatives of the parties. Waiver of terms or excuse of breach must be in writing
and shall not constitute subsequent consent, waiver or excuse.
Rev. 060210, Part No. 227900