1
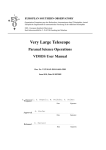
EUROPEAN
SOUTHERN
OBSERVATORY
Organisation Européenne pour des Recherches Astronomiques dans l’Hémisphere Austral
Europäische Organisation für astronomische Forschung in der südlichen Hemisphäre
VERY LARGE TELESCOPE
VISIR USER MANUAL
Doc. No. VLT-MAN-ESO-14300-3514
Version 76.4
14/Jul/05
VISIR User Manual
.
Change Record
Issue/Rev.
Date
Section/Parag. affected
Reason/Initiation/Documents/Remarks
1.0
04/09/04
creation
1.1
10/12/04
2.4, 3.2, 6.2, 6.3, 7, 8
First release for science verification
in P74 and OT proposals in P75.
update for P75 Phase2
v76.1
01/02/05
all
update for P76 CfP
v76.2
06/07/05
all
update for P76 Phase 2
v76.3
14/07/05
4.8.1
Corrected Legend Fig 17
v76.4
14/07/05
Cover pages
Corrected typos
v1.0, v1.1, v76.1: edited by R. Siebenmorgen, E. Pantin, M. Sterzik
v76.2–4, updated by A. Smette. Send comments to [email protected]
ii
VISIR User Manual
iii
.
Contents
1 Introduction
2 Observing in the MIR from
2.1 The Earth’s atmosphere .
2.2 The spatial resolution . .
2.3 MIR background . . . . .
2.4 Chopping and nodding . .
2.5 Sensitivity . . . . . . . . .
1
the ground
. . . . . . . .
. . . . . . . .
. . . . . . . .
. . . . . . . .
. . . . . . . .
.
.
.
.
.
.
.
.
.
.
.
.
.
.
.
.
.
.
.
.
.
.
.
.
.
.
.
.
.
.
.
.
.
.
.
.
.
.
.
.
.
.
.
.
.
.
.
.
.
.
.
.
.
.
.
.
.
.
.
.
.
.
.
.
.
.
.
.
.
.
.
.
.
.
.
.
.
.
.
.
.
.
.
.
.
.
.
.
.
.
.
.
.
.
.
1
1
1
2
2
3
3 Instrument description and offered observing modes
3.1 Imager . . . . . . . . . . . . . . . . . . . . . . . . . . .
3.2 Spectrometer . . . . . . . . . . . . . . . . . . . . . . .
3.3 Slit widths . . . . . . . . . . . . . . . . . . . . . . . .
3.4 Resolution . . . . . . . . . . . . . . . . . . . . . . . . .
3.5 Low resolution: offered central wavelengths . . . . . .
3.6 Calibration units . . . . . . . . . . . . . . . . . . . . .
3.7 Detectors . . . . . . . . . . . . . . . . . . . . . . . . .
3.8 Data acquisition system . . . . . . . . . . . . . . . . .
.
.
.
.
.
.
.
.
.
.
.
.
.
.
.
.
.
.
.
.
.
.
.
.
.
.
.
.
.
.
.
.
.
.
.
.
.
.
.
.
.
.
.
.
.
.
.
.
.
.
.
.
.
.
.
.
.
.
.
.
.
.
.
.
.
.
.
.
.
.
.
.
.
.
.
.
.
.
.
.
.
.
.
.
.
.
.
.
.
.
.
.
.
.
.
.
.
.
.
.
.
.
.
.
.
.
.
.
.
.
.
.
.
.
.
.
.
.
.
.
.
.
.
.
.
.
.
.
.
.
.
.
.
.
.
.
.
.
.
.
.
.
.
.
6
6
9
9
10
10
10
12
13
4 Observing with VISIR at the VLT
4.1 Proposal preparation . . . . . . . . . . . .
4.2 Telescope observing parameters . . . . . .
4.2.1 Instrument orientation on the sky
4.2.2 Chopping parameters . . . . . . .
4.2.3 Nodding parameters . . . . . . . .
4.3 Target acquisition . . . . . . . . . . . . .
4.4 Guide stars . . . . . . . . . . . . . . . . .
4.5 Brightness limitations . . . . . . . . . . .
4.6 Overheads . . . . . . . . . . . . . . . . . .
4.7 Calibration observations . . . . . . . . . .
4.8 Known problems . . . . . . . . . . . . . .
4.8.1 Decreased image quality . . . . . .
4.8.2 Low–level stripes . . . . . . . . . .
4.8.3 Bad residuals . . . . . . . . . . . .
4.8.4 Residuals of sky emission lines . .
4.8.5 Fringes . . . . . . . . . . . . . . .
.
.
.
.
.
.
.
.
.
.
.
.
.
.
.
.
.
.
.
.
.
.
.
.
.
.
.
.
.
.
.
.
.
.
.
.
.
.
.
.
.
.
.
.
.
.
.
.
.
.
.
.
.
.
.
.
.
.
.
.
.
.
.
.
.
.
.
.
.
.
.
.
.
.
.
.
.
.
.
.
.
.
.
.
.
.
.
.
.
.
.
.
.
.
.
.
.
.
.
.
.
.
.
.
.
.
.
.
.
.
.
.
.
.
.
.
.
.
.
.
.
.
.
.
.
.
.
.
.
.
.
.
.
.
.
.
.
.
.
.
.
.
.
.
.
.
.
.
.
.
.
.
.
.
.
.
.
.
.
.
.
.
.
.
.
.
.
.
.
.
.
.
.
.
.
.
.
.
.
.
.
.
.
.
.
.
.
.
.
.
.
.
.
.
.
.
.
.
.
.
.
.
.
.
.
.
.
.
.
.
.
.
.
.
.
.
.
.
.
.
.
.
.
.
.
.
.
.
.
.
.
.
.
.
.
.
.
.
.
.
.
.
.
.
.
.
.
.
.
.
.
.
.
.
.
.
.
.
.
.
.
.
.
.
.
.
.
.
.
.
.
.
.
.
.
.
.
.
.
.
.
.
.
.
.
.
.
.
17
17
17
17
18
19
19
21
21
21
21
22
22
23
23
23
24
5 VISIR data
5.1 Data format . . . . . . . . . . . . . . . . . . . . . . . . . . . . . . . . . . . . . . . . . .
5.2 Pipeline . . . . . . . . . . . . . . . . . . . . . . . . . . . . . . . . . . . . . . . . . . . .
5.3 VISIR spectrometer data . . . . . . . . . . . . . . . . . . . . . . . . . . . . . . . . . .
24
24
24
25
6 VISIR templates description
6.1 Acquisition . . . . . . . . . . . .
6.2 Observing with the imager . . . .
6.3 Observing with the spectrometer
6.4 Calibration . . . . . . . . . . . .
27
27
27
29
29
7 Checklist for Phase 2 preparation
.
.
.
.
.
.
.
.
.
.
.
.
.
.
.
.
.
.
.
.
.
.
.
.
.
.
.
.
.
.
.
.
.
.
.
.
.
.
.
.
.
.
.
.
.
.
.
.
.
.
.
.
.
.
.
.
.
.
.
.
.
.
.
.
.
.
.
.
.
.
.
.
.
.
.
.
.
.
.
.
.
.
.
.
.
.
.
.
.
.
.
.
.
.
.
.
.
.
.
.
.
.
.
.
.
.
.
.
.
.
.
.
.
.
.
.
.
.
.
.
.
.
.
.
.
.
.
.
.
.
.
.
.
.
.
.
.
.
.
.
.
.
.
.
.
.
.
.
.
.
.
.
.
.
.
.
.
.
.
.
.
.
.
.
.
.
.
.
.
.
.
.
.
.
.
.
.
.
.
.
.
.
.
.
.
.
.
.
.
.
.
.
.
.
.
.
.
.
.
.
.
.
.
.
.
.
.
.
.
.
.
.
.
.
.
.
.
.
.
.
.
.
.
.
.
.
.
.
.
.
.
.
.
.
.
.
.
.
.
.
.
.
.
.
.
.
.
.
.
.
.
.
.
.
.
.
.
.
.
.
.
.
.
.
.
.
.
30
VISIR User Manual
8 Appendix: VISIR template
8.1 Acquisition . . . . . . . .
8.2 Observation . . . . . . . .
8.3 Calibration . . . . . . . .
.
parameters
. . . . . . . . . . . . . . . . . . . . . . . . . . . . . . . . . .
. . . . . . . . . . . . . . . . . . . . . . . . . . . . . . . . . .
. . . . . . . . . . . . . . . . . . . . . . . . . . . . . . . . . .
9 Appendix: Filter transmission curves
iv
31
31
33
35
37
VISIR User Manual
.
List of acronyms
BIB
BLIP
BOB
DIT
ETC
FWHM
ICS
IR
IRACE
MIR
OB
P2PP
PAE
pfov
PSF
S/N
UT
VISIR
TCS
TMA
WCU
Blocked impurity band
Background limited performance
Broker of observation blocks
Detector integration time
Exposure time calculator
Full width at half maximum
Instrument control software
Infrared
Infrared array control electronics
Mid infrared
Observing block
Phase 2 proposal preparation
Preliminary acceptance in Europe
pixel field of view
Point spread function
Signal–to–noise ratio
Unit telescope
VLT imager and spectrometer for the mid infrared
Telescope control system
Three mirrors anastigmatic
Warm calibration unit
v
VISIR User Manual
1
.
1
Introduction
The VLT spectrometer and imager for the mid–infrared (VISIR), built by CEA/DAPNIA/SAP and
NFRA/ASTRON, provides diffraction–limited imaging at high sensitivity in two mid-infrared (MIR)
atmospheric windows: the N-band between ≈ 8 to 13 µm and the Q-band between 16.5 and 24.5 µm,
respectively. In addition, it offers a slit spectrometer with a range of spectral resolutions between 150
and 30000.
The MIR provides invaluable information about the warm dust and gas phase of the Universe. Micron
sized particles such as silicates, silicon carbide, carbon, coals, aluminum oxides or polycyclic aromatic
hydrocarbon (PAH) molecules are major contributors to the thermal MIR emission. The gaseous
phase emits through a large number of ionic and atomic lines. Examples are NeII (12.8 µm ) and the
pure rotation lines of molecular hydrogen at 8.02, 9.66, 12.27 and 17.03 µm .
Because of the very high background from the ambient atmosphere and telescope, the sensitivity
of ground–based MIR instruments cannot compete with that of space–born ones. However, ground
based instruments mounted on large telescopes offer superior spatial resolution. For example VISIR
at the VLT provides diffraction limited images at ∼ 0.300 (FWHM) in the N band. This is an order of
magnitude better than what can be reached by the Spitzer Space Telescope (SST).
The VISIR user manual is structured as follows: Basic observing techniques of ground–based MIR
instruments are summarized in § 2. § 3 provides a technical description of VISIR and its offered
observing modes offered. An overview on how to observe with VISIR at the VLT can be found in § 4.
A description of the structure of the imaging and spectroscopic data files is given in § 5. A checklist
to help the preparation of OBs is available in § 7. Acquisition, observing and calibration templates
are explained in § 6.
This manual reflects knowledge gathered during early phases of operations and is in some aspects to
be considered to be preliminary. Therefore we strongly recommend to consult:
http://www.eso.org/instruments/visir/ for additional information and updates. For support
during proposal preparation and OB submission, please contact ESO’s User Support Department
([email protected]).
2
2.1
Observing in the MIR from the ground
The Earth’s atmosphere
Our atmosphere absorbs the majority of the MIR radiation from astronomical sources. The main
absorbing molecules are H2 O, CH4 , CO2 , CO, O2 , O3 . However, the atmosphere is quite transparent
in the two atmospheric windows: the N and Q band. They are centered around 10 and 20 µm,
respectively. The transmission in the N band is fairly good at a dry site and becomes particular
transparent in the wavelength range 10.5-12 µm . However, the transmission of the Q band is rapidly
decreasing with wavelength and can be viewed as the superposition of many sub–bands having a
typical spectral coverage of ∆λ = 1µm at an average transmission of 60%. Observations in this band
require low water vapor content in the atmosphere. The atmospheric transmission in the N and Q
bands is displayed on Fig. 1.
2.2
The spatial resolution
The spatial resolution of an instrument is ultimately limited either by the diffraction of the telescope
or the atmospheric seeing. The diffraction limit as measured by the diameter of the first Airy ring
increases with wavelength as 1.22 λ/D, where λ is the observing wavelength and D the diameter of
the telescope mirror (see solid line in Fig. 2). The wavelength dependence of the seeing can be derived
by studying the spatial coherence radius of the atmosphere in the telescope beam and is to first order
approximated by the Roddier formula, where the seeing is ∝ λ−0.2 (see dot-dashed lines in Fig. 2).
VISIR User Manual
.
2
Figure 1: MIR atmospheric transmission at Paranal computed with HITRAN for an altitude of 2600 m
and 1.5 mm of precipitable water vapor at zenith. The US standard model atmosphere is used.
However, initial results from VISIR data indicate that this formula overestimates the measured MIR
seeing at Paranal by 20–50%, as the size of a UT mirror is comparable to the turbulence outer scale.
As a result, VISIR data are already diffraction limited for optical seeing below 0.600 .
2.3
MIR background
The atmosphere does not only absorb MIR photons coming from astrophysical targets, but also emits
a strong background with the spectral shape of a black-body at about 253 K (Kirchhoff’s law). The
telescope gives an additional MIR background. The VLT telescopes emits at 283 K with a preliminary
emissivity estimate of < 15%. The VISIR instrument is cooled to avoid internal background contamination. The detectors are at ∼ 7 K and the interior of the cryostat at 33 K. The background radiation
at 10µm is typically mN = −5 mag/arcsec2 (3700 Jy/arcsec2 ) and at 20µm mQ = −7.3 mag/arcsec2
(8300 Jy/arcsec2 ).
Consequently, the number of photons reaching the detector is huge, often more than 108 photons/s.
Therefore, the exposure time of an individual integration - the Detector Integration TIme (DIT) – is
short, of the order of a few tens of milli–seconds in imaging mode.
2.4
Chopping and nodding
The basic idea to suppress the MIR background is to perform differential observations, using the
chopping/nodding technique.
In the chopping technique two observations are performed. One set of exposures on–source, include
the background and the astronomical source. A second set of off-source exposures measures the pure
background. The on– and off–source observations have to be alternated at a rate faster than the
rate of the background fluctuations. In practice, it is achieved by moving the secondary mirror of the
telescope. For VISIR at Paranal, a chopping frequency of 0.25 Hz has been found to be adequate for Nband imaging observations, while 0.5 Hz are adopted for Q-band imaging. Spectroscopic observations
are performed with lower chopper frequencies, at 0.1 Hz.
VISIR User Manual
.
3
Figure 2: VLT diffraction limit (full line) versus seeing. The Spitzer Space Telescope diffraction
limits (dashed) are shown for comparison. The Roddier dependence is shown for two optical seeings
(dashed-dot).
The chopping technique cancels most of the background. However, the optical path is not exactly the
same in both chopper positions. Therefore a residual background remains. It is varying at a time–
scale which is long compared to that of the sky. This residual is suppressed by nodding, where the
telescope itself is moved off–source and the same chopping observations as in the on–source position
is repeated.
An illustration of the chopping and nodding technique is shown on Fig. 3. Depending on the choice
of chopping and nodding amplitudes and directions, up to 4 images of the source can be seen on the
frame and used for scientific analysis. Of course, the free field–of–view on the chop/nod images can
be severely reduced depending on the particular chopping and nodding parameters chosen.
2.5
Sensitivity
Measurements of VISIR sensitivities are based on observations of mid–infrared calibration standard
stars (Cohen et al. 1991, AJ 117, 1864). In imaging mode, the stars are recorded in the small
field (0.07500 ) and intermediate field (0.12700 ) by perpendicular chopping and nodding patterns with
amplitudes of 1000 . Calibrators are frequently observed during the night (§4.7). Flux and noise levels
are extracted by multi–aperture photometry using the curve–of–growth method: the aperture used for
all 4 beams in a given frame is the one for which the flux to noise ratio is the largest. By combining
all 4 beams, the sensitivity in a given set–up (filter, field of view) is defined as the limiting flux of a
point–source detected with a S/N of 10 in one hour of on–source integration.
The growing calibration database allows a statistical analysis of the sensitivity with respect to instrumental and atmospherical conditions. The values for each filter given in Table 2 refer to the median of
more than 600 different observations during September and December 2004. A graphical compilation
is presented in Fig. 4 for the N-band and Q-band imaging filters. Some of the best measurements
approach theoretical expectations, i.e. they are close to background limited performance (BLIP).
Sensitivity estimates for the VISIR spectroscopy observing modes are obtained in a similar way.
However, in this case, chopping and nodding are executed in parallel. Consequently, only 3 beams are
VISIR User Manual
.
4
Figure 3: Illustration of the chopping and nodding technique on observations of the blue compact
galaxy He2-10. The galaxy only appears after chopping and nodding (courtesy VISIR commissioning
team, June 2004).
VISIR User Manual
.
5
median small field
sensitivity [mJy 10σ/h]
100
median intermed. field
10
ARIII
PAH1
1
8
SIV
SIV_1
9
PAH2
SIV_2
10
11
wavelength [µm]
PAH2_2
SIC
NEII
NEII_1
12
NEII_2
13
median small field
sensitivity [mJy 10σ/h]
median intermed. field
100
10
Q1
17.0
17.5
Q2
18.0 18.5 19.0
wavelength [µm]
Q3
19.5
20.0
Figure 4: Sensitivities for the VISIR imager for the N (top) and Q-band (bottom). Small and intermediate field observations are displaced for clarity. Background noise limits are indicated for the
individual filter bandpasses.
VISIR User Manual
.
6
obtained, with the central one containing twice as much flux as the two other ones.
Table 4 to 6 list typical sensitivities measured in low, medium and high resolution modes away from
strong sky emission lines for the wavelength ranges offered in P76. Figure 5 shows the dependence
of the sensitivity on wavelength.
The median sensitivities are the reference for classification of VISIR service mode observations,
and the basis to assess the feasibility of an observing programme. In particular, classifications of
service mode OBs will be based on sensitivity measurements made at zenith. Calibrations will
be provided following the guidelines given in § 4.7. For up to date information, please consult
http://www.eso.org/instruments/visir. The use the VISIR exposure time calculator (ETC, located at http://www.eso.org/observing/etc/) is recommended to estimate the on–source integration time 1 .
3
Instrument description and offered observing modes
For P76, VISIR offers two spatial scales in imaging and several spectral resolution modes in slit
spectroscopy. The imager and spectrograph are two sub–instruments. They have independent light
paths, optics and detectors. The cryogenic optical bench is enclosed in a vacuum vessel. The vessel
is a cylinder, 1.2 m long and 1.5 m in diameter. Standard Gifford–McMahon closed–cycle coolers are
used to maintain the required temperature: 33 K for most of the structure and optics and < 15 K for
the parts near the detector. The detectors are cooled down to ∼ 7 K.
3.1
Imager
The imager is based on an all–reflective design. The optical design is shown in Fig. 6. It consists of
two parts:
• A collimator, which provides an 18 mm diameter cold stop pupil in parallel light: As generally
designed for IR instruments, the pupil of the telescope is imaged on a cold stop mask to avoid
straylight and excessive background emission. The collimator mirror (M1) is a concave aspherical
mirror. It is followed by a folding flat mirror (M2) which eases the mechanical implementation.
• A set of three objectives mounted on a wheel. Each objective is based on a three mirror
anastigmatic (TMA) system. Each of the TMA’s is made of three conic mirrors.
The 0.07500 (small field, SF) and 0.12700 (intermediated field, IF) pixel scale are offered (Table 1).
These offered pixel fields of view (pfov) ensure a proper sampling of the images in the N and Q-band.
pfov
fov
diffractiona
µm
diffractiona
pixels
0.12700
0.07500
32.500 × 32.500
19.200 × 19.200
94
159
1.88
3.18
a
Radius of first Airy ring at λ=7.7µm
Table 1: VISIR imager pixel scales offered. The pixel size of the DRS 256x256 detector is 50 µm .
The first airy ring at λ=7.7µm corresponds to a radius of 0.2400 on the sky.
The filter wheel is located just behind the cold stop pupil mask. The list of filters offered is given in
Table 2. The transmission curves of the filters measured at 35 K are plotted in the Appendix.
1 Note that ETC v3.0.5 does not properly account for the background behavior as a function of airmass. Also, it
does not take into account the airmass dependence of the seeing.
VISIR User Manual
.
7
sensitivity [mJy 10σ/1h]
median
best ever
theoretical limit
100
8
sensitivity [mJy 10σ/1h]
10000
9
10
11
wavelength [µm]
12
13
model
median
1000
12.70
12.75
12.80
12.85
wavelength [µm]
12.90
Figure 5: Sensitivity as a function of wavelength for low (top) and high (bottom) resolution mode.
Four offered settings of the N-band low-resolution are stitched together. Atmospheric molecular
absorption, e.g. at 9.55, 11.8 and 12.5 µm, is evident. Note the detector feature at 8.8 µm. Dots
indicate individual observations, full lines represent median and the dashed line the best sensitivities.
In the 12.81 µm region several settings of the high-resolution mode are shown. Theoretical model
curves correspond to BLIP.
VISIR User Manual
.
8
entrance window
diaphragm
(focal plane)
cold stop
M2
detector
TMA optics
filter
M1
Figure 6: The optical path of the imager in the intermediate field (0.12700 /pixel) is shown from the
entrance window down to the detector.
filter
λc
(µm )
half–band width
(µm )
maximum
transmission
(%)
PAH1
ArIII
SIV 1
SIV
SIV 2
PAH2
SiC
PAH2 2
NeII 1
NeII
NeII 2
Q1
Q2
Q3
8.59
8.99
9.821
10.49
10.771
11.25
11.85
11.881
12.271
12.81
13.04
17.65
18.72
19.50
0.42
0.14
0.18
0.16
0.19
0.59
2.34
0.37
0.18
0.21
0.22
0.83
0.88
0.40
77
72
72
70
70
75
75
58
51
64
68
59
49
50
sensitivity
(mJy 10σ/1h)
theory
median
(BLIP) SF
IF
1.6
4.1
4.0
4.5
4.6
2.3
1.2
4.1
6.9
6.1
6.3
11.1
13.6
41.7
5
6
30
8
9
6
7
7
12
12
15
50
50
100
8
70
60
13
20
9
18
15
20
18
22
120
80
160
Table 2: VISIR imager filter characteristics, following the manufacturer specifications, except for the
central wavelengths noted with 1 which were re-determined with a monochromator and the WCU
because they deviate from specifications. The last 3 columns give, respectively, the theoretical expectations under BLIP and excellent weather conditions, and the measured median sensitivities for the
Small and Intermediate Field obtained in various weather conditions. The measured sensitivities were
obtained using the curve–of–growth method on data obtained in perpendicular chopping/nodding
directions (4 beams).
VISIR User Manual
3.2
.
9
Spectrometer
VISIR offers slit spectroscopy at three spectral resolutions with a pixel scale of 0.12700 . This is obtained
by means of two arms, one with low order gratings for the low and medium spectral resolution, the
other with large echelle gratings providing high spectral resolution.
Figure 7: Schematic layout of the design of the VISIR spectrometer.
The long slits have a length of 32.500 and therefore cover the whole width of the detector. The short
slits, only used in high–resolution, cross–dispersed mode, have a length of 4.100 . The all-reflective
optical design of the spectrometer uses two TMA systems in double pass (pass 1: collimator, pass 2:
camera). A schematic layout of the VISIR spectrometer design is shown in Fig. 7. The 3–mirror system
of the low– and medium–resolution arm gives a 53 mm (diameter) collimated beam; the collimated
beam diameter in the high-resolution arm is 125 mm. Both subsystems image the spectrum onto
the same detector; selection between the two spectrometer arms is done by two pairs of folding flat
mirrors. In front of the actual spectrometer subsystems is a reflective re–imager consisting of two
off–axis paraboloids and three folding flats. The re–imager provides a 16 mm diameter cold-stop pupil
in parallel light and transforms the incoming VLT Cassegrain beam of F:13.4 to an F:10 beam at
the spectrometer entrance. The spectrometer slit wheel is also equipped with a very wide slit (15.300 )
named OPEN in P2PP. It gives the possibility to make imaging with the spectrometer detector and
is used for object acquisition and centering on the detector.
The list of available filters for spectroscopic acquisition offered is given in Table 3, together with their
measured bandpasses and approximate sensitivities for image acquisition.
3.3
Slit widths
Three different slit widths (0.400 , 0.7500 and 100 ) are offered for all settings. For over-sized widths
(e.g. for the 100 slit with respect to the diffraction limit around 10µm ) the spectral resolution of a
VISIR User Manual
.
filter
λc
(µm )
half–band width
(µm )
sensitivity
(mJy/10σ/1h)
N SW
N LW
ArIII
NeII 1
NeII 2
8.85
12.1
8.94
12.35
12.81
1.35
1.9
0.11
0.50
0.10
40
40
200
80
50
10
Table 3: VISIR spectrometer filter characteristics. The filters transmissions have been determined with
a monochromator and the WCU. The last column list the measured median sensitivities which were
obtained using the curve–of–growth method on data obtained in parallel chopping/nodding directions
(3 beams).
point–source spectrum is better than the one of the sky spectrum; in addition, the zero–point of the
wavelength calibration will be affected by an incorrect centering of the object within the slit.
3.4
Resolution
In the N band, the low–resolution and medium resolution modes provide spectral resolving power
of ∼ 300 (Table 4) and ∼3000 (Table 5), respectively. In high resolution long–slit mode, narrow
wavelength ranges around the 8.02 [H2 S4], 12.813 [Ne II] and 17.03 µm [H2 S1] line are offered. With
the 100 slit the measured spectral resolution is R ∼ 15000 (Table 6), and a minimum flux in the line
below 10−16 W/m2 /arcsec2 can be achieved. This value corresponds to an approximate sensitivity
limit around 1 Jy in the continuum. A high–resolution, cross–dispersed mode with a 400 short slit is
available for wavelength settings around 9.66 [H2 S3] and 12.27 µm [H2 S2].
Please consult http://www.eso.org/instruments/visir for the latest update of the list of offered
modes and slits.
3.5
Low resolution: offered central wavelengths
In addition to the 4 central wavelengths (8.8, 9.8, 11.4 and 12.4 µm ) announced in Phase 1, two
additional ones are offered for Phase 2, at 8.5 and 12.2 µm . The main reason justifying these
two new settings is of cosmetic nature. As described below, the detector has a number of ‘bad’
pixels. In particular, some of them, mainly located at the bottom left of the detector appear to cause
particularly severe striping in the chopped images if their illumination is slightly different in the two
chopping positions. This situation can be produced either if one of the beams of a bright object falls
on these pixels or because of a residual scanner jitter of the grating units. The 8.5µm setting moves
the blue wing of the ozone band off the wavelength range covered by the detector, at the expense of
having a larger part of the detector covering the red wing of the water-vapour band. The 12.2µm
setting avoids the CO2 band
3.6
Calibration units
A warm calibration unit (WCU) is located on top of the VISIR vacuum enclosure. The WCU is also
called star simulator. It simulates either a monochromatic point source with adjustable wavelength or
an extended black-body source with adjustable temperature. A selection mirror allows to switch from
the telescope to the simulator beam. It can be used for calibration and tests, also during daytime.
Fig. 8 shows the unit on top of the enclosure.
VISIR User Manual
11
.
λ – range
(µm )
λc
(µm )
grating
order
7.7-9.3
8.0-9.6
9.0-10.6
10.34-12.46
11.14-13.26
11.34-13.46
8.5
8.8
9.8
11.4
12.2
12.4
2
2
2
1
1
1
spect.–resol.
(measured, 100 slit)
300
300
305
185
215
215
–
–
–
–
–
–
390
390
360
220
250
250
dispersion
(pixels/µm )
160.01
160.02
160.05
119.94
119.96
119.96
Table 4: VISIR low resolution offered settings. The first column gives the wavelength range of a
spectrum for the central wavelength (λc ) listed in the 2nd column. The measured sensitivities are
∼ 50 mJy at 10σ/1h in the clean regions of the spectrum (cf. Fig. 5) for a slit width of 100 . Offered
slits have widths of 0.40, 0.75 and 1.0000 . The spectral resolution of the 8.5µm and 12.2µm settings
has not been independently measured; values for the 8.8µm and 12.4µm settings are reported instead.
λ – range
(µm )
λc
(µm )
grating
order
spect.–resol.
(measured, 100 slit)
dispersion
(pixels/µm )
8.706-8.893
11.274-11.526
8.8
11.4
2
1
∼ 3500
∼ 1800
1367.43
1011.2
Table 5: VISIR medium resolution setting. The measured sensitivities are ∼ 200 mJy at 10σ/1h.
Offered slits have widths of 0.40, 0.75 and 1.0000 .
mode
λc
(µm )
∆λ
(µm )
line
order
spect.–resol.
(theoretical)
dispersion
(pixels/µm )
sensitivity
Jy 10σ/1h
HR
HR
HR
7.970 – 8.270
12.738 – 12.882
16.800 – 17.200
0.02420
0.03571
0.05156
[H2 S4]
[Ne II]
[H2 S1]
17B
11A
8B
32000
17000
14000
10544
7145
4950
∼3
∼0.9
<10
HRX
HRX
9.360 – 9.690
12.210 – 12.760
0.02325
0.03864
[H2 S3]
[H2 S2]
15A
11B
25000
20000
10974
6604
∼5
∼1.5
Table 6: VISIR high resolution long–slit (HR) and cross-dispersed (HRX) modes. The second column
gives the minimum and maximum allowed values for the central wavelength (λc ) in the given setting.
The wavelength range per setting in given in the 3rd column (∆λ). Offered slits have widths of 0.40,
0.75 and 1.0000 .
VISIR User Manual
.
12
Figure 8: Schematic drawing of the warm calibration unit on top of the VISIR vessel.
3.7
Detectors
The VISIR imager and spectrometer are each equipped with a DRS, former Boeing, 256 × 256 BIB
detector. The quantum efficiency of the detectors is greater than 50% and reaches 65% or more at 12
µm (Fig. 9).
The detector noise has to be compared with the photon noise of the background. As shown in Fig. 10,
the measured noise in an observation consists of read–out noise and fixed pattern noise, which are
both independent of the detector integration time (DIT). At the operating temperature of the detector
(∼ 7 K), the dark current, which is the signal obtained when the detector receives no photons, is
negligible compared to the background generated by the photons emitted by the telescope and the
atmosphere. The dark current is removed by the observation technique (chopping or nodding). It is
at least 6 times lower than the photon noise for the spectrometer and negligible for the imager.
The detectors have a switchable pixel (“well”) capacity. The large capacity is used for broad-band
imaging and the small capacity for narrow band imaging and spectroscopy. Detector saturation due to
the enormous MIR background is avoided by a storage capacity of 1.9 · 106 e− in small and 1.8 · 107 e−
in large capacity modes, respectively. For background limited noise performance (BLIP), the optimal
operational range of the detector is half of the dynamic range for the large capacity, and between 1/2
and 1/5 for the small capacity. The detector is linear over 2/3 of its dynamic range (Fig. 11) and its
working point is set in the middle of the dynamic range. During commissioning it was found that, for
about half of the array, the gain does not differ by more than 2% peak-to-peak. By comparison with
other limitations, flat-field corrections, which are difficult to implement in the MIR, are not considered
important. The detector integration time (DIT) is a few milli–seconds in broad-band imaging and
may increase to ∼ 2 s in high resolution spectroscopy. The DIT is determined by the instrument
software according to the filter and pfov. It is not a parameter to be chosen by the observer.
The DRS detectors contain a fair fraction of bad pixels (< 2%, Fig.12). The imager detector also
suffers from striping and appearances of ghosts. The relatively wide rectangular area in the lower
right corner (South–West corner for PA = 0 deg) of the imager detector or some other rectangular
areas are masked out to avoid such disturbances (Fig. 13). For bright objects the DRS detector shows
VISIR User Manual
.
13
Figure 9: Detector quantum efficiency at 12 K provided by DRS (solid line). The same curve (dashed)
but scaled by 0.72 reflects a lower limit of the quantum efficiency. The scaling was derived from
laboratory measurements. Note the sharp absorption feature at 8.8 µm that will appear in raw
spectroscopic data.
Figure 10: Noise as a function of the incoming flux in the large (left) and small (right) capacity mode.
Superimposed is the theoretical photon noise. BLIP performances are approached for higher fluxes
and larger DIT, respectively.
memory effects. Stabilization is ensured by introducing dead times where necessary. It is advised to
observe only sources fainter than 500 Jy in N and 2500 Jy in Q.
These artifacts are less important in spectroscopy due to the lower light levels but clearly visible on
objects brighter than ∼ 2% of the background. However, a TEL.CHOP.THROW between 9 to 1300 shoud
be avoided, in particular for objects bright enough to be seen in individual DITs, as one of the beams
will hit some particularly hot pixels in the lower–left of the spectrometer detector (see Fig.14).
3.8
Data acquisition system
Both VISIR detectors are controlled by the ESO standard IRACE acquisition system. In imaging
the read–out rate of the detector is high. Up to 200 frames per s are read for a minimum detector
integration time of DIT= 5 ms. Such a frame rate is too high to store all exposures. One VISIR
image is of size 256x256; each pixel is coded with 4 bytes (long integer). Thus one read–out has a
size of 262 kB. During each chopping cycle the elementary exposures are added in real time and only
the result is stored on disk. At a chopping frequency of fchop = 0.25 Hz every Tchop = 4 s one VISIR
VISIR User Manual
.
14
Figure 11: Linearity curve of the detector in the large (left) and small (right) capacity modes. The
break in the response at ≈ 2/3 at 1.8 · 107 e− of the large and at 1.9 · 106 e− of the small capacity are
indicated by full lines. The top lines indicate the well capacities.
Figure 12: Bad pixel maps of the imager (left) and spectrometer (right) detectors. The large grey
rectangular areas correspond to electronically masked pixels in order to decrease detector striping.
VISIR User Manual
.
15
Figure 13: The DRS detector shows stripes and repeating ghosts for very bright sources (left). The
ghosts are distributed every 16 columns. For other sources striping is not apparent (right).
;
;
;
Figure 14: Sequence of chop/nod, reduced spectra obtained in the Medium Resolution mode with a
central wavelength = 8.8µm . The TEL.CHOP.THROW = 8, 11, 13 and 1400 from left to right. Note
the presence of significant striping when the ‘left’ beam hits some hot pixels at the lower left of the
detector. For the location of the object along the slit (pixel X=123 at row Y = 128), this occured
for TEL.CHOP.THROW between 10 and 1300 , approximatively. The horizontal lines at the middle of the
images are caused by the lack of detector response at 8.8µm .
VISIR User Manual
.
16
image is stored as a plane in a data cube of a FITS file. The number of chopping cycles corresponds to
the time spent in one nodding position, Tnod . This nodding period is typically Tnod = 90 s for science
observations. The chopper frequency, DIT and also Tnod are predefined by the system. The number
of saved A–B frames in one FITS file is:
Ncycl
chop
= Tnod /Tchop
(1)
The number of nodding cycles is computed from the total integration time as given by the observer.
The total number of stacked images for each secondary position, respectively chopper half cycle, is
NDIT. This parameter is computed according to:
NDIT = (2 · DIT · fchop )−1 − NDITSKIP
(2)
and is given by the system. It depends on DIT, chopping frequency and NDITSKIP: some read–outs at
the beginning of each chopper half cycle are rejected during stabilization of the secondary. Typical
stabilization times of the secondary are 25 ms. The number of rejected exposures is given by NDITSKIP.
Similar, during stabilization after each telescope movement, respectively nodding position, a number
NCYSKIP of chopping cycles is ignored. The timing organization of data is shown in Fig. 15.
The total on source integration time is:
tsource = 4 · Ncycl
nod
· Ncycl
chop
· NDIT · DIT
(3)
The total rejected time is:
tskip = 4 · Ncycl
chop
· DIT · (NDITSKIP · Ncycl
nod
+ NDIT · NCYSKIP)
(4)
and the total observing time is:
ttot = tsource + tskip
(5)
Typical duty cycles (tsource /ttot ) are about 70%.
NCYSKIP
N_cycl_chop
NCYSKIP
N_cycl_chop
An
Bn
Bn
An
T_nod
NDIT
NDITSKIP
NDITSKIP
DIT
Ac
Bc
Ac
Bc
T_chop
Figure 15: Data timing in VISIR. Ac and Bc refer to the two chopper positions, An and Bn refer to
the two nodding (telescope) positions. Note the AnBnBnAn cycle sequence for the nodding to save
observing time.
VISIR User Manual
4
.
17
Observing with VISIR at the VLT
4.1
Proposal preparation
Tools are available to prepare the observations, either during phase 1 (call for proposals), or during
phase 2 (creation of observing blocks by the observer):
• The exposure time calculator (ETC available at http://www.eso.org/observing/etc/) may be
used to estimate the integration time needed to obtain the required S/N for a given instrument
setting; because of the numerous sky absorption lines and the detector feature (see Fig. 5), it
is recommended to display the S/N as a function of wavelength when using the spectrograph
ETC;
• As for all VLT instruments, astronomers with granted VISIR telescope time prepare their observations using the phase 2 proposal preparation tool
(P2PP), described at
http://www.eso.org/observing/p2pp/P2PP-tool.html. Acquisitions, observations and calibrations are coded via observing templates. One or more templates build up an observing block
(OB). They contain all the information necessary for the execution of a complete observing
sequence. An overview of the available VISIR templates and their parameters is given in §6 of
this manual.
• For each science template, the user has to provide a finding chart so that the target can be
acquired. In addition to the general instruction on how to create these finding charts, see
http://www.eso.org/observing/p2pp/ServiceMode.html, the following VISIR requirements
apply:
– All finding charts have to be made using existing infrared (K-band or longer wavelength)
images. Typically, 2MASS or DENIS K-band images are acceptable, although higher spatial
resolution may be preferable.
– If the wavelength at which the finding chart has been taken is different from that of the
science observation, e.g. a K–band finding chart for a 10µm spectroscopic template, the
user has to describe clearly how to identify the target at the observing wavelength in the
README section of the programme description. Adequate examples of such comments
are:
∗ The target will be the brightest source in the field of view at 10µm .
∗ At 10µm , there will be two bright sources in our field of view. The science target is
the southernmost of these two.
Note that observations close to zenith during meridian crossing should be avoided, because of fast
tracking speeds that do not allow proper background cancelation after nodding.
Questions related to the VISIR Phase1 and Phase 2 observing preparation should be directed to the
User Support Department ([email protected]).
4.2
4.2.1
Telescope observing parameters
Instrument orientation on the sky
By default, the imager orientation is such that North is at the top and East is to the left. For the
spectrometer, the default orientation is rotated by 90◦ respective to the imager, so that the North is
to the left and the East to the bottom, with the slit orientation along the North-South direction.
Since VISIR is mounted on a rotator at the Cassegrain focus of Melipal, it is possible to change the
default orientation of VISIR on the sky, for example, to obtain the spectra of two objects at once.
The parameter TEL.ROT.OFFANGLE, defaulted to 0◦ , is used for this purpose. If P A represents the
VISIR User Manual
.
18
required position angle on the sky east of north (i.e., counted positively from north to east) within
the range 0 to 360◦ , then
TEL.ROT.OFFANGLE = 360 − PA
.
4.2.2
Chopping parameters
The chopping technique, as described in § 2, is based on beam switching using the moving secondary
mirror of the telescope. It allows to alternatively observe a field, then another field offset from the
first by a chopping distance or throw, called TEL.CHOP.THROW, see Fig. 16. This parameter can be set
by the user. To avoid chopping inside the object it is recommended to use a chopping and nodding
throw which is ∼ 1.5 times larger than the estimated MIR diameter of the object. In the case of point
sources, the throw is usually set around ∼1000 to ensure proper separation of the different beams. The
maximum chopping throw at the VLT is 3000 and the minimum is 800 . For good image quality, and
good background cancelation, chopping and nodding throws below 1500 are recommended (see § 4.8.1).
Note that for chopping throws larger than the field-of-view, the negative beams will not be seen on the
detector, and the integration times have to be adjusted accordingly.
The chopper position angle, TEL.CHOP.POSANG, is the angle of chopping counted East of North (see
Fig. 16)2 . This parameter can be set by the observer. In order to keep the same distribution of
beams on the detector for a different rotator angle (TEL.ROT.OFFANGLE) as in the default rotator
position, then TEL.CHOP.POSANG must be equal to TEL.ROT.OFFANGLE. In particular, this is the case
in spectroscopy if the observer wishes to have the 3 beams along the slit.
As stated in Sect 3.5, the chopping frequency is not a parameter accessible to the observer, it is fixed
internally to ensure the best data quality.
North
−−
n
itio
Pos
le
ang
ow
hr
rt
pe
op
Ch
Pointing position
East
+
Figure 16: Definition of chopping parameters from the telescope point–of-view. If the position angle (P A) is measured counter–clockwise from North to East with PA between 0 and 360◦ , then
TEL.CHOP.POSANG is 360◦ − P A. The positive beam (+) is obtained when the M2 is at Chopping
Position A and corresponds to the pointing position of the telescope as given in the FITS header. The
negative beam (-) is obtained by moving the M2 so that it points to a position angle on the sky given
by PA and a throw of TEL.CHOP.THROW from the telescope pointing position (Chopping Position
B). If TEL.CHOP.POSANG = TEL.ROT.OFFANGLE = 360◦ - PA, the resulting image on the detector will
appear as in one of the nodding position images illustrated in Fig. 19.
2 In practice, the telescope is actually given an offset equal to TEL.CHOP.THROW/2 along the angle given by PA.
Relative to its idle position and looking from the M1 to the sky, the M2 oscillates along PA between two positions given
by ± TEL.CHOP.THROW/2. This is completely transparent to the user.
VISIR User Manual
4.2.3
.
19
Nodding parameters
The nodding technique allows to switch from one field to another by offsetting the telescope by several
tens of arc–seconds. It allows to correct for optical path residuals that remain after chopping (§ 2).
The nodding period is 90 s for exposure time equal or longer than 180s, or is half this value for shorter
exposure times. This parameter can only be modified by the instrument operator.
In all the ’AutoChopNod’ templates, the nodding offset is equal to TEL.CHOP.THROW and cannot be
modified.
In order to reach Nodding Position B, the telescope executes an offset of TEL.CHOP.THROW, along a
position angle equal to
• PA + 90◦ = 360◦ - TEL.CHOP.POSANG + 90◦ , if SEQ.CHOPNOD.DIR = PERPENDICULAR,
• PA + 180◦ = 180◦ - TEL.CHOP.POSANG, if SEQ.CHOPNOD.DIR = PARALLEL.
The resulting distribution of images on a frame is illustrated in Fig.19. In imaging, more flexibility
on the nodding offsets are possible with the VISIR img obs GenericChopNod template.
4.3
Target acquisition
Observing blocks must start with an acquisition template. Pointing to a target can only be performed
through an acquisition template. Target coordinate, name and proper motion are all set in the
acquisition templates.
The execution of the acquisition templates presets the telescope to the target coordinate given by
TEL.TARG.ALPHA and TEL.TARG.DELTA. Offsets with respect to the target coordinates can be specified
by TEL.TARG.OFFSETALPHA and TEL.TARG.OFFSETDELTA and allow, for example, to use a bright offset
star for precise acquisition. To guarantee proper centering within the slit when using an offset star, the
angular separation between the offset star and the target should not be larger than 6000 . Acquisition
with an offset star has not been tested with the narrow, 0.400 slit and should be avoided in P76. Note
that the convention
TEL.TARG.ALPHA + TEL.TARG.OFFSETALPHA = RA(offsetstar)
TEL.TARG.DELTA + TEL.TARG.OFFSETADELTA = DEC(offsetstar)
3
is used . The target can be further offset to a particular position on the detector or in the slit by
manual intervention by the operator.
There are two acquisition templates for imaging, VISIR img acq Preset, VISIR img acq MoveToPixel
and one for spectroscopy, VISIR spec acq MoveToSlit. The observing parameters are described in
§ 8.1.
The effect of all acquisition templates is first to point the telescope so that the center of the detector
match the target coordinates entered by the user, within the accuracy of the VLT pointing (see below).
For VISIR spec acq MoveToSlit, the first acquisition images are obtained with the OPEN (15.300 )
slit.
Then,
• Both VISIR img acq MoveToPixel and VISIR spec acq MoveToSlit requires interaction with
the instrument operator or night support astronomer in order to center the target at the appropriate location on the detector. Without further indication given by the observer, the default
locations are:
– the center of the detector, for VISIR img acq MoveToPixel and SEQ.CHOPNOD.DIR = PARALLEL;
3 This
convention is identical to the UVES one, but differs, from example, from the ISAAC or NACO one.
VISIR User Manual
.
20
– in the top left quadrant of the detector, at a distance equal to TEL.CHOP.THROW/2
from the center of the detector in both X and Y, for VISIR img acq MoveToPixel and
SEQ.CHOPNOD.DIR = PERPENDICULAR;
– at the center of the chosen slit, for VISIR spec acq MoveToSlit.
In service mode, acquisition with these templates are limited to objects brighter than 0.2 Jy.
This limit is particularly constraining for VISIR spectroscopic observations. All acquisition
images are recorded and archived.
As part of the execution of the VISIR spec acq MoveToSlit template, an image used to measure
the slit location is always taken and archived. In service mode, through slit images are also taken
and archived so that the user can assess the correct centering of her/his object. The slit location
image and the through–slit images are automatic procedures that cannot be modified by a
service mode observer. Their execution time is included in the advertised execution time of the
spectroscopic acquisition template.
• If the target coordinates are well known, VISIR imaging modes allow to perform blind preset
observations with the VISIR img acq Preset template. In this case, no acquisition images are
taken. The target will be located at the center of the detector with an accuracy limited by the
accuracy of the guide star (typically 1 00 RMS). If both the target coordinates and the guide
star ones are within the same astrometric systems, the pointing accuracy is limited by the relative accuracy between the coordinates of the two objects. In particular, the pointing accuracy
maybe affected by significant (usually unknown) proper motion of the guide star. Note that the
observatory does not guarantee the accuracy of the world coordinate systems (WCS) keywords
in the FITS headers.
For a successful completion of an OB, the observer has to ensure that correct target coordinates are
provided for the equinox J2000.0 ideally at the epoch of the observations4 . The following cases require
special care:
• imaging in the small field: in some conditions, an error of less than 1000 on the coordinates can
bring the target outside of the field;
• spectroscopic acquisition: in some conditions, an error of less than 7.500 on the coordinates can
bring the target outside of the wide slit used.
Errors of such scale are common in the following situations:
• high proper-motion stars: in particular, if the epoch of the VISIR observations is significantly
different from the epoch for which the coordinates were determined.
• point-like sources within extended objects: such as an AGN: a number of catalogues do not
provide accurate coordinates of the nucleus. Coordinates given by 2MASS are more reliable.
• coordinates obtained with low spatial resolution instrument, such as MSX, etc...
For solar system objects, the J2000.0 equinox, topocentric, ICRF or FK5 coordinates at the epoch
of the observations are required, as the Telescope Control System takes into account precession,
nutation, annual aberration and refraction. On the contrary, the topocentric, apparent coordinates at
the observatory, often used in other observatories, should not be used. Additional velocity parameters
corresponding to µ(α) cos δ and µ(δ) must be given in 00 /s.
4 In particular, note that P2PP only accepts coordinates for J2000.0. Entries for equinox and proper motions are not
(yet) taken into account.
VISIR User Manual
4.4
.
21
Guide stars
Guide stars are mandatory for active optics and field stabilization. Any VLT programme should make
sure that a guide star (USNO catalog) with a V = 11 − 13 mag is available within a field of 8’ around
the object.
If TEL.AG.GUIDESTAR is ’CATALOGUE’, a guide stars from the guide star catalog will be automatically selected by the TCS. If TEL.AG.GUIDESTAR is ’SETUPFILE’, the observer has to provide the
coordinates of the GS. The coordinates of the guide star also fix the reference point for the World
Coordinate System coordinates, that appear in the FITS header of the files.
In both cases, the telescope operator acknowledges the guide star. Depending on the weather conditions or if the star appears double in the guide probe, the telescope operator may have to select
another guide star. Therefore, If the observer has selected a guide star for astrometric purposes – for
example, to insure the repeatability of the pointings between different OBs –, a clear note should be
given in the README file, for service mode observations, or be specifically mentioned to the night
time astronomer, in visitor mode. As stated above, the observatory does not guarantee the accuracy
of the world coordinate systems (WCS) keywords in the FITS headers.
4.5
Brightness limitations
There are currently no brightness limitations with VISIR. However, it is advised to observe only
sources fainter than 500 Jy in N and 2500 Jy in Q to avoid detector artifacts (§ 3.7).
4.6
Overheads
The VLT telescope overhead for one OB which includes active optics setting, selection of guide star,
field stabilization is 6 min.
VISIR instrument configurations can be changed in a short time. For example a complete change of
instrument settings takes less than 2 minutes. The total time for an image acquisition of a bright
sources (> 1 Jy) takes ∼ 5 min. for one fine acquisition iteration, or in blind preset 2 min. Spectroscopic acquisitions take longer and are strongly dependent on the source brightness : an overhead of
15 min. is accounted for sources > 1 Jy, while 30 min. are required for sources between 0.2 and 1 Jy,
respectively.
Instrument overheads due to chopping and nodding duty cycle losses have been measured to be 25%
of the observing time for the imager and 50% for the spectrometer, respectively.
The total observing time requested by the observer must include telescope and instrument overheads.
4.7
Calibration observations
MIR observations depend strongly on the ambient conditions such as humidity, temperature or airmass. In service mode science observations are interlace by calibration observations on a timescale of
3h. Observations of photometric standards will be provided by the observatory within a time interval
of three hours w.r.t. the science observations.
Calibrators, unless provided by the observer, are selected from the MIR spectro–photometric standard
star catalog of the VLT (http://www.eso.org/instruments/visir). This catalog is based on the
radiometric all–sky network of absolutely calibrated stellar spectra by Cohen et al.5 . This list is
supplemented by MIR standards used by TIMMI26 .
5 Cohen
et al., 1999, AJ 117, 1864
6 http://www.ls.eso.org/lasilla/sciops/3p6/timmi/html/stand.html
VISIR User Manual
.
22
At present the standard star catalog contains 425 sources. Zero point fluxes (Jy) have been calculated
for the VISIR filter set by taking into account the measured transmission curves (Fig. 21), the detector
efficiency (Fig. 9) and an atmosphere model (Fig. 1).
A PSF can be derived from these photometric standard star observations. However, it is not guaranteed that the accuracy is sufficient for deconvolution purposes. If the observer requires a specific PSF
measurement, (s)he has to provide the corresponding PSF OB.
Observations of photometric standards provided by the observatory are taken using the
VISIR img cal AutoChopNod template (§ 6) with the following settings:
SEQ.TIME
TEL.CHOP.POSANG
TEL.CHOP.THROW
SEQ.CHOPNOD.DIR
180 sec for N and 360 sec for Q band
0◦
1000
PERPENDICULAR
Filter INS.FILT1.NAME and pixel scale INS.PFOV will be set according to the science observations.
In spectroscopy, the observatory will provide spectro–photometric observations of a telluric (K type)
standard star in the Low Resolution mode, based on the same catalog as for imaging with an
airmass difference no larger than 0.2 AM. Such a calibration measurement will be performed at
least once per night, per instrument configuration. More precisely the following settings of the
VISIR spec cal LRAutoChopNod template (§ 6) will be used:
SEQ.TIME
TEL.CHOP.POSANG
TEL.CHOP.THROW
SEQ.CHOPNOD.DIR
180 sec
0◦
800
PARALLEL
The wavelength setting INS.GRAT1.WLEN and INS.SLIT1.WIDTH will be adjusted to the science observation.
Important note:
The observatory does not provide standard calibrations for VISIR medium and high resolution spectroscopy. Thus for medium and high resolution mode the observer has to supply his own calibration by
supplying a calibration OB to each science OB. The observing time needed to execute this calibration
is charged to the observer. Ideally, early type stars should be chosen.
For both imaing and spectroscopy, day calibrations of VISIR are performed with an extended source
that mimics a black–body with adjustable flux (by regulating its temperature). For each instrument
mode, a corresponding flat–field is recorded, which consists of a series of images with different background levels. Bad pixels, gain maps and fringing patterns can, in principle, be derived from these
flat-fields. However, at the moment, the scientific value of the application of these corrections is not
established. Day calibrations are supplied to the user on an experimental basis.
4.8
Known problems
In addition to effects caused by the cosmetic quality of the detectors mentioned above (§ 3.7), the
following problems may affect the quality of the observations.
4.8.1
Decreased image quality
The image quality can be severely degraded in observations obtained with a large (> 1500 ) chopper
throw, as can be seen in Fig.17. The origin of this problem has been localized and all efforts will be
made to implement a solution as soon as possible.
VISIR User Manual
ESO
STD
.
r.VISIR.2005−01−29T03:48:24.517_tpl_0000.fits
05:25:02.052 −10:19:44.00 2000
smette/Skycat
Apr 17, 2005 at 20:08:18
ESO
STD
smette/Skycat
23
r.VISIR.2005−01−29T03:48:24.517_tpl_0000.fits
05:25:02.052 −10:19:44.00 2000
Apr 17, 2005 at 20:09:01
Figure 17: Image of a star obtained in the PAH1 filter in the Small Field (0.07500 /pixel), and with
TEL.CHOP.THROW = 25 00 , SEQ.CHOPNOD.DIR = PARALLEL and TEL.CHOP.POSANG = 90◦ . Left: the
core of the star image appears double with two peaks separated by ≈ 0.200 . Right: the wings of the
image reveals 2 additional components on both sides of the core, separated by 1.800 and containing
≈ 4% of the total flux. Note also the electronic ghosts that appear as white features immediately
above and below the core, and which only affect bright sources.
4.8.2
Low–level stripes
The background level of individual DIT images fluctuates not only with the varying sky background
but also with the detector temperature. The latter follows the 1Hz period of the closed–cycle cryo–
cooler. The mean background level in two consecutive half–cycle frames (corresponding to the two
chopper positions) may therefore not be equal. If this difference is larger than a few tens of ADUs,
structures in the gain maps will appear as low–level stripes. Such stripes tend to smooth out on long
integrations.
4.8.3
Bad residuals
The chopping and nodding technique does not always lead to a satisfactory removal of all the structures
seen in individual images. Bad residuals have been found to occur in the following situations:
• in observations carried out close to zenith and, to a lesser extent, close to the meridian in general:
the likely cause is the fast rotation of the field relative to the telescope structure;
• in variable atmospheric conditions.
In addition, it seems that imaging of extended objects are also more likely to be affected by low–level
bad residuals, similar to fringes in some aspects, whose orientation on the images changes at the same
angular velocity as the rotator. The origin of these structures is not understood.
4.8.4
Residuals of sky emission lines
In spectroscopy, the scanners of the grating units may still show a small residual motion at the
beginning of an exposure, or, mainly for the HR or HRX modes, show some jitter after a nodding
offset. The first few frames at a given wavelength setting may therefore show stronger than expected
residuals at the wavelength of the sky emission lines (more exactly, of the wings of sky emission lines).
For the HR and HRX modes, the residuals of the scanner jitter tend to cancel out on long integrations,
and lead to a very slight decrease of the spectral resolution.
VISIR User Manual
4.8.5
.
24
Fringes
The DRS detector shows fringes which are generated in the detector substrate. One example of such
fringes is shown in Fig. 18 for the medium–resolution mode. The fringes are stable and are not apparent in chopped images, but the spectra are modulated. Division of the extracted spectra by standard
star spectra simultaneously removes most of the fringes and corrects for telluric features.
Figure 18: VISIR spectrum in staring, medium–resolution mode showing the detector fringing (white).
The detector absorption feature at 8.8 µm is visible as black horizontal bar (cf. Fig. 9). Dark vertical
stripes are caused by the non–uniform gain of the different electronic amplifiers. These features are
largely removed by chopping.
5
VISIR data
5.1
Data format
One FITS file is saved for each telescope nodding position. This file is a data cube and contains for
each chopping cycle:
1. half cycle frames of the on–source position (A) of the chopper,
2. the average of the current and all previous(A–B) chopped frames,
In addition, the last plane of the cube contains the average of all chopped frames.
For the default value of the rotator angle (0◦), images are oriented North up and East left. Spectroscopic data are aligned horizontally in the spatial and vertically in the dispersion direction (cf.
Fig.18). For the LR and MR modes, the short wavelength appear at the top of the frames. For the
HR and HRX modes, the short wavelength is at the top of the frame if the side B of the dual–grating
is used, and at the bottom of the frame of the side A is used.
5.2
Pipeline
The VISIR pipeline has been developed by ESO/DMD and uses the ESO/CPL library. The main
observation templates are supported by the pipeline reductions. Raw images of imaging and spectroscopic observations are recombined. Spectra are extracted and calibrated in wavelength (§ 5.3) for all
VISIR User Manual
.
25
spectroscopic modes in low–, medium–, and high–resolution. Sensitivity estimates based on standard
star observations are provided both in imaging and spectroscopy (§ 4.7). Public release of the VISIR
pipeline is foreseen for the beginning of P76.
The pipeline currently supports the following templates :
• VISIR img obs AutoChopNod
• VISIR spec obs LRAutoChopNod
• VISIR spec obs MRAutoChopNod
• VISIR spec obs HRAutoChopNod
• VISIR spec obs HRXAutoChopNod
In mosaic (or raster) mode (VISIR img obs GenericChopNod) only raw frames are delivered, e.g.
mapping reconstruction algorithms are not supported.
5.3
VISIR spectrometer data
Optical distortion correction
Spectra are deformed by optical distortion and slit curvatures. The VISIR spectrograph uses curved
slits to cancel the distortion of the pre–slit optics. Thus the slit projected on the sky is straight. There
is an additional linear distortion in both dispersion and cross–dispersion direction of the detector. The
following algorithm is supported by the pipeline for low and medium resolution mode. Let us define
the detector pixels in dispersion direction by x and in cross-dispersion direction by y, respectively :
a) The skew angle along x with Φ and along y with Ψ.
b) The maximum curvature along x with ∆ and along y with .
Φ is defined positive in clockwise–direction and Ψ counter–clockwise; ∆ is positive by increasing x
and by decreasing y, respectively. Measured values of the distortion parameters are in the low and
medium resolution mode Φ = 1.6o and Ψ = 0.7o . The curvatures in the low resolution mode are
= 1.04 pixel, ∆ = 0.08 pixel and for the medium resolution mode are = 0.26 pixel, ∆ = 0.08 pixel.
The center of the lower left of the detector is at (1,1). Therefore, the fix point, which is the detector
center, is at (128.5, 128.5) for the n = 256 pixel array of the DRS.
The fix point is moved to (1,1) by:
n+1
n+1
,y −
)
2
2
and the skew is corrected along the cross-dispersion:
f1 (x, y) = (x −
(6)
f2 (x, y) = (x + y · tan(Ψ), y)
(7)
f3 (x, y) = (x, y + x · tan(Φ))
(8)
and along the dispersion direction:
p
The curvature is a segment p
of a circle with radius, R in x–direction given by: n = 2 · (2R − )
and in y–direction by: n = 2 ∆ · (2R∆ − ∆). It is corrected along the cross-dispersion:
p
f4 (x, y) = (x, y − sign() · (R − R2 − x2 )) ; ( 6= 0)
(9)
and along the dispersion:
f5 (x, y) = (x + sign(∆) · (R∆ −
q
R2∆ − y2 ), y)
;
(∆ 6= 0)
Finally, the origin of the coordinate system is moved back from the fix point to (1,1):
(10)
VISIR User Manual
.
f6 (x, y) = (x +
n+1
n+1
,y +
)
2
2
26
(11)
Spectral extraction is similar to the TIMMI2 pipeline and described by Siebenmorgen et al. 2004, AA
414, 123.
Wavelength calibration
A first order wavelength calibration is given by the optical model of the instrument. Its precision
is about ±10 pixels for the low and medium resolution mode and ±15 pixels for the high resolution
mode. The wavelength calibration can be refined by using Fabry-Perot Etalons plates or atmospheric
lines. In the VISIR FITS file, chopper half-cycle frames, which are dominated by sky emission lines,
are stored (§ 5.1). They can be used to fine–tune the wavelength calibration to sub–pixel precision
by comparison with a model of the atmospheric lines. This method is used by the pipeline. More
specifically, the zero–point of the wavelength calibration is obtained by cross–correlating the observed
sky spectrum with a HITRAN model of the sky emission lines.
The chopped frames cannot be used for calibration with atmospheric lines because the chopping process results in a near perfect cancelation of sky lines.
Atmosphere absorption correction
The atmosphere does not uniformly absorb the MIR radiation (§ 2.1). At some wavelengths it is completely transparent, at others partly or completely opaque. Differential absorption is often corrected
by dividing the extracted spectrum by a reference spectrum. This procedure may cause numerical
instabilities at wavelengths close to strong sky lines that might amplify the noise.
Photometry
Spectro-photometric calibration of low and medium resolution spectra can be achieved with the MIR
standard star list provided by the Observatory (see § 4.7). For high-resolution spectroscopy only
calibrators known with high precision, such as, A stars or asteroids, should be considered. However,
even early A stars are known to have some hydrogen absorption lines in the N and Q band.
VISIR User Manual
6
27
.
VISIR templates description
6.1
Acquisition
Each OB needs to start with an acquisition template, they are described in § 4.3.
6.2
Observing with the imager
VISIR img obs AutoChopNod
This template permits observing a source in imaging configuration with various sub-settings. The
observer must specify filter, pixel scale, chopper throw, which is in the range of 800 to 3000 . The
keyword SEQ.CHOPNOD.DIR is set to PARALLEL or PERPENDICULAR, which results in images as shown
in Fig. 19. PARALLEL considers an equal nodding and chopping amplitude which are both in parallel
direction. It is recommended for faint, extended sources, for which the spatial resolution is not so
crucial. PERPENDICULAR considers an equal nodding and chopping amplitude; however in perpendicular
direction. Note that while the telescope offset is in positive (East) direction, the resulting image on the
detector will move to the West. This technique is recommended for point or relatively small extended
(< 500 ) sources (Fig. 3).
N
+
−
−
++
−
E
Nodding Position A
N
E
+
−
Nodding Position B
A−B
+
+
+
−
−
−
−
+
Nodding Position A
Nodding Position B
A−B
Figure 19: Schematic drawing of the content of a frame obtained with TEL.CHOP.POSANG = 0 and
SEQ.CHOPNOD.DIR = PARALLEL (top) and SEQ.CHOPNOD.DIR=PERPENDICULAR (bottom). In the individual nodding positions, the positive beams correspond to the chopper position A and the negative
beams to the chopper position B. Note that the default pointing position of the telescope corresponds
to the center of the detector. Within the accuracy of the telescope pointing, this location matches the
nodding position A, chopper position A if SEQ.CHOPNOD.DIR = PARALLEL.
The keywords SEQ.JITTER.WIDTH allows chopping and nodding with random offsets so that a jitter
pattern is performed. This technique allows to reconstruct bad pixels. For SEQ.JITTER.WIDTH = 0 no
jitter is performed and the resulting image depends on the setting of SEQ.CHOPNOD.DIR. The chopping
period is set by the system and the nodding period is fixed to 90 s. The number of nodding cycles
Ncycl nod is computed according to the total observation time (§ 3.8).
VISIR User Manual
.
28
VISIR img obs GenericChopNod
This imaging template enhances the flexibility of nodding offsets, and allows the user to specify them
in a list of relative offset positions. In the most simple application, only one offset position is specified.
This allows to record nodding pairs, i.e. cycle of on–off observations, using a flexible offset position.
Additional jitter offsets can be specified. More than one entry in the offset list results in a freely
programmable pattern of nodding pairs. Note that the integration time, SEQ.TIME, specified refers
to only one nodding pair. The total observing time is given by the product of SEQ.NOFFbySEQ.TIME.
The offset positions are calculated as the cumulative sum of offsets, i.e. are defined relative to the
previous offset positions. Note that the telescope always returns to the first (reference) position, when
specifying a list of offsets. This mode can be exploited to perform mosaic or raster imaging. The
first reference position can then be considered as a sky observation while the offsets refer to object
positions. It is recommended to offset to positions that result in observations of overlapping fields,
which enhances the redundancy after image reconstruction.
N
Nodding Position B1
Nodding Position B2
E
Nodding Position B3
Preset/Reference Position A
Figure 20: Illustration of generating raster maps with VISIR img obs GenericChopNod.
An illustration of generating an raster map can be found in Fig. 20. The following parameters
correspond to this setting:
SEQ.NOFF
SEQ.OFFSET1.LIST
SEQ.OFFSET2.LIST
SEQ.OFFSET.COORDS
3
30 10 10
30 -10 -10
SKY
VISIR User Manual
.
29
Note that depending on choice of the integration time SEQ.TIME, several nodding cycles might result,
e.g. pattern like AB1B1AAB1B1A..AB2B2AAB2B2A..AB3B3AAB3B3A.
Pre–imaging observations: As of Period 76, the observatory supports a fast data release for VISIR pre–
imaging observations. Pre–imaging images must be obtained either with the VISIR img obs AutoChopNod
or VISIR img obs GenericChopNod templates. The SEQ.CATG keyword must be set to PRE–IMAGE.
In addition, the name of the OB must start with the prefix PRE.
6.3
Observing with the spectrometer
Conceptually the same observing techniques applies for spectroscopy as well as for imaging. The
default slit orientation is in North-South direction. The length of the slit is selected by the keyword
INS.SLIT1.TYPE: only for cross-dispersed, high-resolution, observations SHORT must be used, otherwise
LONG is the default setting.
A preferred observing strategy is called ”nodding on the slit”, where the chopping and nodding
amplitudes are small (SEQ.CHOPNOD.DIR = PARALLEL). Note that ”nodding on the slit” requires to
set the telescope rotator offset angle and the M2 chopping position angle to the same value (which is,
in general, different from 0). This is useful to acquire two targets simultaneously in the slit.
The keyword SEQ.JITTER.WIDTH allows to apply random offsets along the slit.
More complex source geometries might require larger amplitudes, and/or
SEQ.CHOPNOD.DIR = PERPENDICULAR in order to avoid self-cancellation.
Low and medium resolution
Templates for low and medium resolution spectroscopy are:
VISIR spec obs LRAutoChopNod and VISIR spec obs MRAutoChopNod, respectively. Observing parameters are: total integration time (SEQ.TIME), central wavelength (INS.GRAT1.WLEN), the slit width
INS.SLIT1.WIDTH and SEQ.CHOPNOD.DIR (§ 6.2).
High resolution: long–slit mode
Template for high resolution spectroscopy is VISIR spc obs HRAutoChopNod. Three order sorting
filter at 8.02, 12.81 and 17.03µm, INS.FILT2.NAME = ([H2 S4],[Ne II],[H2 S1]) are available. Other
observing parameters are: total integration time (SEQ.TIME), central wavelength (INS.GRAT1.WLEN),
the slit width (INS.SLIT1.WIDTH) and SEQ.CHOPNOD.DIR (§ 6.2).
High resolution: cross–dispersed mode
VISIR spc obs HRXAutoChopNod is functionally similar to VISIR spc obs HRAutoChopNod, but uses a
grism for cross-dispersion and order-separation. Two central wavelength settings (9.66 and 12.27 µm)
are currently available. Note that the effective length of the spectrograph slit is limited to ∼ 400 . Total
integration time (SEQ.TIME), the slit width (INS.SLIT1.WIDTH) and SEQ.CHOPNOD.DIR are specified
as usual (§ 6.2).
6.4
Calibration
Specific templates exist for the observations of photometric and spectro-photometric standard stars.
They offer the same functionality as the corresponding science templates, but allow to monitor the
sensitivity and image quality by observing calibration standard stars.
VISIR User Manual
7
.
30
Checklist for Phase 2 preparation
1. Acquisition: Are the coordinates accurate in the equinox J2000.0 reference frame? For highproper motion objects, are they valid for the epoch of the observations? For solar system
objects, are they in the topocentric, ICRF or FK5, J2000.0 reference frame at the epoch of the
observations?
2. Acquisition: Is relative good astrometric accuracy required? if yes: a guide star should be
provided whose distance relative to the target is accurately known.
3. Pre–imaging? If OBs are part of the pre–imaging run of your programme, the name of the OB
must start by PRE and the SEQ.CATG keyword must be set to PRE–IMAGE.
4. Calibrations: For calibration OBs, use the appropriate VISIR img cal AutoChopNod or
VISIR spc cal LR/MR/HR/HRXAutoChopNod templates.
5. Position angle: If the observations must be carried out at a position angle different from
0, check § 4.2.1 and § 4.2.2. In particular, it is useful to clearly indicates in the README
file if TEL.CHOP.POSANG is not equal to TEL.ROT.OFFANGLE to warn the instrument operator
about the non-standard configuration. In spectroscopy, TEL.CHOP.POSANG must be equal to
TEL.ROT.OFFANGLE in order to have the 3 beams along the slit.
VISIR User Manual
8
8.1
.
31
Appendix: VISIR template parameters
Acquisition
VISIR img acq MoveToPixel.tsf
To be specified:
Parameter
INS.FILT1.NAME
INS.PFOV
SEQ.CHOPNOD.DIR
SEQ.TIME
TEL.AG.GUIDESTAR
TEL.CHOP.POSANG
TEL.CHOP.THROW
TEL.GS1.ALPHA
TEL.GS1.DELTA
TEL.ROT.OFFANGLE
TEL.TARG.ADDVELALPHA
TEL.TARG.ADDVELDELTA
TEL.TARG.ALPHA
TEL.TARG.DELTA
TEL.TARG.EQUINOX
TEL.TARG.OFFSETALPHA
TEL.TARG.OFFSETDELTA
Range (Default)
SIC PAH1 ARIII SIV 1 SIV
SIV 2 PAH2 PAH2 2 NEII 1
NEII NEII 2 Q1 Q2 Q3 (NODEFAULT)
0.075 0.127 (0.127)
PARALLEL
PERPENDICULAR (PARALLEL)
30..3600 (NODEFAULT)
CATALOGUE
SETUPFILE
NONE (CATALOGUE)
0..359 (0)
8..30 (8)
ra ()
dec ()
0..359 (0.0)
(0.0)
(0.0)
ra ()
dec ()
(2000.0)
(0.0)
(0.0)
Label
Imager Filter
Imager pixel scale
Relative Chop/Nod Direction
Total integration time (sec)
Get Guide Star from
Chopping Position Angle (deg)
Chopping Amplitude (arcsec)
Guide star RA
Guide star DEC
Rotator on Sky (=-PA on Sky)
RA additional tracking velocity
DEC additional tracking velocity
RA blind offset
DEC blind offset
VISIR img acq Preset.tsf
To be specified:
Parameter
TEL.AG.GUIDESTAR
TEL.GS1.ALPHA
TEL.GS1.DELTA
TEL.ROT.OFFANGLE
TEL.TARG.ADDVELALPHA
TEL.TARG.ADDVELDELTA
TEL.TARG.ALPHA
TEL.TARG.DELTA
TEL.TARG.EQUINOX
Range (Default)
CATALOGUE
SETUPFILE
NONE (CATALOGUE)
ra ()
dec ()
0..359 (0.0)
(0.0)
(0.0)
ra ()
dec ()
(2000.0)
Label
Get Guide Star from
Guide star RA
Guide star DEC
Rotator on Sky (=-PA on Sky)
RA additional tracking velocity
DEC additional tracking velocity
VISIR User Manual
.
32
VISIR spec acq MoveToSlit.tsf
To be specified:
Parameter
INS.FILT2.NAME
INS.SLIT1.TYPE
INS.SLIT1.WIDTH
SEQ.CHOPNOD.DIR
SEQ.TIME
TEL.AG.GUIDESTAR
TEL.CHOP.POSANG
TEL.CHOP.THROW
TEL.GS1.ALPHA
TEL.GS1.DELTA
TEL.ROT.OFFANGLE
TEL.TARG.ADDVELALPHA
TEL.TARG.ADDVELDELTA
TEL.TARG.ALPHA
TEL.TARG.DELTA
TEL.TARG.EQUINOX
TEL.TARG.OFFSETALPHA
TEL.TARG.OFFSETDELTA
Range (Default)
N SW N LW ARIII NEII 1
NEII 2 (NODEFAULT)
LONG SHORT (LONG)
0.40 0.75 1.00 (NODEFAULT)
PARALLEL
PERPENDICULAR (PARALLEL)
30..3600 (NODEFAULT)
CATALOGUE
SETUPFILE
NONE (CATALOGUE)
0..359 (0)
8..30 (8)
ra ()
dec ()
0..359 (0.0)
(0.0)
(0.0)
ra ()
dec ()
(2000.0)
(0.0)
(0.0)
Label
Acquisition Filter
Spectrometer Slit Type (long or
short)
Spectrometer Slit Width (arcsec)
Relative Chop/Nod Direction
Total integration time (sec)
Get Guide Star from
Chopping Position Angle (deg)
Chopping Amplitude (arcsec)
Guide star RA
Guide star DEC
Rotator on Sky (=-PA on Sky)
RA additional tracking velocity
DEC additional tracking velocity
RA blind offset
DEC blind offset
VISIR User Manual
8.2
.
33
Observation
VISIR img obs AutoChopNod.tsf
To be specified:
Parameter
INS.FILT1.NAME
INS.PFOV
SEQ.CATG
SEQ.CHOPNOD.DIR
SEQ.JITTER.WIDTH
SEQ.TIME
TEL.CHOP.POSANG
TEL.CHOP.THROW
Range (Default)
SIC PAH1 ARIII SIV 1 SIV
SIV 2 PAH2 PAH2 2 NEII 1
NEII NEII 2 Q1 Q2 Q3 (NODEFAULT)
0.075 0.127 (0.127)
PRE-IMAGE SCIENCE (SCIENCE)
PARALLEL
PERPENDICULAR (PARALLEL)
0..10 (0)
180..3600 (NODEFAULT)
0..359 (0)
8..30 (8)
Label
Imager Filter
Imager pixel scale
Observation Category
Relative Chop/Nod Direction
Random Jitter Width (arcsec)
Total integration time (sec)
Chopping Position Angle (deg)
Chopping Amplitude (arcsec)
VISIR img obs GenericChopNod.tsf
To be specified:
Parameter
INS.FILT1.NAME
INS.PFOV
SEQ.CATG
SEQ.JITTER.WIDTH
SEQ.NOFF
SEQ.OFFSET.COORDS
SEQ.OFFSET1.LIST
SEQ.OFFSET2.LIST
SEQ.TIME
TEL.CHOP.POSANG
TEL.CHOP.THROW
Range (Default)
SIC PAH1 ARIII SIV 1 SIV
SIV 2 PAH2 PAH2 2 NEII 1
NEII NEII 2 Q1 Q2 Q3 (NODEFAULT)
0.075 0.127 (0.127)
PRE-IMAGE SCIENCE (SCIENCE)
0..10 (0)
1..100 (NODEFAULT)
SKY DETECTOR (NODEFAULT)
(NODEFAULT)
(NODEFAULT)
180..3600 (NODEFAULT)
0..359 (0)
8..30 (10)
Label
Imager Filter
Imager pixel scale
Observation Category
Random Jitter Width (arcsec)
Number of offset positions
Offset coordinates
List of offsets in RA or X
List of offsets in DEC or Y
Total integration time (sec)
Chopping Position Angle (deg)
Chopping Amplitude (arcsec)
VISIR spec obs LRAutoChopNod.tsf
To be specified:
Parameter
INS.GRAT1.WLEN
SEQ.CHOPNOD.DIR
SEQ.JITTER.WIDTH
SEQ.TIME
TEL.CHOP.POSANG
TEL.CHOP.THROW
Range (Default)
8.5 8.8 9.8 11.4 12.2 12.4 (NODEFAULT)
PARALLEL
PERPENDICULAR (PARALLEL)
0..10 (0)
180..3600 (NODEFAULT)
0..359 (0)
8..30 (8)
Label
Spectrometer Wavelength (microns)
Relative Chop/Nod Direction
Random Jitter Width (arcsec)
Total integration time (sec)
Chopping Position Angle (deg)
Chopping Amplitude (arcsec)
VISIR User Manual
.
34
VISIR spec obs MRAutoChopNod.tsf
To be specified:
Parameter
INS.GRAT1.WLEN
SEQ.CHOPNOD.DIR
SEQ.JITTER.WIDTH
SEQ.TIME
TEL.CHOP.POSANG
TEL.CHOP.THROW
Range (Default)
8.8 11.4 (NODEFAULT)
PARALLEL
PERPENDICULAR (PARALLEL)
0..10 (0)
180..3600 (NODEFAULT)
0..359 (0)
8..30 (8)
Label
Spectrometer Wavelength (microns)
Relative Chop/Nod Direction
Random Jitter Width (arcsec)
Total integration time (sec)
Chopping Position Angle (deg)
Chopping Amplitude (arcsec)
VISIR spec obs HRAutoChopNod.tsf
To be specified:
Parameter
INS.FILT2.NAME
INS.GRAT1.WLEN
SEQ.CHOPNOD.DIR
SEQ.JITTER.WIDTH
SEQ.TIME
TEL.CHOP.POSANG
TEL.CHOP.THROW
Range (Default)
NEII 2 H2S 1 H2S 4 (NEII 2)
7.80..19.18 (12.810)
PARALLEL
PERPENDICULAR (PARALLEL)
0..10 (0)
180..3600 (NODEFAULT)
0..359 (0)
8..30 (8)
Label
Spectrometer Filter
Spectrometer Wavelength (microns)
Relative Chop/Nod Direction
Random Jitter Width (arcsec)
Total integration time (sec)
Chopping Position Angle (deg)
Chopping Amplitude (arcsec)
VISIR spec obs HRXAutoChopNod.tsf
To be specified:
Parameter
INS.GRAT1.WLEN
SEQ.CHOPNOD.DIR
SEQ.JITTER.WIDTH
SEQ.TIME
TEL.CHOP.POSANG
TEL.CHOP.THROW
Range (Default)
7.60..28.08 (NODEFAULT)
PARALLEL
PERPENDICULAR (PARALLEL)
0..10 (0)
180..3600 (NODEFAULT)
0..359 (0)
8..30 (8)
Label
Spectrometer Wavelength (microns)
Relative Chop/Nod Direction
Random Jitter Width (arcsec)
Total integration time (sec)
Chopping Position Angle (deg)
Chopping Amplitude (arcsec)
VISIR User Manual
8.3
.
35
Calibration
VISIR img cal AutoChopNod.tsf
To be specified:
Parameter
INS.FILT1.NAME
INS.PFOV
SEQ.CHOPNOD.DIR
SEQ.JITTER.WIDTH
SEQ.TIME
TEL.CHOP.POSANG
TEL.CHOP.THROW
Range (Default)
SIC PAH1 ARIII SIV 1 SIV
SIV 2 PAH2 PAH2 2 NEII 1
NEII NEII 2 Q1 Q2 Q3 (NODEFAULT)
0.075 0.127 (0.127)
PARALLEL
PERPENDICULAR (PERPENDICULAR)
0..10 (0)
30..3600 (NODEFAULT)
0..359 (0)
8..30 (8)
Label
Imager Filter
Imager pixel scale
Relative Chop/Nod Direction
Random Jitter Width (arcsec)
Total integration time (sec)
Chopping Position Angle (deg)
Chopping Amplitude (arcsec)
VISIR spec cal LRAutoChopNod.tsf
To be specified:
Parameter
INS.GRAT1.WLEN
SEQ.CHOPNOD.DIR
SEQ.JITTER.WIDTH
SEQ.TIME
TEL.CHOP.POSANG
TEL.CHOP.THROW
Range (Default)
8.5 8.8 9.8 11.4 12.2 12.4 (NODEFAULT)
PARALLEL
PERPENDICULAR (PARALLEL)
0..10 (0)
30..3600 (NODEFAULT)
0..359 (0)
8..30 (8)
Label
Spectrometer Wavelength (microns)
Relative Chop/Nod Direction
Random Jitter Width (arcsec)
Total integration time (sec)
Chopping Position Angle (deg)
Chopping Amplitude (arcsec)
VISIR spec cal MRAutoChopNod.tsf
To be specified:
Parameter
INS.GRAT1.WLEN
SEQ.CHOPNOD.DIR
SEQ.JITTER.WIDTH
SEQ.TIME
TEL.CHOP.POSANG
TEL.CHOP.THROW
Range (Default)
8.8 11.4 (NODEFAULT)
PARALLEL
PERPENDICULAR (PARALLEL)
0..10 (0)
30..3600 (NODEFAULT)
0..359 (0)
8..30 (8)
Label
Spectrometer Wavelength (microns)
Relative Chop/Nod Direction
Random Jitter Width (arcsec)
Total integration time (sec)
Chopping Position Angle (deg)
Chopping Amplitude (arcsec)
VISIR spec cal HRAutoChopNod.tsf
To be specified:
Parameter
INS.FILT2.NAME
INS.GRAT1.WLEN
SEQ.CHOPNOD.DIR
SEQ.JITTER.WIDTH
SEQ.TIME
TEL.CHOP.POSANG
TEL.CHOP.THROW
Range (Default)
NEII 2 H2S 1 H2S 4 (NEII 2)
7.80..19.18 (12.810)
PARALLEL
PERPENDICULAR (PARALLEL)
0..10 (0)
30..3600 (NODEFAULT)
0..359 (0)
8..30 (8)
Label
Spectrometer Filter
Spectrometer Wavelength (microns)
Relative Chop/Nod Direction
Random Jitter Width (arcsec)
Total integration time (sec)
Chopping Position Angle (deg)
Chopping Amplitude (arcsec)
VISIR User Manual
.
36
VISIR spec cal HRXAutoChopNod.tsf
To be specified:
Parameter
INS.GRAT1.WLEN
SEQ.CHOPNOD.DIR
SEQ.JITTER.WIDTH
SEQ.TIME
TEL.CHOP.POSANG
TEL.CHOP.THROW
Range (Default)
7.60..28.08 (NODEFAULT)
PARALLEL
PERPENDICULAR (PARALLEL)
0..10 (0)
30..3600 (NODEFAULT)
0..359 (0)
8..30 (8)
Label
Spectrometer Wavelength (microns)
Relative Chop/Nod Direction
Random Jitter Width (arcsec)
Total integration time (sec)
Chopping Position Angle (deg)
Chopping Amplitude (arcsec)
VISIR User Manual
9
.
37
Appendix: Filter transmission curves
The filter transmission has been measured using a Fourier Transform Spectrometer, at a temperature
of 35 K for filters manufactured by the company READING. Their absolute transmission curves are
displayed in Fig. 21. The other filters, manufactured by OCLI, have been measured using the WCU
and wavelength scans with the monochromator. Note that for these filters, the transmission curves
are normalized to 1, see Fig. 19.
Figure 21: Transmission curves of VISIR imager filters, manufactured by READING. Overplotted
(dashed) is the atmospheric transmission at low resolution. The absolute transmission values are
given, expressed in percent.
VISIR User Manual
.
Figure 18: – continued.
38
VISIR User Manual
.
39
Figure 19: Transmission curves of VISIR imager filters, manufactured by OCLI. Overplotted (dashed)
is the atmospheric transmission at low resolution. Only relative transmissions have been determined;
their values are normalized so that their peak transmission is equal to 1.