1
Debugging in Serial & Parallel
Part I
M. D. Jones, Ph.D.
Basic (Serial) Debugging
Center for Computational Research
University at Buffalo
State University of New York
High Performance Computing I, 2013
M. D. Jones, Ph.D. (CCR/UB)
Debugging in Serial & Parallel
Introduction
HPC-I Fall 2013
1 / 90
HPC-I Fall 2013
2 / 90
Software for Debugging
Debugging Tools
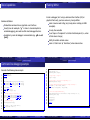
The most common method for debugging (by far) is the
“instrumentation” method:
One “instruments” the code with print statements to check values
and follow the execution of the program
Not exactly sophisticated - one can certainly debug code in this
way, but wise use of software debugging tools can be more
effective
Debugging in Serial & Parallel
Debugging in Serial & Parallel
Introduction
Software for Debugging
M. D. Jones, Ph.D. (CCR/UB)
M. D. Jones, Ph.D. (CCR/UB)
Software for Debugging
HPC-I Fall 2013
4 / 90
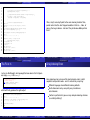
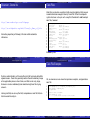
Debugging tools are abundant, but we will focus merely on some of the
most common attributes to give you a bag of tricks that can be used
when dealing with common problems.
M. D. Jones, Ph.D. (CCR/UB)
Debugging in Serial & Parallel
HPC-I Fall 2013
5 / 90
Introduction
Software for Debugging
Introduction
Software for Debugging
Basic Capabilities
Running Within
Common attributes:
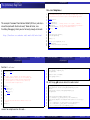
Inside a debugger (be it using a command-line interface (CLI) or
graphical front-end), you have some very handy abilities:
Look at source code listing (very handy when isolating an IEEE
exception)
Divided into command-line or graphical user interfaces
Usually have to recompile (“-g” is almost a standard option to
enable debugging) your code to utilize most debugger features
Line-by-line execution
Insert stops or “breakpoints” at certain functional points (i.e., when
critical values change)
Invocation by name of debugger and executable (e.g. gdb ./a.out
[core])
Ability to monitor variable values
Look at “stack trace” (or “backtrace”) when code crashes
M. D. Jones, Ph.D. (CCR/UB)
Debugging in Serial & Parallel
Introduction
HPC-I Fall 2013
6 / 90
M. D. Jones, Ph.D. (CCR/UB)
Software for Debugging
Debugging in Serial & Parallel
Introduction
HPC-I Fall 2013
7 / 90
HPC-I Fall 2013
9 / 90
Software for Debugging
Command-line debugging example
25
26
27
28
29
30
31
32
33
34
35
36
37
38
39
40
41
42
43
44
45
46
47
48
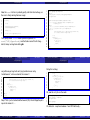
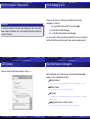
Consider the following code example:
1
2
3
4
5
6
7
8
9
10
11
12
13
14
15
16
17
18
19
20
21
22
23
24
#include <stdio.h>
#include <stdlib.h>
int indx;
void initArray(int nelem_in_array, int *array);
void printArray(int nelem_in_array, int *array);
int squareArray(int nelem_in_array, int *array);
int main(void) {
const int nelem = 10;
int *array1, *array2, *del;
/* Allocate memory for each array */
array1 = (int *)malloc(nelem*sizeof(int));
array2 = (int *)malloc(nelem*sizeof(int));
del = (int *)malloc(nelem*sizeof(int));
/* Initialize array1 */
initArray(nelem, array1);
/* Print the elements of array1 */
printf("array1 = ");
printArray(nelem, array1);
/* Copy array1 to array2 */
array2 = array1;
/* Pass array2 to the function 'squareArray( )' */
squareArray(nelem, array2);
/* Compute difference between elements of array2 and array1 */
for (indx = 0; indx < nelem; indx++) {
del[indx] = array2[indx] - array1[indx];
}
/* Print the computed differences */
printf("The difference in the elements of array2 and array1 are:
printArray(nelem, del);
");
free(array1);
free(array2);
free(del);
return 0;
}
for (indx = 0; indx < nelem; indx++) {
array1[indx] = indx + 2;
}
M. D. Jones, Ph.D. (CCR/UB)
Debugging in Serial & Parallel
HPC-I Fall 2013
8 / 90
M. D. Jones, Ph.D. (CCR/UB)
Debugging in Serial & Parallel
Introduction
49
50
51
52
53
54
55
56
57
58
59
60
61
62
63
64
65
66
67
68
69
Software for Debugging
Introduction
void initArray(const int nelem_in_array, int *array) {
for (indx = 0; indx < nelem_in_array; indx++) {
array[indx] = indx + 1;
}
}
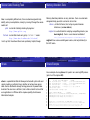
Ok, now let’s compile and run this code:
1
2
3
4
5
6
7
8
9
10
11
12
13
14
int squareArray(const int nelem_in_array, int *array) {
int indx;
for (indx = 0; indx < nelem_in_array; indx++){
array[indx] *= array[indx];
}
return *array;
}
void printArray(const int nelem_in_array, int *array){
printf("\n( ");
for (indx = 0; indx < nelem_in_array; indx++){
printf("%d ", array[indx]);
}
printf(")\n");
}
M. D. Jones, Ph.D. (CCR/UB)
Debugging in Serial & Parallel
Introduction
HPC-I Fall 2013
10 / 90
M. D. Jones, Ph.D. (CCR/UB)
Software for Debugging
23
24
25
26
27
28
29
30
31
32
33
34
35
36
37
38
39
40
41
42
43
HPC-I Fall 2013
11 / 90
HPC-I Fall 2013
13 / 90
Software for Debugging
(gdb) s
squareArray (nelem_in_array=10, array=0x601010) at array-ex.c:59
59
for (indx = 0; indx < nelem_in_array; indx++){
(gdb) p indx
$1 = 10
(gdb) s
60
array[indx] *= array[indx];
(gdb) p indx
$2 = 0
(gdb) display indx
1: indx = 0
(gdb) display array[indx]
2: array[indx] = 2
(gdb) s
59
for (indx = 0; indx < nelem_in_array; indx++){
2: array[indx] = 4
1: indx = 0
(gdb) s
60
array[indx] *= array[indx];
2: array[indx] = 3
1: indx = 1
Ok, that is instructive, but no closer to finding the bug.
Breakpoint 1, main () at array-ex.c:34
34
squareArray(nelem, array2);
Debugging in Serial & Parallel
Debugging in Serial & Parallel
Introduction
[rush:~/d_debug]$ gdb -quiet array-ex
Reading symbols from /ifs/user/jonesm/d_debug/array-ex...done.
(gdb) l 34
29
30
/* Copy array1 to array2 */
31
array2 = array1;
32
33
/* Pass array2 to the function 'squareArray( )' */
34
squareArray(nelem, array2);
35
36
/* Compute difference between elements of array2 and array1 */
37
for (indx = 0; indx < nelem; indx++) {
38
del[indx] = array2[indx] - array1[indx];
(gdb) b 34
Breakpoint 1 at 0x400660: file array-ex.c, line 34.
(gdb) run
Starting program: /ifs/user/jonesm/d_debug/array-ex
array1 =
( 2 3 4 5 6 7 8 9 10 11 )
M. D. Jones, Ph.D. (CCR/UB)
[rush:~/d_debug]$ gcc -g -o array-ex array-ex.c
[rush:~/d_debug]$ ./array-ex
array1 =
( 2 3 4 5 6 7 8 9 10 11 )
The difference in the elements of array2 and array1 are:
( 0 0 0 0 0 0 0 0 0 0 )
*** glibc detected *** ./array-ex: double free or corruption (fasttop): 0x0000000001cc7010 ***
======= Backtrace: =========
/lib64/libc.so.6[0x3e1be760e6]
./array-ex[0x400710]
/lib64/libc.so.6(__libc_start_main+0xfd)[0x3e1be1ecdd]
./array-ex[0x4004d9]
======= Memory map: ========
...
Not exactly what we expect, is it? Array2 should contain the squares of
the values in array1, and therefore the difference should be i 2 − i for
i = [2, 11].
Now let us run the code from within gdb. Our goal is to set a
breakpoint where the squared arrays elements are computed, then
step through the code:
1
2
3
4
5
6
7
8
9
10
11
12
13
14
15
16
17
18
19
20
21
22
Software for Debugging
HPC-I Fall 2013
12 / 90
M. D. Jones, Ph.D. (CCR/UB)
Debugging in Serial & Parallel
Introduction
Software for Debugging
Introduction
Software for Debugging
Digging Out the Bug
So, what have we learned so far about the command-line debugger:
What we have learned is enough - look more closely at the line where
the differences between array1 and array2 are computed:
Useful for peaking inside source code
(break) Breakpoints
(s) Stepping through execution
(p) Print values at selected points (can also use handy printf
syntax as in C)
(display) Displaying values for monitoring while stepping through
code
(bt) Backtrace, or ’Stack Trace’ - haven’t used this yet, but
certainly will
M. D. Jones, Ph.D. (CCR/UB)
Debugging in Serial & Parallel
Introduction
18
19
20
21
22
23
24
25
26
27
28
29
30
31
32
33
34
35
36
37
38
39
40
Breakpoint 1, main () at array-ex.c:37
37
for (indx = 0; indx < nelem;
(gdb) disp indx
1: indx = 10
(gdb) disp array1[indx]
2: array1[indx] = 49
(gdb) disp array2[indx]
3: array2[indx] = 49
(gdb) s
38
del[indx] = array2[indx] 3: array2[indx] = 4
2: array1[indx] = 4
1: indx = 0
(gdb) s
37
for (indx = 0; indx < nelem;
3: array2[indx] = 4
2: array1[indx] = 4
1: indx = 0
(gdb) s
38
del[indx] = array2[indx] 3: array2[indx] = 9
2: array1[indx] = 9
1: indx = 1
M. D. Jones, Ph.D. (CCR/UB)
HPC-I Fall 2013
14 / 90
1
2
3
4
5
6
7
8
9
10
11
12
13
14
15
16
17
(gdb) l 38
33
/* Pass array2 to the function 'squareArray( )' */
34
squareArray(nelem, array2);
35
36
/* Compute difference between elements of array2 and array1 */
37
for (indx = 0; indx < nelem; indx++) {
38
del[indx] = array2[indx] - array1[indx];
39
}
40
41
/* Print the computed differences */
42
printf("The difference in the elements of array2 and array1 are:
(gdb) b 37
Breakpoint 1 at 0x400611: file array-ex.c, line 37.
(gdb) run
Starting program: /san/user/jonesm/u2/d_debug/array-ex
array1 =
( 2 3 4 5 6 7 8 9 10 11 )
M. D. Jones, Ph.D. (CCR/UB)
Software for Debugging
Debugging in Serial & Parallel
Introduction
");
HPC-I Fall 2013
15 / 90
Software for Debugging
indx++) {
Now that isn’t right - array1 was not supposed to change. Let us go
back and look more closely at the call to squareArray ...
array1[indx];
indx++) {
array1[indx];
Debugging in Serial & Parallel
HPC-I Fall 2013
16 / 90
M. D. Jones, Ph.D. (CCR/UB)
Debugging in Serial & Parallel
HPC-I Fall 2013
17 / 90
Introduction
1
2
3
4
5
6
7
8
9
10
11
12
13
14
15
16
17
18
19
20
21
22
23
24
25
26
27
28
29
30
Software for Debugging
Introduction
(gdb) l
32
33
/* Pass array2 to the function 'squareArray( )' */
34
squareArray(nelem, array2);
35
36
/* Compute difference between elements of array2 and array1 */
37
for (indx = 0; indx < nelem; indx++) {
38
del[indx] = array2[indx] - array1[indx];
39
}
40
41
/* Print the computed differences */
(gdb) b 34
Breakpoint 2 at 0x400605: file array-ex.c, line 34.
(gdb) run
The program being debugged has been started already.
Start it from the beginning? (y or n) y
Software for Debugging
Yikes, array1 and array2 point to the same memory location! See,
pointer errors like this don’t happen too often in Fortran ... Now , of
course, the bug is obvious - but aren’t they all obvious after you find
them?
Starting program: /ifs/user/jonesm/d_debug/array-ex
array1 =
( 2 3 4 5 6 7 8 9 10 11 )
Breakpoint 2, main () at array-ex.c:34
34
squareArray(nelem, array2);
3: array2[indx] = 49
2: array1[indx] = 49
1: indx = 10
(gdb) disp array2
4: array2 = (int *) 0x501010
(gdb) disp array1
5: array1 = (int *) 0x501010
M. D. Jones, Ph.D. (CCR/UB)
Debugging in Serial & Parallel
Introduction
HPC-I Fall 2013
18 / 90
M. D. Jones, Ph.D. (CCR/UB)
Software for Debugging
Debugging in Serial & Parallel
HPC-I Fall 2013
19 / 90
Array Indexing Errors
The Fix Is In
Array Indexing Errors
Just as an afterthought, what we ought to have done in the first place
was copy array1 into array2:
Array indexing errors are one of the most common errors in both
sequential and parallel codes - and it is not entirely surprising:
/* Copy array1 to array2 */
/* array2 = array1; */
for (indx=0; indx<nelem; indx++) {
array2[indx]=array1[indx];
}
Different languages have different indexing defaults
Multi-dimensional arrays are pretty easy to reference
out-of-bounds
which will finally produce the right output:
1
2
3
4
5
6
7
8
9
(gdb) run
Starting program: /home/jonesm/d_debug/ex1
array1 =
( 2 3 4 5 6 7 8 9 10 11 )
The difference in the elements of array2 and array1 are:
( 2 6 12 20 30 42 56 72 90 110 )
Fortran in particular lets you use very complex indexing schemes
(essentially arbitrary!)
Program exited normally.
(gdb)
M. D. Jones, Ph.D. (CCR/UB)
Debugging in Serial & Parallel
HPC-I Fall 2013
20 / 90
M. D. Jones, Ph.D. (CCR/UB)
Debugging in Serial & Parallel
HPC-I Fall 2013
22 / 90
Array Indexing Errors
Array Indexing Errors
Example: Indexing Error
1
2
3
4
5
6
7
8
9
10
11
12
13
14
15
16
17
18
19
20
21
22
23
24
#include <stdio.h>
#define N 10
int main(int argc, char *argv[]) {
int arr[N];
int i,odd_sum,even_sum;
Now, try compiling with gcc and running the code:
1
2
3
for(i=1;i<(N-1);++i) {
if(i<=4) {
arr[i]=(i*i)%3;
} else {
arr[i]=(i*i)%5;
}
}
odd_sum=0;
even_sum=0;
for(i=0;i<(N-1);++i) {
if(i%2==0) {
even_sum += arr[i];
} else {
odd_sum += arr[i];
}
}
printf("odd_sum=%d, even_sum=%d\n",odd_sum,even_sum);
[rush:~/d_debug]$ gcc -O -g -o ex2 ex2.c
[rush:~/d_debug]$ ./ex2
odd_sum=5, even_sum=671173703
Ok, that hardly seems reasonable (does it?) Now, let’s run this
example from within gdb and set a breakpoint to examine the
accumulation of values to even_sum.
}
M. D. Jones, Ph.D. (CCR/UB)
Debugging in Serial & Parallel
HPC-I Fall 2013
23 / 90
M. D. Jones, Ph.D. (CCR/UB)
Array Indexing Errors
1
2
3
4
5
6
7
8
9
10
11
12
13
14
15
16
17
18
19
20
21
Debugging in Serial & Parallel
HPC-I Fall 2013
24 / 90
Array Indexing Errors
(gdb) l 16
11
arr[i]=(i*i)%5;
12
}
13
}
14
odd_sum=0;
15
even_sum=0;
16
for(i=0;i<(N-1);++i) {
17
if(i%2==0) {
18
even_sum += arr[i];
19
} else {
20
odd_sum += arr[i];
(gdb) b 16
Breakpoint 1 at 0x40051e: file ex2.c, line 16.
(gdb) run
Starting program: /ifs/user/jonesm/d_debug/ex2
So we see that our original example code missed initializing the first
element of the array, and the results were rather erratic (in fact they will
likely be compiler and flag dependent).
Initialization is just one aspect of things going wrong with array
indexing - let us examine another common problem ...
Breakpoint 1, main (argc=Variable "argc" is not available.
) at ex2.c:16
16
for(i=0;i<(N-1);++i) {
(gdb) p arr
$1 = {671173696, 1, 1, 0, 1, 0, 1, 4, 4, 0}
M. D. Jones, Ph.D. (CCR/UB)
Debugging in Serial & Parallel
HPC-I Fall 2013
25 / 90
M. D. Jones, Ph.D. (CCR/UB)
Debugging in Serial & Parallel
HPC-I Fall 2013
26 / 90
Array Indexing Errors
Array Indexing Errors
The (Infamous) Seg Fault
Main code: findprimes.c
This example I “borrowed” from Norman Matloff (UC Davis), who has a
nice article (well worth the time to read): “Guide to Faster, Less
Frustrating Debugging,” which you can find easily enough on the web:
http://heather.cs.ucdavis.edu/~matloff/unix.html
M. D. Jones, Ph.D. (CCR/UB)
Debugging in Serial & Parallel
HPC-I Fall 2013
1
2
3
4
5
6
7
8
9
10
11
12
13
14
15
16
17
18
19
20
21
22
23
27 / 90
/*
prime-number finding program - will (after bugs are fixed) report a list of
all primes which are less than or equal to the user-supplied upper bound
/
*
#include <stdio.h>
#define MaxPrimes 50
int Prime[MaxPrimes],
/* Prime[I] will be 1 if I is prime, 0 otherwise */
UpperBound;
/* we will check up through UpperBound for primeness */
void CheckPrime(int K); /* prototype for CheckPrime function */
int main()
{
int N;
printf("enter upper bound\n");
scanf("%d",UpperBound);
Prime[2] = 1;
for (N = 3; N <= UpperBound; N += 2)
CheckPrime(N);
if (Prime[N]) printf("%d is a prime\n",N);
}
M. D. Jones, Ph.D. (CCR/UB)
Array Indexing Errors
Function FindPrime:
24
25
26
27
28
29
30
31
32
33
34
35
36
37
38
39
40
41
42
43
44
45
46
47
Debugging in Serial & Parallel
HPC-I Fall 2013
28 / 90
Array Indexing Errors
1
2
3
4
5
6
7
void CheckPrime(int K) {
int J;
/* the plan: see if J divides K, for all values J which are
(a) themselves prime (no need to try J if it is nonprime), and
(b) less than or equal to sqrt(K) (if K has a divisor larger
than this square root, it must also have a smaller one,
so no need to check for larger ones) */
[rush:~/d_debug]$ gcc -g -o findprimes_orig findprimes_orig.c
[rush:~/d_debug]$ ./findprimes_orig
enter upper bound
20
Segmentation fault (core dumped)
[rush:~/d_debug]$ ulimit -c
0
Ok, let’s fire up gdb and see where this code crashed:
J = 2;
while (1) {
if (Prime[J] == 1)
if (K % J == 0) {
Prime[K] = 0;
return;
}
J++;
}
1
2
3
4
5
6
7
8
9
10
11
12
13
14
/* if we get here, then there were no divisors of K, so it is
prime */
Prime[K] = 1;
}
[rush:~/d_debug]$ gdb -quiet ./findprimes_orig
Reading symbols from /ifs/user/jonesm/d_debug/findprimes_orig...done.
(gdb) run
Starting program: /ifs/user/jonesm/d_debug/findprimes_orig
enter upper bound
20
Program received signal SIGSEGV, Segmentation fault.
0x0000003e1be56ed0 in _IO_vfscanf_internal () from /lib64/libc.so.6
Missing separate debuginfos, use: debuginfo-install glibc-2.12-1.107.el6.x86_64
(gdb) bt
#0 0x0000003e1be56ed0 in _IO_vfscanf_internal () from /lib64/libc.so.6
#1 0x0000003e1be646cd in __isoc99_scanf () from /lib64/libc.so.6
#2 0x00000000004005a0 in main () at findprimes_orig.c:16
so now if we compile and run this code ...
M. D. Jones, Ph.D. (CCR/UB)
Debugging in Serial & Parallel
HPC-I Fall 2013
29 / 90
M. D. Jones, Ph.D. (CCR/UB)
Debugging in Serial & Parallel
HPC-I Fall 2013
30 / 90
Array Indexing Errors
Array Indexing Errors
Now, the scanf intrinsic is probably pretty safe from internal bugs, so
the error is likely coming from our usage:
1
2
3
4
5
6
7
8
9
10
11
(gdb) list 16
11 int main()
12 {
13
int N;
14
15
printf("enter upper bound\n");
16
scanf("%d",UpperBound);
17
18
Prime[2] = 1;
19
20
for (N = 3; N <= UpperBound; N += 2)
Yeah, pretty dumb - scanf needs a pointer argument, i.e.
scanf("%d",&UpperBound), and that takes care of the first bug ...
but let’s keep running from within gdb
M. D. Jones, Ph.D. (CCR/UB)
Debugging in Serial & Parallel
HPC-I Fall 2013
1
2
3
4
5
6
7
8
9
10
11
12
13
14
15
16
17
18
19
20
21
22
23
24
25
[rush:~/d_debug]$ gcc -g -o findprimes findprimes.c
[rush:~/d_debug]$ gdb findprimes
(gdb) run
Starting program: /ifs/user/jonesm/d_debug/findprimes
enter upper bound
20
Program received signal SIGSEGV, Segmentation fault.
0x0000000000400586 in CheckPrime (K=3) at findprimes.c:37
37
if (Prime[J] == 1)
(gdb) bt
#0 0x0000000000400586 in CheckPrime (K=3) at findprimes.c:37
#1 0x0000000000400547 in main () at findprimes.c:21
(gdb) l 37
32
than this square root, it must also have a smaller one,
33
so no need to check for larger ones) */
34
35
J = 2;
36
while (1) {
37
if (Prime[J] == 1)
38
if (K % J == 0) {
39
Prime[K] = 0;
40
return;
41
}
(gdb)
M. D. Jones, Ph.D. (CCR/UB)
31 / 90
Array Indexing Errors
HPC-I Fall 2013
32 / 90
Fixing the last bug:
very often we get seg faults on trying to reference an array
“out-of-bounds,” so have a look at the value of J:
26
27
28
29
30
31
32
33
34
35
36
37
38
Debugging in Serial & Parallel
Array Indexing Errors
1
2
3
4
5
6
7
8
9
10
11
(gdb) l 37
32
than this square root, it must also have a smaller one,
33
so no need to check for larger ones) */
34
35
J = 2;
36
while (1) {
37
if (Prime[J] == 1)
38
if (K % J == 0) {
39
Prime[K] = 0;
40
return;
41
}
(gdb) p J
$1 = 376
(gdb) list 40
35
J = 2;
36
/* while (1) { */
37
for (J=2; J*J <= K; J++) {
38
if (Prime[J] == 1)
39
if (K % J == 0) {
40
Prime[K] = 0;
41
return;
42
}
43
/* J++; */
44
}
Ok, now let us try to run the code:
Oops! That is just a tad outside the bounds (50). Kind of forgot to put a
cap on the value of J ...
1
2
3
4
5
[rush:~/d_debug]$ gcc -g -o findprimes findprimes.c
[rush:~/d_debug]$ ./findprimes
enter upper bound
20
[rush:~/d_debug]$
Oh, fantastic - no primes between 1 and 20? Not hardly ...
M. D. Jones, Ph.D. (CCR/UB)
Debugging in Serial & Parallel
HPC-I Fall 2013
33 / 90
M. D. Jones, Ph.D. (CCR/UB)
Debugging in Serial & Parallel
HPC-I Fall 2013
34 / 90
Array Indexing Errors
Array Indexing Errors
Ok, so now we will set a couple of breakpoints - one at the call to
FindPrime and the second where a successful prime is to be output:
M. D. Jones, Ph.D. (CCR/UB)
Debugging in Serial & Parallel
HPC-I Fall 2013
35 / 90
1
2
3
4
5
6
7
8
9
10
11
12
13
14
15
16
17
18
19
20
21
22
23
24
25
26
27
28
29
(gdb) l
16
scanf("%d",&UpperBound);
17
18
Prime[2] = 1;
19
20
for (N = 3; N <= UpperBound; N += 2)
21
CheckPrime(N);
22
if (Prime[N]) printf("%d is a prime\n",N);
23
}
24
25
void CheckPrime(int K) {
(gdb) b 20
Breakpoint 1 at 0x40052d: file findprimes.c, line 20.
(gdb) b 22
Breakpoint 2 at 0x400550: file findprimes.c, line 22.
(gdb) run
Starting program: /ifs/user/jonesm/d_debug/findprimes
enter upper bound
20
Breakpoint 1, main () at findprimes.c:20
20
for (N = 3; N <= UpperBound; N += 2)
(gdb) c
Continuing.
Breakpoint 2, main () at findprimes.c:22
22
if (Prime[N]) printf("%d is a prime\n",N);
(gdb) p N
$1 = 21
(gdb)
M. D. Jones, Ph.D. (CCR/UB)
Array Indexing Errors
HPC-I Fall 2013
36 / 90
Game of Life
Debugging Life Itself
Another gotcha - misplaced (or no) braces. Fix that:
1
2
3
4
5
6
7
8
9
10
11
12
13
14
15
16
17
18
19
20
21
22
23
24
25
Debugging in Serial & Parallel
Debugging Life Itself
(gdb) l
16
scanf("%d",&UpperBound);
17
18
Prime[2] = 1;
19
20
for (N = 3; N <= UpperBound; N += 2) {
21
CheckPrime(N);
22
if (Prime[N]) printf("%d is a prime\n",N);
23
}
24
}
25
(gdb) run
Starting program: /ifs/user/jonesm/d_debug/findprimes
enter upper bound
20
3 is a prime
5 is a prime
7 is a prime
11 is a prime
13 is a prime
17 is a prime
19 is a prime
Well, ok, not exactly debugging life itself; rather the game of life.
Mathematician John Horton Conway’s game of life1 , to be exact. This
example will basically be similar to the prior examples, but now we will
work in Fortran, and debug some integer arithmetic errors.
And the context will be slightly more interesting.
Program exited with code 025.
(gdb)
Ah, the sweet taste of success ... (even better, give the program a
return code!)
M. D. Jones, Ph.D. (CCR/UB)
Debugging in Serial & Parallel
HPC-I Fall 2013
1
see, for example, Martin Gardner’s article in Scientific American, 223, pp.
120-123 (1970).
37 / 90
M. D. Jones, Ph.D. (CCR/UB)
Debugging in Serial & Parallel
HPC-I Fall 2013
39 / 90
Debugging Life Itself
Game of Life
Debugging Life Itself
Game of Life
Game of Life
Rules of Life
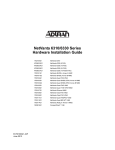
The rules in the game of life:
The Game of Life is one of the better known examples of cellular
automatons (CA), namely a discrete model with a finite number of
states, often used in theoretical biology, game theory, etc. The rules
are actually pretty simple, and can lead to some rather surprising
self-organizing behavior. The universe in the game of life:
Any live cell with fewer than two neighbours dies, as if by
loneliness
Any live cell with more than three neighbours dies, as if by
overcrowding
Universe is an infinite 2D grid of cells, each of which is alive or
dead
Any live cell with two or three neighbours lives, unchanged, to the
next generation
Cells interact only with nearest neighbors (including on the
diagonals, which makes for eight neighbors)
Any dead cell with exactly three neighbours comes to life
M. D. Jones, Ph.D. (CCR/UB)
Debugging in Serial & Parallel
Debugging Life Itself
HPC-I Fall 2013
An initial pattern is evolved by simultaneously applying the above rules
to the entire grid, and subsequently at each “tick” of the clock.
40 / 90
M. D. Jones, Ph.D. (CCR/UB)
Game of Life
Debugging in Serial & Parallel
Debugging Life Itself
HPC-I Fall 2013
41 / 90
HPC-I Fall 2013
43 / 90
Game of Life
Sample Code - Game of Life
1
2
3
4
5
6
7
8
9
10
11
12
13
14
15
16
17
18
19
20
21
22
23
24
25
26
27
28
29
30
31
32
33
34
35
36
37
38
39
program life
!
! Conway game of life (debugging example)
!
implicit none
integer, parameter :: ni=1000, nj=1000, nsteps = 100
integer :: i, j, n, im, ip, jm, jp, nsum, isum
integer, dimension(0:ni,0:nj) :: old, new
real :: arand, nim2, njm2
!
! initialize elements of "old" to 0 or 1
!
do j = 1, nj
do i = 1, ni
CALL random_number(arand)
old(i,j) = NINT(arand)
enddo
enddo
nim2 = ni - 2
njm2 = nj - 2
M. D. Jones, Ph.D. (CCR/UB)
Debugging in Serial & Parallel
HPC-I Fall 2013
42 / 90
!
! time iteration
!
time_iteration: do n = 1, nsteps
do j = 1, nj
do i = 1, ni
!
! periodic boundaries,
!
im = 1 + (i+nim2) - ((i+nim2)/ni)*ni ! if i=1, ni
ip = 1 + i - (i/ni)*ni
! if i=ni, 1
jm = 1 + (j+njm2) - ((j+njm2)/nj)*nj ! if j=1, nj
jp = 1 + j - (j/nj)*nj
! if j=nj, 1
!
! for each point, add surrounding values
!
nsum = old(im,jp) + old(i,jp) + old(ip,jp) &
+ old(im,j )
+ old(ip,j ) &
+ old(im,jm) + old(i,jm) + old(ip,jm)
M. D. Jones, Ph.D. (CCR/UB)
Debugging in Serial & Parallel
Debugging Life Itself
Game of Life
Debugging Life Itself
Game of Life
Initial Run ...
40
41
42
43
44
45
46
47
48
49
50
51
52
53
54
55
56
57
58
59
60
61
62
63
!
! set new value based on number of "live" neighbors
!
select case (nsum)
case (3)
new(i,j) = 1
case (2)
new(i,j) = old(i,j)
case default
new(i,j) = 0
end select
enddo
enddo
!
! copy new state into old state
!
old = new
print*, 'Tick ',n,' number of living: ',sum(new)
enddo time_iteration
!
! write number of live points
!
print*, 'number of live points = ', sum(new)
end program life
M. D. Jones, Ph.D. (CCR/UB)
Debugging in Serial & Parallel
Debugging Life Itself
1
2
3
4
5
6
7
8
9
10
11
12
13
14
15
16
17
18
19
20
21
22
23
24
25
26
27
28
1
2
3
4
5
6
7
8
9
10
11
12
13
HPC-I Fall 2013
44 / 90
of
of
of
of
of
of
living:
living:
living:
living:
living:
living:
342946
334381
291022
263356
290940
322733
of living:
of living:
0
0
0
M. D. Jones, Ph.D. (CCR/UB)
Debugging in Serial & Parallel
Debugging Life Itself
HPC-I Fall 2013
45 / 90
Game of Life
Ok, so therein lay the problem - nim2 and njm2 should be integers,
not real values ... fix that:
!
!
!
!
if
if
if
if
1
2
3
4
5
6
7
8
9
i=1, ni
i=ni, 1
j=1, nj
j=nj, 1
Breakpoint 1, life () at life.f90:25
25
do j = 1, nj
Current language: auto; currently fortran
(gdb) s
26
do i = 1, ni
(gdb) s
30
im = 1 + (i+nim2) - ((i+nim2)/ni)*ni ! if i=1, ni
(gdb) s
31
ip = 1 + i - (i/ni)*ni
! if i=ni, 1
(gdb) print im
$1 = 1
(gdb) print (i+nim2)/1000
$2 = 0.999
Debugging in Serial & Parallel
-o life life.f90
Hmm, everybody dies! What kind of life is that? ... well, not a correct
one, in this context, at least. Undoubtedly the problem lies within the
neighbor calculation, so let us take a closer look at the execution ...
Game of Life
(gdb) l 30
25
do j = 1, nj
26
do i = 1, ni
27
!
28
! periodic boundaries
29
!
30
im = 1 + (i+nim2) - ((i+nim2)/ni)*ni
31
ip = 1 + i - (i/ni)*ni
32
jm = 1 + (j+njm2) - ((j+njm2)/nj)*nj
33
jp = 1 + j - (j/nj)*nj
(gdb) b 25
Breakpoint 1 at 0x402e23: file life.f90, line 25.
(gdb) run
Starting program: /ifs/user/jonesm/d_debug/life
M. D. Jones, Ph.D. (CCR/UB)
[bono:~/d_debug]$ ifort -g
[bono:~/d_debug]$ ./life
Tick
1 number
Tick
2 number
Tick
3 number
Tick
4 number
Tick
5 number
Tick
6 number
:
:
Tick
99 number
Tick
100 number
number of live points =
program life
!
! Conway game of life (debugging example)
!
implicit none
integer, parameter :: ni=1000, nj=1000, nsteps = 100
integer :: i, j, n, im, ip, jm, jp, nsum, isum, nim2, njm2
integer, dimension(0:ni,0:nj) :: old, new
real :: arand
and things become a bit more reasonable:
1
2
3
4
5
6
7
8
9
HPC-I Fall 2013
46 / 90
[bono:~/d_debug]$ ifort -g
[bono:~/d_debug]$ ./life
Tick
1 number
Tick
2 number
:
:
Tick
99 number
Tick
100 number
number of live points =
M. D. Jones, Ph.D. (CCR/UB)
-o life life.f90
of living:
of living:
272990
253690
of living:
of living:
94664
95073
94664
Debugging in Serial & Parallel
HPC-I Fall 2013
47 / 90
Debugging Life Itself
Game of Life
Other Debugging Miscellany
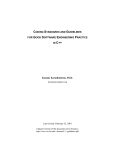
Diversion - Demo life
Core Files
Core Files
Core files can also be used to instantly analyze problems that caused
a code failure bad enough to “dump” a core file. Often the computer
system has been set up in such a way that the default is not to output
core files, however:
http://www.radicaleye.com/lifepage
http://en.wikipedia.org/wiki/Conway’s_Game_of_Life
Interesting repository of Conway’s life and cellular automata
references.
1
2
3
4
5
6
7
8
9
10
11
12
13
14
15
16
17
[rush:~/d_debug]$ ulimit -a
core file size
(blocks, -c)
data seg size
(kbytes, -d)
scheduling priority
(-e)
file size
(blocks, -f)
pending signals
(-i)
max locked memory
(kbytes, -l)
max memory size
(kbytes, -m)
open files
(-n)
pipe size
(512 bytes, -p)
POSIX message queues
(bytes, -q)
real-time priority
(-r)
stack size
(kbytes, -s)
cpu time
(seconds, -t)
max user processes
(-u)
virtual memory
(kbytes, -v)
file locks
(-x)
0
unlimited
0
unlimited
2066355
33554432
unlimited
1024
8
819200
0
unlimited
900
1024
unlimited
unlimited
for bash syntax.
M. D. Jones, Ph.D. (CCR/UB)
Debugging in Serial & Parallel
Other Debugging Miscellany
HPC-I Fall 2013
48 / 90
M. D. Jones, Ph.D. (CCR/UB)
Core Files
Debugging in Serial & Parallel
Other Debugging Miscellany
HPC-I Fall 2013
50 / 90
Core Files
Core File Example
Systems administrators set the core file size limit to zero by default for
a good reason - these files generally contain the entire memory image
of an application process when it dies, and that can be very large.
End-users are also notoriously bad about leaving these files laying
around ...
Having said that, we can up the limit, and produce a core file that can
later be used for analysis.
M. D. Jones, Ph.D. (CCR/UB)
Debugging in Serial & Parallel
HPC-I Fall 2013
51 / 90
Ok, so now we can use one of our previous examples, and generate a
core file:
1
2
3
4
5
6
7
8
[rush:~/d_debug]$ ulimit -c unlimited
[rush:~/d_debug]$ gcc -g -o findprimes_orig findprimes_orig.c
[rush:~/d_debug]$ ./findprimes_orig
enter upper bound
20
Segmentation fault (core dumped)
[rush:~/d_debug]$ ls -l core*
-rw- -- -- -- 1 jonesm ccrstaff 196608 Sep 16 13:22 core.38729
M. D. Jones, Ph.D. (CCR/UB)
Debugging in Serial & Parallel
HPC-I Fall 2013
52 / 90
Other Debugging Miscellany
Core Files
Other Debugging Miscellany
Summary on Core Files
this particular core file is not at all large (it is a very simple code,
though, with very little stored data - generally the core file size will
reflect the size of the application in terms of its memory use when it
crashed). Analyzing it is pretty much like we did when running this
example “live” in gdb:
1
2
3
4
5
6
7
8
9
10
11
12
13
14
15
16
17
18
19
20
21
22
23
[rush:~/d_debug]$ gdb -quiet findprimes_orig core.38729
Reading symbols from /ifs/user/jonesm/d_debug/findprimes_orig...done.
[New Thread 38729]
...
Core was generated by `./findprimes_orig'.
Program terminated with signal 11, Segmentation fault.
#0 0x0000003e1be56ed0 in _IO_vfscanf_internal () from /lib64/libc.so.6
Missing separate debuginfos, use: debuginfo-install glibc-2.12-1.107.el6.x86_64
(gdb) bt
#0 0x0000003e1be56ed0 in _IO_vfscanf_internal () from /lib64/libc.so.6
#1 0x0000003e1be646cd in __isoc99_scanf () from /lib64/libc.so.6
#2 0x00000000004005a0 in main () at findprimes_orig.c:16
(gdb) l 16
11 int main()
12 {
13
int N;
14
15
printf("enter upper bound\n");
16
scanf("%d",UpperBound);
17
18
Prime[2] = 1;
19
20
for (N = 3; N <= UpperBound; N += 2)
M. D. Jones, Ph.D. (CCR/UB)
Debugging in Serial & Parallel
Other Debugging Miscellany
HPC-I Fall 2013
So why would you want to use a core file rather than interactively
debug?
Your bug may take quite a while to manifest itself
You have to debug inside a batch queuing system where
interactive use is difficult or curtailed
You want to capture a “picture” of the code state when it crashes
53 / 90
M. D. Jones, Ph.D. (CCR/UB)
More Command-line Debuggers
HPC-I Fall 2013
54 / 90
Run-time Compiler Checks
Run-time Compiler Checks
Most compilers support run-time checks than can quickly catch
common bugs. Here is a handy short-list (contributions welcome!):
We focused on gdb, but there are command-line debuggers that
accompany just about every available compiler product:
pgdbg part of the PGI compiler suite, defaults to a GUI, but can
be run as a command line interface (CLI) using the -text
option
idb part of the Intel compiler suite, defaults to CLI (has a
special option -gdb for using gdb command syntax)
Debugging in Serial & Parallel
Debugging in Serial & Parallel
Other Debugging Miscellany
More Comannd-line Debugging Tools
M. D. Jones, Ph.D. (CCR/UB)
Core Files
HPC-I Fall 2013
For Intel fortran, “-check bounds -traceback -g” will automate
bounds checking, and enable extensive traceback analysis in case
of a crash (leave out the bounds option to get a crash report on
any IEEE exception, format mismatch, etc.)
For PGI compilers, -Mbounds -g will do bounds checking
For GNU compilers, -fbounds-check -g should also do bounds
checking, but is only currently supported for Fortran and Java
front-ends.
55 / 90
M. D. Jones, Ph.D. (CCR/UB)
Debugging in Serial & Parallel
HPC-I Fall 2013
56 / 90
Other Debugging Miscellany
Run-time Compiler Checks
Other Debugging Miscellany
Run-time Compiler Checks(cont’d)
Serial Debugging GUIs
Serial Debugging GUIs
There are, of course, a matching set of GUIs for the various
debuggers. A short list:
WARNING
It should be noted that run-time error checking can very much slow
down a code’s execution, so it is not something that you will want to
use all of the time.
ddd a graphical front-end for the venerable gdb
pgdbg GUI for the PGI debugger
idb -gui GUI for Intel compiler suite debugger
It is very much a matter of preference whether or not to use the GUI. I
find the GUI to be constraining, but it does make navigation easier.
M. D. Jones, Ph.D. (CCR/UB)
Debugging in Serial & Parallel
Other Debugging Miscellany
HPC-I Fall 2013
57 / 90
M. D. Jones, Ph.D. (CCR/UB)
Serial Debugging GUIs
Debugging in Serial & Parallel
Other Debugging Miscellany
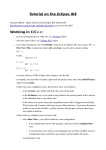
DDD Example
HPC-I Fall 2013
58 / 90
Serial Debugging GUIs
More Information on Debuggers
Running one of our previous examples using ddd ...
More information on the tools that we have used/mentioned (man
pages are also a good place to start):
gdb User Manual:
http://sources.redhat.com/gdb/current/onlinedocs/gdb_toc.html
ddd User Guide:
http://www.gnu.org/manual/ddd/pdf/ddd.pdf
idb Manual:
http://www.intel.com/software/products/compilers/docs/linux/idb_
manual_l.html
pgdbg Guide (locally on CCR systems):
file:///util/pgi/linux86-64/[version]/doc/index.htm
M. D. Jones, Ph.D. (CCR/UB)
Debugging in Serial & Parallel
HPC-I Fall 2013
59 / 90
M. D. Jones, Ph.D. (CCR/UB)
Debugging in Serial & Parallel
HPC-I Fall 2013
60 / 90
Other Debugging Miscellany
Source Code Checking Tools
Other Debugging Miscellany
Source Code Checking Tools
Source Code Checking Tools
Memory Allocation Tools
Now, in a completely different vein, there are tools designed to help
identify errors pre-compilation, namely by running it through the source
code itself.
Memory allocation problems are very common - there are some tools
designed to help you catch such errors at run-time:
efence , or Electric Fence, tries to trap any out-of-bounds
references (see man efence)
splint is a tool for statically checking C programs:
http://www.splint.org
valgrind is a suite of tools for anlayzing and profiling binaries (see
man valgrind) - there is a user manual available at:
ftncheck is a tool that checks only (alas) FORTRAN 77 codes:
http://www.dsm.fordham.edu/~ftnchek/
file:///usr/share/doc/valgrind-3.8.1/html/manual.html
valgrind I have seen used with good success, but not particularly in
the HPC arena.
I can’t say that I have found these to be particulary helpful, though.
M. D. Jones, Ph.D. (CCR/UB)
Debugging in Serial & Parallel
Other Debugging Miscellany
HPC-I Fall 2013
61 / 90
M. D. Jones, Ph.D. (CCR/UB)
Source Code Checking Tools
Debugging in Serial & Parallel
Other Debugging Miscellany
Strace
HPC-I Fall 2013
62 / 90
Source Code Checking Tools
Strace Example
As an example of using strace, let’s peek in on a running MPI process
(part of a 32 task job on U2):
strace is a powerful tool that will allow you to trace all system calls and
signals made by a particular binary, whether or not you have source
code. Can be attached to already running processes. A powerful lowlevel tool. You can learn a lot from it, but is often a tool of last resort for
user applications in HPC due to the copious quantity of extraneous
information it outputs.
M. D. Jones, Ph.D. (CCR/UB)
Debugging in Serial & Parallel
HPC-I Fall 2013
63 / 90
1
2
3
4
5
6
7
8
9
10
11
12
13
14
15
16
17
18
19
[c06n15:~]$ ps -u jonesm -Lf
UID
PID PPID
LWP C NLWP STIME TTY
TIME CMD
jonesm
23964 16284 23964 92
2 14:34 ?
00:04:11 /util/nwchem/nwchem-5.0/bin/
jonesm
23964 16284 23965 99
2 14:34 ?
00:04:30 /util/nwchem/nwchem-5.0/bin/
jonesm
23987 23986 23987 0
1 14:37 pts/0 00:00:00 -bash
jonesm
24128 23987 24128 0
1 14:39 pts/0 00:00:00 ps -u jonesm -Lf
[c06n15:~]$ strace -p 23965
Process 23965 attached - interrupt to quit
:
lseek(45, 691535872, SEEK_SET)
= 691535872
read(45, "\0\0\0\0\0\0\0\0\2\273\f[\250\207V\276\376K&]\331\230d"..., 524288)=524288
gettimeofday({1161107631, 126604}, {240, 1161107631}) = 0
gettimeofday({1161107631, 128553}, {240, 1161107631}) = 0
:
:
select(47, [3 4 6 7 8 9 42 43 44 46], [4], NULL, NULL) = 2 (in [4], out [4])
write(4, "\0\0\0\0\0\0\0\0\0\0\0\0\0\0\0\0\0\0\0\0\0\0\0\0\0\0\0"..., 2932) = 2932
writev(4, [{"\0\0\0\0\0\0\0\17\0\0\0\37\0\0\0\0\0\0\0,\0\0\0\0\0\0\0"..., 32},
{"\1\0\0\0\0\0\0\0\37\0\0\0\17\0\0\0\37\0\0\0,\0\1\0000u"..., 44}], 2) = 76
M. D. Jones, Ph.D. (CCR/UB)
Debugging in Serial & Parallel
HPC-I Fall 2013
64 / 90
Basic Parallel Debugging
Wither Goest the GUI?
Wither Goest the GUI?
Using a GUI-based debugger gets considerably more difficult when
dealing with debugging an MPI-based parallel code (not so much on
the OpenMP side), due to the fact that you are now dealing with
multiple processes scattered across different machines.
Part II
Advanced (Parallel) Debugging
M. D. Jones, Ph.D. (CCR/UB)
Debugging in Serial & Parallel
Basic Parallel Debugging
HPC-I Fall 2013
The TotalView debugger is the premier product in this arena (it has
both CLI and GUI support) - but it is very expensive, and not present
in all environments. We will start out using our same toolbox as before,
and see that we can accomplish much without spending a fortune. The
methodologies will be equally applicable to the fancy commercial
products.
65 / 90
Debugging in Serial & Parallel
Basic Parallel Debugging
Process Checking
HPC-I Fall 2013
67 / 90
Process Checking
Process Checking Example
First on the agenda - parallel processing involves multiple
processes/threads (or both), and the first rule is to make sure that they
are ending up where you think that they should be (needless to say, all
too often they do not).
Use MPI_Get_processor_name to report back on where
processes are running
Use ps to monitor processes as they run (useful flags: ps u -L),
even on remote nodes (rsh/ssh into them)
M. D. Jones, Ph.D. (CCR/UB)
M. D. Jones, Ph.D. (CCR/UB)
Process Checking
Debugging in Serial & Parallel
HPC-I Fall 2013
68 / 90
1
2
3
4
5
6
7
8
9
10
11
12
13
14
15
16
17
[rush:/projects/jonesm/d_nwchem/d_siosi6]$ squeue - -user jonesm
JOBID PARTITION
NAME
USER ST
TIME NODES NODELIST(REASON)
436728
debug
siosi6
jonesm R
0:23
2 d09n29s02,d16n02
[rush:/projects/jonesm/d_nwchem/d_siosi6]$ ssh d16n02
[d16n02:~]$ ps -u jonesm -o pid,ppid,lwp,nlwp,psr,pcpu,rss,time,comm
PID PPID
LWP NLWP PSR %CPU
RSS
TIME COMMAND
9665 9633 9665
5
0 98.4 1722040 00:01:12 nwchem-openib-i
9666 9633 9666
4
4 98.6 1365672 00:01:12 nwchem-openib-i
9667 9633 9667
4
1 98.2 1370000 00:01:12 nwchem-openib-i
9668 9633 9668
4
5 98.7 1358960 00:01:13 nwchem-openib-i
9669 9633 9669
4
2 98.7 1352112 00:01:13 nwchem-openib-i
9670 9633 9670
4
6 98.7 1360200 00:01:13 nwchem-openib-i
9671 9633 9671
4
3 98.7 1359828 00:01:13 nwchem-openib-i
9672 9633 9672
4
7 98.7 1361228 00:01:13 nwchem-openib-i
9751 9749 9751
1
7 0.0 2136 00:00:00 sshd
9752 9751 9752
1
0 0.0 2040 00:00:00 bash
9828 9752 9828
1
5 0.0 1204 00:00:00 ps
M. D. Jones, Ph.D. (CCR/UB)
Debugging in Serial & Parallel
HPC-I Fall 2013
69 / 90
Basic Parallel Debugging
Process Checking
Basic Parallel Debugging
Process Checking
or you can script it (I called this script job_ps):
1
2
3
4
5
6
7
8
9
10
11
12
13
14
15
16
17
18
19
20
21
22
23
24
25
#!/bin/sh
#
# Shell script to take a single argument (Slurm job id) and launch a
# ps command on each node in the job
#
QST=`which squeue`
if [ -z $QST ]; then
echo "ERROR: no squeue in PATH: PATH="$PATH
exit
fi
#
case $# in
0) echo "single SLURM_JOBID required."; exit ;; # no args, exit
1) jobid=$1 ;;
*) echo "single SLURM_JOBID required."; exit ;; # too many args, exit
esac
#
# get node listing
#
nodelist=`$QST - -job $jobid - -format="%i %N" | tail -1 | awk '{print $2}'`
echo "nodelist = $nodelist"
if [[ "$nodelist" == "" ]]; then
echo "Job is not running yet, retry later."
exit
fi
M. D. Jones, Ph.D. (CCR/UB)
Debugging in Serial & Parallel
Basic Parallel Debugging
1
2
3
4
5
6
7
8
9
10
11
12
13
14
15
16
17
18
19
20
21
22
23
24
25
26
27
28
29
30
31
HPC-I Fall 2013
26
27
28
29
30
31
32
33
34
35
36
37
38
70 / 90
for node in $nodelist ; do
echo "NODE = $node, my CPU/thread Usage:"
ssh $node $MYPS
done
M. D. Jones, Ph.D. (CCR/UB)
Process Checking
Debugging in Serial & Parallel
Debugging in Serial & Parallel
Basic Parallel Debugging
[rush:/projects/jonesm/d_nwchem/d_siosi6]$ job_ps 436728
nodelist = d09n29s02,d16n02
expanded nodelist = d16n02 d09n29s02
MYPS = ps -u jonesm -o pid,ppid,lwp,nlwp,psr,pcpu,rss,time,comm
NODE = d16n02, my CPU/thread Usage:
PID PPID
LWP NLWP PSR %CPU
RSS
TIME COMMAND
9665 9633 9665
5
0 98.2 1748340 00:03:32 nwchem-openib-i
9666 9633 9666
4
4 98.7 1479024 00:03:33 nwchem-openib-i
9667 9633 9667
4
1 98.6 1479352 00:03:33 nwchem-openib-i
9668 9633 9668
4
5 98.6 1466844 00:03:33 nwchem-openib-i
9669 9633 9669
4
2 98.9 1461372 00:03:33 nwchem-openib-i
9670 9633 9670
4
6 99.1 1474016 00:03:34 nwchem-openib-i
9671 9633 9671
4
3 98.8 1470640 00:03:33 nwchem-openib-i
9672 9633 9672
4
7 98.6 1474296 00:03:33 nwchem-openib-i
9921 9919 9921
1
4 0.0 2132 00:00:00 sshd
9922 9921 9922
1
5 2.0 1204 00:00:00 ps
NODE = d09n29s02, my CPU/thread Usage:
PID PPID
LWP NLWP PSR %CPU
RSS
TIME COMMAND
27963 27959 27963
1
4 0.0 1396 00:00:00 slurm_script
28145 27963 28145
5
3 0.0 7024 00:00:00 srun
28149 28145 28149
1
5 0.0
800 00:00:00 srun
28182 28167 28182
5
0 97.5 1750904 00:03:32 nwchem-openib-i
28183 28167 28183
4
4 98.0 1477128 00:03:33 nwchem-openib-i
28184 28167 28184
4
1 98.5 1472524 00:03:34 nwchem-openib-i
28185 28167 28185
4
5 98.3 1456200 00:03:34 nwchem-openib-i
28186 28167 28186
4
2 98.4 1488400 00:03:34 nwchem-openib-i
28187 28167 28187
4
6 98.1 1459120 00:03:33 nwchem-openib-i
28188 28167 28188
4
3 98.6 1470960 00:03:35 nwchem-openib-i
28189 28167 28189
4
7 98.4 1465752 00:03:34 nwchem-openib-i
28372 28370 28372
1
3 0.0 2148 00:00:00 sshd
28373 28372 28373
1
4 1.0 1204 00:00:00 ps
M. D. Jones, Ph.D. (CCR/UB)
nodelist=`nodeset -e $nodelist`
echo "expanded nodelist = $nodelist"
#
# define ps command
#MYPS="ps -aeLf | awk '{if (\$5 > 10) print \$1, \$2, \$3, \$4, \$5, \$9, \$10}'"
MYPS="ps -u jonesm -L -o pid,ppid,lwp,nlwp,psr,pcpu,rss,time,comm"
#MYPS="ps -u jonesm -Lf"
echo "MYPS = $MYPS"
1
2
3
4
5
6
7
8
9
10
11
12
13
14
15
16
17
18
19
20
21
22
23
24
25
26
27
28
29
30
31
32
33
34
35
36
37
38
39
40
41
42
HPC-I Fall 2013
72 / 90
[rush:/projects/jonesm/d_nwchem/d_siosi6]$ job_ps
nodelist = d09n29s02,d16n02
expanded nodelist = d16n02 d09n29s02
MYPS = ps -u jonesm -Lf
NODE = d16n02, my CPU/thread Usage:
UID
PID PPID
LWP C NLWP STIME TTY
jonesm
11416 11382 11416 98
5 17:01 ?
jonesm
11416 11382 11441 0
5 17:01 ?
jonesm
11416 11382 11442 0
5 17:01 ?
jonesm
11416 11382 11454 0
5 17:01 ?
jonesm
11416 11382 11465 0
5 17:01 ?
jonesm
11417 11382 11417 99
4 17:01 ?
jonesm
11417 11382 11445 0
4 17:01 ?
jonesm
11417 11382 11446 0
4 17:01 ?
jonesm
11417 11382 11460 0
4 17:01 ?
jonesm
11418 11382 11418 99
4 17:01 ?
jonesm
11418 11382 11439 0
4 17:01 ?
jonesm
11418 11382 11440 0
4 17:01 ?
jonesm
11418 11382 11455 0
4 17:01 ?
jonesm
11419 11382 11419 99
4 17:01 ?
jonesm
11419 11382 11449 0
4 17:01 ?
jonesm
11419 11382 11450 0
4 17:01 ?
jonesm
11419 11382 11458 0
4 17:01 ?
jonesm
11420 11382 11420 98
4 17:01 ?
jonesm
11420 11382 11451 0
4 17:01 ?
jonesm
11420 11382 11452 0
4 17:01 ?
jonesm
11420 11382 11457 0
4 17:01 ?
jonesm
11421 11382 11421 99
4 17:01 ?
jonesm
11421 11382 11447 0
4 17:01 ?
jonesm
11421 11382 11448 0
4 17:01 ?
jonesm
11421 11382 11459 0
4 17:01 ?
jonesm
11422 11382 11422 99
4 17:01 ?
jonesm
11422 11382 11437 0
4 17:01 ?
jonesm
11422 11382 11438 0
4 17:01 ?
jonesm
11422 11382 11453 0
4 17:01 ?
jonesm
11423 11382 11423 99
4 17:01 ?
jonesm
11423 11382 11443 0
4 17:01 ?
jonesm
11423 11382 11444 0
4 17:01 ?
jonesm
11423 11382 11456 0
4 17:01 ?
jonesm
11489 11487 11489 0
1 17:02 ?
jonesm
11490 11489 11490 2
1 17:02 ?
%
M. D. Jones, Ph.D. (CCR/UB)
HPC-I Fall 2013
71 / 90
Process Checking
436749
TIME
00:00:59
00:00:00
00:00:00
00:00:00
00:00:00
00:00:59
00:00:00
00:00:00
00:00:00
00:00:59
00:00:00
00:00:00
00:00:00
00:00:59
00:00:00
00:00:00
00:00:00
00:00:59
00:00:00
00:00:00
00:00:00
00:00:59
00:00:00
00:00:00
00:00:00
00:00:59
00:00:00
00:00:00
00:00:00
00:00:59
00:00:00
00:00:00
00:00:00
00:00:00
00:00:00
CMD
/util/nwchem/nwchem-6.1.1/bin/nwchem-openib-impi
/util/nwchem/nwchem-6.1.1/bin/nwchem-openib-impi
/util/nwchem/nwchem-6.1.1/bin/nwchem-openib-impi
/util/nwchem/nwchem-6.1.1/bin/nwchem-openib-impi
/util/nwchem/nwchem-6.1.1/bin/nwchem-openib-impi
/util/nwchem/nwchem-6.1.1/bin/nwchem-openib-impi
/util/nwchem/nwchem-6.1.1/bin/nwchem-openib-impi
/util/nwchem/nwchem-6.1.1/bin/nwchem-openib-impi
/util/nwchem/nwchem-6.1.1/bin/nwchem-openib-impi
/util/nwchem/nwchem-6.1.1/bin/nwchem-openib-impi
/util/nwchem/nwchem-6.1.1/bin/nwchem-openib-impi
/util/nwchem/nwchem-6.1.1/bin/nwchem-openib-impi
/util/nwchem/nwchem-6.1.1/bin/nwchem-openib-impi
/util/nwchem/nwchem-6.1.1/bin/nwchem-openib-impi
/util/nwchem/nwchem-6.1.1/bin/nwchem-openib-impi
/util/nwchem/nwchem-6.1.1/bin/nwchem-openib-impi
/util/nwchem/nwchem-6.1.1/bin/nwchem-openib-impi
/util/nwchem/nwchem-6.1.1/bin/nwchem-openib-impi
/util/nwchem/nwchem-6.1.1/bin/nwchem-openib-impi
/util/nwchem/nwchem-6.1.1/bin/nwchem-openib-impi
/util/nwchem/nwchem-6.1.1/bin/nwchem-openib-impi
/util/nwchem/nwchem-6.1.1/bin/nwchem-openib-impi
/util/nwchem/nwchem-6.1.1/bin/nwchem-openib-impi
/util/nwchem/nwchem-6.1.1/bin/nwchem-openib-impi
/util/nwchem/nwchem-6.1.1/bin/nwchem-openib-impi
/util/nwchem/nwchem-6.1.1/bin/nwchem-openib-impi
/util/nwchem/nwchem-6.1.1/bin/nwchem-openib-impi
/util/nwchem/nwchem-6.1.1/bin/nwchem-openib-impi
/util/nwchem/nwchem-6.1.1/bin/nwchem-openib-impi
/util/nwchem/nwchem-6.1.1/bin/nwchem-openib-impi
/util/nwchem/nwchem-6.1.1/bin/nwchem-openib-impi
/util/nwchem/nwchem-6.1.1/bin/nwchem-openib-impi
/util/nwchem/nwchem-6.1.1/bin/nwchem-openib-impi
sshd: jonesm@notty
ps -u jonesm -Lf
Debugging in Serial & Parallel
siosi6-incore.nw
siosi6-incore.nw
siosi6-incore.nw
siosi6-incore.nw
siosi6-incore.nw
siosi6-incore.nw
siosi6-incore.nw
siosi6-incore.nw
siosi6-incore.nw
siosi6-incore.nw
siosi6-incore.nw
siosi6-incore.nw
siosi6-incore.nw
siosi6-incore.nw
siosi6-incore.nw
siosi6-incore.nw
siosi6-incore.nw
siosi6-incore.nw
siosi6-incore.nw
siosi6-incore.nw
siosi6-incore.nw
siosi6-incore.nw
siosi6-incore.nw
siosi6-incore.nw
siosi6-incore.nw
siosi6-incore.nw
siosi6-incore.nw
siosi6-incore.nw
siosi6-incore.nw
siosi6-incore.nw
siosi6-incore.nw
siosi6-incore.nw
siosi6-incore.nw
HPC-I Fall 2013
73 / 90
Basic Parallel Debugging
Process Checking
GDB in Parallel
Using Serial Debuggers in Parallel?
Using Serial Debuggers in Parallel?
43
44
45
46
47
48
49
50
51
52
53
54
55
56
57
58
59
60
61
62
63
64
65
66
67
68
69
70
71
72
73
74
75
76
77
78
79
80
81
82
83
84
85
86
NODE = d09n29s02, my
UID
PID PPID
jonesm
29706 29702
jonesm
29883 29706
jonesm
29883 29706
jonesm
29883 29706
jonesm
29883 29706
jonesm
29883 29706
jonesm
29888 29883
jonesm
29921 29905
jonesm
29921 29905
jonesm
29921 29905
jonesm
29921 29905
jonesm
29921 29905
jonesm
29922 29905
jonesm
29922 29905
jonesm
29922 29905
jonesm
29922 29905
jonesm
29923 29905
jonesm
29923 29905
jonesm
29923 29905
jonesm
29923 29905
jonesm
29924 29905
jonesm
29924 29905
jonesm
29924 29905
jonesm
29924 29905
jonesm
29925 29905
jonesm
29925 29905
jonesm
29925 29905
jonesm
29925 29905
jonesm
29926 29905
jonesm
29926 29905
jonesm
29926 29905
jonesm
29926 29905
jonesm
29927 29905
jonesm
29927 29905
jonesm
29927 29905
jonesm
29927 29905
jonesm
29928 29905
jonesm
29928 29905
jonesm
29928 29905
jonesm
29928 29905
jonesm
30009 30007
jonesm
30010 30009
CPU/thread Usage:
LWP C NLWP STIME
29706 0
1 17:01
29883 0
5 17:01
29889 0
5 17:01
29891 0
5 17:01
29892 0
5 17:01
29895 0
5 17:01
29888 0
1 17:01
29921 96
5 17:01
29958 0
5 17:01
29959 0
5 17:01
29967 0
5 17:01
29984 0
5 17:01
29922 97
4 17:01
29960 0
4 17:01
29961 0
4 17:01
29972 0
4 17:01
29923 97
4 17:01
29954 0
4 17:01
29955 0
4 17:01
29966 0
4 17:01
29924 97
4 17:01
29956 0
4 17:01
29957 0
4 17:01
29968 0
4 17:01
29925 97
4 17:01
29964 0
4 17:01
29965 0
4 17:01
29973 0
4 17:01
29926 97
4 17:01
29950 0
4 17:01
29951 0
4 17:01
29953 0
4 17:01
29927 97
4 17:01
29962 0
4 17:01
29963 0
4 17:01
29971 0
4 17:01
29928 97
4 17:01
29969 0
4 17:01
29970 0
4 17:01
29974 0
4 17:01
30009 0
1 17:02
30010 2
1 17:02
M. D. Jones, Ph.D. (CCR/UB)
TTY
?
?
?
?
?
?
?
?
?
?
?
?
?
?
?
?
?
?
?
?
?
?
?
?
?
?
?
?
?
?
?
?
?
?
?
?
?
?
?
?
?
?
TIME
00:00:00
00:00:00
00:00:00
00:00:00
00:00:00
00:00:00
00:00:00
00:00:59
00:00:00
00:00:00
00:00:00
00:00:00
00:01:00
00:00:00
00:00:00
00:00:00
00:01:00
00:00:00
00:00:00
00:00:00
00:01:00
00:00:00
00:00:00
00:00:00
00:01:00
00:00:00
00:00:00
00:00:00
00:01:00
00:00:00
00:00:00
00:00:00
00:01:00
00:00:00
00:00:00
00:00:00
00:01:00
00:00:00
00:00:00
00:00:00
00:00:00
00:00:00
CMD
/bin/bash /var/spool/slurmd/job436749/slurm_script
srun - -mpi=pmi2 -n 16 -K /util/nwchem/nwchem-6.1.1/bin/nwchem-openib-impi
srun - -mpi=pmi2 -n 16 -K /util/nwchem/nwchem-6.1.1/bin/nwchem-openib-impi
srun - -mpi=pmi2 -n 16 -K /util/nwchem/nwchem-6.1.1/bin/nwchem-openib-impi
srun - -mpi=pmi2 -n 16 -K /util/nwchem/nwchem-6.1.1/bin/nwchem-openib-impi
srun - -mpi=pmi2 -n 16 -K /util/nwchem/nwchem-6.1.1/bin/nwchem-openib-impi
srun - -mpi=pmi2 -n 16 -K /util/nwchem/nwchem-6.1.1/bin/nwchem-openib-impi
/util/nwchem/nwchem-6.1.1/bin/nwchem-openib-impi siosi6-incore.nw
/util/nwchem/nwchem-6.1.1/bin/nwchem-openib-impi siosi6-incore.nw
/util/nwchem/nwchem-6.1.1/bin/nwchem-openib-impi siosi6-incore.nw
/util/nwchem/nwchem-6.1.1/bin/nwchem-openib-impi siosi6-incore.nw
/util/nwchem/nwchem-6.1.1/bin/nwchem-openib-impi siosi6-incore.nw
/util/nwchem/nwchem-6.1.1/bin/nwchem-openib-impi siosi6-incore.nw
/util/nwchem/nwchem-6.1.1/bin/nwchem-openib-impi siosi6-incore.nw
/util/nwchem/nwchem-6.1.1/bin/nwchem-openib-impi siosi6-incore.nw
/util/nwchem/nwchem-6.1.1/bin/nwchem-openib-impi siosi6-incore.nw
/util/nwchem/nwchem-6.1.1/bin/nwchem-openib-impi siosi6-incore.nw
/util/nwchem/nwchem-6.1.1/bin/nwchem-openib-impi siosi6-incore.nw
/util/nwchem/nwchem-6.1.1/bin/nwchem-openib-impi siosi6-incore.nw
/util/nwchem/nwchem-6.1.1/bin/nwchem-openib-impi siosi6-incore.nw
/util/nwchem/nwchem-6.1.1/bin/nwchem-openib-impi siosi6-incore.nw
/util/nwchem/nwchem-6.1.1/bin/nwchem-openib-impi siosi6-incore.nw
/util/nwchem/nwchem-6.1.1/bin/nwchem-openib-impi siosi6-incore.nw
/util/nwchem/nwchem-6.1.1/bin/nwchem-openib-impi siosi6-incore.nw
/util/nwchem/nwchem-6.1.1/bin/nwchem-openib-impi siosi6-incore.nw
/util/nwchem/nwchem-6.1.1/bin/nwchem-openib-impi siosi6-incore.nw
/util/nwchem/nwchem-6.1.1/bin/nwchem-openib-impi siosi6-incore.nw
/util/nwchem/nwchem-6.1.1/bin/nwchem-openib-impi siosi6-incore.nw
/util/nwchem/nwchem-6.1.1/bin/nwchem-openib-impi siosi6-incore.nw
/util/nwchem/nwchem-6.1.1/bin/nwchem-openib-impi siosi6-incore.nw
/util/nwchem/nwchem-6.1.1/bin/nwchem-openib-impi siosi6-incore.nw
/util/nwchem/nwchem-6.1.1/bin/nwchem-openib-impi siosi6-incore.nw
/util/nwchem/nwchem-6.1.1/bin/nwchem-openib-impi siosi6-incore.nw
/util/nwchem/nwchem-6.1.1/bin/nwchem-openib-impi siosi6-incore.nw
/util/nwchem/nwchem-6.1.1/bin/nwchem-openib-impi siosi6-incore.nw
/util/nwchem/nwchem-6.1.1/bin/nwchem-openib-impi siosi6-incore.nw
/util/nwchem/nwchem-6.1.1/bin/nwchem-openib-impi siosi6-incore.nw
/util/nwchem/nwchem-6.1.1/bin/nwchem-openib-impi siosi6-incore.nw
/util/nwchem/nwchem-6.1.1/bin/nwchem-openib-impi siosi6-incore.nw
/util/nwchem/nwchem-6.1.1/bin/nwchem-openib-impi siosi6-incore.nw
sshd: jonesm@notty
ps -u jonesm -Lf
Debugging in Serial & Parallel
GDB in Parallel
HPC-I Fall 2013
74 / 90
Yes, you can certainly run debuggers designed for use in sequential
codes in parallel. They are even quite effective. You may just have to
jump through a few extra hoops to do so ...
M. D. Jones, Ph.D. (CCR/UB)
Attaching GDB
Debugging in Serial & Parallel
GDB in Parallel
HPC-I Fall 2013
76 / 90
Attaching GDB
Attaching GDB to Running Processes
The simplest way to use a CLI-based debugger in parallel is to “attach”
it to already running processes, namely:
Find the parallel processes using the ps command (may have to
ssh into remote nodes if that is where they are running)
Invoke gdb on each process ID:
1
2
3
4
5
6
7
8
9
10
11
12
13
14
15
16
[rush:~]$ ps -u jonesm
PID TTY
TIME CMD
1772 ?
00:00:00 sshd
1773 pts/30
00:00:00 bash
25814 ?
00:00:01 sshd
25815 pts/167 00:00:00 bash
34507 pts/169 00:00:00 mpirun
34512 pts/169 00:00:00 mpiexec.hydra
34513 pts/169 00:00:00 pmi_proxy
34517 pts/169 00:00:04 pp.gdb
34518 pts/169 00:00:04 pp.gdb
[rush:~/d_hw/d_pp]$ gdb -quiet pp.gdb -p 34517
Reading symbols from /ifs/user/jonesm/d_hw/d_pp/pp.gdb...done.
Attaching to program: /ifs/user/jonesm/d_hw/d_pp/pp.gdb, process 34517
...
(gdb)
M. D. Jones, Ph.D. (CCR/UB)
Debugging in Serial & Parallel
HPC-I Fall 2013
77 / 90
Of course, unless you put an explicit waiting point inside your code, the
processes are probably happily running along when you attach to
them, and you will likely want to exert some control over that.
M. D. Jones, Ph.D. (CCR/UB)
Debugging in Serial & Parallel
HPC-I Fall 2013
78 / 90
GDB in Parallel
Attaching GDB
GDB in Parallel
First, using our above example, I was running two mpi tasks on the
CCR cluster front end. After attaching gdb to each process, they
paused, and we can easily release them using continue
1
2
3
4
5
6
and on the second process:
1
2
3
4
5
6
[rush:~/d_hw/d_pp]$ gdb -quiet pp.gdb -p 34517
Reading symbols from /ifs/user/jonesm/d_hw/d_pp/pp.gdb...done.
Attaching to program: /ifs/user/jonesm/d_hw/d_pp/pp.gdb, process 34517
...
(gdb) c
Continuing.
M. D. Jones, Ph.D. (CCR/UB)
Debugging in Serial & Parallel
GDB in Parallel
Attaching GDB
[rush:~/d_hw/d_pp]$ gdb -quiet pp.gdb -p 34518
Reading symbols from /ifs/user/jonesm/d_hw/d_pp/pp.gdb...done.
Attaching to program: /ifs/user/jonesm/d_hw/d_pp/pp.gdb, process 34518
...
(gdb) c
Continuing.
and we used the (c) continue command to let the execution pick up
again where we (temporarily) interrupted it.
HPC-I Fall 2013
79 / 90
M. D. Jones, Ph.D. (CCR/UB)
Attaching GDB
Debugging in Serial & Parallel
GDB in Parallel
HPC-I Fall 2013
80 / 90
Attaching GDB
Using a “Waiting Point”
and then you will find the waiting at that point when you attach gdb,
and you can release it at your leisure (after setting breakpoints, etc.):
You can insert a “waiting point” into your code to ensure that execution
waits until you get a chance to attach a debugger:
integer :: gdbWait=0
...
...
CALL MPI_COMM_RANK(MPI_COMM_WORLD,myid,ierr)
CALL MPI_COMM_SIZE(MPI_COMM_WORLD,Nprocs,ierr)
! dummy pause point for gdb instertion
do while (gdbWait /=1)
end do
M. D. Jones, Ph.D. (CCR/UB)
Debugging in Serial & Parallel
HPC-I Fall 2013
81 / 90
1
2
3
4
5
6
7
8
9
[rush:~/d_hw/d_pp]$ gdb -quiet pp.gdbwait -p 80444
Reading symbols from /ifs/user/jonesm/d_hw/d_pp/pp.gdbwait...done.
Attaching to program: /ifs/user/jonesm/d_hw/d_pp/pp.gdbwait, process 80444
...
0x0000000000400df2 in pp () at pp.f90:42
42
do while (gdbWait /=1)
(gdb) set gdbWait=1
(gdb) c
Continuing.
1
2
3
4
5
6
7
8
9
[rush:~/d_hw/d_pp]$ gdb -quiet pp.gdbwait -p 80445
Reading symbols from /ifs/user/jonesm/d_hw/d_pp/pp.gdbwait...done.
Attaching to program: /ifs/user/jonesm/d_hw/d_pp/pp.gdbwait, process 80445
...
pp () at pp.f90:42
42
do while (gdbWait /=1)
(gdb) set gdbWait=1
(gdb) c
Continuing.
M. D. Jones, Ph.D. (CCR/UB)
Debugging in Serial & Parallel
HPC-I Fall 2013
82 / 90
GDB in Parallel
Using GDB Within MPI Task Launcher
GDB in Parallel
Using GDB Within MPI Task Launcher
More Using GDB With MPI Task Launcher
Last, but not least, you can usually launch gdb through your MPI task
launcher. For example, using the Intel MPI task launcher,
mpirun/mpiexec (note that this generally pauses at MPI_Init):
1
2
3
4
5
6
7
8
9
10
11
12
13
14
15
16
17
18
19
20
[rush:~/d_hw/d_pp]$ mpirun -np 2 -gdb ./pp.gdb
mpigdb: np = 2
mpigdb: attaching to 22615 ./pp.gdb f07n05
mpigdb: attaching to 22616 ./pp.gdb f07n05
[0,1] (mpigdb) list 40
[0,1] 35
if (ierr /= 0) then
[0,1] 36
print*, 'Unable to intialize MPI.'
[0,1] 37
STOP
[0,1] 38
end if
[0,1] 39
CALL MPI_COMM_RANK(MPI_COMM_WORLD,myid,ierr)
[0,1] 40
CALL MPI_COMM_SIZE(MPI_COMM_WORLD,Nprocs,ierr)
[0,1] 41
! dummy pause point for gdb insertion
[0,1] 42
!do while (gdbWait /=1)
[0,1] 43
!end do
[0,1] 44
if (Nprocs /= 2) then
[0,1] (mpigdb) c
[0,1] Continuing.
Hello from proc 0 of 2
f07n05
Number Averaged for Sigmas:
2
Hello from proc 1 of 2
f07n05
M. D. Jones, Ph.D. (CCR/UB)
Debugging in Serial & Parallel
GDB in Parallel
Using GDB Within MPI Task Launcher
HPC-I Fall 2013
83 / 90
Using GDB Within MPI Task Launcher
1
2
3
4
5
6
7
8
9
10
11
12
13
14
15
16
17
18
19
20
21
22
23
24
25
26
27
[0,1] (mpigdb) list 84
[0,1] 79
do i=my_low,my_high,2
[0,1] 80
partial_sum_p = partial_sum_p + 1.0_dp/(2.0_dp*i-1.0_dp)
[0,1] 81
partial_sum_m = partial_sum_m - 1.0_dp/(2.0_dp*i+1.0_dp)
[0,1] 82
end do
[0,1] 83
partial_sum = partial_sum_p + partial_sum_m
[0,1] 84
CALL MPI_REDUCE(partial_sum,sum,1,MPI_DOUBLE_PRECISION,MPI_SUM,0, &
[0,1] 85
MPI_COMM_WORLD,ierr)
[0,1] 86
t1 = MPI_Wtime()
[0,1] 87
time_delta = time_delta + (t1-t0)
[0,1] 88
end do
[0,1] (mpigdb) b 83
[0,1] Breakpoint 1 at 0x401161: file pi-mpi.f90, line 83.
[0,1] (mpigdb) run
[0,1] Continuing.
Greetings from proc
0 of
2 f07n05
Nterms
Nperproc
Nreps
error
time/rep
Greetings from proc
1 of
2 f07n05
[0,1]
[0,1] Breakpoint 1, pimpi () at pi-mpi.f90:83
[0,1] 83
partial_sum = partial_sum_p + partial_sum_m
[0,1] (mpigdb) p my_low
[0] $1 = 1
[1] $1 = 65
[0,1] (mpigdb) p my_high
[0] $2 = 64
[1] $2 = 128
M. D. Jones, Ph.D. (CCR/UB)
Debugging in Serial & Parallel
GUI-based Parallel Debugging
HPC-I Fall 2013
Using Serial Debuggers in Parallel
The TotalView Debugger
So you can certainly use serial debuggers in parallel - in fact it is a
pretty handy thing to do. Just keep in mind:
The “premier” parallel debugger, TotalView:
Sophisticated commercial product (think many $$ ...)
Don’t forget to compile with debugging turned on
Designed especially for HPC, multi-process, multi-thread
You can always attach to a running code (and you can instrument
the code with that purpose in mind)
Has both GUI and CLI
Beware that not all task launchers are equally friendly towards
built-in support for serial debuggers
The “official” debugger of DOE’s Advanced Simulation and
Computing (ASC) program
M. D. Jones, Ph.D. (CCR/UB)
Debugging in Serial & Parallel
HPC-I Fall 2013
84 / 90
TotalView
85 / 90
Supports C/C++, Fortran 77/90/95, mixtures thereof
M. D. Jones, Ph.D. (CCR/UB)
Debugging in Serial & Parallel
HPC-I Fall 2013
87 / 90
GUI-based Parallel Debugging
TotalView
GUI-based Parallel Debugging
DDT
Using TotalView at CCR
The DDT Debugger
Pretty simple to start using TotalView on the CCR systems:
Allinea’s commercial parallel debugger, DDT:
1
Sophisticated commercial product (think many $$ ...)
Generally you want to load the latest version:
Designed especially for HPC, multi-process, multi-thread
[d16n03:~]$ module avail totalview
2
Make sure that your X DISPLAY environment is working if you are
going to use the GUI.
3
The current CCR license supports 2 concurrent users up to 8
processors (precludes usage on nodes with more than 8 cores
until/unless this license is upgraded).
M. D. Jones, Ph.D. (CCR/UB)
Debugging in Serial & Parallel
GUI-based Parallel Debugging
HPC-I Fall 2013
88 / 90
Eclipse PTP
CCR has licenses for Allinea’s DDT and TotalView (although the
current TotalView license is very small and outdated and will be either
upgraded or dropped in favor of DDT). Both are quite expensive, but
stay tuned for further developments. Note that the open-source
eclipse project also has a parallel tools platform that can be used in
combination with C/C++ and Fortran:
http://www.eclipse.org/ptp
Debugging in Serial & Parallel
HPC-I Fall 2013
Supports C/C++, Fortran 77/90/95, mixtures thereof
CCR has a 32-token license for DDT (including CUDA and profiler
support)
To find the latest installed version,
module avail ddt
Current Recommendations
M. D. Jones, Ph.D. (CCR/UB)
Has both GUI and CLI
90 / 90
M. D. Jones, Ph.D. (CCR/UB)
Debugging in Serial & Parallel
HPC-I Fall 2013
89 / 90