1
Programming on Parallel Machines
Norm Matloff
University of California, Davis
GPU, Multicore, Clusters and More
See Creative Commons license at
http://heather.cs.ucdavis.edu/ matloff/probstatbook.html
CUDA and NVIDIA are registered trademarks.
2
Author’s Biographical Sketch
Dr. Norm Matloff is a professor of computer science at the University of California at Davis, and was
formerly a professor of mathematics and statistics at that university. He is a former database software
developer in Silicon Valley, and has been a statistical consultant for firms such as the Kaiser Permanente
Health Plan.
Dr. Matloff was born in Los Angeles, and grew up in East Los Angeles and the San Gabriel Valley. He has
a PhD in pure mathematics from UCLA, specializing in probability theory and statistics. He has published
numerous papers in computer science and statistics, with current research interests in parallel processing,
analysis of social networks, and regression methodology.
Prof. Matloff is a former appointed member of IFIP Working Group 11.3, an international committee
concerned with database software security, established under UNESCO. He was a founding member of
the UC Davis Department of Statistics, and participated in the formation of the UCD Computer Science
Department as well. He is a recipient of the campuswide Distinguished Teaching Award and Distinguished
Public Service Award at UC Davis.
Dr. Matloff is the author of two published textbooks, and of a number of widely-used Web tutorials on computer topics, such as the Linux operating system and the Python programming language. He and Dr. Peter
Salzman are authors of The Art of Debugging with GDB, DDD, and Eclipse. Prof. Matloff’s book on the R
programming language, The Art of R Programming, is due to be published in 2010. He is also the author of
several open-source textbooks, including From Algorithms to Z-Scores: Probabilistic and Statistical Modeling in Computer Science (http://heather.cs.ucdavis.edu/probstatbook), and Programming on Parallel Machines (http://heather.cs.ucdavis.edu/˜matloff/ParProcBook.pdf).
Contents
1
Introduction to Parallel Processing
1
1.1
Overview: Why Use Parallel Systems? . . . . . . . . . . . . . . . . . . . . . . . . . . . . .
1
1.1.1
Execution Speed . . . . . . . . . . . . . . . . . . . . . . . . . . . . . . . . . . . .
1
1.1.2
Memory . . . . . . . . . . . . . . . . . . . . . . . . . . . . . . . . . . . . . . . . .
2
Parallel Processing Hardware . . . . . . . . . . . . . . . . . . . . . . . . . . . . . . . . . .
2
1.2.1
Shared-Memory Systems . . . . . . . . . . . . . . . . . . . . . . . . . . . . . . . .
2
1.2.1.1
Basic Architecture . . . . . . . . . . . . . . . . . . . . . . . . . . . . . .
2
1.2.1.2
Example: SMP Systems . . . . . . . . . . . . . . . . . . . . . . . . . . .
3
Message-Passing Systems . . . . . . . . . . . . . . . . . . . . . . . . . . . . . . .
4
1.2.2.1
Basic Architecture . . . . . . . . . . . . . . . . . . . . . . . . . . . . . .
4
1.2.2.2
Example: Networks of Workstations (NOWs) . . . . . . . . . . . . . . .
4
SIMD . . . . . . . . . . . . . . . . . . . . . . . . . . . . . . . . . . . . . . . . . .
4
Programmer World Views . . . . . . . . . . . . . . . . . . . . . . . . . . . . . . . . . . . .
5
1.3.1
Shared-Memory . . . . . . . . . . . . . . . . . . . . . . . . . . . . . . . . . . . .
5
1.3.1.1
Programmer View . . . . . . . . . . . . . . . . . . . . . . . . . . . . . .
5
1.3.1.2
Example . . . . . . . . . . . . . . . . . . . . . . . . . . . . . . . . . . .
5
1.3.1.3
Role of the OS . . . . . . . . . . . . . . . . . . . . . . . . . . . . . . . . 10
1.3.1.4
Debugging Threads Programs . . . . . . . . . . . . . . . . . . . . . . . . 11
1.2
1.2.2
1.2.3
1.3
1.3.2
Message Passing . . . . . . . . . . . . . . . . . . . . . . . . . . . . . . . . . . . . 12
i
ii
2
CONTENTS
1.3.2.1
Programmer View . . . . . . . . . . . . . . . . . . . . . . . . . . . . . . 12
1.3.2.2
Example . . . . . . . . . . . . . . . . . . . . . . . . . . . . . . . . . . . 12
1.4
Relative Merits: Shared-Memory Vs. Message-Passing . . . . . . . . . . . . . . . . . . . . 15
1.5
Issues in Parallelizing Applications . . . . . . . . . . . . . . . . . . . . . . . . . . . . . . . 15
1.5.1
Communication Bottlenecks . . . . . . . . . . . . . . . . . . . . . . . . . . . . . . 15
1.5.2
Load Balancing . . . . . . . . . . . . . . . . . . . . . . . . . . . . . . . . . . . . . 16
1.5.3
“Embarrassingly Parallel” Applications . . . . . . . . . . . . . . . . . . . . . . . . 16
1.5.4
Tradeoffs Between Optimizing Communication and Load Balance . . . . . . . . . . 17
Shared Memory Parallelism
21
2.1
What Is Shared? . . . . . . . . . . . . . . . . . . . . . . . . . . . . . . . . . . . . . . . . . 21
2.2
Memory Modules . . . . . . . . . . . . . . . . . . . . . . . . . . . . . . . . . . . . . . . . 22
2.3
2.2.1
Interleaving . . . . . . . . . . . . . . . . . . . . . . . . . . . . . . . . . . . . . . . 22
2.2.2
Bank Conflicts and Solutions . . . . . . . . . . . . . . . . . . . . . . . . . . . . . . 23
Interconnection Topologies . . . . . . . . . . . . . . . . . . . . . . . . . . . . . . . . . . . 24
2.3.1
SMP Systems . . . . . . . . . . . . . . . . . . . . . . . . . . . . . . . . . . . . . . 24
2.3.2
NUMA Systems . . . . . . . . . . . . . . . . . . . . . . . . . . . . . . . . . . . . 25
2.3.3
NUMA Interconnect Topologies . . . . . . . . . . . . . . . . . . . . . . . . . . . . 26
2.3.3.1
Crossbar Interconnects . . . . . . . . . . . . . . . . . . . . . . . . . . . 26
2.3.3.2
Omega (or Delta) Interconnects . . . . . . . . . . . . . . . . . . . . . . . 28
2.3.4
Comparative Analysis . . . . . . . . . . . . . . . . . . . . . . . . . . . . . . . . . 29
2.3.5
Why Have Memory in Modules? . . . . . . . . . . . . . . . . . . . . . . . . . . . . 30
2.4
Test-and-Set Type Instructions . . . . . . . . . . . . . . . . . . . . . . . . . . . . . . . . . 31
2.5
Cache Issues . . . . . . . . . . . . . . . . . . . . . . . . . . . . . . . . . . . . . . . . . . . 32
2.5.1
Cache Coherency . . . . . . . . . . . . . . . . . . . . . . . . . . . . . . . . . . . . 32
2.5.2
Example: the MESI Cache Coherency Protocol . . . . . . . . . . . . . . . . . . . . 35
2.5.3
The Problem of “False Sharing” . . . . . . . . . . . . . . . . . . . . . . . . . . . . 37
CONTENTS
iii
2.6
Memory-Access Consistency Policies . . . . . . . . . . . . . . . . . . . . . . . . . . . . . 37
2.7
Fetch-and-Add and Packet-Combining Operations . . . . . . . . . . . . . . . . . . . . . . . 39
2.8
Multicore Chips . . . . . . . . . . . . . . . . . . . . . . . . . . . . . . . . . . . . . . . . . 41
2.9
Illusion of Shared-Memory through Software . . . . . . . . . . . . . . . . . . . . . . . . . 41
2.9.0.1
Software Distributed Shared Memory . . . . . . . . . . . . . . . . . . . . 41
2.9.0.2
Case Study: JIAJIA . . . . . . . . . . . . . . . . . . . . . . . . . . . . . 43
2.10 Barrier Implementation . . . . . . . . . . . . . . . . . . . . . . . . . . . . . . . . . . . . . 47
2.10.1 A Use-Once Version . . . . . . . . . . . . . . . . . . . . . . . . . . . . . . . . . . 47
2.10.2 An Attempt to Write a Reusable Version . . . . . . . . . . . . . . . . . . . . . . . . 48
2.10.3 A Correct Version . . . . . . . . . . . . . . . . . . . . . . . . . . . . . . . . . . . 48
2.10.4 Refinements
. . . . . . . . . . . . . . . . . . . . . . . . . . . . . . . . . . . . . . 49
2.10.4.1 Use of Wait Operations . . . . . . . . . . . . . . . . . . . . . . . . . . . 49
2.10.4.2 Parallelizing the Barrier Operation . . . . . . . . . . . . . . . . . . . . . 51
3
2.10.4.2.1
Tree Barriers . . . . . . . . . . . . . . . . . . . . . . . . . . . 51
2.10.4.2.2
Butterfly Barriers . . . . . . . . . . . . . . . . . . . . . . . . . 51
Introduction to OpenMP
53
3.1
Overview . . . . . . . . . . . . . . . . . . . . . . . . . . . . . . . . . . . . . . . . . . . . 53
3.2
Running Example . . . . . . . . . . . . . . . . . . . . . . . . . . . . . . . . . . . . . . . . 53
3.3
3.2.1
The Algorithm . . . . . . . . . . . . . . . . . . . . . . . . . . . . . . . . . . . . . 56
3.2.2
The OpenMP parallel Pragma . . . . . . . . . . . . . . . . . . . . . . . . . . . 56
3.2.3
Scope Issues . . . . . . . . . . . . . . . . . . . . . . . . . . . . . . . . . . . . . . 57
3.2.4
The OpenMP single Pragma . . . . . . . . . . . . . . . . . . . . . . . . . . . . 58
3.2.5
The OpenMP barrier Pragma . . . . . . . . . . . . . . . . . . . . . . . . . . . . 58
3.2.6
Implicit Barriers . . . . . . . . . . . . . . . . . . . . . . . . . . . . . . . . . . . . 58
3.2.7
The OpenMP critical Pragma . . . . . . . . . . . . . . . . . . . . . . . . . . . 59
The OpenMP for Pragma . . . . . . . . . . . . . . . . . . . . . . . . . . . . . . . . . . . 59
iv
CONTENTS
3.3.1
Basic Example . . . . . . . . . . . . . . . . . . . . . . . . . . . . . . . . . . . . . 59
3.3.2
Nested Loops . . . . . . . . . . . . . . . . . . . . . . . . . . . . . . . . . . . . . . 62
3.3.3
Controlling the Partitioning of Work to Threads . . . . . . . . . . . . . . . . . . . . 62
3.3.4
The OpenMP reduction Clause . . . . . . . . . . . . . . . . . . . . . . . . . . 63
3.4
The Task Directive . . . . . . . . . . . . . . . . . . . . . . . . . . . . . . . . . . . . . . . 65
3.5
Other OpenMP Synchronization Issues . . . . . . . . . . . . . . . . . . . . . . . . . . . . . 66
3.5.1
The OpenMP atomic Clause . . . . . . . . . . . . . . . . . . . . . . . . . . . . . 66
3.5.2
Memory Consistency and the flush Pragma . . . . . . . . . . . . . . . . . . . . . 67
3.6
Combining Work-Sharing Constructs . . . . . . . . . . . . . . . . . . . . . . . . . . . . . . 68
3.7
The Rest of OpenMP . . . . . . . . . . . . . . . . . . . . . . . . . . . . . . . . . . . . . . 68
3.8
Further Examples . . . . . . . . . . . . . . . . . . . . . . . . . . . . . . . . . . . . . . . . 68
3.9
Compiling, Running and Debugging OpenMP Code . . . . . . . . . . . . . . . . . . . . . . 69
3.9.1
Compiling . . . . . . . . . . . . . . . . . . . . . . . . . . . . . . . . . . . . . . . 69
3.9.2
Running . . . . . . . . . . . . . . . . . . . . . . . . . . . . . . . . . . . . . . . . . 69
3.9.3
Debugging . . . . . . . . . . . . . . . . . . . . . . . . . . . . . . . . . . . . . . . 70
3.10 Performance . . . . . . . . . . . . . . . . . . . . . . . . . . . . . . . . . . . . . . . . . . . 70
3.10.1 The Effect of Problem Size . . . . . . . . . . . . . . . . . . . . . . . . . . . . . . . 70
3.10.2 Some Fine Tuning . . . . . . . . . . . . . . . . . . . . . . . . . . . . . . . . . . . 71
3.10.3 OpenMP Internals . . . . . . . . . . . . . . . . . . . . . . . . . . . . . . . . . . . 75
3.11 Another Example . . . . . . . . . . . . . . . . . . . . . . . . . . . . . . . . . . . . . . . . 75
4
Introduction to GPU Programming with CUDA
77
4.1
Overview . . . . . . . . . . . . . . . . . . . . . . . . . . . . . . . . . . . . . . . . . . . . 77
4.2
Sample Program . . . . . . . . . . . . . . . . . . . . . . . . . . . . . . . . . . . . . . . . . 78
4.3
Understanding the Hardware Structure . . . . . . . . . . . . . . . . . . . . . . . . . . . . . 82
4.3.1
Processing Units . . . . . . . . . . . . . . . . . . . . . . . . . . . . . . . . . . . . 82
4.3.2
Thread Operation . . . . . . . . . . . . . . . . . . . . . . . . . . . . . . . . . . . . 82
CONTENTS
4.3.3
v
4.3.2.1
SIMT Architecture . . . . . . . . . . . . . . . . . . . . . . . . . . . . . . 82
4.3.2.2
The Problem of Thread Divergence . . . . . . . . . . . . . . . . . . . . . 83
4.3.2.3
“OS in Hardware” . . . . . . . . . . . . . . . . . . . . . . . . . . . . . . 83
Memory Structure . . . . . . . . . . . . . . . . . . . . . . . . . . . . . . . . . . . 84
4.3.3.1
Shared and Global Memory . . . . . . . . . . . . . . . . . . . . . . . . . 84
4.3.3.2
Global-Memory Performance Issues . . . . . . . . . . . . . . . . . . . . 87
4.3.3.3
Shared-Memory Performance Issues . . . . . . . . . . . . . . . . . . . . 88
4.3.3.4
Host/Device Memory Transfer Performance Issues . . . . . . . . . . . . . 88
4.3.3.5
Other Types of Memory . . . . . . . . . . . . . . . . . . . . . . . . . . . 88
4.3.4
Threads Hierarchy . . . . . . . . . . . . . . . . . . . . . . . . . . . . . . . . . . . 90
4.3.5
What’s NOT There . . . . . . . . . . . . . . . . . . . . . . . . . . . . . . . . . . . 91
4.4
Synchronization, Within and Between Blocks . . . . . . . . . . . . . . . . . . . . . . . . . 92
4.5
Hardware Requirements, Installation, Compilation, Debugging . . . . . . . . . . . . . . . . 92
4.6
Improving the Sample Program . . . . . . . . . . . . . . . . . . . . . . . . . . . . . . . . . 93
4.7
More Examples . . . . . . . . . . . . . . . . . . . . . . . . . . . . . . . . . . . . . . . . . 95
4.7.1
Finding the Mean Number of Mutual Outlinks . . . . . . . . . . . . . . . . . . . . 95
4.7.2
Finding Prime Numbers . . . . . . . . . . . . . . . . . . . . . . . . . . . . . . . . 98
4.8
CUBLAS . . . . . . . . . . . . . . . . . . . . . . . . . . . . . . . . . . . . . . . . . . . . 101
4.9
Error Checking . . . . . . . . . . . . . . . . . . . . . . . . . . . . . . . . . . . . . . . . . 104
4.10 The New Generation . . . . . . . . . . . . . . . . . . . . . . . . . . . . . . . . . . . . . . 104
4.11 Further Examples . . . . . . . . . . . . . . . . . . . . . . . . . . . . . . . . . . . . . . . . 105
5
Message Passing Systems
107
5.1
Overview . . . . . . . . . . . . . . . . . . . . . . . . . . . . . . . . . . . . . . . . . . . . 107
5.2
A Historical Example: Hypercubes . . . . . . . . . . . . . . . . . . . . . . . . . . . . . . . 108
5.2.0.0.1
5.3
Definitions . . . . . . . . . . . . . . . . . . . . . . . . . . . . . 108
Networks of Workstations (NOWs) . . . . . . . . . . . . . . . . . . . . . . . . . . . . . . . 110
vi
CONTENTS
5.4
5.3.1
The Network Is Literally the Weakest Link . . . . . . . . . . . . . . . . . . . . . . 110
5.3.2
Other Issues . . . . . . . . . . . . . . . . . . . . . . . . . . . . . . . . . . . . . . . 111
Systems Using Nonexplicit Message-Passing . . . . . . . . . . . . . . . . . . . . . . . . . 111
5.4.1
6
MapReduce . . . . . . . . . . . . . . . . . . . . . . . . . . . . . . . . . . . . . . . 111
Introduction to MPI
6.1
115
Overview . . . . . . . . . . . . . . . . . . . . . . . . . . . . . . . . . . . . . . . . . . . . 115
6.1.1
History . . . . . . . . . . . . . . . . . . . . . . . . . . . . . . . . . . . . . . . . . 115
6.1.2
Structure and Execution . . . . . . . . . . . . . . . . . . . . . . . . . . . . . . . . 116
6.1.3
Implementations . . . . . . . . . . . . . . . . . . . . . . . . . . . . . . . . . . . . 116
6.1.4
Performance Issues . . . . . . . . . . . . . . . . . . . . . . . . . . . . . . . . . . . 116
6.2
Earlier Example . . . . . . . . . . . . . . . . . . . . . . . . . . . . . . . . . . . . . . . . . 117
6.3
Running Example . . . . . . . . . . . . . . . . . . . . . . . . . . . . . . . . . . . . . . . . 117
6.4
6.3.1
The Algorithm . . . . . . . . . . . . . . . . . . . . . . . . . . . . . . . . . . . . . 117
6.3.2
The Code . . . . . . . . . . . . . . . . . . . . . . . . . . . . . . . . . . . . . . . . 118
6.3.3
Introduction to MPI APIs
. . . . . . . . . . . . . . . . . . . . . . . . . . . . . . . 121
6.3.3.1
MPI Init() and MPI Finalize() . . . . . . . . . . . . . . . . . . . . . . . 121
6.3.3.2
MPI Comm size() and MPI Comm rank() . . . . . . . . . . . . . . . . . 121
6.3.3.3
MPI Send() . . . . . . . . . . . . . . . . . . . . . . . . . . . . . . . . . 122
6.3.3.4
MPI Recv() . . . . . . . . . . . . . . . . . . . . . . . . . . . . . . . . . 123
Collective Communications . . . . . . . . . . . . . . . . . . . . . . . . . . . . . . . . . . . 123
6.4.1
Example . . . . . . . . . . . . . . . . . . . . . . . . . . . . . . . . . . . . . . . . 123
6.4.2
MPI Bcast() . . . . . . . . . . . . . . . . . . . . . . . . . . . . . . . . . . . . . . 126
6.4.2.1
MPI Reduce()/MPI Allreduce() . . . . . . . . . . . . . . . . . . . . . . . 127
6.4.2.2
MPI Gather()/MPI Allgather() . . . . . . . . . . . . . . . . . . . . . . . 128
6.4.2.3
The MPI Scatter() . . . . . . . . . . . . . . . . . . . . . . . . . . . . . . 128
6.4.2.4
The MPI Barrier() . . . . . . . . . . . . . . . . . . . . . . . . . . . . . . 129
CONTENTS
6.4.3
6.5
6.6
7
8
vii
Creating Communicators . . . . . . . . . . . . . . . . . . . . . . . . . . . . . . . . 129
Buffering, Synchrony and Related Issues . . . . . . . . . . . . . . . . . . . . . . . . . . . . 130
6.5.1
Buffering, Etc. . . . . . . . . . . . . . . . . . . . . . . . . . . . . . . . . . . . . . 130
6.5.2
Safety . . . . . . . . . . . . . . . . . . . . . . . . . . . . . . . . . . . . . . . . . . 131
6.5.3
Living Dangerously . . . . . . . . . . . . . . . . . . . . . . . . . . . . . . . . . . 132
6.5.4
Safe Exchange Operations . . . . . . . . . . . . . . . . . . . . . . . . . . . . . . . 132
Use of MPI from Other Languages . . . . . . . . . . . . . . . . . . . . . . . . . . . . . . . 132
The Parallel Prefix Problem
133
7.1
Example . . . . . . . . . . . . . . . . . . . . . . . . . . . . . . . . . . . . . . . . . . . . . 133
7.2
General Parallel Strategies . . . . . . . . . . . . . . . . . . . . . . . . . . . . . . . . . . . 135
7.3
Implementations . . . . . . . . . . . . . . . . . . . . . . . . . . . . . . . . . . . . . . . . 137
Introduction to Parallel R
139
8.1
Quick Introductions to R . . . . . . . . . . . . . . . . . . . . . . . . . . . . . . . . . . . . 139
8.2
Some Parallel R Packages . . . . . . . . . . . . . . . . . . . . . . . . . . . . . . . . . . . . 140
8.3
Installing the Packages . . . . . . . . . . . . . . . . . . . . . . . . . . . . . . . . . . . . . 140
8.4
Rmpi . . . . . . . . . . . . . . . . . . . . . . . . . . . . . . . . . . . . . . . . . . . . . . 140
8.5
8.6
8.4.1
Usage . . . . . . . . . . . . . . . . . . . . . . . . . . . . . . . . . . . . . . . . . . 141
8.4.2
Available Functions . . . . . . . . . . . . . . . . . . . . . . . . . . . . . . . . . . . 141
8.4.3
Example: Inversion of a Diagonal-Block Matrix . . . . . . . . . . . . . . . . . . . 142
The R snow Package . . . . . . . . . . . . . . . . . . . . . . . . . . . . . . . . . . . . . . 143
8.5.1
Usage . . . . . . . . . . . . . . . . . . . . . . . . . . . . . . . . . . . . . . . . . . 143
8.5.2
Example: Matrix Multiplication . . . . . . . . . . . . . . . . . . . . . . . . . . . . 144
8.5.3
Other snow Functions . . . . . . . . . . . . . . . . . . . . . . . . . . . . . . . . . 145
Rdsm . . . . . . . . . . . . . . . . . . . . . . . . . . . . . . . . . . . . . . . . . . . . . . 147
8.6.1
Example: Web Probe . . . . . . . . . . . . . . . . . . . . . . . . . . . . . . . . . . 148
viii
CONTENTS
8.6.2
8.7
8.8
8.9
9
The bigmemory Package . . . . . . . . . . . . . . . . . . . . . . . . . . . . . . . . 149
R with GPUs . . . . . . . . . . . . . . . . . . . . . . . . . . . . . . . . . . . . . . . . . . 150
8.7.1
Installation . . . . . . . . . . . . . . . . . . . . . . . . . . . . . . . . . . . . . . . 150
8.7.2
The gputools Package . . . . . . . . . . . . . . . . . . . . . . . . . . . . . . . . . 150
8.7.3
The rgpu Package . . . . . . . . . . . . . . . . . . . . . . . . . . . . . . . . . . . . 151
Parallelism Via Calling C from R . . . . . . . . . . . . . . . . . . . . . . . . . . . . . . . . 152
8.8.1
Calling C from R . . . . . . . . . . . . . . . . . . . . . . . . . . . . . . . . . . . . 152
8.8.2
Calling C OpenMP Code from R . . . . . . . . . . . . . . . . . . . . . . . . . . . . 153
Debugging R Applications . . . . . . . . . . . . . . . . . . . . . . . . . . . . . . . . . . . 154
Introduction to Parallel Matrix Operations
9.1
155
“We’re Not in Physicsland Anymore, Toto” . . . . . . . . . . . . . . . . . . . . . . . . . . 155
9.1.1
Example from Graph Theory . . . . . . . . . . . . . . . . . . . . . . . . . . . . . . 155
9.2
Libraries . . . . . . . . . . . . . . . . . . . . . . . . . . . . . . . . . . . . . . . . . . . . . 156
9.3
Partitioned Matrices . . . . . . . . . . . . . . . . . . . . . . . . . . . . . . . . . . . . . . . 156
9.4
Matrix Multiplication . . . . . . . . . . . . . . . . . . . . . . . . . . . . . . . . . . . . . . 158
9.4.1
9.4.2
9.4.3
9.5
9.6
Message-Passing Case . . . . . . . . . . . . . . . . . . . . . . . . . . . . . . . . . 158
9.4.1.1
Fox’s Algorithm . . . . . . . . . . . . . . . . . . . . . . . . . . . . . . . 159
9.4.1.2
Performance Issues . . . . . . . . . . . . . . . . . . . . . . . . . . . . . 160
Shared-Memory Case . . . . . . . . . . . . . . . . . . . . . . . . . . . . . . . . . . 160
9.4.2.1
OpenMP . . . . . . . . . . . . . . . . . . . . . . . . . . . . . . . . . . . 160
9.4.2.2
CUDA . . . . . . . . . . . . . . . . . . . . . . . . . . . . . . . . . . . . 160
Finding Powers of Matrices . . . . . . . . . . . . . . . . . . . . . . . . . . . . . . 164
Solving Systems of Linear Equations . . . . . . . . . . . . . . . . . . . . . . . . . . . . . . 164
9.5.1
Gaussian Elimination . . . . . . . . . . . . . . . . . . . . . . . . . . . . . . . . . . 165
9.5.2
The Jacobi Algorithm . . . . . . . . . . . . . . . . . . . . . . . . . . . . . . . . . 166
OpenMP Implementation of the Jacobi Algorithm . . . . . . . . . . . . . . . . . . . . . . . 166
CONTENTS
9.7
ix
Matrix Inversion . . . . . . . . . . . . . . . . . . . . . . . . . . . . . . . . . . . . . . . . . 167
9.7.1
Using the Methods for Solving Systems of Linear Equations . . . . . . . . . . . . . 168
9.7.2
Power Series Method . . . . . . . . . . . . . . . . . . . . . . . . . . . . . . . . . . 168
10 Introduction to Parallel Sorting
169
10.1 Quicksort . . . . . . . . . . . . . . . . . . . . . . . . . . . . . . . . . . . . . . . . . . . . 169
10.1.1 The Separation Process . . . . . . . . . . . . . . . . . . . . . . . . . . . . . . . . . 169
10.1.2 Shared-Memory Quicksort . . . . . . . . . . . . . . . . . . . . . . . . . . . . . . . 171
10.1.3 Hyperquicksort . . . . . . . . . . . . . . . . . . . . . . . . . . . . . . . . . . . . . 172
10.2 Mergesorts . . . . . . . . . . . . . . . . . . . . . . . . . . . . . . . . . . . . . . . . . . . 173
10.2.1 Sequential Form . . . . . . . . . . . . . . . . . . . . . . . . . . . . . . . . . . . . 173
10.2.2 Shared-Memory Mergesort . . . . . . . . . . . . . . . . . . . . . . . . . . . . . . . 173
10.2.3 Message Passing Mergesort on a Tree Topology . . . . . . . . . . . . . . . . . . . . 173
10.2.4 Compare-Exchange Operations . . . . . . . . . . . . . . . . . . . . . . . . . . . . 174
10.2.5 Bitonic Mergesort . . . . . . . . . . . . . . . . . . . . . . . . . . . . . . . . . . . 174
10.3 The Bubble Sort and Its Cousins . . . . . . . . . . . . . . . . . . . . . . . . . . . . . . . . 176
10.3.1 The Much-Maligned Bubble Sort . . . . . . . . . . . . . . . . . . . . . . . . . . . 176
10.3.2 A Popular Variant: Odd-Even Transposition . . . . . . . . . . . . . . . . . . . . . . 177
10.3.3 CUDA Implementation of Odd/Even Transposition Sort . . . . . . . . . . . . . . . 177
10.4 Shearsort . . . . . . . . . . . . . . . . . . . . . . . . . . . . . . . . . . . . . . . . . . . . 178
10.5 Bucket Sort with Sampling . . . . . . . . . . . . . . . . . . . . . . . . . . . . . . . . . . . 179
10.6 Radix Sort . . . . . . . . . . . . . . . . . . . . . . . . . . . . . . . . . . . . . . . . . . . . 180
10.7 Enumeration Sort . . . . . . . . . . . . . . . . . . . . . . . . . . . . . . . . . . . . . . . . 180
11 Parallel Computation for Image Processing
181
11.1 General Principles . . . . . . . . . . . . . . . . . . . . . . . . . . . . . . . . . . . . . . . . 181
11.1.1 One-Dimensional Fourier Series . . . . . . . . . . . . . . . . . . . . . . . . . . . . 181
x
CONTENTS
11.1.2 Two-Dimensional Fourier Series . . . . . . . . . . . . . . . . . . . . . . . . . . . . 185
11.2 Discrete Fourier Transforms . . . . . . . . . . . . . . . . . . . . . . . . . . . . . . . . . . 185
11.2.1 One-Dimensional Data . . . . . . . . . . . . . . . . . . . . . . . . . . . . . . . . . 186
11.2.2 Inversion . . . . . . . . . . . . . . . . . . . . . . . . . . . . . . . . . . . . . . . . 187
11.2.2.1 Alternate Formulation . . . . . . . . . . . . . . . . . . . . . . . . . . . . 187
11.2.3 Two-Dimensional Data . . . . . . . . . . . . . . . . . . . . . . . . . . . . . . . . . 188
11.3 Parallel Computation of Discrete Fourier Transforms . . . . . . . . . . . . . . . . . . . . . 188
11.3.1 CUFFT . . . . . . . . . . . . . . . . . . . . . . . . . . . . . . . . . . . . . . . . . 188
11.3.2 The Fast Fourier Transform . . . . . . . . . . . . . . . . . . . . . . . . . . . . . . 188
11.3.3 A Matrix Approach . . . . . . . . . . . . . . . . . . . . . . . . . . . . . . . . . . . 189
11.3.4 Parallelizing Computation of the Inverse Transform . . . . . . . . . . . . . . . . . . 189
11.3.5 Parallelizing Computation of the Two-Dimensional Transform . . . . . . . . . . . . 190
11.4 Applications to Image Processing . . . . . . . . . . . . . . . . . . . . . . . . . . . . . . . 190
11.4.1 Smoothing . . . . . . . . . . . . . . . . . . . . . . . . . . . . . . . . . . . . . . . 190
11.4.2 Edge Detection . . . . . . . . . . . . . . . . . . . . . . . . . . . . . . . . . . . . . 191
11.5 The Cosine Transform . . . . . . . . . . . . . . . . . . . . . . . . . . . . . . . . . . . . . 192
11.6 Keeping the Pixel Intensities in the Proper Range . . . . . . . . . . . . . . . . . . . . . . . 193
11.7 Does the Function g() Really Have to Be Repeating? . . . . . . . . . . . . . . . . . . . . . 193
11.8 Vector Space Issues (optional section) . . . . . . . . . . . . . . . . . . . . . . . . . . . . . 194
11.9 Bandwidth: How to Read the San Francisco Chronicle Business Page (optional section) . . . 195
12 Parallel Computation in Statistics/Data Mining
197
12.1 Itemset Analysis . . . . . . . . . . . . . . . . . . . . . . . . . . . . . . . . . . . . . . . . . 197
12.1.1 What Is It? . . . . . . . . . . . . . . . . . . . . . . . . . . . . . . . . . . . . . . . 197
12.1.2 The Market Basket Problem . . . . . . . . . . . . . . . . . . . . . . . . . . . . . . 198
12.1.3 Serial Algorithms . . . . . . . . . . . . . . . . . . . . . . . . . . . . . . . . . . . . 199
12.1.4 Parallelizing the Apriori Algorithm . . . . . . . . . . . . . . . . . . . . . . . . . . 199
CONTENTS
xi
12.2 Probability Density Estimation . . . . . . . . . . . . . . . . . . . . . . . . . . . . . . . . . 200
12.2.1 Kernel-Based Density Estimation . . . . . . . . . . . . . . . . . . . . . . . . . . . 200
12.2.2 Histogram Computation for Images . . . . . . . . . . . . . . . . . . . . . . . . . . 203
12.3 Clustering . . . . . . . . . . . . . . . . . . . . . . . . . . . . . . . . . . . . . . . . . . . . 204
12.4 Principal Component Analysis (PCA) . . . . . . . . . . . . . . . . . . . . . . . . . . . . . 206
12.5 Parallel Processing in R . . . . . . . . . . . . . . . . . . . . . . . . . . . . . . . . . . . . . 207
13 Parallel Python Threads and Multiprocessing Modules
209
13.1 The Python Threads and Multiprocessing Modules . . . . . . . . . . . . . . . . . . . . . . 209
13.1.1 Python Threads Modules . . . . . . . . . . . . . . . . . . . . . . . . . . . . . . . . 209
13.1.1.1 The thread Module . . . . . . . . . . . . . . . . . . . . . . . . . . . . 209
13.1.1.2 The threading Module . . . . . . . . . . . . . . . . . . . . . . . . . . 218
13.1.2 Condition Variables . . . . . . . . . . . . . . . . . . . . . . . . . . . . . . . . . . . 223
13.1.2.1 General Ideas . . . . . . . . . . . . . . . . . . . . . . . . . . . . . . . . 223
13.1.2.2 Event Example . . . . . . . . . . . . . . . . . . . . . . . . . . . . . . . 223
13.1.2.3 Other threading Classes . . . . . . . . . . . . . . . . . . . . . . . . . 225
13.1.3 Threads Internals . . . . . . . . . . . . . . . . . . . . . . . . . . . . . . . . . . . . 226
13.1.3.1 Kernel-Level Thread Managers . . . . . . . . . . . . . . . . . . . . . . . 226
13.1.3.2 User-Level Thread Managers . . . . . . . . . . . . . . . . . . . . . . . . 226
13.1.3.3 Comparison . . . . . . . . . . . . . . . . . . . . . . . . . . . . . . . . . 226
13.1.3.4 The Python Thread Manager . . . . . . . . . . . . . . . . . . . . . . . . 227
13.1.3.5 The GIL . . . . . . . . . . . . . . . . . . . . . . . . . . . . . . . . . . . 227
13.1.3.6 Implications for Randomness and Need for Locks . . . . . . . . . . . . . 228
13.1.4 The multiprocessing Module . . . . . . . . . . . . . . . . . . . . . . . . . . 229
13.1.5 The Queue Module for Threads and Multiprocessing . . . . . . . . . . . . . . . . . 232
13.1.6 Debugging Threaded and Multiprocessing Python Programs . . . . . . . . . . . . . 235
13.2 Using Python with MPI . . . . . . . . . . . . . . . . . . . . . . . . . . . . . . . . . . . . . 235
xii
CONTENTS
13.2.1 Using PDB to Debug Threaded Programs . . . . . . . . . . . . . . . . . . . . . . . 237
13.2.2 RPDB2 and Winpdb . . . . . . . . . . . . . . . . . . . . . . . . . . . . . . . . . . 238
A Review of Matrix Algebra
239
A.1 Terminology and Notation . . . . . . . . . . . . . . . . . . . . . . . . . . . . . . . . . . . 239
A.1.1 Matrix Addition and Multiplication . . . . . . . . . . . . . . . . . . . . . . . . . . 240
A.2 Matrix Transpose . . . . . . . . . . . . . . . . . . . . . . . . . . . . . . . . . . . . . . . . 241
A.3 Linear Independence . . . . . . . . . . . . . . . . . . . . . . . . . . . . . . . . . . . . . . 241
A.4 Determinants . . . . . . . . . . . . . . . . . . . . . . . . . . . . . . . . . . . . . . . . . . 242
A.5 Matrix Inverse . . . . . . . . . . . . . . . . . . . . . . . . . . . . . . . . . . . . . . . . . . 242
A.6 Eigenvalues and Eigenvectors . . . . . . . . . . . . . . . . . . . . . . . . . . . . . . . . . . 242
B R Quick Start
245
B.1 Correspondences . . . . . . . . . . . . . . . . . . . . . . . . . . . . . . . . . . . . . . . . 245
B.2 Starting R . . . . . . . . . . . . . . . . . . . . . . . . . . . . . . . . . . . . . . . . . . . . 245
B.3 First Sample Programming Session . . . . . . . . . . . . . . . . . . . . . . . . . . . . . . . 246
B.4 Second Sample Programming Session . . . . . . . . . . . . . . . . . . . . . . . . . . . . . 248
B.5 Online Help . . . . . . . . . . . . . . . . . . . . . . . . . . . . . . . . . . . . . . . . . . . 251
Chapter 1
Introduction to Parallel Processing
Parallel machines provide a wonderful opportunity for applications with large computational requirements.
Effective use of these machines, though, requires a keen understanding of how they work. This chapter
provides an overview.
1.1
1.1.1
Overview: Why Use Parallel Systems?
Execution Speed
There is an ever-increasing appetite among some types of computer users for faster and faster machines.
This was epitomized in a statement by Steve Jobs, founder/CEO of Apple and Pixar. He noted that when he
was at Apple in the 1980s, he was always worried that some other company would come out with a faster
machine than his. But now at Pixar, whose graphics work requires extremely fast computers, he is always
hoping someone produces faster machines, so that he can use them!
A major source of speedup is the parallelizing of operations. Parallel operations can be either withinprocessor, such as with pipelining or having several ALUs within a processor, or between-processor, in
which many processor work on different parts of a problem in parallel. Our focus here is on betweenprocessor operations.
For example, the Registrar’s Office at UC Davis uses shared-memory multiprocessors for processing its
on-line registration work. Online registration involves an enormous amount of database computation. In
order to handle this computation reasonably quickly, the program partitions the work to be done, assigning
different portions of the database to different processors. The database field has contributed greatly to the
commercial success of large shared-memory machines.
As the Pixar example shows, highly computation-intensive applications like computer graphics also have a
1
2
CHAPTER 1. INTRODUCTION TO PARALLEL PROCESSING
need for these fast parallel computers. No one wants to wait hours just to generate a single image, and the
use of parallel processing machines can speed things up considerably. For example, consider ray tracing
operations. Here our code follows the path of a ray of light in a scene, accounting for reflection and absorbtion of the light by various objects. Suppose the image is to consist of 1,000 rows of pixels, with 1,000
pixels per row. In order to attack this problem in a parallel processing manner with, say, 25 processors, we
could divide the image into 25 squares of size 200x200, and have each processor do the computations for its
square.
Note, though, that it may be much more challenging than this implies. First of all, the computation will need
some communication between the processors, which hinders performance if it is not done carefully. Second,
if one really wants good speedup, one may need to take into account the fact that some squares require more
computation work than others. More on this below.
1.1.2
Memory
Yes, execution speed is the reason that comes to most people’s minds when the subject of parallel processing
comes up. But in many applications, an equally important consideration is memory capacity. Parallel
processing application often tend to use huge amounts of memory, and in many cases the amount of memory
needed is more than can fit on one machine. If we have many machines working together, especially in the
message-passing settings described below, we can accommodate the large memory needs.
1.2
Parallel Processing Hardware
This is not a hardware course, but since the goal of using parallel hardware is speed, the efficiency of our
code is a major issue. That in turn means that we need a good understanding of the underlying hardware
that we are programming. In this section, we give an overview of parallel hardware.
1.2.1
1.2.1.1
Shared-Memory Systems
Basic Architecture
Here many CPUs share the same physical memory. This kind of architecture is sometimes called MIMD,
standing for Multiple Instruction (different CPUs are working independently, and thus typically are executing different instructions at any given instant), Multiple Data (different CPUs are generally accessing
different memory locations at any given time).
Until recently, shared-memory systems cost hundreds of thousands of dollars and were affordable only by
large companies, such as in the insurance and banking industries. The high-end machines are indeed still
1.2. PARALLEL PROCESSING HARDWARE
3
quite expensive, but now dual-core machines, in which two CPUs share a common memory, are commonplace in the home.
1.2.1.2
Example: SMP Systems
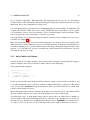
A Symmetric Multiprocessor (SMP) system has the following structure:
Here and below:
• The Ps are processors, e.g. off-the-shelf chips such as Pentiums.
• The Ms are memory modules. These are physically separate objects, e.g. separate boards of memory
chips. It is typical that there will be the same number of memory modules as processors. In the
shared-memory case, the memory modules collectively form the entire shared address space, but with
the addresses being assigned to the memory modules in one of two ways:
– (a)
High-order interleaving. Here consecutive addresses are in the same M (except at boundaries).
For example, suppose for simplicity that our memory consists of addresses 0 through 1023, and
that there are four Ms. Then M0 would contain addresses 0-255, M1 would have 256-511, M2
would have 512-767, and M3 would have 768-1023.
We need 10 bits for addresses (since 1024 = 210 ). The two most-significant bits would be used
to select the module number (since 4 = 22 ); hence the term high-order in the name of this
design. The remaining eight bits are used to select the word within a module.
– (b)
Low-order interleaving. Here consecutive addresses are in consecutive memory modules (except
when we get to the right end). In the example above, if we used low-order interleaving, then
address 0 would be in M0, 1 would be in M1, 2 would be in M2, 3 would be in M3, 4 would be
back in M0, 5 in M1, and so on.
Here the two least-significant bits are used to determine the module number.
• To make sure only one processor uses the bus at a time, standard bus arbitration signals and/or arbitration devices are used.
• There may also be coherent caches, which we will discuss later.
4
1.2.2
1.2.2.1
CHAPTER 1. INTRODUCTION TO PARALLEL PROCESSING
Message-Passing Systems
Basic Architecture
Here we have a number of independent CPUs, each with its own independent memory. The various processors communicate with each other via networks of some kind.
1.2.2.2
Example: Networks of Workstations (NOWs)
Large shared-memory multiprocessor systems are still very expensive. A major alternative today is networks
of workstations (NOWs). Here one purchases a set of commodity PCs and networks them for use as parallel
processing systems. The PCs are of course individual machines, capable of the usual uniprocessor (or
now multiprocessor) applications, but by networking them together and using parallel-processing software
environments, we can form very powerful parallel systems.
The networking does result in a significant loss of performance. This will be discussed in Chapter 5. But
even without these techniques, the price/performance ratio in NOW is much superior in many applications
to that of shared-memory hardware.
One factor which can be key to the success of a NOW is the use of a fast network, fast both in terms of
hardware and network protocol. Ordinary Ethernet and TCP/IP are fine for the applications envisioned by
the original designers of the Internet, e.g. e-mail and file transfer, but is slow in the NOW context. A good
network for a NOW is, for instance, Infiniband.
NOWs have become so popular that there are now “recipes” on how to build them for the specific purpose of parallel processing. The term Beowulf come to mean a cluster of PCs, usually with a fast network connecting them, used for parallel processing. Software packages such as ROCKS (http://www.
rocksclusters.org/wordpress/) have been developed to make it easy to set up and administer
such systems.
1.2.3
SIMD
In contrast to MIMD systems, processors in SIMD—Single Instruction, Multiple Data—systems execute in
lockstep. At any given time, all processors are executing the same machine instruction on different data.
Some famous SIMD systems in computer history include the ILLIAC and Thinking Machines Corporation’s
CM-1 and CM-2. Also, DSP (“digital signal processing”) chips tend to have an SIMD architecture.
But today the most prominent example of SIMD is that of GPUs—graphics processing units. In addition to
powering your PC’s video cards, GPUs can now be used for general-purpose computation. The architecture
is fundamentally shared-memory, but the individual processors do execute in lockstep, SIMD-fashion.
1.3. PROGRAMMER WORLD VIEWS
1.3
5
Programmer World Views
To explain the two paradigms, we will use the term nodes, where roughly speaking one node corresponds
to one processor, and use the following example:
Suppose we wish to multiply an nx1 vector X by an nxn matrix A, putting the product in an nx1
vector Y, and we have p processors to share the work.
1.3.1
1.3.1.1
Shared-Memory
Programmer View
In the shared-memory paradigm, the arrays for A, X and Y would be held in common by all nodes. If for
instance node 2 were to execute
Y[3] = 12;
and then node 15 were to subsequently execute
print("%d\n",Y[3]);
then the outputted value from the latter would be 12.
1.3.1.2
Example
Today, programming on shared-memory multiprocessors is typically done via threading. (Or, as we will see
in other chapters, by higher-level code that runs threads underneath.) A thread is similar to a process in an
operating system (OS), but with much less overhead. Threaded applications have become quite popular in
even uniprocessor systems, and Unix,1 Windows, Python, Java and Perl all support threaded programming.
In the typical implementation, a thread is a special case of an OS process. One important difference is that
the various threads of a program share memory. (One can arrange for processes to share memory too in
some OSs, but they don’t do so by default.)
On a uniprocessor system, the threads of a program take turns executing, so that there is only an illusion
of parallelism. But on a multiprocessor system, one can genuinely have threads running in parallel. Again,
though, they must still take turns with other processes running on the machine. Whenever a processor
1
Here and below, the term Unix includes Linux.
6
CHAPTER 1. INTRODUCTION TO PARALLEL PROCESSING
becomes available, the OS will assign some ready thread to it. So, among other things, this says that a
thread might actually run on different processors during different turns.
Important note: Effective use of threads requires a basic understanding of how processes take turns executing. See the chapter titled “Overview of Functions of an Operating System” in my computer systems
book, http://heather.cs.ucdavis.edu/˜matloff/50/PLN/CompSystsBook.pdf.
One of the most popular threads systems is Pthreads, whose name is short for POSIX threads. POSIX is a
Unix standard, and the Pthreads system was designed to standardize threads programming on Unix. It has
since been ported to other platforms.
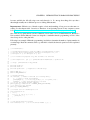
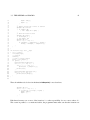
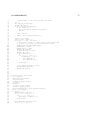
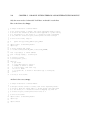
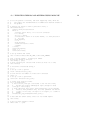
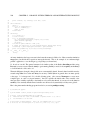
Following is an example of Pthreads programming, in which we determine the number of prime numbers in
a certain range. Read the comments at the top of the file for details; the threads operations will be explained
presently.
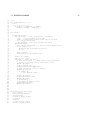
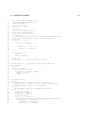
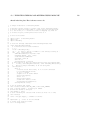
1
// PrimesThreads.c
2
3
4
5
// threads-based program to find the number of primes between 2 and n;
// uses the Sieve of Eratosthenes, deleting all multiples of 2, all
// multiples of 3, all multiples of 5, etc.
6
7
// for illustration purposes only; NOT claimed to be efficient
8
9
// Unix compilation:
gcc -g -o primesthreads PrimesThreads.c -lpthread -lm
10
11
// usage:
primesthreads n num_threads
12
13
14
15
#include <stdio.h>
#include <math.h>
#include <pthread.h>
// required for threads usage
16
17
18
#define MAX_N 100000000
#define MAX_THREADS 25
19
20
21
22
23
24
25
26
27
28
// shared variables
int nthreads, // number of threads (not counting main())
n, // range to check for primeness
prime[MAX_N+1], // in the end, prime[i] = 1 if i prime, else 0
nextbase; // next sieve multiplier to be used
// lock for the shared variable nextbase
pthread_mutex_t nextbaselock = PTHREAD_MUTEX_INITIALIZER;
// ID structs for the threads
pthread_t id[MAX_THREADS];
29
30
31
32
33
34
35
36
// "crosses out" all odd multiples of k
void crossout(int k)
{ int i;
for (i = 3; i*k <= n; i += 2) {
prime[i*k] = 0;
}
}
37
38
39
// each thread runs this routine
void *worker(int tn) // tn is the thread number (0,1,...)
1.3. PROGRAMMER WORLD VIEWS
40
{
41
42
43
44
45
46
47
48
49
50
51
52
53
54
55
56
57
58
59
60
61
int lim,base,
work = 0; // amount of work done by this thread
// no need to check multipliers bigger than sqrt(n)
lim = sqrt(n);
do {
// get next sieve multiplier, avoiding duplication across threads
// lock the lock
pthread_mutex_lock(&nextbaselock);
base = nextbase;
nextbase += 2;
// unlock
pthread_mutex_unlock(&nextbaselock);
if (base <= lim) {
// don’t bother crossing out if base known composite
if (prime[base]) {
crossout(base);
work++; // log work done by this thread
}
}
else return work;
} while (1);
}
62
63
64
65
66
67
68
69
70
71
72
73
74
75
76
77
78
79
80
81
main(int argc, char **argv)
{ int nprimes, // number of primes found
i,work;
n = atoi(argv[1]);
nthreads = atoi(argv[2]);
// mark all even numbers nonprime, and the rest "prime until
// shown otherwise"
for (i = 3; i <= n; i++) {
if (i%2 == 0) prime[i] = 0;
else prime[i] = 1;
}
nextbase = 3;
// get threads started
for (i = 0; i < nthreads; i++) {
// this call says create a thread, record its ID in the array
// id, and get the thread started executing the function worker(),
// passing the argument i to that function
pthread_create(&id[i],NULL,worker,i);
}
82
83
84
85
86
87
88
89
90
// wait for all done
for (i = 0; i < nthreads; i++) {
// this call says wait until thread number id[i] finishes
// execution, and to assign the return value of that thread to our
// local variable work here
pthread_join(id[i],&work);
printf("%d values of base done\n",work);
}
91
92
93
94
95
96
97
// report results
nprimes = 1;
for (i = 3; i <= n; i++)
if (prime[i]) {
nprimes++;
}
7
8
CHAPTER 1. INTRODUCTION TO PARALLEL PROCESSING
printf("the number of primes found was %d\n",nprimes);
98
99
100
}
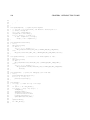
To make our discussion concrete, suppose we are running this program with two threads. Suppose also the
both threads are running simultaneously most of the time. This will occur if they aren’t competing for turns
with other big threads, say if there are no other big threads, or more generally if the number of other big
threads is less than or equal to the number of processors minus two. (Actually, the original thread is main(),
but it lies dormant most of the time, as you’ll see.)
Note the global variables:
int nthreads, // number of threads (not counting main())
n, // range to check for primeness
prime[MAX_N+1], // in the end, prime[i] = 1 if i prime, else 0
nextbase; // next sieve multiplier to be used
pthread_mutex_t nextbaselock = PTHREAD_MUTEX_INITIALIZER;
pthread_t id[MAX_THREADS];
This will require some adjustment for those who’ve been taught that global variables are “evil.” All
communication between threads is via global variables, so if they are evil, they are a necessary evil.
Personally I think the stern admonitions against global variables are overblown anyway. See http:
//heather.cs.ucdavis.edu/˜matloff/globals.html.
As mentioned earlier, the globals are shared by all processors.2 If one processor, for instance, assigns the
value 0 to prime[35] in the function crossout(), then that variable will have the value 0 when accessed
by any of the other processors as well. On the other hand, local variables have different values at each
processor; for instance, the variable i in that function has a different value at each processor.
Note that in the statement
pthread_mutex_t nextbaselock = PTHREAD_MUTEX_INITIALIZER;
the right-hand side is not a constant. It is a macro call, and is thus something which is executed.
In the code
pthread_mutex_lock(&nextbaselock);
base = nextbase
nextbase += 2
pthread_mutex_unlock(&nextbaselock);
2
Technically, we should say “shared by all threads” here, as a given thread does not always execute on the same processor, but
at any instant in time each executing thread is at some processor, so the statement is all right.
1.3. PROGRAMMER WORLD VIEWS
9
we see a critical section operation which is typical in shared-memory programming. In this context here, it
means that we cannot allow more than one thread to execute
base = nextbase;
nextbase += 2;
at the same time. The calls to pthread mutex lock() and pthread mutex unlock() ensure this. If thread A
is currently executing inside the critical section and thread B tries to lock the lock by calling pthread mutex lock(),
the call will block until thread B executes pthread mutex unlock().
Here is why this is so important: Say currently nextbase has the value 11. What we want to happen is that
the next thread to read nextbase will “cross out” all multiples of 11. But if we allow two threads to execute
the critical section at the same time, the following may occur:
• thread A reads nextbase, setting its value of base to 11
• thread B reads nextbase, setting its value of base to 11
• thread A adds 2 to nextbase, so that nextbase becomes 13
• thread B adds 2 to nextbase, so that nextbase becomes 15
Two problems would then occur:
• Both threads would do “crossing out” of multiples of 11, duplicating work and thus slowing down
execution speed.
• We will never “cross out” multiples of 13.
Thus the lock is crucial to the correct (and speedy) execution of the program.
Note that these problems could occur either on a uniprocessor or multiprocessor system. In the uniprocessor
case, thread A’s turn might end right after it reads nextbase, followed by a turn by B which executes that
same instruction. In the multiprocessor case, A and B could literally be running simultaneously, but still
with the action by B coming an instant after A.
This problem frequently arises in parallel database systems. For instance, consider an airline reservation
system. If a flight has only one seat left, we want to avoid giving it to two different customers who might be
talking to two agents at the same time. The lines of code in which the seat is finally assigned (the commit
phase, in database terminology) is then a critical section.
A critical section is always a potential bottlement in a parallel program, because its code is serial instead
of parallel. In our program here, we may get better performance by having each thread work on, say, five
values of nextbase at a time. Our line
10
CHAPTER 1. INTRODUCTION TO PARALLEL PROCESSING
nextbase += 2;
would become
nextbase += 10;
That would mean that any given thread would need to go through the critical section only one-fifth as often,
thus greatly reducing overhead. On the other hand, near the end of the run, this may result in some threads
being idle while other threads still have a lot of work to do.
Note this code.
for (i = 0; i < nthreads; i++) {
pthread_join(id[i],&work);
printf("%d values of base done\n",work);
}
This is a special case of of barrier.
A barrier is a point in the code that all threads must reach before continuing. In this case, a barrier is needed
in order to prevent premature execution of the later code
for (i = 3; i <= n; i++)
if (prime[i]) {
nprimes++;
}
which would result in possibly wrong output if we start counting primes before some threads are done.
The pthread join() function actually causes the given thread to exit, so that we then “join” the thread that
created it, i.e. main(). Thus some may argue that this is not really a true barrier.
Barriers are very common in shared-memory programming, and will be discussed in more detail in Chapter
2.
1.3.1.3
Role of the OS
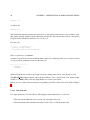
Let’s again ponder the role of the OS here. What happens when a thread tries to lock a lock:
• The lock call will ultimately cause a system call, causing the OS to run.
• The OS maintains the locked/unlocked status of each lock, so it will check that status.
1.3. PROGRAMMER WORLD VIEWS
11
• Say the lock is unlocked (a 0), the OS sets it to locked (a 1), and the lock call returns. The thread
enters the critical section.
• When the thread is done, the unlock call unlocks the lock, similar to the locking actions.
• If the lock is locked at the time a thread makes a lock call, the call will block. The OS will mark this
thread as waiting for the lock. When whatever thread currently using the critical section unlocks the
lock, the OS will relock it and unblock the lock call of the waiting thread.
Note that main() is a thread too, the original thread that spawns the others. However, it is dormant most of
the time, due to its calls to pthread join().
Finally, keep in mind that although the globals variables are shared, the locals are not. Recall that local
variables are stored on a stack. Each thread (just like each process in general) has its own stack. When a
thread begins a turn, the OS prepares for this by pointing the stack pointer register to this thread’s stack.
1.3.1.4
Debugging Threads Programs
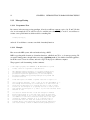
Most debugging tools include facilities for threads. Here’s an overview of how it works in GDB.
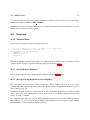
First, as you run a program under GDB, the creation of new threads will be announced, e.g.
(gdb) r 100 2
Starting program:
[New Thread 16384
[New Thread 32769
[New Thread 16386
[New Thread 32771
/debug/primes 100 2
(LWP 28653)]
(LWP 28676)]
(LWP 28677)]
(LWP 28678)]
You can do backtrace (bt) etc. as usual. Here are some threads-related commands:
• info threads (gives information on all current threads)
• thread 3 (change to thread 3)
• break 88 thread 3 (stop execution when thread 3 reaches source line 88)
• break 88 thread 3 if x==y (stop execution when thread 3 reaches source line 88 and the
variables x and y are equal)
Of course, many GUI IDEs use GDB internally, and thus provide the above facilities with a GUI wrapper.
Examples are DDD, Eclipse and NetBeans.
12
CHAPTER 1. INTRODUCTION TO PARALLEL PROCESSING
1.3.2
1.3.2.1
Message Passing
Programmer View
By contrast, in the message-passing paradigm, all nodes would have separate copies of A, X and Y. In this
case, in our example above, in order for node 2 to send this new value of Y[3] to node 15, it would have to
execute some special function, which would be something like
send(15,12,"Y[3]");
and node 15 would have to execute some kind of receive() function.
1.3.2.2
Example
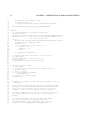
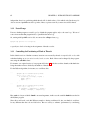
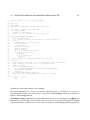
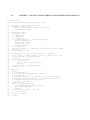
Here we use the MPI system, with our hardware being a NOW.
MPI is a popular public-domain set of interface functions, callable from C/C++, to do message passing. We
are again counting primes, though in this case using a pipelining method. It is similar to hardware pipelines,
but in this case it is done in software, and each “stage” in the pipe is a different computer.
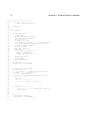
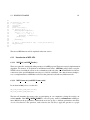
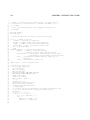
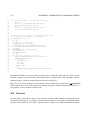
The program is self-documenting, via the comments.
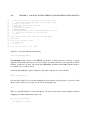
1
2
/* MPI sample program; NOT INTENDED TO BE EFFICIENT as a prime
finder, either in algorithm or implementation
3
4
5
6
7
8
MPI (Message Passing Interface) is a popular package using
the "message passing" paradigm for communicating between
processors in parallel applications; as the name implies,
processors communicate by passing messages using "send" and
"receive" functions
9
10
finds and reports the number of primes less than or equal to N
11
12
13
14
15
16
17
uses a pipeline approach: node 0 looks at all the odd numbers (i.e.
has already done filtering out of multiples of 2) and filters out
those that are multiples of 3, passing the rest to node 1; node 1
filters out the multiples of 5, passing the rest to node 2; node 2
then removes the multiples of 7, and so on; the last node must check
whatever is left
18
19
20
21
22
23
24
25
26
note that we should NOT have a node run through all numbers
before passing them on to the next node, since we would then
have no parallelism at all; on the other hand, passing on just
one number at a time isn’t efficient either, due to the high
overhead of sending a message if it is a network (tens of
microseconds until the first bit reaches the wire, due to
software delay); thus efficiency would be greatly improved if
each node saved up a chunk of numbers before passing them to
1.3. PROGRAMMER WORLD VIEWS
27
the next node */
28
29
#include <mpi.h>
// mandatory
30
31
32
#define PIPE_MSG 0 // type of message containing a number to be checked
#define END_MSG 1 // type of message indicating no more data will be coming
33
34
35
36
37
int NNodes, // number of nodes in computation
N, // find all primes from 2 to N
Me; // my node number
double T1,T2; // start and finish times
38
39
40
41
42
43
44
45
46
47
48
49
50
51
52
53
54
55
56
57
58
void Init(int Argc,char **Argv)
{ int DebugWait;
N = atoi(Argv[1]);
// start debugging section
DebugWait = atoi(Argv[2]);
while (DebugWait) ; // deliberate infinite loop; see below
/* the above loop is here to synchronize all nodes for debugging;
if DebugWait is specified as 1 on the mpirun command line, all
nodes wait here until the debugging programmer starts GDB at
all nodes (via attaching to OS process number), then sets
some breakpoints, then GDB sets DebugWait to 0 to proceed; */
// end debugging section
MPI_Init(&Argc,&Argv); // mandatory to begin any MPI program
// puts the number of nodes in NNodes
MPI_Comm_size(MPI_COMM_WORLD,&NNodes);
// puts the node number of this node in Me
MPI_Comm_rank(MPI_COMM_WORLD,&Me);
// OK, get started; first record current time in T1
if (Me == NNodes-1) T1 = MPI_Wtime();
}
59
60
61
62
63
64
65
66
67
68
69
70
71
72
73
void Node0()
{ int I,ToCheck,Dummy,Error;
for (I = 1; I <= N/2; I++) {
ToCheck = 2 * I + 1; // latest number to check for div3
if (ToCheck > N) break;
if (ToCheck % 3 > 0) // not divis by 3, so send it down the pipe
// send the string at ToCheck, consisting of 1 MPI integer, to
// node 1 among MPI_COMM_WORLD, with a message type PIPE_MSG
Error = MPI_Send(&ToCheck,1,MPI_INT,1,PIPE_MSG,MPI_COMM_WORLD);
// error not checked in this code
}
// sentinel
MPI_Send(&Dummy,1,MPI_INT,1,END_MSG,MPI_COMM_WORLD);
}
74
75
76
77
78
79
80
81
82
83
84
void NodeBetween()
{ int ToCheck,Dummy,Divisor;
MPI_Status Status;
// first received item gives us our prime divisor
// receive into Divisor 1 MPI integer from node Me-1, of any message
// type, and put information about the message in Status
MPI_Recv(&Divisor,1,MPI_INT,Me-1,MPI_ANY_TAG,MPI_COMM_WORLD,&Status);
while (1) {
MPI_Recv(&ToCheck,1,MPI_INT,Me-1,MPI_ANY_TAG,MPI_COMM_WORLD,&Status);
// if the message type was END_MSG, end loop
13
14
if (Status.MPI_TAG == END_MSG) break;
if (ToCheck % Divisor > 0)
MPI_Send(&ToCheck,1,MPI_INT,Me+1,PIPE_MSG,MPI_COMM_WORLD);
85
86
87
}
MPI_Send(&Dummy,1,MPI_INT,Me+1,END_MSG,MPI_COMM_WORLD);
88
89
90
CHAPTER 1. INTRODUCTION TO PARALLEL PROCESSING
}
91
92
93
94
95
96
97
98
99
100
101
102
103
104
105
106
107
108
109
110
111
112
113
114
NodeEnd()
{ int ToCheck,PrimeCount,I,IsComposite,StartDivisor;
MPI_Status Status;
MPI_Recv(&StartDivisor,1,MPI_INT,Me-1,MPI_ANY_TAG,MPI_COMM_WORLD,&Status);
PrimeCount = Me + 2; /* must account for the previous primes, which
won’t be detected below */
while (1) {
MPI_Recv(&ToCheck,1,MPI_INT,Me-1,MPI_ANY_TAG,MPI_COMM_WORLD,&Status);
if (Status.MPI_TAG == END_MSG) break;
IsComposite = 0;
for (I = StartDivisor; I*I <= ToCheck; I += 2)
if (ToCheck % I == 0) {
IsComposite = 1;
break;
}
if (!IsComposite) PrimeCount++;
}
/* check the time again, and subtract to find run time */
T2 = MPI_Wtime();
printf("elapsed time = %f\n",(float)(T2-T1));
/* print results */
printf("number of primes = %d\n",PrimeCount);
}
115
116
117
118
119
120
121
122
123
124
125
int main(int argc,char **argv)
{ Init(argc,argv);
// all nodes run this same program, but different nodes take
// different actions
if (Me == 0) Node0();
else if (Me == NNodes-1) NodeEnd();
else NodeBetween();
// mandatory for all MPI programs
MPI_Finalize();
}
126
127
128
/* explanation of "number of items" and "status" arguments at the end
of MPI_Recv():
129
130
131
132
133
when receiving a message you must anticipate the longest possible
message, but the actual received message may be much shorter than
this; you can call the MPI_Get_count() function on the status
argument to find out how many items were actually received
134
135
136
137
the status argument will be a pointer to a struct, containing the
node number, message type and error status of the received
message
138
139
140
141
142
say our last parameter is Status; then Status.MPI_SOURCE
will contain the number of the sending node, and
Status.MPI_TAG will contain the message type; these are
important if used MPI_ANY_SOURCE or MPI_ANY_TAG in our
1.4. RELATIVE MERITS: SHARED-MEMORY VS. MESSAGE-PASSING
143
144
15
node or tag fields but still have to know who sent the
message or what kind it is */
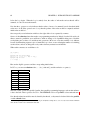
The set of machines can be heterogeneous, but MPI “translates” for you automatically. If say one node has
a big-endian CPU and another has a little-endian CPU, MPI will do the proper conversion.
1.4
Relative Merits: Shared-Memory Vs. Message-Passing
It is generally believed in the parallel processing community that the shared-memory paradigm produces
code that is easier to write, debug and maintain than message-passing.
On the other hand, in some cases message-passing can produce faster code. Consider the Odd/Even Transposition Sort algorithm, for instance. Here pairs of processes repeatedly swap sorted arrays with each other.
In a shared-memory setting, this might produce a bottleneck at the shared memory, slowing down the code.
Of course, the obvious solution is that if you are using a shared-memory machine, you should just choose
some other sorting algorithm, one tailored to the shared-memory setting.
There used to be a belief that message-passing was more scalable, i.e. amenable to very large systems.
However, GPU has demonstrated that one can achieve extremely good scalability with shared-memory.
My own preference, obviously, is shared-memory.
1.5
Issues in Parallelizing Applications
The available parallel hardware systems sound wonderful at first. But many people have had the experience
of enthusiastically writing their first parallel program, anticipating great speedups, only to find that their
parallel code actually runs more slowly than their original nonparallel program. In this section, we highlight
some major issues that will pop up throughout the book.
1.5.1
Communication Bottlenecks
Whether you are on a shared-memory, message-passing or other platform, communication is always a potential bottleneck. On a shared-memory system, the threads must contend with each other for memory access,
and memory access itself can be slow, e.g. due to cache coherency transactions. On a NOW, even a very fast
network is very slow compared to CPU speeds.
16
CHAPTER 1. INTRODUCTION TO PARALLEL PROCESSING
1.5.2
Load Balancing
Another major issue is load balancing, i.e. keeping all the processors busy as much as possible.
A nice, easily understandable example is shown in Chapter 7 of the book, Multicore Application Programming: for Windows, Linux and Oracle Solaris, Darryl Gove, 2011, Addison-Wesley. There the author shows
code to compute the Mandelbrot set.3 He has a rectangular grid of points in the plane, and wants to determine whether each point is in the set or not; a simple but time-consuming computation is used for this
determination.4
Gove sets up two threads, one handling all the points in the left half of the grid and the other handling the
right half. He finds that the latter thread is very often idle, while the former thread is usually busy—severe
load imbalance. We’ll return to this issue in Section 1.5.4.
1.5.3
“Embarrassingly Parallel” Applications
The term embarrassingly parallel is heard often in talk about parallel programming.
Consider a matrix multiplication application, for instance, in which we compute AX for a matrix A and a
vector X. One way to parallelize this problem would be for have each processor handle a group of rows of
A, multiplying each by X in parallel with the other processors, which are handling other groups of rows. We
call the problem embarrassingly parallel, with the word “embarrassing” meaning that the problems are so
easy to parallelize that there is no intellectual challenge involved. It is pretty obvious that the computation
Y = AX can be parallelized very easily by splitting the rows of A into groups.
By contrast, most parallel sorting algorithms require a great deal of interaction. For instance, consider
Mergesort. It breaks the vector to be sorted into two (or more) independent parts, say the left half and right
half, which are then sorted in parallel by two processes. So far, this is embarrassingly parallel, at least after
the vector is broken in half. But then the two sorted halves must be merged to produce the sorted version
of the original vector, and that process is not embarrassingly parallel; it can be parallelized, but in a more
complex manner.
Of course, it’s no shame to have an embarrassingly parallel problem! On the contrary, except for showoff
academics, having an embarrassingly parallel application is a cause for celebration, as it is easy to program.
In recent years, the term embarrassingly parallel has drifted to a somewhat different meaning. Algorithms
that are embarrassingly parallel in the above sense of simplicity tend to have very low communication
between processes, key to good performance. That latter trait is the center of attention nowadays, so the
term embarrassingly parallel generally refers to an algorithm with low communication needs, even if the
3
See the Wikipedia entry.
You can download Gove’s code from http://blogs.sun.com/d/resource/map_src.tar.bz2. Most relevant is
listing7.64.c.
4
1.5. ISSUES IN PARALLELIZING APPLICATIONS
17
parallelization itself may not be trivial.
For that reason, even our prime finder example above, is NOT considered embarrassingly parallel. Yes, it
was embarrassingly easy to write, but it has high communication costs, as both its locks and its global array
are accessed quite often.
On the other hand, the Mandelbrot computation described in Section 1.5.2 is truly embarrassingly parallel,
in both the old and new sense of the term. There the author Gove just assigned the points on the left to one
thread and the rest to the other thread—very simple—and there was no communication between them.
1.5.4
Tradeoffs Between Optimizing Communication and Load Balance
Ideally we would like to minimize communication and maximize load balance. However, these two goals
are often at odds with each other. In this section, you’ll see why that’s the case, and why—perhaps
surprisingly—it’s typically actually better to highly favor minimizing communication at the (seeming) expense of load balance.
Consider the simple problem mentioned in the last section, of multiplying a vector X by a large matrix A,
yielding a vector Y. Say A has 10000 rows and we have 10 threads. How do we apportion the work to the
threads? There are several possibilities here:
• Method A: We could simply pre-assign thread 0 to work on rows 0-999 of A, thread 1 to work on
rows 1000-1999 and so on. There would be no communication between the threads. On the other
hand, there could be a problem of load imbalance. Say for instance that by chance thread 3 finishes
well before the others. Then it will be idle, as all the work had been pre-allocated.
• Method B: We could divide the 10000 rows into 100 chunks of 100 rows each (or 1000 chunks
of 10 rows, etc.). OpenMP, for instance, allows one to specify this via its schedule clause, with
argument static.5 We could number the chunks from 0 to 99, and have a shared variable named
nextchunk similar to nextbase in our prime-finding program in Section 1.3.1.2. Each time a thread
would finish a chunk, it would obtain a new chunk to work on, by recording the value of nextchunk
and incrementing that variable by 1 (all atomically, of course). This approach would have better load
balance, because the first thread to find there is no work left to do would be idle for at most 100 rows’
amount of computation time, rather than 1000 as above. Meanwhile, though, communication would
increase, as the locks around nextchunk would sometimes make one thread wait for another.6
• Method C: So, the first approach above minimizes communication at the possible expense of load
balance, while the second does the opposite. OpenMP offers a method they call guided that is a
5
See Section 3.3.3.
Why are we calling it “communication” here? Recall that in shared-memory programming, the threads communicate through
shared variables. When one thread increments nextchunk, it “communicates” that new value to the other threads by placing it in
shared memory where they will see it.
6
18
CHAPTER 1. INTRODUCTION TO PARALLEL PROCESSING
compromise between the above to approaches.7 The idea is to make the chunk size dynamically set,
large during the beginning of the computation so as to minimize communication but smaller near the
end, to deal with the load balance issue.
I will now show that in typical settings, the Method A above (or a slight modification) is the best. To
this end, consider a chunk consisting of m tasks, such as m rows in our matrix example above, with times
T1 , T2 , ..., Tm . The total time needed to process the chunk is then T1 + ..., Tm .
The Ti can be considered random variables; some tasks take a long time to perform, some take a short
time, and so on. As an idealized model, let’s treat them as independent and identically distributed random
variables. Under that assumption (if you don’t have the probability background, take this on faith), we have
E(T1 + ..., Tm ) = mE(T1 )
and
V ar(T1 + ..., Tm ) = mV ar(T1 )
Thus
standard deviation of chunk time
∼ O
mean of chunk time
1
√
m
In other words:
• run time for a chunk is essentially constant if k is large, and
• there is essentially no load imbalance in Method A
Since load imbalance was the only drawback to Method A and we now see it’s not a problem after all, then
Method A is best.
But what about the assumptions behind that reasoning? Consider for example the Mandelbrot problem in
Section 1.5.2. There were two threads, thus two chunks, with the tasks for a given chunk being computations
for all the points in the chunk’s assigned region of the picture.
Gove noted there was fairly strong load imbalance here, and that the reason was that most of the Mandelbrot
points turned out to be in the left half of the picture! The computation for a given point is iterative, and if a
7
For an overview of the research work done in this area, see Susan Hummel, Edith Schonberg and Lawrence Flynn, Factoring:
a Method for Scheduling Parallel Loops, Communications of the ACM, Aug. 1992.
1.5. ISSUES IN PARALLELIZING APPLICATIONS
19
point is not in the set, it tends to take only a few iterations to discover this. That’s why the thread handling
the right half of the picture was idle so often.
So Method A would not work well here, and upon reflection one can see that the problem was that the tasks
within a chunk were not independent, but were instead highly correlated, thus violating our mathematical
assumptions above. Of course, before doing the computation, Gove didn’t know that it would turn out that
most of the set would be in the left half of the picture. But, one could certainly anticipate the correlated
nature of the points; if one point is not in the Mandelbrot set, its near neighbors are probably not in it either.
But Method A can still be made to work well, via a simple modification: Simply form the chunks randomly.
In the matrix-multiply example above, with 10000 rows and chunk size 1000, do NOT assign the chunks
contiguously. Instead, choose a random 1000 numbers (without replacement) from 0,1,...,9999, and use
those as the row numbers for chunk 0/thread 0, then choose 1000 more random numbers from 0,1,...,9999
for chunk 1/thread 1, and so on.
In the Mandelbrot example, we could randomly assign rows of the picture, in the same way, and avoid load
imbalance.
So, actually, Method A, or let’s say Method A’, will typically work well.
20
CHAPTER 1. INTRODUCTION TO PARALLEL PROCESSING
Chapter 2
Shared Memory Parallelism
Shared-memory programming is considered by many in the parallel processing community as being the
clearest of the various parallel paradigms available.
2.1
What Is Shared?
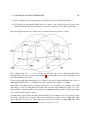
The term shared memory means that the processors all share a common address space. Say this is occurring
at the hardware level, and we are using Intel Pentium CPUs. Suppose processor P3 issues the instruction
movl 200, %eabx
which reads memory location 200 and places the result in the EAX register in the CPU. If processor P4 does
the same, they both will be referring to the same physical memory cell. In non-shared-memory machines,
each processor has its own private memory, and each one will then have its own location 200, completely
independent of the locations 200 at the other processors’ memories.
Say a program contains a global variable X and a local variable Y on share-memory hardware (and we
use shared-memory software). If for example the compiler assigns location 200 to the variable X, i.e.
&X = 200, then the point is that all of the processors will have that variable in common, because any
processor which issues a memory operation on location 200 will access the same physical memory cell.
On the other hand, each processor will have its own separate run-time stack. All of the stacks are in shared
memory, but they will be accessed separately, since each CPU has a different value in its SP (Stack Pointer)
register. Thus each processor will have its own independent copy of the local variable Y.
To make the meaning of “shared memory” more concrete, suppose we have a bus-based system, with all
the processors and memory attached to the bus. Let us compare the above variables X and Y here. Suppose
21
22
CHAPTER 2. SHARED MEMORY PARALLELISM
again that the compiler assigns X to memory location 200. Then in the machine language code for the
program, every reference to X will be there as 200. Every time an instruction that writes to X is executed by
a CPU, that CPU will put 200 into its Memory Address Register (MAR), from which the 200 flows out on
the address lines in the bus, and goes to memory. This will happen in the same way no matter which CPU
it is. Thus the same physical memory location will end up being accessed, no matter which CPU generated
the reference.
By contrast, say the compiler assigns a local variable Y to something like ESP+8, the third item on the stack
(on a 32-bit machine), 8 bytes past the word pointed to by the stack pointer, ESP. The OS will assign a
different ESP value to each thread, so the stacks of the various threads will be separate. Each CPU has its
own ESP register, containing the location of the stack for whatever thread that CPU is currently running.
So, the value of Y will be different for each thread.
2.2
Memory Modules
Parallel execution of a program requires, to a large extent, parallel accessing of memory. To some degree
this is handled by having a cache at each CPU, but it is also facilitated by dividing the memory into separate
modules or banks. This way several memory accesses can be done simultaneously.
In this section, assume for simplicity that our machine has 32-bit words. This is still true for many GPUs,
in spite of the widespread use of 64-bit general-purpose machines today, and in any case, the numbers here
can easily be converted to the 64-bit case.
Note that this means that consecutive words differ in address by 4. Let’s thus define the word-address of
a word to be its ordinary address divided by 4. Note that this is also its address with the lowest two bits
deleted.
2.2.1
Interleaving
There is a question of how to divide up the memory into banks. There are two main ways to do this:
(a) High-order interleaving: Here consecutive words are in the same bank (except at boundaries). For
example, suppose for simplicity that our memory consists of word-addresses 0 through 1023, and that
there are four banks, M0 through M3. Then M0 would contain word-addresses 0-255, M1 would have
256-511, M2 would have 512-767, and M3 would have 768-1023.
(b) Low-order interleaving: Here consecutive addresses are in consecutive banks (except when we get
to the right end). In the example above, if we used low-order interleaving, then word-address 0 would
be in M0, 1 would be in M1, 2 would be in M2, 3 would be in M3, 4 would be back in M0, 5 in M1,
and so on.
2.2. MEMORY MODULES
23
Say we will have eight banks. Then under high-order interleaving, the first two bits of a word-address
would be taken to be the bank number, with the remaining bits being address within bank. Under low-order
interleaving, the two least significant bits would be used.
Low-order interleaving has often been used for vector processors. On such a machine, we might have both
a regular add instruction, ADD, and a vector version, VADD. The latter would add two vectors together,
so it would need to read two vectors from memory. If low-order interleaving is used, the elements of these
vectors are spread across the various banks, so fast access is possible.
A more modern use of low-order interleaving, but with the same motivation as with the vector processors,
is in GPUs. See Chapter 4.
High-order interleaving might work well in matrix applications, for instance, where we can partition the
matrix into blocks, and have different processors work on different blocks. In image processing applications,
we can have different processors work on different parts of the image. Such partitioning almost never works
perfectly—e.g. computation for one part of an image may need information from another part—but if we
are careful we can get good results.
2.2.2
Bank Conflicts and Solutions
Consider an array x of 16 million elements, whose sum we wish to compute, say using 16 threads. Suppose,
again for simplicity, that we have four memory banks, with low-order interleaving.
A naive implementation might be
1
2
3
4
5
parallel for thr = 0 to 15
localsum = 0
for j = 0 to 999999
localsum += x[thr*1000000+j]
grandsum += localsumsum
In other words, thread 0 would sum the first million elements, thread 1 would sum the second million, and
so on. After summing its portion of the array, a thread would then add its sum to a grand total. (The threads
could of course add to grandsum directly in each iteration of the loop, but this would cause too much traffic
to memory, thus causing slowdowns.)
Suppose the threads run in lockstep, so that they all attempt to access memory at once. On a multicore/multiprocessor machine, this may not occur, but it in fact typically will occur in a GPU setting.
A problem then occurs. To make matters simple, suppose that x starts at an address that is a multiple of
4, thus in bank 0. (The reader should think about how to adjust this to the other three cases.) On the very
first memory access, thread 0 accesses x[0] in bank 0, thread 1 accesses x[1000000], also in bank 0, and so
on—and these will all be in memory bank 0! Thus there will be major conflicts, hence major slowdown.
24
CHAPTER 2. SHARED MEMORY PARALLELISM
A better approach might be to have any given thread work on every fourth element of x, instead of on
contiguous elements:
1
2
3
4
5
parallel for thr = 0 to 15
localsum = 0
for j = 0 to 999999
localsum += x[16*j+thr]
grandsum += localsumsum
Here, consecutive threads work on consecutive elements in x.1 That puts them in separate banks, thus no
conflicts, hence speedy performance.
In general, avoiding bank conflicts is an art, but there are a couple of approaches we can try.
• We can rewrite our algorithm, e.g. use the second version of the above code instead of the first.
• We can add padding to the array. For instance in the first version of our code above, we could lengthen
the array from 16 million to 16000016, placing padding in words 1000000, 2000001 and so on. We’d
tweak our array indices accordingly, and eliminate bank conflicts that way.
In the first approach above, the concept of stride often arises. It is defined to be the number of array elements
apart in consecutive accesses by a thread. In the above code to computer grandsum (without padding), the
stride is 1, since each array element accessed by a thread is 1 past the last one.
Strides of greater than 1 typically arise in code that deals with multidimensional arrays. Say for example we
have two-dimensional array with 16 columns. In C/C++, which uses row-major order, access of an entire
column will have a stride of 16. Access down the main diagonal will have a stride of 17.
Suppose we have b banks, again with low-order interleaving. You should experiment a bit to see that an
array access with a stride of s will access s different banks if and only if s and b are relatively prime, i.e. the
greatest common divisor of s and b is 1. This can be proven with group theory.
2.3
2.3.1
Interconnection Topologies
SMP Systems
A Symmetric Multiprocessor (SMP) system has the following structure:
1
Here thread 0 is considered “consecutive” to thread 15, in a wraparound manner.
2.3. INTERCONNECTION TOPOLOGIES
25
Here and below:
• The Ps are processors, e.g. off-the-shelf chips such as Pentiums.
• The Ms are memory modules. These are physically separate objects, e.g. separate boards of memory
chips. It is typical that there will be the same number of Ms as Ps.
• To make sure only one P uses the bus at a time, standard bus arbitration signals and/or arbitration
devices are used.
• There may also be coherent caches, which we will discuss later.
2.3.2
NUMA Systems
In a Nonuniform Memory Access (NUMA) architecture, each CPU has a memory module physically next
to it, and these processor/memory (P/M) pairs are connected by some kind of network.
Here is a simple version:
Each P/M/R set here is called a processing element (PE). Note that each PE has its own local bus, and is
also connected to the global bus via R, the router.
Suppose for example that P3 needs to access location 200, and suppose that high-order interleaving is used.
If location 200 is in M3, then P3’s request is satisfied by the local bus.2 On the other hand, suppose location
200 is in M8. Then the R3 will notice this, and put the request on the global bus, where it will be seen by
2
This sounds similar to the concept of a cache. However, it is very different. A cache contains a local copy of some data stored
elsewhere. Here it is the data itself, not a copy, which is being stored locally.
26
CHAPTER 2. SHARED MEMORY PARALLELISM
R8, which will then copy the request to the local bus at PE8, where the request will be satisfied. (E.g. if it
was a read request, then the response will go back from M8 to R8 to the global bus to R3 to P3.)
It should be obvious now where NUMA gets its name. P8 will have much faster access to M8 than P3 will
to M8, if none of the buses is currently in use—and if say the global bus is currently in use, P3 will have to
wait a long time to get what it wants from M8.
Today almost all high-end MIMD systems are NUMAs. One of the attractive features of NUMA is that by
good programming we can exploit the nonuniformity. In matrix problems, for example, we can write our
program so that, for example, P8 usually works on those rows of the matrix which are stored in M8, P3
usually works on those rows of the matrix which are stored in M3, etc. In order to do this, we need to make
use of the C language’s & address operator, and have some knowledge of the memory hardware structure,
i.e. the interleaving.
2.3.3
NUMA Interconnect Topologies
The problem with a bus connection, of course, is that there is only one pathway for communication, and thus
only one processor can access memory at the same time. If one has more than, say, two dozen processors are
on the bus, the bus becomes saturated, even if traffic-reducing methods such as adding caches are used. Thus
multipathway topologies are used for all but the smallest systems. In this section we look at two alternatives
to a bus topology.
2.3.3.1
Crossbar Interconnects
Consider a shared-memory system with n processors and n memory modules. Then a crossbar connection
would provide n2 pathways. E.g. for n = 8:
2.3. INTERCONNECTION TOPOLOGIES
27
Generally serial communication is used from node to node, with a packet containing information on both
source and destination address. E.g. if P2 wants to read from M5, the source and destination will be 3-bit
strings in the packet, coded as 010 and 101, respectively. The packet will also contain bits which specify
which word within the module we wish to access, and bits which specify whether we wish to do a read or a
write. In the latter case, additional bits are used to specify the value to be written.
Each diamond-shaped node has two inputs (bottom and right) and two outputs (left and top), with buffers
at the two inputs. If a buffer fills, there are two design options: (a) Have the node from which the input
comes block at that output. (b) Have the node from which the input comes discard the packet, and retry
later, possibly outputting some other packet for now. If the packets at the heads of the two buffers both need
to go out the same output, the one (say) from the bottom input will be given priority.
There could also be a return network of the same type, with this one being memory → processor, to return
28
CHAPTER 2. SHARED MEMORY PARALLELISM
the result of the read requests.3
Another version of this is also possible. It is not shown here, but the difference would be that at the bottom
edge we would have the PEi and at the left edge the memory modules Mi would be replaced by lines which
wrap back around to PEi, similar to the Omega network shown below.
Crossbar switches are too expensive for large-scale systems, but are useful in some small systems. The
16-CPU Sun Microsystems Enterprise 10000 system includes a 16x16 crossbar.
2.3.3.2
Omega (or Delta) Interconnects
These are multistage networks similar to crossbars, but with fewer paths. Here is an example of a NUMA
8x8 system:
Recall that each PE is a processor/memory pair. PE3, for instance, consists of P3 and M3.
Note the fact that at the third stage of the network (top of picture), the outputs are routed back to the PEs,
each of which consists of a processor and a memory module.4
At each network node (the nodes are the three rows of rectangles), the output routing is done by destination
bit. Let’s number the stages here 0, 1 and 2, starting from the bottom stage, number the nodes within a stage
0, 1, 2 and 3 from left to right, number the PEs from 0 to 7, left to right, and number the bit positions in a
destination address 0, 1 and 2, starting from the most significant bit. Then at stage i, bit i of the destination
address is used to determine routing, with a 0 meaning routing out the left output, and 1 meaning the right
one.
Say P2 wishes to read from M5. It sends a read-request packet, including 5 = 101 as its destination address,
to the switch in stage 0, node 1. Since the first bit of 101 is 1, that means that this switch will route the
packet out its right-hand output, sending it to the switch in stage 1, node 3. The latter switch will look at the
next bit in 101, a 0, and thus route the packet out its left output, to the switch in stage 2, node 2. Finally, that
switch will look at the last bit, a 1, and output out its right-hand output, sending it to PE5, as desired. M5
will process the read request, and send a packet back to PE2, along the same
Again, if two packets at a node want to go out the same output, one must get priority (let’s say it is the one
3
For safety’s sake, i.e. fault tolerance, even writes are typically acknowledged in multiprocessor systems.
The picture may be cut off somewhat at the top and left edges. The upper-right output of the rectangle in the top row, leftmost
position should connect to the dashed line which leads down to the second PE from the left. Similarly, the upper-left output of that
same rectangle is a dashed lined, possibly invisible in your picture, leading down to the leftmost PE.
4
2.3. INTERCONNECTION TOPOLOGIES
29
from the left input).
Here is how the more general case of N = 2n PEs works. Again number the rows of switches, and switches
within a row, as above. So, Sij will denote the switch in the i-th row from the bottom and j-th column from
the left (starting our numbering with 0 in both cases). Row i will have a total of N input ports Iik and N
output ports Oik , where k = 0 corresponds to the leftmost of the N in each case. Then if row i is not the last
row (i < n − 1), Oik will be connected to Ijm , where j = i+1 and
m = (2k + b(2k)/N c) mod N
(2.1)
If row i is the last row, then Oik will be connected to, PE k.
2.3.4
Comparative Analysis
In the world of parallel architectures, a key criterion for a proposed feature is scalability, meaning how well
the feature performs as we go to larger and larger systems. Let n be the system size, either the number of
processors and memory modules, or the number of PEs. Then we are interested in how fast the latency,
bandwidth and cost grow with n:
criterion
latency
bandwidth
cost
bus
O(1)
O(1)
O(1)
Omega
O(log2 n)
O(n)
O(n log2 n)
crossbar
O(n)
O(n)
O(n2 )
Let us see where these expressions come from, beginning with a bus: No matter how large n is, the time to
get from, say, a processor to a memory module will be the same, thus O(1). Similarly, no matter how large
n is, only one communication can occur at a time, thus again O(1).5
Again, we are interested only in “O( )” measures, because we are only interested in growth rates as the
system size n grows. For instance, if the system size doubles, the cost of a crossbar will quadruple; the
O(n2 ) cost measure tells us this, with any multiplicative constant being irrelevant.
For Omega networks, it is clear that log2 n network rows are needed, hence the latency value given. Also,
each row will have n/2 switches, so the number of network nodes will be O(n log2 n). This figure then gives
the cost (in terms of switches, the main expense here). It also gives the bandwidth, since the maximum
number of simultaneous transmissions will occur when all switches are sending at once.
Similar considerations hold for the crossbar case.
5
Note that the ‘1’ in “O(1)” does not refer to the fact that only one communication can occur at a time. If we had, for example,
a two-bus system, the bandwidth would still be O(1), since multiplicative constants do not matter. What O(1) means, again, is that
as n grows, the bandwidth stays at a multiple of 1, i.e. stays constant.
30
CHAPTER 2. SHARED MEMORY PARALLELISM
The crossbar’s big advantage is that it is guaranteed that n packets can be sent simultaneously, providing
they are to distinct destinations.
That is not true for Omega-networks. If for example, PE0 wants to send to PE3, and at the same time PE4
wishes to sent to PE2, the two packets will clash at the leftmost node of stage 1, where the packet from PE0
will get priority.
On the other hand, a crossbar is very expensive, and thus is dismissed out of hand in most modern systems. Note, though, that an equally troublesom aspect of crossbars is their high latency value; this is a big
drawback when the system is not heavily loaded.
The bottom line is that Omega-networks amount to a compromise between buses and crossbars, and for this
reason have become popular.
2.3.5
Why Have Memory in Modules?
In the shared-memory case, the Ms collectively form the entire shared address space, but with the addresses
being assigned to the Ms in one of two ways:
• (a)
High-order interleaving. Here consecutive addresses are in the same M (except at boundaries). For
example, suppose for simplicity that our memory consists of addresses 0 through 1023, and that there
are four Ms. Then M0 would contain addresses 0-255, M1 would have 256-511, M2 would have
512-767, and M3 would have 768-1023.
• (b)
Low-order interleaving. Here consecutive addresses are in consecutive M’s (except when we get to
the right end). In the example above, if we used low-order interleaving, then address 0 would be in
M0, 1 would be in M1, 2 would be in M2, 3 would be in M3, 4 would be back in M0, 5 in M1, and so
on.
The idea is to have several modules busy at once, say in conjunction with a split-transaction bus. Here,
after a processor makes a memory request, it relinquishes the bus, allowing others to use it while the memory
does the requested work. Without splitting the memory into modules, this wouldn’t achieve parallelism. The
bus does need extra lines to identify which processor made the request.
2.4. TEST-AND-SET TYPE INSTRUCTIONS
2.4
31
Test-and-Set Type Instructions
Consider a bus-based system. In addition to whatever memory read and memory write instructions the
processor included, there would also be a TAS instruction.6 This instruction would control a TAS pin on the
processor chip, and the pin in turn would be connected to a TAS line on the bus.
Applied to a location L in memory and a register R, say, TAS does the following:
copy L to R
if R is 0 then write 1 to L
And most importantly, these operations are done in an atomic manner; no bus transactions by other processors may occur between the two steps.
The TAS operation is applied to variables used as locks. Let’s say that 1 means locked and 0 unlocked. Then
the guarding of a critical section C by a lock variable L would be done by having the following code in the
program being run:
TRY:
C:
TAS R,L
JNZ TRY
...
; start of critical section
...
...
; end of critical section
MOV L,0 ; unlock
where of course JNZ is a jump-if-nonzero instruction, and we are assuming that the copying from the
Memory Data Register to R results in the processor N and Z flags (condition codes) being affected.
On Pentium machines, the LOCK prefix can be used to get atomicity for certain instructions.7 For example,
lock add $2, x
would add the constant 2 to the memory location labeled x in an atomic manner.
The LOCK prefix locks the bus for the entire duration of the instruction. Note that the ADD instruction
here involves two memory transactions—one to read the old value of x, and the second the write the new,
incremented value back to x. So, we are locking for a rather long time, but the benefits can be huge.
A good example of this kind of thing would be our program PrimesThreads.c in Chapter 1, where our
critical section consists of adding 2 to nextbase. There we surrounded the add-2 code by Pthreads lock
6
This discussion is for a mythical machine, but any real system works in this manner.
The instructions ADD, ADC, AND, BTC, BTR, BTS, CMPXCHG, DEC, INC, NEG, NOT, OR, SBB, SUB, XOR, XADD.
Also, XCHG asserts the LOCK# bus signal even if the LOCK prefix is specified. Locking only applies to these instructions in
forms in which there is an operand in memory.
7
32
CHAPTER 2. SHARED MEMORY PARALLELISM
and unlock operations. These involve system calls, which are very time consuming, involving hundreds
of machine instructions. Compare that to the one-instruction solution above! The very heavy overhead of
pthreads would be thus avoided.
In crossbar or Ω-network systems, some 2-bit field in the packet must be devoted to transaction type, say 00
for Read, 01 for Write and 10 for TAS. In a sytem with 16 CPUs and 16 memory modules, say, the packet
might consist of 4 bits for the CPU number, 4 bits for the memory module number, 2 bits for the transaction
type, and 32 bits for the data (for a write, this is the data to be written, while for a read, it would be the
requested value, on the trip back from the memory to the CPU).
But note that the atomicity here is best done at the memory, i.e. some hardware should be added at the
memory so that TAS can be done; otherwise, an entire processor-to-memory path (e.g. the bus in a busbased system) would have to be locked up for a fairly long time, obstructing even the packets which go to
other memory modules.
There are many variations of test-and-set, so don’t expect that all processors will have an instruction with
this name, but they all will have some kind of synchronization instruction like it.
Note carefully that in many settings it may not be crucial to get the most up-to-date value of a variable.
For example, a program may have a data structure showing work to be done. Some processors occasionally
add work to the queue, and others take work from the queue. Suppose the queue is currently empty, and
a processor adds a task to the queue, just as another processor is checking the queue for work. As will be
seen later, it is possible that even though the first processor has written to the queue, the new value won’t be
visible to other processors for some time. But the point is that if the second processor does not see work in
the queue (even though the first processor has put it there), the program will still work correctly, albeit with
some performance loss.
2.5
2.5.1
Cache Issues
Cache Coherency
Consider, for example, a bus-based system. Relying purely on TAS for interprocessor synchronization
would be unthinkable: As each processor contending for a lock variable spins in the loop shown above, it is
adding tremendously to bus traffic.
An answer is to have caches at each processor.8 These will to store copies of the values of lock variables.
(Of course, non-lock variables are stored too. However, the discussion here will focus on effects on lock
variables.) The point is this: Why keep looking at a lock variable L again and again, using up the bus
bandwidth? L may not change value for a while, so why not keep a copy in the cache, avoiding use of the
8
The reader may wish to review the basics of caches.
˜matloff/50/PLN/CompOrganization.pdf.
See for example http://heather.cs.ucdavis.edu/
2.5. CACHE ISSUES
33
bus?
The answer of course is that eventually L will change value, and this causes some delicate problems. Say for
example that processor P5 wishes to enter a critical section guarded by L, and that processor P2 is already
in there. During the time P2 is in the critical section, P5 will spin around, always getting the same value for
L (1) from C5, P5’s cache. When P2 leaves the critical section, P2 will set L to 0—and now C5’s copy of L
will be incorrect. This is the cache coherency problem, inconsistency between caches.
A number of solutions have been devised for this problem. For bus-based systems, snoopy protocols of
various kinds are used, with the word “snoopy” referring to the fact that all the caches monitor (“snoop on”)
the bus, watching for transactions made by other caches.
The most common protocols are the invalidate and update types. This relation between these two is somewhat analogous to the relation between write-back and write-through protocols for caches in uniprocessor
systems:
• Under an invalidate protocol, when a processor writes to a variable in a cache, it first (i.e. before
actually doing the write) tells each other cache to mark as invalid its cache line (if any) which contains
a copy of the variable.9 Those caches will be updated only later, the next time their processors need
to access this cache line.
• For an update protocol, the processor which writes to the variable tells all other caches to immediately
update their cache lines containing copies of that variable with the new value.
Let’s look at an outline of how one implementation (many variations exist) of an invalidate protocol would
operate:
In the scenario outlined above, when P2 leaves the critical section, it will write the new value 0 to L. Under
the invalidate protocol, P2 will post an invalidation message on the bus. All the other caches will notice, as
they have been monitoring the bus. They then mark their cached copies of the line containing L as invalid.
Now, the next time P5 executes the TAS instruction—which will be very soon, since it is in the loop shown
above—P5 will find that the copy of L in C5 is invalid. It will respond to this cache miss by going to the
bus, and requesting P2 to supply the “real” (and valid) copy of the line containing L.
But there’s more. Suppose that all this time P6 had also been executing the loop shown above, along with
P5. Then P5 and P6 may have to contend with each other. Say P6 manages to grab possession of the bus
first.10 P6 then executes the TAS again, which finds L = 0 and changes L back to 1. P6 then relinquishes the
bus, and enters the critical section. Note that in changing L to 1, P6 also sends an invalidate signal to all the
9
We will follow commonly-used terminology here, distinguishing between a cache line and a memory block. Memory is divided
in blocks, some of which have copies in the cache. The cells in the cache are called cache lines. So, at any given time, a given
cache line is either empty or contains a copy (valid or not) of some memory block.
10
Again, remember that ordinary bus arbitration methods would be used.
34
CHAPTER 2. SHARED MEMORY PARALLELISM
other caches. So, when P5 tries its execution of the TAS again, it will have to ask P6 to send a valid copy
of the block. P6 does so, but L will be 1, so P5 must resume executing the loop. P5 will then continue to
use its valid local copy of L each time it does the TAS, until P6 leaves the critical section, writes 0 to L, and
causes another cache miss at P5, etc.
At first the update approach seems obviously superior, and actually, if our shared, cacheable11 variables
were only lock variables, this might be true.
But consider a shared, cacheable vector. Suppose the vector fits into one block, and that we write to each
vector element sequentially. Under an update policy, we would have to send a new message on the bus/network for each component, while under an invalidate policy, only one message (for the first component)
would be needed. If during this time the other processors do not need to access this vector, all those update
messages, and the bus/network bandwidth they use, would be wasted.
Or suppose for example we have code like
Sum += X[I];
in the middle of a for loop. Under an update protocol, we would have to write the value of Sum back many
times, even though the other processors may only be interested in the final value when the loop ends. (This
would be true, for instance, if the code above were part of a critical section.)
Thus the invalidate protocol works well for some kinds of code, while update works better for others. The
CPU designers must try to anticipate which protocol will work well across a broad mix of applications.12
Now, how is cache coherency handled in non-bus shared-memory systems, say crossbars? Here the problem
is more complex. Think back to the bus case for a minute: The very feature which was the biggest negative
feature of bus systems—the fact that there was only one path between components made bandwidth very
limited—is a very positive feature in terms of cache coherency, because it makes broadcast very easy: Since
everyone is attached to that single pathway, sending a message to all of them costs no more than sending it
to just one—we get the others for free. That’s no longer the case for multipath systems. In such systems,
extra copies of the message must be created for each path, adding to overall traffic.
A solution is to send messages only to “interested parties.” In directory-based protocols, a list is kept of
all caches which currently have valid copies of all blocks. In one common implementation, for example,
while P2 is in the critical section above, it would be the owner of the block containing L. (Whoever is the
latest node to write to L would be considered its current owner.) It would maintain a directory of all caches
having valid copies of that block, say C5 and C6 in our story here. As soon as P2 wrote to L, it would then
send either invalidate or update packets (depending on which type was being used) to C5 and C6 (and not to
other caches which didn’t have valid copies).
11
12
Many modern processors, including Pentium and MIPS, allow the programmer to mark some blocks as being noncacheable.
Some protocols change between the two modes dynamically.
2.5. CACHE ISSUES
35
There would also be a directory at the memory, listing the current owners of all blocks. Say for example P0
now wishes to “join the club,” i.e. tries to access L, but does not have a copy of that block in its cache C0.
C0 will thus not be listed in the directory for this block. So, now when it tries to access L and it will get a
cache miss. P0 must now consult the home of L, say P14. The home might be determined by L’s location
in main memory according to high-order interleaving; it is the place where the main-memory version of L
resides. A table at P14 will inform P0 that P2 is the current owner of that block. P0 will then send a message
to P2 to add C0 to the list of caches having valid copies of that block. Similarly, a cache might “resign” from
the club, due to that cache line being replaced, e.g. in a LRU setting, when some other cache miss occurs.
2.5.2
Example: the MESI Cache Coherency Protocol
Many types of cache coherency protocols have been proposed and used, some of them quite complex. A
relatively simple one for snoopy bus systems which is widely used is MESI, which for example is the
protocol used in the Pentium series.
MESI is an invalidate protocol for bus-based systems. Its name stands for the four states a given cache line
can be in for a given CPU:
• Modified
• Exclusive
• Shared
• Invalid
Note that each memory block has such a state at each cache. For instance, block 88 may be in state S at P5’s
and P12’s caches but in state I at P1’s cache.
Here is a summary of the meanings of the states:
state
M
E
S
I
meaning
written to more than once; no other copy valid
valid; no other cache copy valid; memory copy valid
valid; at least one other cache copy valid
invalid (block either not in the cache or present but incorrect)
Following is a summary of MESI state changes.13 When reading it, keep in mind again that there is a
separate state for each cache/memory block combination.
13
See Pentium Processor System Architecture, by D. Anderson and T. Shanley, Addison-Wesley, 1995. We have simplified the
presentation here, by eliminating certain programmable options.
36
CHAPTER 2. SHARED MEMORY PARALLELISM
In addition to the terms read hit, read miss, write hit, write miss, which you are already familiar with,
there are also read snoop and write snoop. These refer to the case in which our CPU observes on the bus
a block request by another CPU that has attempted a read or write action but encountered a miss in its own
cache; if our cache has a valid copy of that block, we must provide it to the requesting CPU (and in some
cases to memory).
So, here are various events and their corresponding state changes:
If our CPU does a read:
present state
M
E
S
I
I
event
read hit
read hit
read hit
read miss; no valid cache copy at any other CPU
read miss; at least one valid cache copy in some other CPU
new state
M
E
S
E
S
If our CPU does a memory write:
present state
M
E
S
I
event
write hit; do not put invalidate signal on bus; do not update memory
same as M above
write hit; put invalidate signal on bus; update memory
write miss; update memory but do nothing else
new state
M
M
E
I
If our CPU does a read or write snoop:
present state
M
M
E
E
S
S
I
event
read snoop; write line back to memory, picked up by other CPU
write snoop; write line back to memory, signal other CPU now OK to do its write
read snoop; put shared signal on bus; no memory action
write snoop; no memory action
read snoop
write snoop
any snoop
newstate
S
I
S
I
S
I
I
Note that a write miss does NOT result in the associated block being brought in from memory.
Example: Suppose a given memory block has state M at processor A but has state I at processor B, and B
attempts to write to the block. B will see that its copy of the block is invalid, so it notifies the other CPUs
via the bus that it intends to do this write. CPU A sees this announcement, tells B to wait, writes its own
copy of the block back to memory, and then tells B to go ahead with its write. The latter action means that
A’s copy of the block is not correct anymore, so the block now has state I at A. B’s action does not cause
2.6. MEMORY-ACCESS CONSISTENCY POLICIES
37
loading of that block from memory to its cache, so the block still has state I at B.
2.5.3
The Problem of “False Sharing”
Consider the C declaration
int W,Z;
Since W and Z are declared adjacently, most compilers will assign them contiguous memory addresses.
Thus, unless one of them is at a memory block boundary, when they are cached they will be stored in the
same cache line. Suppose the program writes to Z, and our system uses an invalidate protocol. Then W will
be considered invalid at the other processors, even though its values at those processors’ caches are correct.
This is the false sharing problem, alluding to the fact that the two variables are sharing a cache line even
though they are not related.
This can have very adverse impacts on performance. If for instance our variable W is now written to, then
Z will suffer unfairly, as its copy in the cache will be considered invalid even though it is perfectly valid.
This can lead to a “ping-pong” effect, in which alternate writing to two variables leads to a cyclic pattern of
coherency transactions.
One possible solution is to add padding, e.g. declaring W and Z like this:
int Q,U[1000],Z;
to separate Q and Z so that they won’t be in the same cache block. Of course, we must take block size
into account, and check whether the compiler really has placed the two variables are in widely separated
locations. To do this, we could for instance run the code
printf("%x %x\n,&Q,&Z);
2.6
Memory-Access Consistency Policies
Though the word consistency in the title of this section may seem to simply be a synonym for coherency
from the last section, and though there actually is some relation, the issues here are quite different. In this
case, it is a timing issue: After one processor changes the value of a shared variable, when will that value be
visible to the other processors?
There are various reasons why this is an issue. For example, many processors, especially in multiprocessor
systems, have write buffers, which save up writes for some time before actually sending them to memory.
38
CHAPTER 2. SHARED MEMORY PARALLELISM
(For the time being, let’s suppose there are no caches.) The goal is to reduce memory access costs. Sending
data to memory in groups is generally faster than sending one at a time, as the overhead of, for instance,
acquiring the bus is amortized over many accesses. Reads following a write may proceed, without waiting
for the write to get to memory, except for reads to the same address. So in a multiprocessor system in which
the processors use write buffers, there will often be some delay before a write actually shows up in memory.
A related issue is that operations may occur, or appear to occur, out of order. As noted above, a read which
follows a write in the program may execute before the write is sent to memory. Also, in a multiprocessor
system with multiple paths between processors and memory modules, two writes might take different paths,
one longer than the other, and arrive “out of order.” In order to simplify the presentation here, we will focus
on the case in which the problem is due to write buffers, though.
The designer of a multiprocessor system must adopt some consistency model regarding situations like this.
The above discussion shows that the programmer must be made aware of the model, or risk getting incorrect
results. Note also that different consistency models will give different levels of performance. The “weaker”
consistency models make for faster machines but require the programmer to do more work.
The strongest consistency model is Sequential Consistency. It essentially requires that memory operations
done by one processor are observed by the other processors to occur in the same order as executed on the
first processor. Enforcement of this requirement makes a system slow, and it has been replaced on most
systems by weaker models.
One such model is release consistency. Here the processors’ instruction sets include instructions ACQUIRE
and RELEASE. Execution of an ACQUIRE instruction at one processor involves telling all other processors
to flush their write buffers. However, the ACQUIRE won’t execute until pending RELEASEs are done.
Execution of a RELEASE basically means that you are saying, ”I’m done writing for the moment, and
wish to allow other processors to see what I’ve written.” An ACQUIRE waits for all pending RELEASEs to
complete before it executes.14
A related model is scope consistency. Say a variable, say Sum, is written to within a critical section guarded
by LOCK and UNLOCK instructions. Then under scope consistency any changes made by one processor
to Sum within this critical section would then be visible to another processor when the latter next enters this
critical section. The point is that memory update is postponed until it is actually needed. Also, a barrier
operation (again, executed at the hardware level) forces all pending memory writes to complete.
All modern processors include instructions which implement consistency operations. For example, Sun
Microsystems’ SPARC has a MEMBAR instruction. If used with a STORE operand, then all pending writes
at this processor will be sent to memory. If used with the LOAD operand, all writes will be made visible to
this processor.
Now, how does cache coherency fit into all this? There are many different setups, but for example let’s
consider a design in which there is a write buffer between each processor and its cache. As the processor
14
There are many variants of all of this, especially in the software distibuted shared memory realm, to be discussed later.
2.7. FETCH-AND-ADD AND PACKET-COMBINING OPERATIONS
39
does more and more writes, the processor saves them up in the write buffer. Eventually, some programmerinduced event, e.g. a MEMBAR instruction,15 will cause the buffer to be flushed. Then the writes will be
sent to “memory”—actually meaning that they go to the cache, and then possibly to memory.
The point is that (in this type of setup) before that flush of the write buffer occurs, the cache coherency
system is quite unaware of these writes. Thus the cache coherency operations, e.g. the various actions in the
MESI protocol, won’t occur until the flush happens.
To make this notion concrete, again consider the example with Sum above, and assume release or scope consistency. The CPU currently executing that code (say CPU 5) writes to Sum, which is a memory operation—
it affects the cache and thus eventually the main memory—but that operation will be invisible to the cache
coherency protocol for now, as it will only be reflected in this processor’s write buffer. But when the unlock
is finally done (or a barrier is reached), the write buffer is flushed and the writes are sent to this CPU’s
cache. That then triggers the cache coherency operation (depending on the state). The point is that the cache
coherency operation would occur only now, not before.
What about reads? Suppose another processor, say CPU 8, does a read of Sum, and that page is marked
invalid at that processor. A cache coherency operation will then occur. Again, it will depend on the type of
coherency policy and the current state, but in typical systems this would result in Sum’s cache block being
shipped to CPU 8 from whichever processor the cache coherency system thinks has a valid copy of the
block. That processor may or may not be CPU 5, but even if it is, that block won’t show the recent change
made by CPU 5 to Sum.
The analysis above assumed that there is a write buffer between each processor and its cache. There would
be a similar analysis if there were a write buffer between each cache and memory.
Note once again the performance issues. Instructions such as ACQUIRE or MEMBAR will use a substantial
amount of interprocessor communication bandwidth. A consistency model must be chosen carefully by
the system designer, and the programmer must keep the communication costs in mind in developing the
software.
The recent Pentium models use Sequential Consistency, with any write done by a processor being immediately sent to its cache as well.
2.7
Fetch-and-Add and Packet-Combining Operations
Another form of interprocessor synchronization is a fetch-and-add (FA) instruction. The idea of FA is as
follows. For the sake of simplicity, consider code like
15
We call this “programmer-induced,” since the programmer will include some special operation in her C/C++ code which will
be translated to MEMBAR.
40
CHAPTER 2. SHARED MEMORY PARALLELISM
LOCK(K);
Y = X++;
UNLOCK(K);
Suppose our architecture’s instruction set included an F&A instruction. It would add 1 to the specified
location in memory, and return the old value (to Y) that had been in that location before being incremented.
And all this would be an atomic operation.
We would then replace the code above by a library call, say,
FETCH_AND_ADD(X,1);
The C code above would compile to, say,
F&A X,R,1
where R is the register into which the old (pre-incrementing) value of X would be returned.
There would be hardware adders placed at each memory module. That means that the whole operation could
be done in one round trip to memory. Without F&A, we would need two round trips to memory just for the
X++;
(we would load X into a register in the CPU, increment the register, and then write it back to X in memory),
and then the LOCK() and UNLOCK() would need trips to memory too. This could be a huge time savings,
especially for long-latency interconnects.
In addition to read and write operations being specifiable in a network packet, an F&A operation could be
specified as well (a 2-bit field in the packet would code which operation was desired). Again, there would
be adders included at the memory modules, i.e. the addition would be done at the memory end, not at the
processors. When the F&A packet arrived at a memory module, our variable X would have 1 added to it,
while the old value would be sent back in the return packet (and put into R).
Another possibility for speedup occurs if our system uses a multistage interconnection network such as a
crossbar. In that situation, we can design some intelligence into the network nodes to do packet combining:
Say more than one CPU is executing an F&A operation at about the same time for the same variable X.
Then more than one of the corresponding packets may arrive at the same network node at about the same
time. If each one requested an incrementing of X by 1, the node can replace the two packets by one, with
an increment of 2. Of course, this is a delicate operation, and we must make sure that different CPUs get
different return values, etc.
2.8. MULTICORE CHIPS
2.8
41
Multicore Chips
A recent trend has been to put several CPUs on one chip, termed a multicore chip. As of March 2008, dualcore chips are common in personal computers, and quad-core machines are within reach of the budgets of
many people. Just as the invention of the integrated circuit revolutionized the computer industry by making
computers affordable for the average person, multicore chips will undoubtedly revolutionize the world of
parallel programming.
A typical dual-core setup might have the two CPUs sharing a common L2 cache, with each CPU having its
own L3 cache. The chip may interface to the bus or interconnect network of via an L1 cache.
Multicore is extremely important these days. However, they are just SMPs, for the most part, and thus
should not be treated differently.
2.9
2.9.0.1
Illusion of Shared-Memory through Software
Software Distributed Shared Memory
There are also various shared-memory software packages that run on message-passing hardware such as
NOWs, called software distributed shared memory (SDSM) systems. Since the platforms do not have
any physically shared memory, the shared-memory view which the programmer has is just an illusion. But
that illusion is very useful, since the shared-memory paradigm is believed to be the easier one to program
in. Thus SDSM allows us to have “the best of both worlds”—the convenience of the shared-memory world
view with the inexpensive cost of some of the message-passing hardware systems, particularly networks of
workstations (NOWs).
SDSM itself is divided into two main approaches, the page-based and object-based varieties. The pagebased approach is generally considered clearer and easier to program in, and provides the programmer the
“look and feel” of shared-memory programming better than does the object-based type.16 We will discuss
only the page-based approach here. The most popular SDSM system today is the page-based Treadmarks
(Rice University). Another excellent page-based system is JIAJIA (Academy of Sciences, China).
To illustrate how page-paged SDSMs work, consider the line of JIAJIA code
Prime = (int *) jia_alloc(N*sizeof(int));
The function jia alloc() is part of the JIAJIA library, libjia.a, which is linked to one’s application program
during compilation.
16
The term object-based is not related to the term object-oriented programming.
42
CHAPTER 2. SHARED MEMORY PARALLELISM
At first this looks a little like a call to the standard malloc() function, setting up an array Prime of size
N. In fact, it does indeed allocate some memory. Note that each node in our JIAJIA group is executing
this statement, so each node allocates some memory at that node. Behind the scenes, not visible to the
programmer, each node will then have its own copy of Prime.
However, JIAJIA sets things up so that when one node later accesses this memory, for instance in the
statement
Prime[I] = 1;
this action will eventually trigger a network transaction (not visible to the programmer) to the other JIAJIA
nodes.17 This transaction will then update the copies of Prime at the other nodes.18
How is all of this accomplished? It turns out that it relies on a clever usage of the nodes’ virtual memory
(VM) systems. To understand this, let’s review how VM systems work.
Suppose a variable X has the virtual address 1200, i.e. &X = 1200. The actual physical address may be,
say, 5000. When the CPU executes a machine instruction that specifies access to 1200, the CPU will do a
lookup on the page table, and find that the true location is 5000, and then access 5000. On the other hand,
X may not be resident in memory at all, in which case the page table will say so. If the CPU finds that X is
nonresident, it will cause an internal interrupt, which in turn will cause a jump to the operating system (OS).
The OS will then read X in from disk,19 place it somewhere in memory, and then update the page table to
show that X is now someplace in memory. The OS will then execute a return from interrupt instruction,20 ,
and the CPU will restart the instruction which triggered the page fault.
Here is how this is exploited to develop SDSMs on Unix systems. The SDSM will call a system function
such as mprotect(). This allows the SDSM to deliberately mark a page as nonresident (even if the page is
resident). Basically, anytime the SDSM knows that a node’s local copy of a variable is invalid, it will mark
the page containing that variable as nonresident. Then, the next time the program at this node tries to access
that variable, a page fault will occur.
As mentioned in the review above, normally a page fault causes a jump to the OS. However, technically any
page fault in Unix is handled as a signal, specifically SIGSEGV. Recall that Unix allows the programmer to
write his/her own signal handler for any signal type. In this case, that means that the programmer—meaning
the people who developed JIAJIA or any other page-based SDSM—writes his/her own page fault handler,
which will do the necessary network transactions to obtain the latest valid value for X.
Note that although SDSMs are able to create an illusion of almost all aspects of shared memory, it really is
not possible to create the illusion of shared pointer variables. For example on shared memory hardware we
might have a variable like P:
17
There are a number of important issues involved with this word eventually, as we will see later.
The update may not occur immediately. More on this later.
19
Actually, it will read the entire page containing X from disk, but to simplify language we will just say X here.
20
E.g. iret on Pentium chips.
18
2.9. ILLUSION OF SHARED-MEMORY THROUGH SOFTWARE
43
int Y,*P;
...
...
P = &Y;
...
There is no simple way to have a variable like P in an SDSM. This is because a pointer is an address, and
each node in an SDSM has its own memory separate address space. The problem is that even though the
underlying SDSM system will keep the various copies of Y at the different nodes consistent with each other,
Y will be at a potentially different address on each node.
All SDSM systems must deal with a software analog of the cache coherency problem. Whenever one node
modifies the value of a shared variable, that node must notify the other nodes that a change has been made.
The designer of the system must choose between update or invalidate protocols, just as in the hardware
case.21 Recall that in non-bus-based shared-memory multiprocessors, one needs to maintain a directory
which indicates at which processor a valid copy of a shared variable exists. Again, SDSMs must take an
approach similar to this.
Similarly, each SDSM system must decide between sequential consistency, release consistency etc. More
on this later.
Note that in the NOW context the internode communication at the SDSM level is typically done by TCP/IP
network actions. Treadmarks uses UDP, which is faster than TCP. but still part of the slow TCP/IP protocol
suite. TCP/IP was simply not designed for this kind of work. Accordingly, there have been many efforts
to use more efficient network hardware and software. The most popular of these is the Virtual Interface
Architecture (VIA).
Not only are coherency actions more expensive in the NOW SDSM case than in the shared-memory hardware case due to network slowness, there is also expense due to granularity. In the hardware case we are
dealing with cache blocks, with a typical size being 512 bytes. In the SDSM case, we are dealing with pages,
with a typical size being 4096 bytes. The overhead for a cache coherency transaction can thus be large.
2.9.0.2
Case Study: JIAJIA
Programmer Interface
We will not go into detail on JIAJIA programming here. There is a short tutorial on JIAJIA at http:
//heather.cs.ucdavis.edu/˜matloff/jiajia.html, but here is an overview:
• One writes in C/C++ (or FORTRAN), making calls to the JIAJIA library, which is linked in upon
21
Note, though, that we are not actually dealing with a cache here. Each node in the SDSM system will have a cache, of course,
but a node’s cache simply stores parts of that node’s set of pages. The coherency across nodes is across pages, not caches. We must
insure that a change made to a given page is eventually propropagated to pages on other nodes which correspond to this one.
44
CHAPTER 2. SHARED MEMORY PARALLELISM
compilation.
• The library calls include standard shared-memory operations for lock, unlock, barrier, processor number, etc., plus some calls aimed at improving performance.
Following is a JIAJIA example program, performing Odd/Even Transposition Sort. This is a variant on
Bubble Sort, sometimes useful in parallel processing contexts.22 The algorithm consists of n phases, in
which each processor alternates between trading with its left and right neighbors.
1
// JIAJIA example program:
Odd-Even Tranposition Sort
2
3
4
5
// array is of size n, and we use n processors; this would be more
// efficient in a "chunked" versions, of course (and more suited for a
// message-passing context anyway)
6
7
8
9
#include <stdio.h>
#include <stdlib.h>
#include <jia.h> // required include; also must link via -ljia
10
11
12
// pointer to shared variable
int *x; // array to be sorted
13
14
15
int n, // range to check for primeness
debug; // 1 for debugging, 0 else
16
17
18
19
20
21
// if first arg is bigger, then replace it by the second
void cpsmaller(int *p1,int *p2)
{ int tmp;
if (*p1 > *p2) *p1 = *p2;
}
22
23
24
25
26
27
// if first arg is smaller, then replace it by the second
void cpbigger(int *p1,int *p2)
{ int tmp;
if (*p1 < *p2) *p1 = *p2;
}
28
29
30
31
32
33
34
35
36
37
38
39
40
41
42
43
// does sort of m-element array y
void oddeven(int *y, int m)
{ int i,left=jiapid-1,right=jiapid+1,newval;
for (i=0; i < m; i++) {
if ((i+jiapid)%2 == 0) {
if (right < m)
if (y[jiapid] > y[right]) newval = y[right];
}
else {
if (left >= 0)
if (y[jiapid] < y[left]) newval = y[left];
}
jia_barrier();
if ((i+jiapid)%2 == 0 && right < m || (i+jiapid)%2 == 1 && left >= 0)
y[jiapid] = newval;
22
Though, as mentioned in the comments, it is aimed more at message-passing contexts.
2.9. ILLUSION OF SHARED-MEMORY THROUGH SOFTWARE
jia_barrier();
44
}
45
46
}
47
48
49
50
51
52
53
54
55
56
57
58
59
60
61
62
63
64
65
66
67
68
69
70
71
72
73
74
75
76
77
78
79
80
81
main(int argc, char **argv)
{ int i,mywait=0;
jia_init(argc,argv); // required init call
// get command-line arguments (shifted for nodes > 0)
if (jiapid == 0) {
n = atoi(argv[1]);
debug = atoi(argv[2]);
}
else {
n = atoi(argv[2]);
debug = atoi(argv[3]);
}
jia_barrier();
// create a shared array x of length n
x = (int *) jia_alloc(n*sizeof(int));
// barrier recommended after allocation
jia_barrier();
// node 0 gets simple test array from command-line
if (jiapid == 0) {
for (i = 0; i < n; i++)
x[i] = atoi(argv[i+3]);
}
jia_barrier();
if (debug && jiapid == 0)
while (mywait == 0) { ; }
jia_barrier();
oddeven(x,n);
if (jiapid == 0) {
printf("\nfinal array\n");
for (i = 0; i < n; i++)
printf("%d\n",x[i]);
}
jia_exit();
}
System Workings
JIAJIA’s main characteristics as an SDSM are:
• page-based
• scope consistency
• home-based
• multiple writers
Let’s take a look at these.
45
46
CHAPTER 2. SHARED MEMORY PARALLELISM
As mentioned earlier, one first calls jia alloc() to set up one’s shared variables. Note that this will occur at
each node, so there are multiple copies of each variable; the JIAJIA system ensures that these copies are
consistent with each other, though of course subject to the laxity afforded by scope consistency.
Recall that under scope consistency, a change made to a shared variable at one processor is guaranteed to
be made visible to another processor if the first processor made the change between lock/unlock operations
and the second processor accesses that variable between lock/unlock operations on that same lock.23
Each page—and thus each shared variable—has a home processor. If another processor writes to a page,
then later when it reaches the unlock operation it must send all changes it made to the page back to the
home node. In other words, the second processor calls jia unlock(), which sends the changes to its sister
invocation of jia unlock() at the home processor.24 Say later a third processor calls jia lock() on that same
lock, and then attempts to read a variable in that page. A page fault will occur at that processor, resulting in
the JIAJIA system running, which will then obtain that page from the first processor.
Note that all this means the JIAJIA system at each processor must maintain a page table, listing where each
home page resides.25 At each processor, each page has one of three states: Invalid, Read-Only, Read-Write.
State changes, though, are reported when lock/unlock operations occur. For example, if CPU 5 writes to a
given page which had been in Read-Write state at CPU 8, the latter will not hear about CPU 5’s action until
some CPU does a lock. This CPU need not be CPI 8. When one CPU does a lock, it must coordinate with
all other nodes, at which time state-change messages will be piggybacked onto lock-coordination messages.
Note also that JIAJIA allows the programmer to specify which node should serve as the home of a variable,
via one of several forms of the jia alloc() call. The programmer can then tailor his/her code accordingly.
For example, in a matrix problem, the programmer may arrange for certain rows to be stored at a given node,
and then write the code so that most writes to those rows are done by that processor.
The general principle here is that writes performed at one node can be made visible at other nodes on a
“need to know” basis. If for instance in the above example with CPUs 5 and 8, CPU 2 does not access this
page, it would be wasteful to send the writes to CPU 2, or for that matter to even inform CPU 2 that the page
had been written to. This is basically the idea of all non-Sequential consistency protocols, even though they
differ in approach and in performance for a given application.
JIAJIA allows multiple writers of a page. Suppose CPU 4 and CPU 15 are simultaneously writing to a
particular page, and the programmer has relied on a subsequent barrier to make those writes visible to other
23
Writes will also be propagated at barrier operations, but two successive arrivals by a processor to a barrier can be considered to
be a lock/unlock pair, by considering a departure from a barrier to be a “lock,” and considering reaching a barrier to be an “unlock.”
So, we’ll usually not mention barriers separately from locks in the remainder of this subsection.
24
The set of changes is called a diff, remiscent of the Unix file-compare command. A copy, called a twin, had been made of the
original page, which now will be used to produce the diff. This has substantial overhead. The Treadmarks people found that it took
167 microseconds to make a twin, and as much as 686 microseconds to make a diff.
25
In JIAJIA, that location is normally fixed, but JIAJIA does include advanced programmer options which allow the location to
migrate.
2.10. BARRIER IMPLEMENTATION
47
processors.26 When the barrier is reached, each will be informed of the writes of the other.27 Allowing
multiple writers helps to reduce the performance penalty due to false sharing.
2.10
Barrier Implementation
Recall that a barrier is program code28 which has a processor do a wait-loop action until all processors have
reached that point in the program.29
A function Barrier() is often supplied as a library function; here we will see how to implement such a
library function in a correct and efficient manner. Note that since a barrier is a serialization point for the
program, efficiency is crucial to performance.
Implementing a barrier in a fully correct manner is actually a bit tricky. We’ll see here what can go wrong,
and how to make sure it doesn’t.
In this section, we will approach things from a shared-memory point of view. But the methods apply in the
obvious way to message-passing systems as well, as will be discused later.
2.10.1
1
2
3
4
5
A Use-Once Version
struct BarrStruct {
int NNodes, // number of threads participating in the barrier
Count, // number of threads that have hit the barrier so far
pthread_mutex_t Lock = PTHREAD_MUTEX_INITIALIZER;
} ;
6
7
8
9
10
11
12
Barrier(struct BarrStruct *PB)
{ pthread_mutex_lock(&PB->Lock);
PB->Count++;
pthread_mutex_unlock(&PB->Lock);
while (PB->Count < PB->NNodes) ;
}
This is very simple, actually overly so. This implementation will work once, so if a program using it doesn’t
make two calls to Barrier() it would be fine. But not otherwise. If, say, there is a call to Barrier() in a loop,
we’d be in trouble.
26
The only other option would be to use lock/unlock, but then their writing would not be simultaneous.
If they are writing to the same variable, not just the same page, the programmer would use locks instead of a barrier, and the
situation would not arise.
28
Some hardware barriers have been proposed.
29
I use the word processor here, but it could be just a thread on the one hand, or on the other hand a processing element in a
message-passing context.
27
48
CHAPTER 2. SHARED MEMORY PARALLELISM
What is the problem? Clearly, something must be done to reset Count to 0 at the end of the call, but doing
this safely is not so easy, as seen in the next section.
2.10.2
An Attempt to Write a Reusable Version
Consider the following attempt at fixing the code for Barrier():
1
2
3
4
5
6
7
8
Barrier(struct BarrStruct *PB)
{ int OldCount;
pthread_mutex_lock(&PB->Lock);
OldCount = PB->Count++;
pthread_mutex_unlock(&PB->Lock);
if (OldCount == PB->NNodes-1) PB->Count = 0;
while (PB->Count < PB->NNodes) ;
}
Unfortunately, this doesn’t work either. To see why, consider a loop with a barrier call at the end:
1
2
3
4
5
6
7
struct BarrStruct B;
........
while (.......) {
.........
Barrier(&B);
.........
}
// global variable
At the end of the first iteration of the loop, all the processors will wait at the barrier until everyone catches
up. After this happens, one processor, say 12, will reset B.Count to 0, as desired. But if we are unlucky,
some other processor, say processor 3, will then race ahead, perform the second iteration of the loop in an
extremely short period of time, and then reach the barrier and increment the Count variable before processor
12 resets it to 0. This would result in disaster, since processor 3’s increment would be canceled, leaving us
one short when we try to finish the barrier the second time.
Another disaster scenario which might occur is that one processor might reset B.Count to 0 before another
processor had a chance to notice that B.Count had reached B.NNodes.
2.10.3
A Correct Version
One way to avoid this would be to have two Count variables, and have the processors alternate using one
then the other. In the scenario described above, processor 3 would increment the other Count variable, and
2.10. BARRIER IMPLEMENTATION
thus would not conflict with processor 12’s resetting. Here is a safe barrier function based on this idea:
1
2
3
4
5
struct BarrStruct {
int NNodes, // number of threads participating in the barrier
Count[2], // number of threads that have hit the barrier so far
pthread_mutex_t Lock = PTHREAD_MUTEX_INITIALIZER;
} ;
6
7
8
9
10
11
12
13
14
15
16
17
18
Barrier(struct BarrStruct *PB)
{ int Par,OldCount;
Par = PB->EvenOdd;
pthread_mutex_lock(&PB->Lock);
OldCount = PB->Count[Par]++;
pthread_mutex_unlock(&PB->Lock);
if (OldCount == PB->NNodes-1) {
PB->Count[Par] = 0;
PB->EvenOdd = 1 - Par;
}
else while (PB->Count[Par] > 0) ;
}
2.10.4
2.10.4.1
Refinements
Use of Wait Operations
The code
else while (PB->Count[Par] > 0) ;
49
50
CHAPTER 2. SHARED MEMORY PARALLELISM
is harming performance, since it has the processor spining around doing no useful work. In the Pthreads
context, we can use a condition variable:
1
2
3
4
5
6
struct BarrStruct {
int NNodes, // number of threads participating in the barrier
Count[2], // number of threads that have hit the barrier so far
pthread_mutex_t Lock = PTHREAD_MUTEX_INITIALIZER;
pthread_cond_t CV = PTHREAD_COND_INITIALIZER;
} ;
7
8
9
10
11
12
13
14
15
16
17
18
19
20
21
22
Barrier(struct BarrStruct *PB)
{ int Par,I;
Par = PB->EvenOdd;
pthread_mutex_lock(&PB->Lock);
PB->Count[Par]++;
if (PB->Count < PB->NNodes)
pthread_cond_wait(&PB->CV,&PB->Lock);
else {
PB->Count[Par] = 0;
PB->EvenOdd = 1 - Par;
for (I = 0; I < PB->NNodes-1; I++)
pthread_cond_signal(&PB->CV);
}
pthread_mutex_unlock(&PB->Lock);
}
Here, if a thread finds that not everyone has reached the barrier yet, it still waits for the rest, but does so
passively, via the wait for the condition variable CV. This way the thread is not wasting valuable time on
that processor, which can run other useful work.
Note that the call to pthread cond wait() requires use of the lock. Your code must lock the lock before making the call. The call itself immediately unlocks that lock after it registers the wait with the
threads manager. But the call blocks until awakened when another thread calls pthread cond signal()
or pthread cond broadcast().
It is required that your code lock the lock before calling pthread cond signal(), and that it unlock the lock
after the call.
By using pthread cond wait() and placing the unlock operation later in the code, as seen above, we actually
could get by with just a single Count variable, as before.
Even better, the for loop could be replaced by a single call
pthread_cond_broadcast(&PB->PB->CV);
This still wakes up the waiting threads one by one, but in a much more efficient way, and it makes for clearer
code.
2.10. BARRIER IMPLEMENTATION
2.10.4.2
51
Parallelizing the Barrier Operation
2.10.4.2.1 Tree Barriers It is clear from the code above that barriers can be costly to performance, since
they rely so heavily on critical sections, i.e. serial parts of a program. Thus in many settings it is worthwhile
to parallelize not only the general computation, but also the barrier operations themselves.
Consider for instance a barrier in which 16 threads are participating. We could speed things up by breaking this barrier down into two sub-barriers, with eight threads each. We would then set up three barrier
operations: one of the first group of eight threads, another for the other group of eight threads, and a third
consisting of a “competition” between the two groups. The variable NNodes above would have the value 8
for the first two barriers, and would be equal to 2 for the third barrier.
Here thread 0 could be the representative for the first group, with thread 4 representing the second group.
After both groups’s barriers were hit by all of their members, threads 0 and 4 would participated in the third
barrier.
Note that then the notification phase would the be done in reverse: When the third barrier was complete,
threads 0 and 4 would notify the members of their groups.
This would parallelize things somewhat, as critical-section operations could be executing simultaneously for
the first two barriers. There would still be quite a bit of serial action, though, so we may wish to do further
splitting, by partitioning each group of four threads into two subroups of two threads each.
In general, for n threads (with n, say, equal to a power of 2) we would have a tree structure, with log2 n
levels in the tree. The ith level (starting with the root as level 0) with consist of 2i parallel barriers, each one
representing n/2i threads.
2.10.4.2.2 Butterfly Barriers Another method basically consists of each node “shaking hands” with every other node. In the shared-memory case, handshaking could be done by having a global array ReachedBarrier. When thread 3 and thread 7 shake hands, for instance, would reach the barrier, thread 3 would set
ReachedBarrier[3] to 1, and would then wait for ReachedBarrier[7] to become 1. The wait, as before,
could either be a while loop or a call to pthread cond wait(). Thread 7 would do the opposite.
If we have n nodes, again with n being a power of 2, then the barrier process would consist of log2 n phases,
which we’ll call phase 0, phase 1, etc. Then the process works as follows.
For any node i, let i(k) be the number obtained by inverting bit k in the binary representation of i, with bit 0
being the least significant bit. Then in the k th phase, node i would shake hands with node i(k).
For example, say n = 8. In phase 0, node 5 = 1012 , say, would shake hands with node 4 = 1002 .
Actually, a butterfly exchange amounts to a number of simultaneously tree operations.
52
CHAPTER 2. SHARED MEMORY PARALLELISM
Chapter 3
Introduction to OpenMP
OpenMP has become the de facto standard for shared-memory programming.
3.1
Overview
OpenMP has become the environment of choice for many, if not most, practitioners of shared-memory
parallel programming. It consists of a set of directives which are added to one’s C/C++/FORTRAN code
that manipulate threads, without the programmer him/herself having to deal with the threads directly. This
way we get “the best of both worlds”—the true parallelism of (nonpreemptive) threads and the pleasure of
avoiding the annoyances of threads programming.
Most OpenMP constructs are expressed via pragmas, i.e. directives. The syntax is
#pragma omp ......
The number sign must be the first nonblank character in the line.
3.2
Running Example
The following example, implementing Dijkstra’s shortest-path graph algorithm, will be used throughout this
tutorial, with various OpenMP constructs being illustrated later by modifying this code:
1
// Dijkstra.c
2
53
54
3
4
5
CHAPTER 3. INTRODUCTION TO OPENMP
// OpenMP example program: Dijkstra shortest-path finder in a
// bidirectional graph; finds the shortest path from vertex 0 to all
// others
6
7
// usage:
dijkstra nv print
8
9
10
// where nv is the size of the graph, and print is 1 if graph and min
// distances are to be printed out, 0 otherwise
11
12
#include <omp.h>
13
14
// global variables, shared by all threads by default
15
16
17
18
19
20
21
22
int nv, // number of vertices
*notdone, // vertices not checked yet
nth, // number of threads
chunk, // number of vertices handled by each thread
md, // current min over all threads
mv, // vertex which achieves that min
largeint = -1; // max possible unsigned int
23
24
25
26
unsigned *ohd, // 1-hop distances between vertices; "ohd[i][j]" is
// ohd[i*nv+j]
*mind; // min distances found so far
27
28
29
30
31
32
33
34
35
36
37
38
39
40
41
42
43
44
45
46
47
void init(int ac, char **av)
{ int i,j,tmp;
nv = atoi(av[1]);
ohd = malloc(nv*nv*sizeof(int));
mind = malloc(nv*sizeof(int));
notdone = malloc(nv*sizeof(int));
// random graph
for (i = 0; i < nv; i++)
for (j = i; j < nv; j++) {
if (j == i) ohd[i*nv+i] = 0;
else {
ohd[nv*i+j] = rand() % 20;
ohd[nv*j+i] = ohd[nv*i+j];
}
}
for (i = 1; i < nv; i++) {
notdone[i] = 1;
mind[i] = ohd[i];
}
}
48
49
50
51
52
53
54
55
56
57
58
// finds closest to 0 among notdone, among s through e
void findmymin(int s, int e, unsigned *d, int *v)
{ int i;
*d = largeint;
for (i = s; i <= e; i++)
if (notdone[i] && mind[i] < *d) {
*d = ohd[i];
*v = i;
}
}
59
60
// for each i in [s,e], ask whether a shorter path to i exists, through
3.2. RUNNING EXAMPLE
61
62
63
64
65
66
67
// mv
void updatemind(int s, int e)
{ int i;
for (i = s; i <= e; i++)
if (mind[mv] + ohd[mv*nv+i] < mind[i])
mind[i] = mind[mv] + ohd[mv*nv+i];
}
68
69
70
71
72
73
74
75
76
77
78
79
80
81
82
83
84
85
86
87
88
89
90
91
92
93
94
95
96
97
98
99
100
101
102
103
104
105
106
107
108
void dowork()
{
#pragma omp parallel
{ int startv,endv, // start, end vertices for my thread
step, // whole procedure goes nv steps
mymv, // vertex which attains the min value in my chunk
me = omp_get_thread_num();
unsigned mymd; // min value found by this thread
#pragma omp single
{ nth = omp_get_num_threads(); // must call inside parallel block
if (nv % nth != 0) {
printf("nv must be divisible by nth\n");
exit(1);
}
chunk = nv/nth;
printf("there are %d threads\n",nth);
}
startv = me * chunk;
endv = startv + chunk - 1;
for (step = 0; step < nv; step++) {
// find closest vertex to 0 among notdone; each thread finds
// closest in its group, then we find overall closest
#pragma omp single
{ md = largeint; mv = 0; }
findmymin(startv,endv,&mymd,&mymv);
// update overall min if mine is smaller
#pragma omp critical
{ if (mymd < md)
{ md = mymd; mv = mymv; }
}
#pragma omp barrier
// mark new vertex as done
#pragma omp single
{ notdone[mv] = 0; }
// now update my section of mind
updatemind(startv,endv);
#pragma omp barrier
}
}
}
109
110
111
112
113
114
115
116
117
118
int main(int argc, char **argv)
{ int i,j,print;
double startime,endtime;
init(argc,argv);
startime = omp_get_wtime();
// parallel
dowork();
// back to single thread
endtime = omp_get_wtime();
55
56
printf("elapsed time: %f\n",endtime-startime);
print = atoi(argv[2]);
if (print) {
printf("graph weights:\n");
for (i = 0; i < nv; i++) {
for (j = 0; j < nv; j++)
printf("%u ",ohd[nv*i+j]);
printf("\n");
}
printf("minimum distances:\n");
for (i = 1; i < nv; i++)
printf("%u\n",mind[i]);
}
119
120
121
122
123
124
125
126
127
128
129
130
131
132
CHAPTER 3. INTRODUCTION TO OPENMP
}
The constructs will be presented in the following sections, but first the algorithm will be explained.
3.2.1
The Algorithm
The code implements the Dijkstra algorithm for finding the shortest paths from vertex 0 to the other vertices
in an N-vertex undirected graph. Pseudocode for the algorithm is shown below, with the array G assumed
to contain the one-hop distances from 0 to the other vertices.
1
2
3
4
Done = {0} # vertices checked so far
NewDone = None # currently checked vertex
NonDone = {1,2,...,N-1} # vertices not checked yet
for J = 0 to N-1 Dist[J] = G(0,J) # initialize shortest-path lengths
5
6
7
8
9
10
11
12
13
14
for Step = 1 to N-1
find J such that Dist[J] is min among all J in NonDone
transfer J from NonDone to Done
NewDone = J
for K = 1 to N-1
if K is in NonDone
# check if there is a shorter path from 0 to K through NewDone
# than our best so far
Dist[K] = min(Dist[K],Dist[NewDone]+G[NewDone,K])
At each iteration, the algorithm finds the closest vertex J to 0 among all those not yet processed, and then
updates the list of minimum distances to each vertex from 0 by considering paths that go through J. Two
obvious potential candidate part of the algorithm for parallelization are the “find J” and “for K” lines, and
the above OpenMP code takes this approach.
3.2.2
The OpenMP parallel Pragma
As can be seen in the comments in the lines
3.2. RUNNING EXAMPLE
57
// parallel
dowork();
// back to single thread
the function main() is run by a master thread, which will then branch off into many threads running
dowork() in parallel. The latter feat is accomplished by the directive in the lines
void dowork()
{
#pragma omp parallel
{ int startv,endv, // start, end vertices for this thread
step, // whole procedure goes nv steps
mymv, // vertex which attains that value
me = omp_get_thread_num();
That directive sets up a team of threads (which includes the master), all of which execute the block following
the directive in parallel.1 Note that, unlike the for directive which will be discussed below, the parallel
directive leaves it up to the programmer as to how to partition the work. In our case here, we do that by
setting the range of vertices which this thread will process:
startv = me * chunk;
endv = startv + chunk - 1;
Again, keep in mind that all of the threads execute this code, but we’ve set things up with the variable me
so that different threads will work on different vertices. This is due to the OpenMP call
me = omp_get_thread_num();
which sets me to the thread number for this thread.
3.2.3
Scope Issues
Note carefully that in
#pragma omp parallel
{ int startv,endv, // start, end vertices for this thread
step, // whole procedure goes nv steps
mymv, // vertex which attains that value
me = omp_get_thread_num();
1
There is an issue here of thread startup time. The OMPi compiler sets up threads at the outset, so that that startup time is
incurred only once. When a parallel construct is encountered, they are awakened. At the end of the construct, they are suspended
again, until the next parallel construct is reached.
58
CHAPTER 3. INTRODUCTION TO OPENMP
the pragma comes before the declaration of the local variables. That means that all of them are “local” to
each thread, i.e. not shared by them. But if a work sharing directive comes within a function but after
declaration of local variables, those variables are actually “global” to the code in the directive, i.e. they are
shared in common among the threads.
This is the default, but you can change these properties, e.g. using the shared keyword. For instance,
#pragma omp parallel private(x,y)
would make x and y nonshared even if they were declared above the directive line.
It is crucial to keep in mind that variables which are global to the program (in the C/C++ sense) are automatically global to all threads. This is the primary means by which the threads communicate with each
other.
3.2.4
The OpenMP single Pragma
In some cases we want just one thread to execute some code, even though that code is part of a parallel or
other work sharing block.2 We use the single directive to do this, e.g.:
#pragma omp single
{ nth = omp_get_num_threads();
if (nv % nth != 0) {
printf("nv must be divisible by nth\n");
exit(1);
}
chunk = nv/nth;
printf("there are %d threads\n",nth); }
Since the variables nth and chunk are global and thus shared, we need not have all threads set them, hence
our use of single.
3.2.5
The OpenMP barrier Pragma
As see in the example above, the barrier implements a standard barrier, applying to all threads.
3.2.6
Implicit Barriers
Note that there is an implicit barrier at the end of each single block, which is also the case for parallel, for,
and sections blocks. This can be overridden via the nowait clause, e.g.
2
This is an OpenMP term. The for directive is another example of it. More on this below.
3.3. THE OPENMP FOR PRAGMA
59
#pragma omp for nowait
Needless to say, the latter should be used with care, and in most cases will not be usable. On the other hand,
putting in a barrier where it is not needed would severely reduce performance.
3.2.7
The OpenMP critical Pragma
The last construct used in this example is critical, for critical sections.
#pragma omp critical
{ if (mymd < md)
{ md = mymd; mv = mymv;
}
}
It means what it says, allowing entry of only one thread at a time while others wait. Here we are updating
global variables md and mv, which has to be done atomically, and critical takes care of that for us. This
is much more convenient than setting up lock variables, etc., which we would do if we were programming
threads code directly.
3.3
The OpenMP for Pragma
This one breaks up a C/C++ for loop, assigning various iterations to various threads. (The threads, of course,
must have already been set up via the omp parallel pragma.) This way the iterations are done in parallel.
Of course, that means that they need to be independent iterations, i.e. one iteration cannot depend on the
result of another.
3.3.1
Basic Example
Here’s how we could use this construct in the Dijkstra program :
1
// Dijkstra.c
2
3
4
5
// OpenMP example program (OMPi version): Dijkstra shortest-path finder
// in a bidirectional graph; finds the shortest path from vertex 0 to
// all others
6
7
// usage:
dijkstra nv print
8
9
10
// where nv is the size of the graph, and print is 1 if graph and min
// distances are to be printed out, 0 otherwise
60
CHAPTER 3. INTRODUCTION TO OPENMP
11
12
#include <omp.h>
13
14
// global variables, shared by all threads by default
15
16
17
18
19
20
21
22
int nv, // number of vertices
*notdone, // vertices not checked yet
nth, // number of threads
chunk, // number of vertices handled by each thread
md, // current min over all threads
mv, // vertex which achieves that min
largeint = -1; // max possible unsigned int
23
24
25
26
unsigned *ohd,
// 1-hop distances between vertices; "ohd[i][j]" is
// ohd[i*nv+j]
*mind; // min distances found so far
27
28
29
30
31
32
33
34
35
36
37
38
39
40
41
42
43
44
45
46
47
void init(int ac, char **av)
{ int i,j,tmp;
nv = atoi(av[1]);
ohd = malloc(nv*nv*sizeof(int));
mind = malloc(nv*sizeof(int));
notdone = malloc(nv*sizeof(int));
// random graph
for (i = 0; i < nv; i++)
for (j = i; j < nv; j++) {
if (j == i) ohd[i*nv+i] = 0;
else {
ohd[nv*i+j] = rand() % 20;
ohd[nv*j+i] = ohd[nv*i+j];
}
}
for (i = 1; i < nv; i++) {
notdone[i] = 1;
mind[i] = ohd[i];
}
}
48
49
50
51
52
53
54
55
56
57
58
59
60
61
62
63
64
65
66
67
68
void dowork()
{
#pragma omp parallel
{ int step, // whole procedure goes nv steps
mymv, // vertex which attains that value
me = omp_get_thread_num(),
i;
unsigned mymd; // min value found by this thread
#pragma omp single
{ nth = omp_get_num_threads();
printf("there are %d threads\n",nth); }
for (step = 0; step < nv; step++) {
// find closest vertex to 0 among notdone; each thread finds
// closest in its group, then we find overall closest
#pragma omp single
{ md = largeint; mv = 0; }
mymd = largeint;
#pragma omp for nowait
for (i = 1; i < nv; i++) {
if (notdone[i] && mind[i] < mymd) {
3.3. THE OPENMP FOR PRAGMA
mymd = ohd[i];
mymv = i;
69
70
}
}
// update overall min if mine is smaller
#pragma omp critical
{ if (mymd < md)
{ md = mymd; mv = mymv; }
}
// mark new vertex as done
#pragma omp single
{ notdone[mv] = 0; }
// now update ohd
#pragma omp for
for (i = 1; i < nv; i++)
if (mind[mv] + ohd[mv*nv+i] < mind[i])
mind[i] = mind[mv] + ohd[mv*nv+i];
71
72
73
74
75
76
77
78
79
80
81
82
83
84
85
}
86
}
87
88
61
}
89
90
91
92
93
94
95
96
97
98
99
100
101
102
103
104
105
106
107
108
int main(int argc, char **argv)
{ int i,j,print;
init(argc,argv);
// parallel
dowork();
// back to single thread
print = atoi(argv[2]);
if (print) {
printf("graph weights:\n");
for (i = 0; i < nv; i++) {
for (j = 0; j < nv; j++)
printf("%u ",ohd[nv*i+j]);
printf("\n");
}
printf("minimum distances:\n");
for (i = 1; i < nv; i++)
printf("%u\n",mind[i]);
}
}
109
The work which used to be done in the function findmymin() is now done here:
#pragma omp for
for (i = 1; i < nv; i++) {
if (notdone[i] && mind[i] < mymd)
mymd = ohd[i];
mymv = i;
}
}
{
Each thread executes one or more of the iterations, i.e. takes responsibility for one or more values of i.
This occurs in parallel, so as mentioned earlier, the programmer must make sure that the iterations are
62
CHAPTER 3. INTRODUCTION TO OPENMP
independent; there is no predicting which threads will do which values of i, in which order. By the way, for
obvious reasons OpenMP treats the loop index, i here, as private even if by context it would be shared.
3.3.2
Nested Loops
If we use the for pragma to nested loops, by default the pragma applies only to the outer loop. We can of
course insert another for pragma inside, to parallelize the inner loop.
Or, starting with OpenMP version 3.0, one can use the collapse clause, e.g.
#pragma omp parallel for collapse(2)
to specify two levels of nesting in the assignment of threads to tasks.
3.3.3
Controlling the Partitioning of Work to Threads
In this default version of the for construct, iterations are executed by threads in unpredictable order, with
each thread taking on one iteration’s worth of work at a time. Both of these can be changed by the programmer, using the schedule clause.
For instance, our original version of our program in Section 3.2 broke the work into chunks, with chunk size
being the number vertices divided by the number of threads.
For the Dijkstra algorithm, for instance, we could have this:
...
#pragma omp for schedule(static,chunk)
for (i = 1; i < nv; i++) {
if (notdone[i] && mind[i] < mymd) {
mymd = ohd[i];
mymv = i;
}
}
...
#pragma omp for
for (i = 1; i <
if (mind[mv]
mind[i] =
schedule(static,chunk)
nv; i++)
+ ohd[mv*nv+i] < mind[i])
mind[mv] + ohd[mv*nv+i];
...
Here static is a keyword while chunk is an actual argument, in this case the variable chunk that we had in
the Dijkstra program.
Since this would work out in this Dijkstra example to having each thread do just one chunk, it would not
be any different than the code we had before. But one can try to enhance performance by considering
3.3. THE OPENMP FOR PRAGMA
63
other chunk sizes, in which case a thread would be responsible for more than one chunk; whenever a thread
finished a chunk, OpenMP would give it another to work on.
On the one hand, large chunks are good, due to there being less overhead—every time a thread finishes a
chunk, it must go through the critical section, which serializes our parallel program and thus slows things
down. On the other hand, if chunk sizes are large, then toward the end of the work, some threads may be
working on their last chunks while others have finished and are now idle, thus foregoing potential speed
enhancement. So it would be nice to have large chunks at the beginning of the run, to reduce the overhead,
but smaller chunks at the end. This can be done using the guided clause.
For the Dijkstra algorithm, for instance, we could have this:
...
#pragma omp for schedule(guided)
for (i = 1; i < nv; i++) {
if (notdone[i] && mind[i] < mymd)
mymd = ohd[i];
mymv = i;
}
}
{
...
#pragma omp for
for (i = 1; i <
if (mind[mv]
mind[i] =
schedule(guided)
nv; i++)
+ ohd[mv*nv+i] < mind[i])
mind[mv] + ohd[mv*nv+i];
...
There are other variations of this available in OpenMP. However, in Section 1.5.4, I showed that these would
seldom be necessary or desirable; having each thread handle a single chunk would be best.
3.3.4
The OpenMP reduction Clause
The name of this OpenMP clause alludes to the term reduction in functional programming. Many parallel
programming languages include such operations, to enable the programmer to more conveniently (and often
more efficiently) have threads/processors cooperate in computing sums, products, etc. OpenMP does this
via the reduction clause.
For example, consider
1
2
3
4
int z;
...
#pragma omp for reduction(+:z)
for (i = 0; i < n; i++) z += x[i];
The pragma says that the threads will share the work as in our previous discussion of the for pragma. In
addition, though, there will be independent copies of z maintained for each thread, each initialized to 0
64
CHAPTER 3. INTRODUCTION TO OPENMP
before the loop begins. When the loop is entirely done, the values of z from the various threads will be
summed, of course in an atomic manner.
Note that the + operator not only indicates that the values of z are to be summed, but also that their initial
values are to be 0. If the operator were *, say, then the product of the values would be computed, and their
initial values would be 1.
One can specify several reduction variables to the right of the colon, separated by commas.
Our use of the reduction clause here makes our programming much easier. Indeed, if we had old serial code
that we wanted to parallelize, we would have to make no change to it! OpenMP is taking care of both the
work splitting across values of i, and the atomic operations. Moreover—note this carefully—it is efficient,
because by maintaining separate copies of z until the loop is done, we are reducing the number of serializing
atomic actions, and are avoiding time-costly cache coherency transactions and the like.
Without this construct, we would have to do
int z,myz=0;
...
#pragma omp for private(myz)
for (i = 0; i < n; i++) myz += x[i];
#pragma omp critical
{ z += myz; }
Here are the eligible operators and the corresponding initial values:
In C/C++, you can use reduction with +, -, *, &, |, && and || (and the exclusive-or operator).
operator
+
*
&
|
ˆ
&&
||
initial value
0
0
1
bit string of 1s
bit string of 0s
0
1
0
The lack of other operations typically found in other parallel programming languages, such as min and max,
is due to the lack of these operators in C/C++. The FORTRAN version of OpenMP does have min and max.3
Note that the reduction variables must be shared by the threads, so they must be declared before the parallel,
or with a shared clause.
3
Note, though, that plain min and max would not help in our Dijkstra example above, as we not only need to find the minimum
value, but also need the vertex which attains that value.
3.4. THE TASK DIRECTIVE
3.4
65
The Task Directive
This is new to OpenMP 3.0. The basic idea is to set up a task queue: When a thread encounters a task
directive, it arranges for some thread to execute the associated block—at some time. The first thread can
continue. Note that the task might not execute right away; it may have to wait for some thread to become
free after finishing another task. Also, there may be more tasks than threads, also causing some threads to
wait.
Here’s a Quicksort example:
1
// OpenMP example program:
quicksort; not necessarily efficient
2
3
4
5
6
7
void swap(int *yi, int *yj)
{ int tmp = *yi;
*yi = *yj;
*yj = tmp;
}
8
9
10
11
12
13
14
15
16
17
18
19
20
21
22
int *separate(int *x, int low, int high)
{ int i,pivot,last;
pivot = x[low]; // would be better to take, e.g., median of 1st 3 elts
swap(x+low,x+high);
last = low;
for (i = low; i < high; i++) {
if (x[i] <= pivot) {
swap(x+last,x+i);
last += 1;
}
}
swap(x+last,x+high);
return last;
}
23
24
25
26
27
28
29
30
31
32
33
34
35
36
37
38
39
40
41
42
// quicksort of the array z, elements zstart through zend; set the
// latter to 0 and m-1 in first call, where m is the length of z;
// firstcall is 1 or 0, according to whether this is the first of the
// recursive calls
void qs(int *z, int zstart, int zend, int firstcall)
{
#pragma omp parallel
{ int part;
if (firstcall == 1) {
#pragma omp single nowait
qs(z,0,zend,0);
} else {
if (zstart < zend) {
part = separate(z,zstart,zend);
#pragma omp task
qs(z,zstart,part-1,0);
#pragma omp task
qs(z,part+1,zend,0);
}
43
44
}
66
}
45
46
CHAPTER 3. INTRODUCTION TO OPENMP
}
47
48
49
50
51
52
53
54
55
56
57
// test code
main(int argc, char**argv)
{ int i,n,*w;
n = atoi(argv[1]);
w = malloc(n*sizeof(int));
for (i = 0; i < n; i++) w[i] = rand();
qs(w,0,n-1,1);
if (n < 25)
for (i = 0; i < n; i++) printf("%d\n",w[i]);
}
The code
if (firstcall == 1) {
#pragma omp single nowait
qs(z,0,zend,0);
gets things going. We want only one thread to execute the root of the recursion tree, hence the need for the
single clause. After that, the code
part = separate(z,zstart,zend);
#pragma omp task
qs(z,zstart,part-1,0);
sets up a call to a subtree, with the task directive stating, “OMP system, please make sure that this subtree
is handled by some thread.”
This really simplifies the programming. Compare this to the Python multiprocessing version in Section
13.1.5, where the programmer needed to write code to handle the work queue.
There are various refinements, such as the barrier-like taskwait clause.
3.5
Other OpenMP Synchronization Issues
Earlier we saw the critical and barrier constructs. There is more to discuss, which we do here.
3.5.1
The OpenMP atomic Clause
The critical construct not only serializes your program, but also it adds a lot of overhead. If your critical
section involves just a one-statement update to a shared variable, e.g.
3.5. OTHER OPENMP SYNCHRONIZATION ISSUES
67
x += y;
etc., then the OpenMP compiler can take advantage of an atomic hardware instruction, e.g. the LOCK prefix
on Intel, to set up an extremely efficient critical section, e.g.
#pragma omp atomic
x += y;
Since it is a single statement rather than a block, there are no braces.
The eligible operators are:
++, --, +=, *=, <<=, &=, |=
3.5.2
Memory Consistency and the flush Pragma
Consider a shared-memory multiprocessor system with coherent caches, and a shared, i.e. global, variable
x. If one thread writes to x, you might think that the cache coherency system will ensure that the new value
is visible to other threads. But as discussed in Section 2.6, it is is not quite so simple as this.
For example, the compiler may store x in a register, and update x itself at certain points. In between such
updates, since the memory location for x is not written to, the cache will be unaware of the new value, which
thus will not be visible to other threads. If the processors have write buffers etc., the same problem occurs.
In other words, we must account for the fact that our program could be run on different kinds of hardware
with different memory consistency models. Thus OpenMP must have its own memory consistency model,
which is then translated by the compiler to mesh with the hardware.
OpenMP takes a relaxed consistency approach, meaning that it forces updates to memory (“flushes”) at all
synchronization points, i.e. at:
• barrier
• entry/exit to/from critical
• entry/exit to/from ordered
• entry/exit to/from parallel
• exit from parallel for
• exit from parallel sections
68
CHAPTER 3. INTRODUCTION TO OPENMP
• exit from single
In between synchronization points, one can force an update to x via the flush pragma:
#pragma omp flush (x)
The flush operation is obviously architecture-dependent. OpenMP compilers will typically have the proper
machine instructions available for some common architectures. For the rest, it can force a flush at the
hardware level by doing lock/unlock operations, though this may be costly in terms of time.
3.6
Combining Work-Sharing Constructs
In our examples of the for pragma above, that pragma would come within a block headed by a parallel
pragma. The latter specifies that a team of theads is to be created, with each one executing the given block,
while the former specifies that the various iterations of the loop are to be distributed among the threads. As
a shortcut, we can combine the two pragmas:
#pragma omp parallel for
This also works with the sections pragma.
3.7
The Rest of OpenMP
There is much, much more to OpenMP than what we have seen here. To see the details, there are many
Web pages you can check, and there is also the excellent book, Using OpenMP: Portable Shared Memory
Parallel Programming, by Barbara Chapman, Gabriele Jost and Ruud Van Der Pas, MIT Press, 2008. The
book by Gove cited in Section 1.5.2 also includes coverage of OpenMP.
3.8
Further Examples
There are additional OpenMP examples in later sections of this book, such as:4
4
If you are reading this presentation on OpenMP separately from the book, the book is at http://heather.cs.ucdavis.
edu/˜matloff/158/PLN/ParProcBook.pdf
3.9. COMPILING, RUNNING AND DEBUGGING OPENMP CODE
69
• Jacobi algorithm for solving systems of linear equations, with a good example of the OpenMP reduction clause, Section 9.6
• another implementation of Quicksort, Section 10.1.2
• matrix multiplication, Section 9.4.2.1
3.9
3.9.1
Compiling, Running and Debugging OpenMP Code
Compiling
There are a number of open source compilers available for OpenMP, including:
• Omni: This is available at (http://phase.hpcc.jp/Omni/). To compile an OpenMP program
in x.c and create an executable file x, run
omcc -g -o x x.c
• Ompi: You can download this at http://www.cs.uoi.gr/˜ompi/index.html. Compile
x.c by
ompicc -g -o x x.c
• GCC, version 4.2 or later:5 Compile x.c via
gcc -fopenmp -g -o x x.c
3.9.2
Running
Just run the executable as usual.
The number of threads will be the number of processors, by default. To change that value, set the OMP NUM THREADS
environment variable. For example, to get four threads in the C shell, type
setenv OMP_NUM_THREADS 4
5
You may find certain subversions of GCC 4.1 can be used too.
70
CHAPTER 3. INTRODUCTION TO OPENMP
3.9.3
Debugging
OpenMP’s use of pragmas makes it difficult for the compilers to maintain your original source code line
numbers, and your function and variable names. But with a little care, a symbolic debugger such as GDB can
still be used. Here are some tips for the compilers mentioned above, using GDB as our example debugging
tool:
• Omni: The function main() in your executable is actually in the OpenMP library, and your function
main() is renamed ompc main(). So, when you enter GDB, first set a breakpoint at your own code:
(gdb) b _ompc_main
Then run your program to this breakpoint, and set whatever other breakpoints you want.
You should find that your other variable and function names are unchanged.
• Ompi: During preprocessing of your file x.c, the compiler produces a file x ompi.c, and the latter
is what is actually compiled. Your function main is renamed to ompi originalMain(). Your other
functions and variables are renamed. For example in our Dijkstra code, the function dowork() is
renamed to dowork parallel 0. And by the way, all indenting is lost! Keep these points in mind as
you navigate through your code in GDB.
• GCC: GCC maintains line numbers and names well. In earlier versions, it had a problem in that it did
not not retain names of local variables within blocks controlled by omp parallel at all. That problem
is now fixed (e.g. in version 4.4 of the GCC suite).
3.10
Performance
As is usually the case with parallel programming, merely parallelizing a program won’t necessarily make it
faster, even on shared-memory hardware. Operations such as critical sections, barriers and so on serialize
an otherwise-parallel program, sapping much of its speed. In addition, there are issues of cache coherency
transactions, false sharing etc.
3.10.1
The Effect of Problem Size
To illustrate this, I ran our original Dijkstra example (Section 3.2 on various graph sizes, on a quad core
machine. Here are the timings:
3.10. PERFORMANCE
nv
nth time
1000 1
0.005472
1000 2
0.011143
1000 4
0.029574
71
The more parallelism we had, the slower the program ran! The synchronization overhead was just too much
to be compensated by the parallel computation.
However, parallelization did bring benefits on larger problems:
nv
25000
25000
25000
3.10.2
nth
1
2
4
time
2.861814
1.710665
1.453052
Some Fine Tuning
How could we make our Dijkstra code faster? One idea would be to eliminate the critical section. Recall that
in each iteration, the threads compute their local minimum distance values md and mv, and then update the
global values md and mv. Since the update must be atomic, this causes some serialization of the program.
Instead, we could have the threads store their values mymd and mymv in a global array mymins, with each
thread using a separate pair of locations within that array, and then at the end of the iteration we could have
just one task scan through mymins and update md and mv.
Here is the resulting code:
1
// Dijkstra.c
2
3
4
5
// OpenMP example program: Dijkstra shortest-path finder in a
// bidirectional graph; finds the shortest path from vertex 0 to all
// others
6
7
8
9
10
//
//
//
//
**** in this version, instead of having a critical section in which
each thread updates md and mv, the threads record their mymd and mymv
values in a global array mymins, which one thread then later uses to
update md and mv
11
12
// usage:
dijkstra nv print
13
14
15
// where nv is the size of the graph, and print is 1 if graph and min
// distances are to be printed out, 0 otherwise
16
17
#include <omp.h>
18
19
// global variables, shared by all threads by default
20
21
22
23
24
int nv, // number of vertices
*notdone, // vertices not checked yet
nth, // number of threads
chunk, // number of vertices handled by each thread
72
25
26
27
CHAPTER 3. INTRODUCTION TO OPENMP
md, // current min over all threads
mv, // vertex which achieves that min
largeint = -1; // max possible unsigned int
28
29
int *mymins;
// (mymd,mymv) for each thread; see dowork()
30
31
32
33
unsigned *ohd, // 1-hop distances between vertices; "ohd[i][j]" is
// ohd[i*nv+j]
*mind; // min distances found so far
34
35
36
37
38
39
40
41
42
43
44
45
46
47
48
49
50
51
52
53
54
void init(int ac, char **av)
{ int i,j,tmp;
nv = atoi(av[1]);
ohd = malloc(nv*nv*sizeof(int));
mind = malloc(nv*sizeof(int));
notdone = malloc(nv*sizeof(int));
// random graph
for (i = 0; i < nv; i++)
for (j = i; j < nv; j++) {
if (j == i) ohd[i*nv+i] = 0;
else {
ohd[nv*i+j] = rand() % 20;
ohd[nv*j+i] = ohd[nv*i+j];
}
}
for (i = 1; i < nv; i++) {
notdone[i] = 1;
mind[i] = ohd[i];
}
}
55
56
57
58
59
60
61
62
63
64
65
// finds closest to 0 among notdone, among s through e
void findmymin(int s, int e, unsigned *d, int *v)
{ int i;
*d = largeint;
for (i = s; i <= e; i++)
if (notdone[i] && mind[i] < *d) {
*d = ohd[i];
*v = i;
}
}
66
67
68
69
70
71
72
73
74
// for each i in [s,e], ask whether a shorter path to i exists, through
// mv
void updatemind(int s, int e)
{ int i;
for (i = s; i <= e; i++)
if (mind[mv] + ohd[mv*nv+i] < mind[i])
mind[i] = mind[mv] + ohd[mv*nv+i];
}
75
76
77
78
79
80
81
82
void dowork()
{
#pragma omp parallel
{ int startv,endv, // start, end vertices for my thread
step, // whole procedure goes nv steps
me,
mymv; // vertex which attains the min value in my chunk
3.10. PERFORMANCE
unsigned mymd; // min value found by this thread
int i;
me = omp_get_thread_num();
#pragma omp single
{ nth = omp_get_num_threads();
if (nv % nth != 0) {
printf("nv must be divisible by nth\n");
exit(1);
}
chunk = nv/nth;
mymins = malloc(2*nth*sizeof(int));
}
startv = me * chunk;
endv = startv + chunk - 1;
for (step = 0; step < nv; step++) {
// find closest vertex to 0 among notdone; each thread finds
// closest in its group, then we find overall closest
findmymin(startv,endv,&mymd,&mymv);
mymins[2*me] = mymd;
mymins[2*me+1] = mymv;
#pragma omp barrier
// mark new vertex as done
#pragma omp single
{ md = largeint; mv = 0;
for (i = 1; i < nth; i++)
if (mymins[2*i] < md) {
md = mymins[2*i];
mv = mymins[2*i+1];
}
notdone[mv] = 0;
}
// now update my section of mind
updatemind(startv,endv);
#pragma omp barrier
}
83
84
85
86
87
88
89
90
91
92
93
94
95
96
97
98
99
100
101
102
103
104
105
106
107
108
109
110
111
112
113
114
115
116
117
}
118
119
}
120
121
122
123
124
125
126
127
128
129
130
131
132
133
134
135
136
137
138
139
140
int main(int argc, char **argv)
{ int i,j,print;
double startime,endtime;
init(argc,argv);
startime = omp_get_wtime();
// parallel
dowork();
// back to single thread
endtime = omp_get_wtime();
printf("elapsed time: %f\n",endtime-startime);
print = atoi(argv[2]);
if (print) {
printf("graph weights:\n");
for (i = 0; i < nv; i++) {
for (j = 0; j < nv; j++)
printf("%u ",ohd[nv*i+j]);
printf("\n");
}
printf("minimum distances:\n");
for (i = 1; i < nv; i++)
73
74
CHAPTER 3. INTRODUCTION TO OPENMP
printf("%u\n",mind[i]);
141
}
142
143
}
Let’s take a look at the latter part of the code for one iteration;
findmymin(startv,endv,&mymd,&mymv);
mymins[2*me] = mymd;
mymins[2*me+1] = mymv;
#pragma omp barrier
// mark new vertex as done
#pragma omp single
{ notdone[mv] = 0;
for (i = 1; i < nth; i++)
if (mymins[2*i] < md) {
md = mymins[2*i];
mv = mymins[2*i+1];
}
}
// now update my section of mind
updatemind(startv,endv);
#pragma omp barrier
1
2
3
4
5
6
7
8
9
10
11
12
13
14
15
16
The call to findmymin() is as before; this thread finds the closest vertex to 0 among this thread’s range of
vertices. But instead of comparing the result to md and possibly updating it and mv, the thread simply stores
its mymd and mymv in the global array mymins. After all threads have done this and then waited at the
barrier, we have just one thread update md and mv.
Let’s see how well this tack worked:
nv
25000
25000
25000
nth
1
2
4
time
2.546335
1.449387
1.411387
This brought us about a 15% speedup in the two-thread case, though less for four threads.
What else could we do? Here are a few ideas:
• False sharing could be a problem here. To address it, we could make mymins much longer, changing
the places at which the threads write their data, leaving most of the array as padding.
• We could try the modification of our program in Section 3.3.1, in which we use the OpenMP for
pragma, as well as the refinements stated there, such as schedule.
• We could try combining all of the ideas here.
3.11. ANOTHER EXAMPLE
3.10.3
75
OpenMP Internals
We may be able to write faster code if we know a bit about how OpenMP works inside.
You can get some idea of this from your compiler. For example, if you use the -t option with the Omni
compiler, or -k with Ompi, you can inspect the result of the preprocessing of the OpenMP pragmas.
Here for instance is the code produced by Omni from the call to findmymin() in our Dijkstra program:
# 93 "Dijkstra.c"
findmymin(startv,endv,&(mymd),&(mymv));{
_ompc_enter_critical(&__ompc_lock_critical);
# 96 "Dijkstra.c"
if((mymd)<(((unsigned )(md)))){
# 97 "Dijkstra.c"
(md)=(((int )(mymd)));
# 97 "Dijkstra.c"
(mv)=(mymv);
}_ompc_exit_critical(&__ompc_lock_critical);
Fortunately Omni saves the line numbers from our original source file, but the pragmas have been replaced
by calls to OpenMP library functions.
The document, The GNU OpenMP Implementation, http://pl.postech.ac.kr/˜gla/cs700-07f/
ref/openMp/libgomp.pdf, includes good outline of how the pragmas are translated.
3.11
Another Example
Consider a network graph of some kind, such as Web links. For any two vertices, say any two Web sites, we
might be interested in mutual outlinks, i.e. outbound links that are common to two Web sites. The OpenMP
code below finds the mean number of mutual outlinks, among all pairs of sites in a set of Web sites.
1
2
#include <omp.h>
#include <stdio.h>
3
4
5
// OpenMP example: finds mean number of mutual outlinks, among all
// pairs of Web sites in our set
6
7
8
9
10
int n, // number of sites (will assume n is even)
nth, // number of threads (will assume n/2 divisible by nth)
*m, // link matrix
tot = 0; // grand total of matches
11
12
13
14
// processes row pairs (i,i+1), (i,i+2), ...
int procpairs(int i)
{ int j,k,sum=0;
76
for (j = i+1; j < n; j++) {
for (k = 0; k < n; k++)
sum += m[n*i+k] * m[n*j+k];
}
return sum;
15
16
17
18
19
20
CHAPTER 3. INTRODUCTION TO OPENMP
}
21
22
23
24
25
26
27
28
29
30
31
32
33
34
35
36
37
38
39
40
41
42
43
44
45
46
float dowork()
{
#pragma omp parallel
{ int pn1,pn2,i;
int id = omp_get_thread_num();
nth = omp_get_num_threads();
int n2 = n / 2;
int chunk = n2 / nth;
// in checking (i,j) pairs, j > i, this thread will
// process i from pn1 to pn2, inclusive, and the
// "mirror images" of those i
pn1 = id * chunk;
pn2 = pn1 + chunk - 1;
int mysum = 0;
for (i = pn1; i <= pn2; i++) {
mysum += procpairs(i);
mysum += procpairs(n-1-i);
}
#pragma omp atomic
tot += mysum;
#pragma omp barrier
}
int divisor = n * (n-1) / 2;
return ((float) tot)/divisor;
}
47
48
49
50
51
52
53
54
55
56
57
58
59
60
61
62
63
64
65
66
67
68
69
int main(int argc, char **argv)
{
int n2 = n/2,i,j;
n = atoi(argv[1]); // number of matrix rows/cols
int msize = n * n * sizeof(int);
m = (int *) malloc(msize);
// as a test, fill matrix with random 1s and 0s
for (i = 0; i < n; i++) {
m[n*i+i] = 0;
for (j = 0; j < n; j++) {
if (j != i) m[i*n+j] = rand() % 2;
}
}
if (n < 10) {
for (i = 0; i < n; i++) {
for (j = 0; j < n; j++) printf("%d ",m[n*i+j]);
printf("\n");
}
}
tot = 0;
float meanml = dowork();
printf("mean = %f\n",meanml);
}
Chapter 4
Introduction to GPU Programming with
CUDA
Even if you don’t play video games, you can be grateful to the game players, as their numbers have given
rise to a class of highly powerful parallel processing devices—graphics processing units (GPUs). Yes, you
program right on the video card in your computer, even though your program may have nothing to do with
graphics or games.
4.1
Overview
The video game market is so lucrative that the industry has developed ever-faster GPUs, in order to handle
ever-faster and ever-more visually detailed video games. These actually are parallel processing hardware
devices, so around 2003 some people began to wonder if one might use them for parallel processing of
nongraphics applications.
Originally this was cumbersome. One needed to figure out clever ways of mapping one’s application to
some kind of graphics problem, i.e. of way of disguising one’s problem so that it appeared to be doing
graphics computations. Though some high-level interfaces were developed to automate this transformation,
effective coding required some understanding of graphics principles.
But current-generation GPUs separate out the graphics operations, and now consist of multiprocessor elements that run under the familiar shared-memory threads model. Thus they are easily programmable.
Granted, effective coding still requires an intimate knowledge of the hardwre, but at least it’s (more or less)
familiar hardware, not requiring knowledge of graphics.
Moreover, unlike a multicore machine, with the ability to run just a few threads at one time, e.g. four
77
78
CHAPTER 4. INTRODUCTION TO GPU PROGRAMMING WITH CUDA
threads on a quad core machine, GPUs can run hundreds or thousands of threads at once. There are various
restrictions that come with this, but you can see that there is fantastic potential for speed here.
NVIDIA has developed the CUDA language as a vehicle for programming on their GPUs. It’s basically
just a slight extension of C, and has become very popular. More recently, the OpenCL language has been
developed by Apple, AMD and others (including NVIDIA). It too is a slight extension of C, and it aims to
provide a uniform interface that works with multicore machines in addition to GPUs. OpenCL is not yet in
as broad use as CUDA, so our discussion here focuses on CUDA and NVIDIA GPUs.
Also, the discussion will focus on NVIDIA’s Tesla line. There is also a newer, more versatile line called
Fermi, but unless otherwise stated, all statements refer to Tesla.
Some terminology:
• A CUDA program consists of code to be run on the host, i.e. the CPU, and code to run on the device,
i.e. the GPU.
• A function that is called by the host to execute on the device is called a kernel.
• Threads in an application are grouped into blocks. The entirety of blocks is called the grid of that
application.
4.2
Sample Program
Here’s a sample program. And I’ve kept the sample simple: It just finds the sums of all the rows of a matrix.
1
2
3
4
5
6
7
8
9
10
11
12
13
14
15
# i n c l u d e < s t d i o . h>
# i n c l u d e < s t d l i b . h>
# i n c l u d e <c u d a . h>
/ / CUDA e x a m p l e :
f i n d s row sums o f an i n t e g e r m a t r i x m
/ / f i n d 1 e l t ( ) f i n d s t h e rowsum o f one row o f t h e nxn m a t r i x m, s t o r i n g t h e
/ / r e s u l t i n t h e c o r r e s p o n d i n g p o s i t i o n i n t h e rowsum a r r a y r s ; m a t r i x
/ / s t o r e d a s 1− d i m e n s i o n a l , row−m a j o r o r d e r
global
v o i d f i n d 1 e l t ( i n t ∗m, i n t ∗ r s , i n t n )
{
i n t rownum = b l o c k I d x . x ;
//
i n t sum = 0 ;
f o r ( i n t k = 0 ; k < n ; k ++)
t h i s t h r e a d w i l l h a n d l e row # rownum
4.2. SAMPLE PROGRAM
16
17
18 }
19
20 i n t
21 {
22
23
24
25
26
27
28
29
30
31
32
33
34
35
36
37
38
39
40
41
42
43
44
45
46
47
48
49
50
51
52
53
54
55
sum += m[ rownum∗ n+k ] ;
r s [ rownum ] = sum ;
main ( i n t a r g c , c h a r ∗∗ a r g v )
i n t n = a t o i ( argv [ 1 ] ) ;
/ / number o f m a t r i x rows / c o l s
i n t ∗hm , / / h o s t m a t r i x
∗dm , / / d e v i c e m a t r i x
∗ h r s , / / h o s t rowsums
∗ d r s ; / / d e v i c e rowsums
i n t msize = n ∗ n ∗ s i z e o f ( i n t ) ;
/ / s i z e of matrix in bytes
/ / a l l o c a t e space for host matrix
hm = ( i n t ∗ ) m a l l o c ( m s i z e ) ;
/ / as a t e s t , f i l l matrix with consecutive i n t e g e r s
int t = 0,i , j ;
f o r ( i = 0 ; i < n ; i ++) {
f o r ( j = 0 ; j < n ; j ++) {
hm [ i ∗n+ j ] = t ++;
}
}
/ / a l l o c a t e space for device matrix
c u d a M a l l o c ( ( v o i d ∗∗)&dm , m s i z e ) ;
/ / copy h o s t m a t r i x t o d e v i c e m a t r i x
cudaMemcpy ( dm , hm , msize , cudaMemcpyHostToDevice ) ;
/ / a l l o c a t e h o s t , d e v i c e rowsum a r r a y s
int rssize = n ∗ sizeof ( int );
hrs = ( i n t ∗) malloc ( r s s i z e ) ;
c u d a M a l l o c ( ( v o i d ∗∗)& d r s , r s s i z e ) ;
/ / s e t up p a r a m e t e r s f o r t h r e a d s s t r u c t u r e
dim3 d i m G r i d ( n , 1 ) ;
/ / n blocks
dim3 dimBlock ( 1 , 1 , 1 ) ;
/ / 1 thread per block
/ / invoke the kernel
f i n d 1 e l t <<<dimGrid , dimBlock >>>(dm , d r s , n ) ;
/ / wait for kernel to f i n i s h
cudaThreadSynchronize ( ) ;
/ / copy row v e c t o r from d e v i c e t o h o s t
cudaMemcpy ( h r s , d r s , r s s i z e , cudaMemcpyDeviceToHost ) ;
/ / check r e s u l t s
i f ( n < 1 0 ) f o r ( i n t i = 0 ; i <n ; i ++) p r i n t f (”%d \ n ” , h r s [ i ] ) ;
79
80
56
57
58
59
60
61 }
CHAPTER 4. INTRODUCTION TO GPU PROGRAMMING WITH CUDA
/ / c l e a n up
f r e e ( hm ) ;
c u d a F r e e ( dm ) ;
free ( hrs ) ;
cudaFree ( drs ) ;
This is mostly C, with a bit of CUDA added here and there. Here’s how the program works:
• Our main() runs on the host.
• Kernel functions are identified by global void. They are called by the host and run on the device,
thus serving as entries to the device.
We have only one kernel invocation here, but could have many, say with the output of one serving as
input to the next.
• Other functions that will run on the device, called by functions running on the device, must be identified by device , e.g.
__device__ int sumvector(float *x, int n)
Note that unlike kernel functions, device functions can have return values, e.g. int above.
• When a kernel is called, each thread runs it. Each thread receives the same arguments.
• Each block and thread has an ID, stored in programmer-accessible structs blockIdx and threadIdx.
We’ll discuss the details later, but for now, we’ll just note that here the statement
int rownum = blockIdx.x;
picks up the block number, which our code in this example uses to determine which row to sum.
• One calls cudaMalloc() to dynamically allocate space on the device’s memory. Execution of the
statement
cudaMalloc((void **)&drs,rssize);
allocates space on the device, pointed to by drs, a variable in the host’s address space.
The space allocated by a cudaMalloc() call on the device is global to all kernels, and resides in the
global memory of the device (details on memory types later).
One can also allocate device memory statically. For example, the statement
__device int z[100];
4.2. SAMPLE PROGRAM
81
appearing outside any function definition would allocate space on device global memory, with scope
global to all kernels. However, it is not accessible to the host.
• Data is transferred to and from the host and device memories via cudaMemcpy(). The fourth argument specifies the direction, e.g. cudaMemcpyHostToDevice, cudaMemcpyDeviceToHost or cudaMemcpyDeviceToDevice.
• Kernels return void values, so values are returned via a kernel’s arguments.
• Device functions (which we don’t have here) can return values. They are called only by kernel functions or other device functions.
• Note carefully that a call to the kernel doesn’t block; it returns immediately. For that reason, the code
above has a host barrier call, to avoid copying the results back to the host from the device before
they’re ready:
cudaThreadSynchronize();
On the other hand, if our code were to have another kernel call, say on the next line after
find1elt<<<dimGrid,dimBlock>>>(dm,drs,n);
and if some of the second call’s input arguments were the outputs of the first call, there would be an
implied barrier betwwen the two calls; the second would not start execution before the first finished.
Calls like cudaMemcpy() do block until the operation completes.
There is also a thread barrier available for the threads themselves, at the block level. The call is
__syncthreads();
This can only be invoked by threads within a block, not across blocks. In other words, this is barrier
synchronization within blocks.
• I’ve written the program so that each thread will handle one row of the matrix. I’ve chosen to store
the matrix in one-dimensional form in row-major order, and the matrix is of size n x n, so the loop
for (int k = 0; k < n; k++)
sum += m[rownum*n+k];
will indeed traverse the n elements of row number rownum, and compute their sum. That sum is then
placed in the proper element of the output array:
rs[rownum] = sum;
• After the kernel returns, the host must copy the result back from the device memory to the host
memory, in order to access the results of the call.
82
4.3
CHAPTER 4. INTRODUCTION TO GPU PROGRAMMING WITH CUDA
Understanding the Hardware Structure
Scorecards, get your scorecards here! You can’t tell the players without a scorecard—classic cry of vendors
at baseball games
Know thy enemy—Sun Tzu, The Art of War
The enormous computational potential of GPUs cannot be unlocked without an intimate understanding of
the hardware. This of course is a fundamental truism in the parallel processing world, but it is acutely
important for GPU programming. This section presents an overview of the hardware.
4.3.1
Processing Units
A GPU consists of a large set of streaming multiprocessors (SMs); you might say it’s a multi-multiprocessor
machine. Each SM consists of a number of streaming processors (SPs). It is important to understand the
motivation for this hierarchy: Two threads located in different SMs cannot synchronize with each other in
the barrier sense. Though this sounds like a negative at first, it is actually a great advantage, as the independence of threads in separate SMs means that the hardware can run faster. So, if the CUDA application
programmer can write his/her algorithm so as to have certain independent chunks, and those chunks can be
assigned to different SMs (we’ll see how, shortly), then that’s a “win.”
Note that at present, word size is 32 bits. Thus for instance floating-point operations in hardware were
originally in single precision only, though newer devices are capable of double precision.
4.3.2
Thread Operation
GPU operation is highly threaded, and again, understanding of the details of thread operation is key to good
performance.
4.3.2.1
SIMT Architecture
When you write a CUDA application program, you partition the threads into groups called blocks. The
hardware will assign an entire block to a single SM, though several blocks can run in the same SM. The
hardware will then divide a block into warps, 32 threads to a warp. Knowing that the hardware works this
way, the programmer controls the block size and the number of blocks, and in general writes the code to
take advantage of how the hardware works.
The central point is that all the threads in a warp run the code in lockstep. During the machine instruction
fetch cycle, the same instruction will be fetched for all of the threads in the warp. Then in the execution
cycle, each thread will either execute that particular instruction or execute nothing. The execute-nothing
4.3. UNDERSTANDING THE HARDWARE STRUCTURE
83
case occurs in the case of branches; see below. This is the classical single instruction, multiple data
(SIMD) pattern used in some early special-purpose computers such as the ILLIAC; here it is called single
instruction, multiple thread (SIMT).
The syntactic details of grid and block configuration will be presented in Section 4.3.4.
4.3.2.2
The Problem of Thread Divergence
The SIMT nature of thread execution has major implications for performance. Consider what happens with
if/then/else code. If some threads in a warp take the “then” branch and others go in the “else” direction,
they cannot operate in lockstep. That means that some threads must wait while others execute. This renders
the code at that point serial rather than parallel, a situation called thread divergence. As one CUDA Web
tutorial points out, this can be a “performance killer.” (On the other hand, threads in the same block but in
different warps can diverge with no problem.)
4.3.2.3
“OS in Hardware”
Each SM runs the threads on a timesharing basis, just like an operating system (OS). This timesharing is
implemented in the hardware, though, not in software as in the OS case.
The “hardware OS” runs largely in analogy with an ordinary OS:
• A process in an ordinary OS is given a fixed-length timeslice, so that processes take turns running. In
a GPU’s hardware OS, warps take turns running, with fixed-length timeslices.
• With an ordinary OS, if a process reaches an input/output operation, the OS suspends the process
while I/O is pending, even if its turn is not up. The OS then runs some other process instead, so
as to avoid wasting CPU cycles during the long period of time needed for the I/O. With an SM, the
analogous situation occurs when there is a long memory operation, to global memory; if a a warp of
threads needs to access global memory (including local memory), the SM will schedule some other
warp while the memory access is pending.
The hardware support for threads is extremely good; a context switch takes very little time, quite a contrast
to the OS case. Moreover, as noted above, the long latency of global memory may be solvable by having
a lot of threads that the hardware can timeshare to hide that latency; while one warp is fetching data from
memory, another warp can be executing, thus not losing time due to the long fetch delay. For these reasons,
CUDA programmers typically employ a large number of threads, each of which does only a small amount
of work—again, quite a contrast to something like OpenMP.
84
CHAPTER 4. INTRODUCTION TO GPU PROGRAMMING WITH CUDA
4.3.3
Memory Structure
The GPU memory hierarchy plays a key role in performance. Let’s discuss the most important two types of
memory first—shared and global.
4.3.3.1
Shared and Global Memory
Here is a summary:
type
scope
size
location
speed
lifetime
host access?
cached?
shared
glbl. to block
small
on-chip
blinding
kernel
no
no
global
glbl. to app.
large
off-chip
molasses
application
yes
no
In prose form:
• Shared memory: All the threads in an SM share this memory, and use it to communicate among
themselves, just as is the case with threads in CPUs. Access is very fast, as this memory is on-chip. It
is declared inside the kernel, or in the kernel call (details below).
On the other hand, shared memory is small, currently 16K bytes per SM, and the data stored in it are
valid only for the life of the currently-executing kernel. Also, shared memory cannot be accessed by
the host.
• Global memory: This is shared by all the threads in an entire application, and is persistent across
kernel calls, throughout the life of the application, i.e. until the program running on the host exits. It
is usually much larger than shared memory. It is accessible from the host. Pointers to global memory
can (but do not have to) be declared outside the kernel.
On the other hand, global memory is off-chip and very slow, taking hundreds of clock cycles per
access instead of just a few. As noted earlier, this can be ameliorated by exploiting latency hiding; we
will elaborate on this in Section 4.3.3.2.
The reader should pause here and reread the above comparison between shared and global memories. The
key implication is that shared memory is used essentially as a programmer-managed cache. Data will start
out in global memory, but if a variable is to be accessed multiple times by the GPU code, it’s probably better
for the programmer to write code that copies it to shared memory, and then access the copy instead of the
4.3. UNDERSTANDING THE HARDWARE STRUCTURE
85
original. If the variable is changed and is to be eventually transmitted back to the host, the programmer must
include code to copy it back to global memory.
Neither memory type is (hardware) cached.
Accesses to global and shared memory are done via half-warps, i.e. an attempt is made to do all memory
accesses in a half-warp simultaneously. In that sense, only threads in a half-warp run simultaneously, but
the full warp is scheduled to run contemporaneously by the hardware OS, first one half-warp and then the
other.
The host can access global memory via cudaMemcpy(), as seen earlier. It cannot access shared memory.
Here is a typical pattern:
__global__ void abckernel(int *abcglobalmem)
{
__shared__ int abcsharedmem[100];
// ... code to copy some of abcglobalmem to some of abcsharedmem
// ... code for computation
// ... code to copy some of abcsharedmem to some of abcglobalmem
}
Typically you would write the code so that each thread deals with its own portion of the shared data, e.g.
its own portion of abcsharedmem and abcglobalmem above. However, all the threads in that block can
read/write any element in abcsharedmem.
Shared memory consistency (recall Section 2.6) is sequential within a thread, but relaxed among threads in
a block. A write by one thread is not guaranteed to be visible to the others in a block until syncthreads() is
called. On the other hand, writes by a thread will be visible to that same thread in subsequent reads. Among
the implications of this is that if each thread writes only to portions of shared memory that are not read by
other threads in the block, then syncthreads() need not be called.
In the code fragment above, we allocated the shared memory through a C-style declaration:
__shared__ int abcsharedmem[100];
It is also possible to allocate shared memory in the kernel call, along with the block and thread configuration.
Here is an example:
1
2
3
4
5
6
7
\ b e g i n { V e r b a t i m } [ f o n t s i z e =\ r e l s i z e { −2} , numbers = l e f t ]
# i n c l u d e < s t d i o . h>
# i n c l u d e < s t d l i b . h>
# i n c l u d e <c u d a . h>
/ / CUDA e x a m p l e :
i l l u s t r a t e s k e r n e l −a l l o c a t e d s h a r e d memory ; d o e s
/ / n o t h i n g u s e f u l , j u s t c o p y i n g an a r r a y from h o s t t o d e v i c e g l o b a l ,
86
CHAPTER 4. INTRODUCTION TO GPU PROGRAMMING WITH CUDA
8 / / t h e n t o d e v i c e shared , d o u b l i n g i t t h e r e , t h e n copying back t o d e v i c e
9 / / global then host
10
11
global
v o i d d o u b l e i t ( i n t ∗ dv , i n t n )
shared
i n t sv [ ] ;
12 { e x t e r n
13
i n t me = t h r e a d I d x . x ;
14
/ / t h r e a d s s h a r e i n c o p y i n g dv t o sv , w i t h e a c h t h r e a d c o p y i n g one
15
/ / element
16
s v [ me ] = 2 ∗ dv [ me ] ;
17
dv [ me ] = s v [ me ] ;
18 }
19
20 i n t main ( i n t a r g c , c h a r ∗∗ a r g v )
21 {
22
i n t n = a t o i ( argv [ 1 ] ) ;
/ / number o f m a t r i x rows / c o l s
23
i n t ∗hv , / / h o s t a r r a y
24
∗ dv ; / / d e v i c e a r r a y
25
int vsize = n ∗ sizeof ( int );
/ / s i z e of array in bytes
26
/ / a l l o c a t e space for host array
27
hv = ( i n t ∗ ) m a l l o c ( v s i z e ) ;
28
/ / f i l l t e s t array with consecutive i n t e g e r s
29
int t = 0, i ;
30
f o r ( i = 0 ; i < n ; i ++)
31
hv [ i ] = t ++;
32
/ / a l l o c a t e space for device array
33
c u d a M a l l o c ( ( v o i d ∗∗)& dv , v s i z e ) ;
34
/ / copy h o s t a r r a y t o d e v i c e a r r a y
35
cudaMemcpy ( dv , hv , v s i z e , cudaMemcpyHostToDevice ) ;
36
/ / s e t up p a r a m e t e r s f o r t h r e a d s s t r u c t u r e
37
dim3 d i m G r i d ( 1 , 1 ) ;
38
dim3 dimBlock ( n , 1 , 1 ) ;
/ / a l l n t h r e a d s i n t h e same b l o c k
39
/ / i n v o k e t h e k e r n e l ; t h i r d a r g u m e n t i s amount o f s h a r e d memory
40
d o u b l e i t <<<dimGrid , dimBlock , v s i z e >>>(dv , n ) ;
41
/ / wait for kernel to f i n i s h
42
cudaThreadSynchronize ( ) ;
43
/ / copy row a r r a y from d e v i c e t o h o s t
44
cudaMemcpy ( hv , dv , v s i z e , cudaMemcpyDeviceToHost ) ;
45
/ / check r e s u l t s
46
i f ( n < 1 0 ) f o r ( i n t i = 0 ; i <n ; i ++) p r i n t f (”%d \ n ” , hv [ i ] ) ;
47
/ / c l e a n up
4.3. UNDERSTANDING THE HARDWARE STRUCTURE
48
49
50 }
87
f r e e ( hv ) ;
c u d a F r e e ( dv ) ;
Here the variable sv is kernel allocated. It’s declared in the statement
extern __shared__ int sv[];
but actually allocated during the kernel invocation
doubleit<<<dimGrid,dimBlock,vsize>>>(dv,n);
in that third argument within the chevrons, vsize.
Note that one can only directly declare one region of space in this manner. This has two implications:
• Suppose we have two device functions, each declared an extern shared array like this. Those
two arrays will occupy the same place in memory!
• Suppose within one device function, we wish to have two extern
do that literally, but we can share the space via subarrays, e.g.:
shared
arrays. We cannot
int *x = &sv[120];
would set up x as a subarray of sv above, starting at element 120.
One can also set up shared arrays of fixed length in the same code. Declare them before the variable-length
one.
In our example above, the array sv is syntactically local to the function doubleit(), but is shared by all
invocations of that function in the block, thus acting “global” to them in a sense. But the point is that it is
not accessible from within other functions running in that block. In order to achieve the latter situation, a
shared array can be declared outside any function.
4.3.3.2
Global-Memory Performance Issues
As noted, the latency—time to access a single word—for global memory is quite high, on the order of
hundreds of clock cycles. However, the hardware attempts to ameliorate this problem in a couple of ways.
First, as mentioned earlier, if a warp has requested a global memory access that will take a long time, the
harware will schedule another warp to run while the first is waiting for the memory access to complete. This
is an example of a common parallel processing technique called latency hiding.
88
CHAPTER 4. INTRODUCTION TO GPU PROGRAMMING WITH CUDA
Second, the bandwidth to global memory—the number of words accessed per unit time—can be high, due
to hardware actions called coalescing. This simply means that if the hardware sees that the threads in this
half-warp (or at least the ones currently accessing global memory) are accessing consecutive words, the
hardware can execute the memory requests in groups of up to 32 words at a time. This is true for both reads
and writes.
The newer GPUs go even further, coalescing much more general access patterns, not just to consecutive
words.
The programmer may be able to take advantage of coalescing, by a judicious choice of algorithms and/or by
inserting padding into arrays (Section 2.2.2).
4.3.3.3
Shared-Memory Performance Issues
Shared memory memory is divided into banks, in a low-order interleaved manner (recall Section 2.2):
Words with consecutive addresses are stored in consecutive banks, mod the number of banks, i.e. wrapping
back to 0 when hitting the last bank. If for instance there are 8 banks, addresses 0, 8, 16,... will be in bank
0, addresses 1, 9, 17,... will be in bank 1 and so on. (Actually, older devices have 16 banks, while newer
ones have 32.) The fact that all memory accesses in a half-warp are attempted simultaneously implies that
the best access to shared memory arises when the accesses are to different banks.
An exception occurs in broadcast. If all threads in the block wish to read from the same word in the same
bank, the word will be sent to all the requestors simultaneously without conflict. However, if only some
theads try to read the same word, there may or may not be a conflict, as the hardware chooses a bank for
broadcast in some unspecified way.
As in the discussion of global memory above, we should write out code to take advantage of these structures.
The biggest performance issue with shared memory is its size, as little as 16K per SM in many GPU cards.
4.3.3.4
Host/Device Memory Transfer Performance Issues
Copying data between host and device can be a major bottleneck. One way to ameliorate this is to use
cudaMallocHost() instead of malloc() when allocating memory on the host. This sets up page-locked
memory, meaning that it cannot be swapped out by the OS’ virtual memory system. This allows the use of
DMA hardware to do the memory copy, said to make cudaMemcpy() twice as fast.
4.3.3.5
Other Types of Memory
There are also other types of memory. Again, let’s start with a summary:
4.3. UNDERSTANDING THE HARDWARE STRUCTURE
type
registers
local
constant
scope single thread single thread glbl. to app.
location
on-chip
off-chip
off-chip
speed
blinding
molasses
cached
lifetime
kernel
kernel application
host access?
no
no
yes
cached?
no
no
yes
89
• Registers: Each SM has a set of registers. They are much more numerous than in a CPU. Access to
them is very fast, said to be slightly faster than to shared memory.
The compiler normally stores the local variables for a device function in registers, but there are exceptions. An array won’t be placed in registers if the array is too large, or if the array has variable index
values, such as
int z[20],i;
...
y = z[i];
Since registers are not indexable, the compiler cannot allocate z to registers in this case. If on the other
hand, the only code accessing z has constant indices, e.g. z[8], the compiler may put z in registers.
• Local memory: This is physically part of global memory, but is an area within that memory that is
allocated by the compiler for a given thread. As such, it is slow, and accessible only by that thread.
The compiler allocates this memory for local variables in a device function if the compiler cannot
store them in registers. This is called register spill.
• Constant memory: As the name implies, it’s read-only from the device (read/write by the host), for
storing values that will not change. It is off-chip, thus potentially slow, but has a cache on the chip.
At present, the size is 64K.
One designates this memory with constant , as a global variable in the source file. One sets its
contents from the host via cudaMemcpyToSymbol(), For example:
// host code
__constant__ int x;
int y = 3;
cudaMemcpyToSymbol("x",&y,sizeof(int));
...
// device code
int z;
z = x;
Visible to all threads.
• Texture memory: This memory is closer to graphics applications, and is essentially two-dimensional.
It is read-only. It also is off-chip but has an on-chip cache.
90
CHAPTER 4. INTRODUCTION TO GPU PROGRAMMING WITH CUDA
4.3.4
Threads Hierarchy
Following the hardware, threads in CUDA software follow a hierarchy:
• The entirety of threads for an application is called a grid.
• A grid consists of one or more blocks of threads.
• Each block has its own ID within the grid, consisting of an “x coordinate” and a “y coordinate.”
• Likewise each thread has x, y and z coordinates within whichever block it belongs to.
• Just as an ordinary CPU thread needs to be able to sense its ID, e.g. by calling omp get thread num()
in OpenMP, CUDA threads need to do the same. A CUDA thread can access its block ID via the builtin variables blockIdx.x and blockIdx.y, and can access its thread ID within its block via threadIdx.x,
threadIdx.y and threadIdx.z.
• The programmer specifies the grid size (the numbers of rows and columns of blocks within a grid) and
the block size (numbers of rows, columns and layers of threads within a block). In the first example
above, this was done by the code
dim3 dimGrid(n,1);
dim3 dimBlock(1,1,1);
find1elt<<<dimGrid,dimBlock>>>(dm,drs,n);
Here the grid is specified to consist of n (n × 1) blocks, and each block consists of just one (1 × 1 × 1)
thread.
That last line is of course the call to the kernel. As you can see, CUDA extends C syntax to allow
specifying the grid and block sizes. CUDA will store this information in structs of type dim3, in
this case our variables gridDim and blockDim, accessible to the programmer, again with member
variables for the various dimensions, e.g. blockDim.x for the size of the X dimension for the number
of threads per block.
• All threads in a block run in the same SM, though more than one block might be on the same SM.
• The “coordinates” of a block within the grid, and of a thread within a block, are merely abstractions.
If for instance one is programming computation of heat flow across a two-dimensional slab, the programmer may find it clearer to use two-dimensional IDs for the threads. But this does not correspond
to any physical arrangement in the hardware.
As noted, the motivation for the two-dimensional block arrangment is to make coding conceptually simpler
for the programmer if he/she is working an application that is two-dimensional in nature.
4.3. UNDERSTANDING THE HARDWARE STRUCTURE
91
For example, in a matrix application one’s parallel algorithm might be based on partitioning the matrix into
rectangular submatrices (tiles), as we’ll do in Section 9.3. In a small example there, the matrix
1 5 12
A= 0 3 6
4 8 2
(4.1)
is partitioned as
A=
A00 A01
A10 A11
,
(4.2)
where
A00 =
1 5
0 3
,
(4.3)
A01 =
12
6
A10 =
4 8
,
(4.4)
(4.5)
and
A11 =
2
.
(4.6)
We might then have one block of threads handle A00 , another block handle A01 and so on. CUDA’s twodimensional ID system for blocks makes life easier for programmers in such situations.
4.3.5
What’s NOT There
We’re not in Kansas anymore, Toto—character Dorothy Gale in The Wizard of Oz
It looks like C, it feels like C, and for the most part, it is C. But in many ways, it’s quite different from what
you’re used to:
• You don’t have access to the C library, e.g. printf() (the library consists of host machine language,
after all). There are special versions of math functions, however, e.g. sin().
92
CHAPTER 4. INTRODUCTION TO GPU PROGRAMMING WITH CUDA
• No recursion.
• No stack. Functions are essentially inlined, rather than their calls being handled by pushes onto a
stack.
• No pointers to functions.
4.4
Synchronization, Within and Between Blocks
As mentioned earlier, a barrier for the threads in the same block is available by calling syncthreads().
Note carefully that if one thread writes a variable to shared memory and another then reads that variable,
one must call this function (from both threads) in order to get the latest value. Keep in mind that within a
block, different warps will run at different times, making synchronization vital. Remember too that threads
across blocks cannot sync with each other in this manner.
Several atomic operations—read/modify/write actions that a thread can execute without pre-emption, i.e.
without interruption—are available on both global and shared memory. For example, atomicAdd() performs
a fetch-and-add operation, as described in Section 2.7 of this book. The call is
atomicAdd(address of integer variable,inc);
where address of integer variable is the address of the (device) variable to add to, and inc is the amount to
be added. The return value of the function is the value originally at that address before the operation.
There are also atomicExch() (exchange the two operands), atomicCAS() (if the first operand equals the
second, replace the first by the third), atomicMin(), atomicMax(), atomicAnd(), atomicOr(), and so on.
Use -arch=sm 11 when compiling, e.g.
nvcc -g -G yoursrc.cu -arch=sm_11
4.5
Hardware Requirements, Installation, Compilation, Debugging
You do need a suitable NVIDIA video card. There is a list at http://www.nvidia.com/object/
cuda_gpus.html. If you have a Linux system, run lspci to determine what kind you have.
Download the CUDA toolkit from NVIDIA. Just plug “CUDA download” into a Web search engine to find
the site. Install as directed.
You’ll need to set your search and library paths to include the CUDA bin and lib directories.
To compile x.cu (and yes, use the .cu suffix), type
4.6. IMPROVING THE SAMPLE PROGRAM
93
$ nvcc -g -G x.cu
The -g -G options are for setting up debugging, the first for host code, the second for device code. You may
also need to specify
-I/your_CUDA_include_path
to pick up the file cuda.h. Run the code as you normally would.
You may need to take special action to set your library path properly. For example, on Linux machines, set
the environment variable LD LIBRARY PATH to include the CUDA library.
To determine the limits, e.g. maximum number of threads, for your device, use code like this:
cudaDeviceProp *Props;
cudaGetDeviceProperties(&Props,0);
The 0 is for device 0, assuming you only have one device. The return value of cudaGetDeviceProperties() is
a complex C struct whose components are listed at http://developer.download.nvidia.com/
compute/cuda/2_3/toolkit/docs/online/group__CUDART__DEVICE_g5aa4f47938af8276f08074d
html. But I recommend printing it from within GDB to see the values. One of the fields gives clock speed,
which is typically slower than that of the host.
Under older versions of CUDA, such as 2.3, one can debug using GDB as usual. You must compile your
program in emulation mode, using the -deviceemu command-line option. This is no longer available as of
version 3.2. CUDA also includes a special version of GDB, CUDA-GDB (invoked as cuda-gdb) for realtime debugging. However, on Unix-family platforms it runs only if X11 is not running. Short of dedicating
a machine for debugging, you may find it useful to install a version 2.3 in addition to the most recent one to
use for debugging.
4.6
Improving the Sample Program
The issues involving coalescing in Section 4.3.3.2 would suggest that our rowsum code might run faster
with column sums, to take advantage of the memory banking. (So the user would either need to take the
transpose first, or have his code set up so that the matrix is in transpose form to begin with.) As two threads
in the same half-warp march down adjoining columns in lockstep, they will always be accessing adjoining
words in memory.
So, I modified the program accordingly (not shown), and compiled the two versions, as rs and cs, the rowand column-sum versions of the code, respectively.
This did produce a small improvement (confirmed in subsequent runs, needed in any timing experiment):
94
CHAPTER 4. INTRODUCTION TO GPU PROGRAMMING WITH CUDA
pc5:˜/CUDA% time rs 20000
2.585u 1.753s 0:04.54 95.3%
pc5:˜/CUDA% time cs 20000
2.518u 1.814s 0:04.40 98.1%
0+0k 7104+0io 54pf+0w
0+0k 536+0io 5pf+0w
But let’s compare it to a version running only on the CPU,
1
2
3
4
5
6
7
8
9
10
11
12
13
14
15
16
17
18
19
20
21
22
23
24
25
26
27
28
29
30
31
32
33
34
35
# i n c l u d e < s t d i o . h>
# i n c l u d e < s t d l i b . h>
/ / non−CUDA e x a m p l e :
f i n d s c o l sums o f an i n t e g e r m a t r i x m
/ / f i n d 1 e l t ( ) f i n d s t h e c o l s u m o f one c o l o f t h e nxn m a t r i x m, s t o r i n g t h e
/ / r e s u l t i n t h e c o r r e s p o n d i n g p o s i t i o n i n t h e colsum a r r a y cs ; m a t r i x
/ / s t o r e d a s 1− d i m e n s i o n a l , row−m a j o r o r d e r
v o i d f i n d 1 e l t ( i n t ∗m, i n t ∗ cs , i n t n )
{
i n t sum = 0 ;
int topofcol ;
i n t col , k ;
f o r ( c o l = 0 ; c o l < n ; c o l ++) {
topofcol = col ;
sum = 0 ;
f o r ( k = 0 ; k < n ; k ++)
sum += m[ t o p o f c o l +k ∗n ] ;
c s [ c o l ] = sum ;
}
}
i n t main ( i n t a r g c , c h a r ∗∗ a r g v )
{
i n t n = a t o i ( argv [ 1 ] ) ;
/ / number o f m a t r i x c o l s / c o l s
i n t ∗hm , / / h o s t m a t r i x
∗ hcs ; / / host colsums
i n t msize = n ∗ n ∗ s i z e o f ( i n t ) ;
/ / s i z e of matrix in bytes
/ / a l l o c a t e space for host matrix
hm = ( i n t ∗ ) m a l l o c ( m s i z e ) ;
/ / as a t e s t , f i l l matrix with consecutive i n t e g e r s
int t = 0,i , j ;
f o r ( i = 0 ; i < n ; i ++) {
f o r ( j = 0 ; j < n ; j ++) {
4.7. MORE EXAMPLES
36
37
38
39
40
41
42
43
44
45
46 }
95
hm [ i ∗n+ j ] = t ++;
}
}
int cssize = n ∗ sizeof ( int );
hcs = ( i n t ∗) malloc ( c s s i z e ) ;
f i n d 1 e l t ( hm , hcs , n ) ;
i f ( n < 1 0 ) f o r ( i = 0 ; i <n ; i ++) p r i n t f (”%d \ n ” , h c s [ i ] ) ;
/ / c l e a n up
f r e e ( hm ) ;
f r e e ( hcs ) ;
How fast does this non-CUDA version run?
pc5:˜/CUDA% time csc 20000
61.110u 1.719s 1:02.86 99.9%
0+0k 0+0io 0pf+0w
Very impressive! No wonder people talk of CUDA in terms like “a supercomputer on our desktop.” And
remember, this includes the time to copy the matrix from the host to the device (and to copy the output array
back). And we didn’t even try to optimize thread configuration, memory coalescing and bank usage, making
good use of memory hierarchy, etc.
On the other hand, remember that this is an “embarrassingly parallel” application, and in many applications
we may have to settle for a much more modest increase, and work harder to get it.
4.7
4.7.1
More Examples
Finding the Mean Number of Mutual Outlinks
As in Section 3.11, consider a network graph of some kind, such as Web links. For any two vertices, say any
two Web sites, we might be interested in mutual outlinks, i.e. outbound links that are common to two Web
sites. The CUDA code below finds the mean number of mutual outlinks, among all pairs of sites in a set of
Web sites.
1 # i n c l u d e <c u d a . h>
2 # i n c l u d e < s t d i o . h>
3
4 / / CUDA e x a m p l e :
f i n d s mean number o f m u t u a l o u t l i n k s , among a l l p a i r s
5 / / o f Web s i t e s i n o u r s e t
6
96
7
8
9
10
11
12
13
14
15
16
17
18
19
20
21
22
23
24
25
26
27
28
29
30
31
32
33
34
35
36
37
38
39
40
41
42
43
44
45
46
CHAPTER 4. INTRODUCTION TO GPU PROGRAMMING WITH CUDA
/ / f o r a g i v e n t h r e a d number t n , d e t e r m i n e s t h e p a i r o f rows t o be
/ / p r o c e s s e d by t h a t t h r e a d , i n an nxn m a t r i x ; r e t u r n s p o i n t e r t o t h e
/ / p a i r o f row numbers
device
void f i n d p a i r ( i n t tn , i n t n , i n t ∗ p a i r )
{ i n t sum =0 , oldsum =0 , i ;
f o r ( i = 0 ; ; i ++) {
/ / t h e r e w i l l be n−i −1 p a i r s o f t h e form ( i , j ) , j > i
sum += n − i − 1 ;
i f ( t n <= sum −1) {
pair [0] = i ;
p a i r [ 1 ] = t n − oldsum + i + 1 ;
return ;
}
oldsum = sum ;
}
}
/ / p r o c 1 p a i r ( ) p r o c e s s e s one p a i r o f Web s i t e s , i . e . one p a i r o f rows i n
/ / t h e nxn a d j a c e n c y m a t r i x m; t h e number o f m u t u a l o u t l i n k s i s a d d e d t o
// tot
global
v o i d p r o c 1 p a i r ( i n t ∗m, i n t ∗ t o t , i n t n )
{
/ / find ( i , j ) pair to assess for mutuality
int pair [2];
findpair ( threadIdx . x , n , pair );
i n t sum = 0 ;
int startrowa = pair [0] ∗ n ,
startrowb = pair [1] ∗ n ;
f o r ( i n t k = 0 ; k < n ; k ++)
sum += m[ s t a r t r o w a + k ] ∗ m[ s t a r t r o w b + k ] ;
atomicAdd ( t o t , sum ) ;
}
i n t main ( i n t a r g c , c h a r ∗∗ a r g v )
{
i n t n = a t o i ( argv [ 1 ] ) ;
/ / number o f m a t r i x rows / c o l s
i n t ∗hm , / / h o s t m a t r i x
∗dm , / / d e v i c e m a t r i x
htot , / / host grand t o t a l
∗ d t o t ; / / device grand t o t a l
4.7. MORE EXAMPLES
47
48
49
50
51
52
53
54
55
56
57
58
59
60
61
62
63
64
65
66
67
68
69
70
71
72
73
74
75
76
77
78
79
80
81
82
83
84
85
86
i n t msize = n ∗ n ∗ s i z e o f ( i n t ) ;
/ / s i z e of matrix in bytes
/ / a l l o c a t e space for host matrix
hm = ( i n t ∗ ) m a l l o c ( m s i z e ) ;
/ / a s a t e s t , f i l l m a t r i x w i t h random 1 s and 0 s
int i , j ;
f o r ( i = 0 ; i < n ; i ++) {
hm [ n ∗ i + i ] = 0 ;
f o r ( j = 0 ; j < n ; j ++) {
i f ( j ! = i ) hm [ i ∗n+ j ] = r a n d ( ) % 2 ;
}
}
/ / a l l o c a t e space for device matrix
c u d a M a l l o c ( ( v o i d ∗∗)&dm , m s i z e ) ;
/ / copy h o s t m a t r i x t o d e v i c e m a t r i x
cudaMemcpy ( dm , hm , msize , cudaMemcpyHostToDevice ) ;
htot = 0;
/ / s e t up d e v i c e t o t a l and i n i t i a l i z e i t
c u d a M a l l o c ( ( v o i d ∗∗)& d t o t , s i z e o f ( i n t ) ) ;
cudaMemcpy ( d t o t ,& h t o t , s i z e o f ( i n t ) , cudaMemcpyHostToDevice ) ;
/ / s e t up p a r a m e t e r s f o r t h r e a d s s t r u c t u r e
dim3 d i m G r i d ( 1 , 1 ) ;
i n t n p a i r s = n ∗(n −1)/2;
dim3 dimBlock ( n p a i r s , 1 , 1 ) ;
/ / invoke the kernel
p r o c 1 p a i r <<<dimGrid , dimBlock >>>(dm , d t o t , n ) ;
/ / wait for kernel to f i n i s h
cudaThreadSynchronize ( ) ;
/ / copy t o t a l from d e v i c e t o h o s t
cudaMemcpy(& h t o t , d t o t , s i z e o f ( i n t ) , cudaMemcpyDeviceToHost ) ;
/ / check r e s u l t s
i f ( n <= 1 5 ) {
f o r ( i = 0 ; i < n ; i ++) {
f o r ( j = 0 ; j < n ; j ++)
p r i n t f (”%d ” , hm [ n ∗ i + j ] ) ;
p r i n t f (”\ n ” ) ;
}
}
p r i n t f ( ” mean = %f \n ” , h t o t / f l o a t ( n p a i r s ) ) ;
/ / c l e a n up
f r e e ( hm ) ;
97
98
CHAPTER 4. INTRODUCTION TO GPU PROGRAMMING WITH CUDA
87
88
89 }
c u d a F r e e ( dm ) ;
cudaFree ( d t o t ) ;
The main programming issue here is finding a way to partition the various pairs (i,j) to the different threads.
The function findpair() here does that.
Note the use of atomicAdd().
4.7.2
Finding Prime Numbers
The code below finds all the prime numbers from 2 to n.
1
2
3
4
5
6
7
8
9
10
11
12
13
14
15
16
17
18
19
20
21
22
23
24
25
26
27
28
# i n c l u d e < s t d i o . h>
# i n c l u d e < s t d l i b . h>
# i n c l u d e <c u d a . h>
//
//
//
//
//
CUDA e x a m p l e :
i l l u s t r a t i o n o f s h a r e d memory a l l o c a t i o n a t r u n t i m e ;
f i n d s p r i m e s u s i n g c l a s s i c a l S i e v e o f E r a t h o s t h e n e s : make l i s t o f
numbers 2 t o n , t h e n c r o s s o u t a l l m u l t i p l e s o f 2 ( b u t n o t 2 i t s e l f ) ,
then a l l m u l t i p l e s of 3 , e t c . ; whatever i s l e f t over i s prime ; in our
a r r a y , 1 w i l l mean ” n o t c r o s s e d o u t ” and 0 w i l l mean ” c r o s s e d o u t ”
/ / IMPORTANT NOTE : u s e s s h a r e d memory , i n a s i n g l e b l o c k , w i t h o u t
/ / r o t a t i n g p a r t s o f a r r a y i n and o u t o f s h a r e d memory ; t h u s l i m i t e d t o
/ / n <= 4000 i f h a v e 16K s h a r e d memory
/ / i n i t i a l i z e s p r i m e s , 1 s f o r t h e odds , 0 s f o r t h e e v e n s ; s e e s i e v e ( )
/ / fo r the nature of the arguments
device
v o i d i n i t s p ( i n t ∗ s p r i m e s , i n t n , i n t n t h , i n t me )
{
i n t chunk , s t a r t s e t s p , e n d s e t s p , v a l , i ;
sprimes [2] = 1;
/ / d e t e r m i n e s p r i m e s chunk f o r t h i s t h r e a d t o i n i t
chunk = ( n −1) / n t h ;
s t a r t s e t s p = 2 + me∗ chunk ;
i f ( me < n t h −1) e n d s e t s p = s t a r t s e t s p + chunk − 1 ;
else endsetsp = n ;
/ / now do t h e i n i t
val = s t a r t s e t s p % 2;
f o r ( i = s t a r t s e t s p ; i <= e n d s e t s p ; i ++) {
4.7. MORE EXAMPLES
29
30
31
32
33
34
35
36
37
38
39
40
41
42
43
44
45
46
47
48
49
50
51
52
53
54
55
56
57
58
59
60
61
62
63
64
65
66
67
68
99
sprimes [ i ] = val ;
val = 1 − val ;
}
/ / make s u r e s p r i m e s up t o d a t e f o r a l l
syncthreads ();
}
/ / copy s p r i m e s b a c k t o d e v i c e g l o b a l memory ; s e e s i e v e ( ) f o r t h e n a t u r e
/ / of the arguments
device
v o i d c p y t o g l b ( i n t ∗ d p r i m e s , i n t ∗ s p r i m e s , i n t n , i n t n t h , i n t me )
{
i n t s t a r t c p y , endcpy , chunk , i ;
chunk = ( n −1) / n t h ;
s t a r t c p y = 2 + me∗ chunk ;
i f ( me < n t h −1) e n d c p y = s t a r t c p y + chunk − 1 ;
e l s e endcpy = n ;
f o r ( i = s t a r t c p y ; i <= e n d c p y ; i ++) d p r i m e s [ i ] = s p r i m e s [ i ] ;
syncthreads ();
}
/ / f i n d s p r i m e s from 2 t o n , s t o r i n g t h e i n f o r m a t i o n i n d p r i m e s , w i t h
/ / d p r i m e s [ i ] b e i n g 1 i f i i s prime , 0 i f c o m p o s i t e ; n t h i s t h e number
/ / o f t h r e a d s ( t h r e a d D i m somehow n o t r e c o g n i z e d )
global
void s i e v e ( i n t ∗ dprimes , i n t n , i n t nth )
{
extern
shared
i n t sprimes [ ] ;
i n t me = t h r e a d I d x . x ;
i n t nth1 = nth − 1;
/ / i n i t i a l i z e s p r i m e s a r r a y , 1 s f o r odds , 0 f o r e v e n s
i n i t s p ( s p r i m e s , n , n t h , me ) ;
/ / ” c r o s s o u t ” m u l t i p l e s o f v a r i o u s numbers m, w i t h e a c h t h r e a d d o i n g
/ / a chunk o f m’ s ; a l w a y s c h e c k f i r s t t o d e t e r m i n e w h e t h e r m h a s
/ / a l r e a d y b e e n f o u n d t o be c o m p o s i t e ; f i n i s h when m∗m > n
i n t maxmult , m, s t a r t m u l t , e n d m u l t , chunk , i ;
f o r (m = 3 ; m∗m <= n ; m++) {
i f ( s p r i m e s [m] ! = 0 ) {
/ / f i n d l a r g e s t m u l t i p l e o f m t h a t i s <= n
maxmult = n / m;
/ / now p a r t i t i o n 2 , 3 , . . . , maxmult among t h e t h r e a d s
chunk = ( maxmult − 1 ) / n t h ;
100
CHAPTER 4. INTRODUCTION TO GPU PROGRAMMING WITH CUDA
69
s t a r t m u l t = 2 + me∗ chunk ;
70
i f ( me < n t h 1 ) e n d m u l t = s t a r t m u l t + chunk − 1 ;
71
e l s e e n d m u l t = maxmult ;
72
}
73
/ / OK, c r o s s o u t my chunk
74
f o r ( i = s t a r t m u l t ; i <= e n d m u l t ; i ++) s p r i m e s [ i ∗m] = 0 ;
75
}
76
syncthreads ();
77
/ / copy b a c k t o d e v i c e g l o b a l memory f o r r e t u r n t o h o s t
78
c p y t o g l b ( d p r i m e s , s p r i m e s , n , n t h , me ) ;
79 }
80
81 i n t main ( i n t a r g c , c h a r ∗∗ a r g v )
82 {
83
i n t n = a t o i ( argv [ 1 ] ) ,
/ / w i l l f i n d p r i m e s among 1 , . . . , n
84
nth = a t o i ( argv [ 2 ] ) ;
/ / number o f t h r e a d s
85
i n t ∗ hprimes ,
/ / host primes l i s t
86
∗ dprimes ;
/ / device primes l i s t
87
i n t p s i z e = ( n +1) ∗ s i z e o f ( i n t ) ;
/ / s i z e of primes l i s t s in bytes
88
/ / a l l o c a t e space for host l i s t
89
hprimes = ( i n t ∗) malloc ( psize ) ;
90
/ / a l l o c a t e space for device l i s t
91
c u d a M a l l o c ( ( v o i d ∗∗)& d p r i m e s , p s i z e ) ;
92
dim3 d i m G r i d ( 1 , 1 ) ;
93
dim3 dimBlock ( n t h , 1 , 1 ) ;
94
/ / i n v o k e t h e k e r n e l , i n c l u d i n g a r e q u e s t t o a l l o c a t e s h a r e d memory
95
s i e v e <<<dimGrid , dimBlock , p s i z e >>>(d p r i m e s , n , n t h ) ;
96
/ / c h e c k w h e t h e r we a s k e d f o r t o o much s h a r e d memory
97
cudaError t err = cudaGetLastError ( ) ;
98
i f ( e r r ! = c u d a S u c c e s s ) p r i n t f (”% s \ n ” , c u d a G e t E r r o r S t r i n g ( e r r ) ) ;
99
/ / wait for kernel to f i n i s h
100
cudaThreadSynchronize ( ) ;
101
/ / copy l i s t from d e v i c e t o h o s t
102
cudaMemcpy ( h p r i m e s , d p r i m e s , p s i z e , cudaMemcpyDeviceToHost ) ;
103
/ / check r e s u l t s
104
i f ( n <= 1 0 0 0 ) f o r ( i n t i = 2 ; i <=n ; i ++)
105
i f ( h p r i m e s [ i ] == 1 ) p r i n t f (”%d \n ” , i ) ;
106
/ / c l e a n up
107
f r e e ( hprimes ) ;
108
cudaFree ( dprimes ) ;
4.8. CUBLAS
101
109 }
This code has been designed with some thought as to memory speed and thread divergence. Ideally, we
would like to use device shared memory if possible, and to exploit the lockstep, SIMD nature of the hardware.
The code uses the classical Sieve of Erathosthenes, “crossing out” multiples of 2, 3, 5, 7 and so on to get rid
of all the composite numbers. However, the code here differs from that in Section 1.3.1.2, even though both
programs use the Sieve of Erathosthenes.
Say we have just two threads, A and B. In the earlier version, thread A might cross out all multiples of
19 while B handles multiples of 23. In this new version, thread A deals with only some multiples of 19
and B handles the others for 19. Then they both handle their own portions of multiples of 23, and so on.
The thinking here is that the second version will be more amenable to lockstep execution, thus causing less
thread divergence.
Thus in this new version, each thread handles a chunk of multiples of the given prime. Note the contrast of
this with many CUDA examples, in which each thread does only a small amount of work, such as computing
a single element in the product of two matrices.
In order to enhance memory performance, this code uses device shared memory. All the “crossing out” is
done in the shared memory array sprimes, and then when we are all done, that is copied to the device global
memory array dprimes, which is in turn copies to host memory. By the way, note that the amount of shared
memory here is determined dynamically.
However, device shared memory consists only of 16K bytes, which would limit us here to values of n up to
about 4000. Extending the program to work for larger values of n would require some careful planning if
we still wish to use shared memory. Note too that if global memory is not very big, we still would be limited
to fairly small values of n, which would mean that GPU wouldn’t be a good choice.
4.8
CUBLAS
CUDA includes some parallel linear algebra routines callable from straight C code. In other words, you can
get the benefit of GPU in linear algebra contexts without using CUDA.1 Note, though, that in fact you are
using CUDA, behind the scenes.
And indeed, you can mix CUDA and CUBLAS code. Your program might have multiple kernel invocations,
some CUDA and others CUBLAS, with each using data in device global memory that was written by earlier
kernels. Again, remember, the contents of device global memory (including the bindings of variable names)
are persistent across kernel calls in the same application.
1
CUDA also includes a similar package for Fast Fourier Transform computation, CUFFT.
102
CHAPTER 4. INTRODUCTION TO GPU PROGRAMMING WITH CUDA
Below is an example RowSumsCB.c, the matrix row sums example again, this time using CUBLAS. We
can find the vector of row sums of the matrix A by post-multiplying A by a column vector of all 1s.
I compiled the code by typing
gcc -g -I/usr/local/cuda/include -L/usr/local/cuda/lib RowSumsCB.c -lcublas -lcudart
You should modify for your own CUDA locations accordingly. Users who merely wish to use CUBLAS
will find the above more convenient, but if you are mixing CUDA and CUBLAS, you would use nvcc:
nvcc -g -G RowSumsCB.c -lcublas
Here is the code:
1 # i n c l u d e < s t d i o . h>
2 # i n c l u d e <c u b l a s . h> / / r e q u i r e d i n c l u d e
3
4 i n t main ( i n t a r g c , c h a r ∗∗ a r g v )
5 {
6
i n t n = a t o i ( argv [ 1 ] ) ;
/ / number o f m a t r i x rows / c o l s
7
f l o a t ∗hm , / / h o s t m a t r i x
8
∗ h r s , / / h o s t rowsums v e c t o r
9
∗ ones ,
/ / 1s vector for multiply
10
∗dm , / / d e v i c e m a t r i x
11
∗ d r s ; / / d e v i c e rowsums v e c t o r
12
/ / a l l o c a t e s p a c e on h o s t
13
hm = ( f l o a t ∗ ) m a l l o c ( n ∗n ∗ s i z e o f ( f l o a t ) ) ;
14
h r s = ( f l o a t ∗) malloc ( n∗ s i z e o f ( f l o a t ) ) ;
15
ones = ( f l o a t ∗) malloc ( n∗ s i z e o f ( f l o a t ) ) ;
16
/ / a s a t e s t , f i l l hm w i t h c o n s e c u t i v e i n t e g e r s , b u t i n column−m a j o r
17
/ / o r d e r f o r CUBLAS ; a l s o p u t 1 s i n o n e s
18
int i , j ;
19
float t = 0.0;
20
f o r ( i = 0 ; i < n ; i ++) {
21
ones [ i ] = 1 . 0 ;
22
f o r ( j = 0 ; j < n ; j ++)
23
hm [ j ∗n+ i ] = t ++;
24
}
25
cublasInit ();
/ / required i n i t
26
/ / s e t up s p a c e on t h e d e v i c e
27
c u b l a s A l l o c ( n ∗n , s i z e o f ( f l o a t ) , ( v o i d ∗∗)&dm ) ;
4.8. CUBLAS
28
29
30
31
32
33
34
35
36
37
38
39
40
41
42 }
103
c u b l a s A l l o c ( n , s i z e o f ( f l o a t ) , ( v o i d ∗∗)& d r s ) ;
/ / copy d a t a from h o s t t o d e v i c e
c u b l a s S e t M a t r i x ( n , n , s i z e o f ( f l o a t ) , hm , n , dm , n ) ;
c u b l a s S e t V e c t o r ( n , s i z e o f ( f l o a t ) , ones , 1 , d r s , 1 ) ;
/ / matrix times vector
c u b l a s S g e m v ( ’ n ’ , n , n , 1 . 0 , dm , n , d r s , 1 , 0 . 0 , d r s , 1 ) ;
/ / copy r e s u l t b a c k t o h o s t
cublasGetVector ( n , s i z e o f ( f l o a t ) , drs , 1 , hrs , 1 ) ;
/ / check r e s u l t s
i f ( n < 2 0 ) f o r ( i = 0 ; i < n ; i ++) p r i n t f (”% f \ n ” , h r s [ i ] ) ;
/ / c l e a n up on d e v i c e ( s h o u l d c a l l f r e e ( ) on h o s t t o o )
c u b l a s F r e e ( dm ) ;
cublasFree ( drs ) ;
cublasShutdown ( ) ;
As noted in the comments, CUBLAS assumes FORTRAN-style, i.e. column-major orrder, for matrices.
Now that you know the basic format of CUDA calls, the CUBLAS versions will look similar. In the call
cublasAlloc(n*n,sizeof(float),(void**)&dm);
for instance, we are allocating space on the device for an n x n matrix of floats, on the device.
The call
cublasSetMatrix(n,n,sizeof(float),hm,n,dm,n);
is slightly more complicated. Here we are saying that we are copying hm, an n x n matrix of floats on
the host, to dm on the host. The n arguments in the last and third-to-last positions again say that the two
matrices each have n dimensioned rows. This seems redundant, but this is needed in cases of matrix tiling,
where the number of rows of a tile would be less than the number of rows of the matrix as a whole.
The 1s in the call
cublasSetVector(n,sizeof(float),ones,1,drs,1);
are needed for similar reasons. We are saying that in our source vector ones, for example, the elements of
interest are spaced 1 elements apart, i.e. they are contiguous. But if we wanted our vector to be some row in
a matrix with, say, 500 rows, the elements of interesting would be spaced 500 elements apart, again keeping
in mind that column-major order is assumed.
The actual matrix multiplication is done here:
104
CHAPTER 4. INTRODUCTION TO GPU PROGRAMMING WITH CUDA
cublasSgemv(’n’,n,n,1.0,dm,n,drs,1,0.0,drs,1);
The “mv” in “cublasSgemv” stands for “matrix times vector.” Here the call says: no (‘n’), we do not want
the matrix to be transposed; the matrix has n rows and n columns; we wish the matrix to be multiplied by
1.0 (if 0, the multiplication is not actually performed, which we could have here); the matrix is at dm; the
number of dimensioned rows of the matrix is n; the vector is at drs; the elements of the vector are spaced 1
word apart; we wish the vector to not be multiplied by a scalar (see note above); the resulting vector will be
stored at drs, 1 word apart.
Further information is available in the CUBLAS manual.
4.9
Error Checking
Every CUDA call (except for kernel invocations) returns an error code of type cudaError t. One can view
the nature of the error by calling cudaGetErrorString() and printing its output.
For kernel invocations, one can call cudaGetLastError(), which does what its name implies. A call would
typically have the form
cudaError_t err = cudaGetLastError();
if(err != cudaSuccess) printf("%s\n",cudaGetErrorString(err));
You may also wish to cutilSafeCall(), which is used by wrapping your regular CUDA call. It automatically
prints out error messages as above.
Each CUBLAS call returns a potential error code, of type cublasStatus, not checked here.
4.10
The New Generation
The latest GPU architecture from NVIDIA is called Fermi. Many of the advances are of the “bigger and
faster than before” type. These are important, but be sure to note the significant architectural changes,
including:
• Host memory, device global memory and device shared memory share a unifed address space.
• On-chip memory can be apportioned to both shared memory and cache memory. Since shared memory
is in essence a programmer-managed cache, this gives the programmer access to a real cache.
4.11. FURTHER EXAMPLES
4.11
105
Further Examples
There are additional CUDA examples in later sections of this book. These include:2
• Prof. Richard Edgar’s matrix-multiply code, optimized for use of shared memory, Section 9.4.2.2
• odd/even transposition sort, Section 10.3.3, showing a typical CUDA pattern for iterative algorithms
2
If you are reading this presentation on CUDA separately from the book, the book is at http://heather.cs.ucdavis.
edu/˜matloff/158/PLN/ParProcBook.pdf
106
CHAPTER 4. INTRODUCTION TO GPU PROGRAMMING WITH CUDA
Chapter 5
Message Passing Systems
Message passing systems are probably the most common platforms for parallel processing today.
5.1
Overview
Traditionally, shared-memory hardware has been extremely expensive, with a typical system costing hundreds of thousands of dollars. Accordingly, the main users were for very large corporations or government
agencies, with the machines being used for heavy-duty server applications, such as for large databases and
World Wide Web sites. The conventional wisdom is that these applications require the efficiency that good
shared-memory hardware can provide.
But the huge expense of shared-memory machines led to a quest for high-performance message-passing
alternatives, first in hypercubes and then in networks of workstations (NOWs).
The situation changed radically around 2005, when “shared-memory hardware for the masses” became
available in dual-core commodity PCs. Chips of higher core multiplicity are commercially available, with
a decline of price being inevitable. Ordinary users will soon be able to afford shared-memory machines
featuring dozens of processors.
Yet the message-passing paradigm continues to thrive. Many people believe it is more amenable to writing
really fast code, and the the advent of cloud computing has given message-passing a big boost. In addition,
many of the world’s very fastest systems (see www.top500.org for the latest list) are in fact of the
message-passing type.
In this chapter, we take a closer look at this approach to parallel processing.
107
108
5.2
CHAPTER 5. MESSAGE PASSING SYSTEMS
A Historical Example: Hypercubes
A popular class of parallel machines in the 1980s and early 90s was that of hypercubes. Intel sold them,
for example, as did a subsidiary of Oracle, nCube. A hypercube would consist of some number of ordinary
Intel processors, with each processor having some memory and serial I/O hardward for connection to its
“neighbor” processors.
Hypercubes proved to be too expensive for the type of performance they could achieve, and the market was
small anyway. Thus they are not common today, but they are still important, both for historical reasons (in
the computer field, old techniques are often recycled decades later), and because the algorithms developed
for them have become quite popular for use on general machines. In this section we will discuss architecture,
algorithms and software for such machines.
5.2.0.0.1 Definitions A hypercube of dimension d consists of D = 2d processing elements (PEs), i.e.
processor-memory pairs, with fast serial I/O connections between neighboring PEs. We refer to such a cube
as a d-cube.
The PEs in a d-cube will have numbers 0 through D-1. Let (cd−1 , ..., c0 ) be the base-2 representation of a
PE’s number. The PE has fast point-to-point links to d other PEs, which we will call its neighbors. Its ith
neighbor has number (cd−1 , ..., 1 − ci−1 , ..., c0 ).1
For example, consider a hypercube having D = 16, i.e. d = 4. The PE numbered 1011, for instance, would
have four neighbors, 0011, 1111, 1001 and 1010.
It is sometimes helpful to build up a cube from the lower-dimensional cases. To build a (d+1)-dimensional
cube from two d-dimensional cubes, just follow this recipe:
1
Note that we number the digits from right to left, with the rightmost digit being digit 0.
5.2. A HISTORICAL EXAMPLE: HYPERCUBES
109
(a) Take a d-dimensional cube and duplicate it. Call these two cubes subcube 0 and subcube 1.
(b) For each pair of same-numbered PEs in the two subcubes, add a binary digit 0 to the front of the
number for the PE in subcube 0, and add a 1 in the case of subcube 1. Add a link between them.
The following figure shows how a 4-cube can be constructed in this way from two 3-cubes:
Given a PE of number (cd−1 , ..., c0 ) in a d-cube, we will discuss the i-cube to which this PE belongs,
meaning all PEs whose first d-i digits match this PE’s.2 Of all these PEs, the one whose last i digits are all
0s is called the root of this i-cube.
For the 4-cube and PE 1011 mentioned above, for instance, the 2-cube to which that PE belongs consists of
1000, 1001, 1010 and 1011—i.e. all PEs whose first two digits are 10—and the root is 1000.
Given a PE, we can split the i-cube to which it belongs into two (i-1)-subcubes, one consisting of those PEs
whose digit i-1 is 0 (to be called subcube 0), and the other consisting of those PEs whose digit i-1 is 1 (to be
called subcube 1). Each given PE in subcube 0 has as its partner the PE in subcube 1 whose digits match
those of the given PE, except for digit i-1.
To illustrate this, again consider the 4-cube and the PE 1011. As an example, let us look at how the 3-cube
it belongs to will split into two 2-cubes. The 3-cube to which 1011 belongs consists of 1000, 1001, 1010,
1011, 1100, 1101, 1110 and 1111. This 3-cube can be split into two 2-cubes, one being 1000, 1001, 1010
2
Note that this is indeed an i-dimensional cube, because the last i digits are free to vary.
110
CHAPTER 5. MESSAGE PASSING SYSTEMS
and 1011, and the other being 1100, 1101, 1110 and 1111. Then PE 1000 is partners with PE 1100, PE 1001
is partners with PE 1101, and so on.
Each link between two PEs is a dedicated connection, much preferable to the shared link we have when
we run, say, MPI, on a collection of workstations on an Ethernet. On the other hand, if one PE needs to
communicate with a non-neighbor PE, multiple links (as many as d of them) will need to be traversed. Thus
the nature of the communications costs here is much different than for a network of workstations, and this
must be borne in mind when developing programs.
5.3
Networks of Workstations (NOWs)
The idea here is simple: Take a bunch of commodity PCs and network them for use as parallel processing
systems. They are of course individual machines, capable of the usual uniprocessor, nonparallel applications,
but by networking them together and using message-passing software environments such as MPI, we can
form very powerful parallel systems.
The networking does result in a significant loss of performance, but the price/performance ratio in NOW
can be much superior in many applications to that of shared-memory or hypercube hardware of comparable
number of CPUs.
5.3.1
The Network Is Literally the Weakest Link
Still, one factor which can be key to the success of a NOW is to use a fast network, both in terms of hardware
and network protocol. Ordinary Ethernet and TCP/IP are fine for the applications envisioned by the original
designers of the Internet, e.g. e-mail and file transfer, but they are slow in the NOW context.
A popular network for a NOW today is Infiniband (IB) (www.infinibandta.org). It features low
latency, about 1.0-3.0 microseconds, high bandwidth, about 1.0-2.0 gigaBytes per second), and uses a low
amount of the CPU’s cycles, around 5-10%.
The basic building block of IB is a switch, with many inputs and outputs, similar in concept to Ω-net. You
can build arbitrarily large and complex topologies from these switches.
A central point is that IB, as with other high-performance networks designed for NOWs, uses RDMA (Remote Direct Memory Access) read/write, which eliminates the extra copying of data between the application
program’s address space to that of the operating system.
IB has high performance and scalable3 implementations of distributed locks, semaphores, collective communication operations. An atomic operation takes about 3-5 microseconds.
3
The term scalable arises frequently in conversations on parallel processing. It means that this particular method of dealing with
some aspect of parallel processing continues to work well as the system size increases. We say that the method scales.
5.4. SYSTEMS USING NONEXPLICIT MESSAGE-PASSING
111
IB implements true multicast, i.e. the simultaneous sending of messages to many nodes. Note carefully that
even though MPI has its MPI Bcast() function, it will send things out one at a time unless your network
hardware is capable of multicast, and the MPI implementation you use is configured specifically for that
hardware.
For information on network protocols, e.g. for example www.rdmaconsortium.org. A research paper evaluating a tuned implementation of MPI on IB is available at nowlab.cse.ohio-state.edu/
publications/journal-papers/2004/liuj-ijpp04.pdf.
5.3.2
Other Issues
Increasingly today, the workstations themselves are multiprocessor machines, so a NOW really is a hybrid
arrangement. They can be programmed either purely in a message-passing manner—e.g. running eight
MPI processes on four dual-core machines—or in a mixed way, with a shared-memory approach being used
within a workstation but message-passing used between them.
NOWs have become so popular that there are now “recipes” on how to build them for the specific purpose of
parallel processing. The term Beowulf come to mean a NOW, usually with a fast network connecting them,
used for parallel processing. The term NOW itself is no longer in use, replaced by cluster. Software packages
such as ROCKS (http://www.rocksclusters.org/wordpress/) have been developed to make
it easy to set up and administer such systems.
5.4
Systems Using Nonexplicit Message-Passing
Writing message-passing code is a lot of work, as the programmer must explicitly arrange for transfer of
data. Contrast that, for instance, to shared-memory machines, in which cache coherency transactions will
cause data transfers, but which are not arranged by the programmer and not even seen by him/her.
In order to make coding on message-passing machines easier, higher-level systems have been devised. These
basically operate in the scatter/gather paradigm, in which a “manager” node sends out chunks of work to
the other nodes, serving as “workers,” and then collects and assembles the results sent back the workers.
One example of this is R’s snow package, which will be discussed in Section 8.5. But the most common
approach today—and the one attracting the most attention—is MapReduce, to be discussed below.
5.4.1
MapReduce
MapReduce was developed as part of a recently-popularized computational approach known as cloud computing. The idea is that a large corporation that has many computers could sell time on them, thus mak-
112
CHAPTER 5. MESSAGE PASSING SYSTEMS
ing profitable use of excess capacity. The typical customer would have occasional need for large-scale
computing—and often large-scale data storage. The customer would submit a program to the cloud computing vendor, who would run it in parallel on the vendor’s many machines (unseen, thus forming the “cloud”),
then return the output to the customer.
Google, Yahoo! and Amazon, among others, have recently gotten into the cloud computing business. The
open-source application of choice for this is Hadoop, an implementation of MapReduce.
The key issue, of course, is the parallelizability of the inherently serial code. But all the user need do is
provide code to break the data into chunks, code to work on a chunk, and code to collect the outputs from
the chunks back into the overall output of the program.
For this to work, the program’s data usage pattern must have a simple, regular structure, as in these examples:
Example 1: Suppose we wish to list all the words used in a file, together with the counts of the numbers
of instances of the words. If we have 100000 lines in the file and 10 processors, we could divide the file
into chunks of 10000 lines each, have each processor run code to do the word counts in its chunk, and then
combine the results.
Example 2: Suppose we wish to multiply an nx1 vector X by an nxn matrix A. Say n = 100000, and again
we have 10 processors. We could divide A into chunks of 10000 rows each, have each processor multiply X
by its chunk, and then combine the outputs.
To illustrate this, here is a pseudocode summary of a word-count program written in Python by Michael Noll;
see http://www.michael-noll.com/wiki/Writing_An_Hadoop_MapReduce_Program_
In_Python. Actually Hadoop is really written for Java applications. However, Hadoop can work with programs in any language under Hadoop’s Streaming option, by reading from STDIN and writing to STDOUT.
This does cause some slowdown in numeric programs, for the conversion of strings to numbers and vice
versa.4
mapper.py:
1
2
3
4
for each line in STDIN
break line into words, placed in wordarray
for each word in wordarray
print word, ’1’ to STDOUT # we have found 1 instance of the word
reducer.py:
1
2
3
4
# dictionary will consist of (word,count) pairs
dictionary = empty
for each line in STDIN
split line into word, thiscount
4
In the case of Python, we could also run Jython, a Python interpreter that produces Java byte code. Hadoop also offers
communication via Unix pipes.
5.4. SYSTEMS USING NONEXPLICIT MESSAGE-PASSING
5
6
7
8
9
113
if word not in dictionary:
add (word,thiscount) to dictionary
else
change (word,count) entry to (word,count+thiscount)
print dictionary to STDOUT
Note that these two user programs have nothing in them at all regarding parallelism. Instead, the process
works as follows:
• the user provides Hadoop the original data file, by copying the file to Hadoop’s own file system, the
Hadoop Distributed File System (HDFS)
• the user provides Hadoop with the mapper and reducer programs; Hadoop runs several instances of
the mapper and one instance of the reducer
• Hadoop forms chunks by forming groups of lines in the file
• Hadoop has each instance of the mapper program work on a chunk:
mapper.py < chunk > outputchunk
# output is replicated and sent to the various instances of reducer
• Hadoop runs
reducer.py < outputchunk > myfinalchunk
# in this way final output is distributed to the nodes in HDFS
In the matrix-multiply model, the mapper program would produce chunks of X, together with the corresponding row numbers. Then the reducer program would sort the rows by row number, and place the result
in X.
Note too that by having the file in HDFS, we minimize communications costs in shipping the data. “Moving
computation is cheaper than moving data.”
Hadoop also incorporates rather sophisticated fault tolerance mechanisms. If a node goes down, the show
goes on.
Note again that this works well only on problems of a certain structure. Also, some say that the idea has been
overpromoted; see for instance “MapReduce: A Major Step Backwards,” The Database Column, by Professor David DeWitt, http://www.databasecolumn.com/2008/01/mapreduce-a-major-step-back.
html
114
CHAPTER 5. MESSAGE PASSING SYSTEMS
Chapter 6
Introduction to MPI
MPI is the de facto standard for message-passing software.
6.1
6.1.1
Overview
History
Though (small) shared-memory machines have come down radically in price, to the point at which a dualcore PC is now commonplace in the home, historically shared-memory machines were available only to the
“very rich”—large banks, national research labs and so on. This led to interest in message-passing machines.
The first “affordable” message-machine type was the Hypercube, developed by a physics professor at Cal
Tech. It consisted of a number of processing elements (PEs) connected by fast serial I/O cards. This was
in the range of university departmental research labs. It was later commercialized by Intel and NCube.
Later, the notion of networks of workstations (NOWs) became popular. Here the PEs were entirely independent PCs, connected via a standard network. This was refined a bit, by the use of more suitable network
hardware and protocols, with the new term being clusters.
All of this necessitated the development of standardized software tools based on a message-passing paradigm.
The first popular such tool was Parallel Virtual Machine (PVM). It still has its adherents today, but has
largely been supplanted by the Message Passing Interface (MPI).
MPI itself later became MPI 2. Our document here is intended mainly for the original.
115
116
6.1.2
CHAPTER 6. INTRODUCTION TO MPI
Structure and Execution
MPI is merely a set of Application Programmer Interfaces (APIs), called from user programs written in C,
C++ and other languages. It has many implementations, with some being open source and generic, while
others are proprietary and fine-tuned for specific commercial hardware.
Suppose we have written an MPI program x, and will run it on four machines in a cluster. Each machine will
be running its own copy of x. Official MPI terminology refers to this as four processes. Now that multicore
machines are commonplace, one might indeed run two or more cooperating MPI processes—where now we
use the term processes in the real OS sense—on the same multicore machine. In this document, we will tend
to refer to the various MPI processes as nodes, with an eye to the cluster setting.
Though the nodes are all running the same program, they will likely be working on different parts of the program’s data. This is called the Single Program Multiple Data (SPMD) model. This is the typical approach,
but there could be different programs running on different nodes. Most of the APIs involve a node sending
information to, or receiving information from, other nodes.
6.1.3
Implementations
Two of the most popular implementations of MPI are MPICH and LAM. MPICH offers more tailoring to
various networks and other platforms, while LAM runs on networks. Introductions to MPICH and LAM can
be found, for example, at http://heather.cs.ucdavis.edu/˜matloff/MPI/NotesMPICH.
NM.html and http://heather.cs.ucdavis.edu/˜matloff/MPI/NotesLAM.NM.html, respectively.
LAM is no longer being developed, and has been replaced by Open MPI (not to be confused with OpenMP).
Personally, I still prefer the simplicity of LAM. It is still being maintained.
6.1.4
Performance Issues
Mere usage of a parallel language on a parallel platform does not guarantee a performance improvement
over a serial version of your program. The central issue here is the overhead involved in internode communication.
Infiniband, one of the fastest cluster networks commercially available, has a latency of about 1.0-3.0 microseconds, meaning that it takes the first bit of a packet that long to get from one node on an Infiniband
switch to another. Comparing that to the nanosecond time scale of CPU speeds, one can see that the communications overhead can destroy a program’s performance. And Ethernet is quite a bit slower than Infiniband.
Latency is quite different from bandwidth, which is the number of bits sent per second. Say the latency is 1.0
microsecond and the bandwidth is 1 gigabit, i.e. 1000000000 bits per second or 1000 bits per microsecond.
6.2. EARLIER EXAMPLE
117
Say the message is 2000 bits long. Then the first bit of the message arrives after 1 microsecond, and the
last bit arrives after an additional 2 microseconds. In other words, the message is does not arrive fully at the
destination until 3 microseconds after it is sent.
In the same setting, say bandwidth is 10 gigabits. Now the message would need 1.2 seconds to arrive fully,
in spite of a 10-fold increase in bandwidth. So latency is a major problem even if the bandwidth is high.
For this reason, the MPI applications that run well on networks tend to be of the “embarrassingly parallel”
type, with very little communication between the processes.
Of course, if your platform is a shared-memory multiprocessor (especially a multicore one, where communication between cores is particularly fast) and you are running all your MPI processes on that machine, the
problem is less severe. In fact, some implementations of MPI communicate directly through shared memory
in that case, rather than using the TCP/IP or other network protocol.
6.2
Earlier Example
Though the presentation in this chapter is self-contained, you may wish to look first at the somewhat simpler
example in Section 1.3.2.2, a pipelined prime number finder.
6.3
6.3.1
Running Example
The Algorithm
The code implements the Dijkstra algorithm for finding the shortest paths in an undirected graph. Pseudocode for the algorithm is
1
2
3
4
5
6
7
8
9
10
11
Done = {0}
NonDone = {1,2,...,N-1}
for J = 1 to N-1 Dist[J] = infinity‘
Dist[0] = 0
for Step = 1 to N-1
find J such that Dist[J] is min among all J in NonDone
transfer J from NonDone to Done
NewDone = J
for K = 1 to N-1
if K is in NonDone
Dist[K] = min(Dist[K],Dist[NewDone]+G[NewDone,K])
At each iteration, the algorithm finds the closest vertex J to 0 among all those not yet processed, and then
updates the list of minimum distances to each vertex from 0 by considering paths that go through J. Two
118
CHAPTER 6. INTRODUCTION TO MPI
obvious potential candidate part of the algorithm for parallelization are the “find J” and “for K” lines, and
the above OpenMP code takes this approach.
6.3.2
1
The Code
// Dijkstra.c
2
3
4
5
// MPI example program: Dijkstra shortest-path finder in a
// bidirectional graph; finds the shortest path from vertex 0 to all
// others
6
7
// command line arguments:
nv print dbg
8
9
10
11
// where: nv is the size of the graph; print is 1 if graph and min
// distances are to be printed out, 0 otherwise; and dbg is 1 or 0, 1
// for debug
12
13
14
// node 0 will both participate in the computation and serve as a
// "manager"
15
16
17
#include <stdio.h>
#include <mpi.h>
18
19
20
21
#define MYMIN_MSG 0
#define OVRLMIN_MSG 1
#define COLLECT_MSG 2
22
23
// global variables (but of course not shared across nodes)
24
25
26
27
28
29
30
31
32
33
34
35
36
37
38
39
40
41
42
int nv, // number of vertices
*notdone, // vertices not checked yet
nnodes, // number of MPI nodes in the computation
chunk, // number of vertices handled by each node
startv,endv, // start, end vertices for this node
me, // my node number
dbg;
unsigned largeint, // max possible unsigned int
mymin[2], // mymin[0] is min for my chunk,
// mymin[1] is vertex which achieves that min
othermin[2], // othermin[0] is min over the other chunks
// (used by node 0 only)
// othermin[1] is vertex which achieves that min
overallmin[2], // overallmin[0] is current min over all nodes,
// overallmin[1] is vertex which achieves that min
*ohd, // 1-hop distances between vertices; "ohd[i][j]" is
// ohd[i*nv+j]
*mind; // min distances found so far
43
44
double T1,T2;
// start and finish times
45
46
47
48
49
50
void init(int ac, char **av)
{ int i,j,tmp; unsigned u;
nv = atoi(av[1]);
dbg = atoi(av[3]);
MPI_Init(&ac,&av);
6.3. RUNNING EXAMPLE
MPI_Comm_size(MPI_COMM_WORLD,&nnodes);
MPI_Comm_rank(MPI_COMM_WORLD,&me);
chunk = nv/nnodes;
startv = me * chunk;
endv = startv + chunk - 1;
u = -1;
largeint = u >> 1;
ohd = malloc(nv*nv*sizeof(int));
mind = malloc(nv*sizeof(int));
notdone = malloc(nv*sizeof(int));
// random graph
// note that this will be generated at all nodes; could generate just
// at node 0 and then send to others, but faster this way
srand(9999);
for (i = 0; i < nv; i++)
for (j = i; j < nv; j++) {
if (j == i) ohd[i*nv+i] = 0;
else {
ohd[nv*i+j] = rand() % 20;
ohd[nv*j+i] = ohd[nv*i+j];
}
}
for (i = 0; i < nv; i++) {
notdone[i] = 1;
mind[i] = largeint;
}
mind[0] = 0;
while (dbg) ; // stalling so can attach debugger
51
52
53
54
55
56
57
58
59
60
61
62
63
64
65
66
67
68
69
70
71
72
73
74
75
76
77
78
79
}
80
81
82
83
84
85
86
87
88
89
90
// finds closest to 0 among notdone, among startv through endv
void findmymin()
{ int i;
mymin[0] = largeint;
for (i = startv; i <= endv; i++)
if (notdone[i] && mind[i] < mymin[0]) {
mymin[0] = mind[i];
mymin[1] = i;
}
}
91
92
93
94
95
96
97
98
99
100
101
102
103
104
105
106
107
108
void findoverallmin()
{ int i;
MPI_Status status; // describes result of MPI_Recv() call
// nodes other than 0 report their mins to node 0, which receives
// them and updates its value for the global min
if (me > 0)
MPI_Send(mymin,2,MPI_INT,0,MYMIN_MSG,MPI_COMM_WORLD);
else {
// check my own first
overallmin[0] = mymin[0];
overallmin[1] = mymin[1];
// check the others
for (i = 1; i < nnodes; i++) {
MPI_Recv(othermin,2,MPI_INT,i,MYMIN_MSG,MPI_COMM_WORLD,&status);
if (othermin[0] < overallmin[0]) {
overallmin[0] = othermin[0];
overallmin[1] = othermin[1];
119
120
CHAPTER 6. INTRODUCTION TO MPI
}
109
}
110
}
111
112
}
113
114
115
116
117
118
119
120
121
122
void updatemymind() // update my mind segment
{ // for each i in [startv,endv], ask whether a shorter path to i
// exists, through mv
int i, mv = overallmin[1];
unsigned md = overallmin[0];
for (i = startv; i <= endv; i++)
if (md + ohd[mv*nv+i] < mind[i])
mind[i] = md + ohd[mv*nv+i];
}
123
124
125
126
127
128
129
130
131
132
void disseminateoverallmin()
{ int i;
MPI_Status status;
if (me == 0)
for (i = 1; i < nnodes; i++)
MPI_Send(overallmin,2,MPI_INT,i,OVRLMIN_MSG,MPI_COMM_WORLD);
else
MPI_Recv(overallmin,2,MPI_INT,0,OVRLMIN_MSG,MPI_COMM_WORLD,&status);
}
133
134
135
136
137
138
139
140
141
142
143
void updateallmind() // collects all the mind segments at node 0
{ int i;
MPI_Status status;
if (me > 0)
MPI_Send(mind+startv,chunk,MPI_INT,0,COLLECT_MSG,MPI_COMM_WORLD);
else
for (i = 1; i < nnodes; i++)
MPI_Recv(mind+i*chunk,chunk,MPI_INT,i,COLLECT_MSG,MPI_COMM_WORLD,
&status);
}
144
145
146
147
148
149
150
void printmind() // partly for debugging (call from GDB)
{ int i;
printf("minimum distances:\n");
for (i = 1; i < nv; i++)
printf("%u\n",mind[i]);
}
151
152
153
154
155
156
157
158
159
160
161
162
163
164
165
166
void dowork()
{ int step, // index for loop of nv steps
i;
if (me == 0) T1 = MPI_Wtime();
for (step = 0; step < nv; step++) {
findmymin();
findoverallmin();
disseminateoverallmin();
// mark new vertex as done
notdone[overallmin[1]] = 0;
updatemymind(startv,endv);
}
updateallmind();
T2 = MPI_Wtime();
}
6.3. RUNNING EXAMPLE
121
167
168
169
170
171
172
173
174
175
176
177
178
179
180
181
182
183
184
int main(int ac, char **av)
{ int i,j,print;
init(ac,av);
dowork();
print = atoi(av[2]);
if (print && me == 0) {
printf("graph weights:\n");
for (i = 0; i < nv; i++) {
for (j = 0; j < nv; j++)
printf("%u ",ohd[nv*i+j]);
printf("\n");
}
printmind();
}
if (me == 0) printf("time at node 0: %f\n",(float)(T2-T1));
MPI_Finalize();
}
185
The various MPI functions will be explained in the next section.
6.3.3
6.3.3.1
Introduction to MPI APIs
MPI Init() and MPI Finalize()
These are required for starting and ending execution of an MPI program. Their actions may be implementationdependent. For instance, if our platform is an Ethernet-based cluster , MPI Init() will probably set up the
TCP/IP sockets via which the various nodes communicate with each other. On an Infiniband-based cluster,
connections in the special Infiniband network protocol will be established. On a shared-memory multiprocessor, an implementation of MPI that is tailored to that platform would take very different actions.
6.3.3.2
MPI Comm size() and MPI Comm rank()
In our function init() above, note the calls
MPI_Comm_size(MPI_COMM_WORLD,&nnodes);
MPI_Comm_rank(MPI_COMM_WORLD,&me);
The first call determines how many nodes are participating in our computation, placing the result in our
variable nnodes. Here MPI COMM WORLD is our node group, termed a communicator in MPI parlance. MPI allows the programmer to subdivide the nodes into groups, to facilitate performance and clarity
of code. Note that for some operations, such as barriers, the only way to apply the operation to a proper
122
CHAPTER 6. INTRODUCTION TO MPI
subset of all nodes is to form a group. The totality of all groups is denoted by MPI COMM WORLD. In
our program here, we are not subdividing into groups.
The second call determines this node’s ID number, called its rank, within its group. As mentioned earlier,
even though the nodes are all running the same program, they are typically working on different parts of the
program’s data. So, the program needs to be able to sense which node it is running on, so as to access the
appropriate data. Here we record that information in our variable me.
6.3.3.3
MPI Send()
To see how MPI’s basic send function works, consider our line above,
MPI_Send(mymin,2,MPI_INT,0,MYMIN_MSG,MPI_COMM_WORLD);
Let’s look at the arguments:
mymin: We are sending a set of bytes. This argument states the address at which these bytes begin.
2, MPI INT: This says that our set of bytes to be sent consists of 2 objects of type MPI INT. That means 8 bytes
on 32-bit machines, so why not just collapse these two arguments to one, namely the number 8? Why
did the designers of MPI bother to define data types? The answer is that we want to be able to run MPI
on a heterogeneous set of machines, with MPI serving as the “broker” between them in case different
architectures among those machines handle data differently.
First of all, there is the issue of endianness. Intel machines, for instance, are little-endian, which
means that the least significant byte of a memory word has the smallest address among bytes of the
word. Sun SPARC chips, on the other hand, are big-endian, with the opposite storage scheme. If
our set of nodes included machines of both types, straight transmission of sequences of 8 bytes might
mean that some of the machines literally receive the data backwards!
Secondly, these days 64-bit machines are becoming more and more common. Again, if our set of
nodes were to include both 32-bit and 64-bit words, some major problems would occur if no conversion were done.
0: We are sending to node 0.
MYMIN MSG: This is the message type, programmer-defined in our line
#define MYMIN_MSG 0
Receive calls, described in the next section, can ask to receive only messages of a certain type.
I COMM WORLD: This is the node group to which the message is to be sent. Above, where we said we are sending to
node 0, we technically should say we are sending to node 0 within the group MPI COMM WORLD.
6.4. COLLECTIVE COMMUNICATIONS
6.3.3.4
123
MPI Recv()
Let’s now look at the arguments for a basic receive:
MPI_Recv(othermin,2,MPI_INT,i,MYMIN_MSG,MPI_COMM_WORLD,&status);
othermin: The received message is to be placed at our location othermin.
2,MPI INT: Two objects of MPI INT type are to be received.
i: Receive only messages of from node i. If we did not care what node we received a message from, we
could specify the value MPI ANY SOURCE.
MYMIN MSG: Receive only messages of type MYMIN MSG. If we did not care what type of message we received,
we would specify the value MPI ANY TAG.
I COMM WORLD: Group name.
status: Recall our line
MPI_Status status;
// describes result of MPI_Recv() call
The type is an MPI struct containing information about the received message. Its primary fields of
interest are MPI SOURCE, which contains the identity of the sending node, and MPI TAG, which
contains the message type. These would be useful if the receive had been done with MPI ANY SOURCE
or MPI ANY TAG; the status argument would then tell us which node sent the message and what
type the message was.
6.4
Collective Communications
MPI features a number of collective communication capabilities, a number of which are used in the following refinement of our Dijkstra program:
6.4.1
1
Example
// Dijkstra.coll1.c
2
3
4
5
// MPI example program: Dijkstra shortest-path finder in a
// bidirectional graph; finds the shortest path from vertex 0 to all
// others; this version uses collective communication
6
7
// command line arguments:
nv print dbg
124
CHAPTER 6. INTRODUCTION TO MPI
8
9
10
11
// where: nv is the size of the graph; print is 1 if graph and min
// distances are to be printed out, 0 otherwise; and dbg is 1 or 0, 1
// for debug
12
13
14
// node 0 will both participate in the computation and serve as a
// "manager"
15
16
17
#include <stdio.h>
#include <mpi.h>
18
19
// global variables (but of course not shared across nodes)
20
21
22
23
24
25
26
27
28
29
30
31
32
33
34
35
int nv, // number of vertices
*notdone, // vertices not checked yet
nnodes, // number of MPI nodes in the computation
chunk, // number of vertices handled by each node
startv,endv, // start, end vertices for this node
me, // my node number
dbg;
unsigned largeint, // max possible unsigned int
mymin[2], // mymin[0] is min for my chunk,
// mymin[1] is vertex which achieves that min
overallmin[2], // overallmin[0] is current min over all nodes,
// overallmin[1] is vertex which achieves that min
*ohd, // 1-hop distances between vertices; "ohd[i][j]" is
// ohd[i*nv+j]
*mind; // min distances found so far
36
37
double T1,T2;
// start and finish times
38
39
40
41
42
43
44
45
46
47
48
49
50
51
52
53
54
55
56
57
58
59
60
61
62
63
64
65
void init(int ac, char **av)
{ int i,j,tmp; unsigned u;
nv = atoi(av[1]);
dbg = atoi(av[3]);
MPI_Init(&ac,&av);
MPI_Comm_size(MPI_COMM_WORLD,&nnodes);
MPI_Comm_rank(MPI_COMM_WORLD,&me);
chunk = nv/nnodes;
startv = me * chunk;
endv = startv + chunk - 1;
u = -1;
largeint = u >> 1;
ohd = malloc(nv*nv*sizeof(int));
mind = malloc(nv*sizeof(int));
notdone = malloc(nv*sizeof(int));
// random graph
// note that this will be generated at all nodes; could generate just
// at node 0 and then send to others, but faster this way
srand(9999);
for (i = 0; i < nv; i++)
for (j = i; j < nv; j++) {
if (j == i) ohd[i*nv+i] = 0;
else {
ohd[nv*i+j] = rand() % 20;
ohd[nv*j+i] = ohd[nv*i+j];
}
}
6.4. COLLECTIVE COMMUNICATIONS
for (i = 0; i < nv; i++) {
notdone[i] = 1;
mind[i] = largeint;
}
mind[0] = 0;
while (dbg) ; // stalling so can attach debugger
66
67
68
69
70
71
72
}
73
74
75
76
77
78
79
80
81
82
83
// finds closest to 0 among notdone, among startv through endv
void findmymin()
{ int i;
mymin[0] = largeint;
for (i = startv; i <= endv; i++)
if (notdone[i] && mind[i] < mymin[0]) {
mymin[0] = mind[i];
mymin[1] = i;
}
}
84
85
86
87
88
89
90
91
92
93
void updatemymind() // update my mind segment
{ // for each i in [startv,endv], ask whether a shorter path to i
// exists, through mv
int i, mv = overallmin[1];
unsigned md = overallmin[0];
for (i = startv; i <= endv; i++)
if (md + ohd[mv*nv+i] < mind[i])
mind[i] = md + ohd[mv*nv+i];
}
94
95
96
97
98
99
100
void printmind() // partly for debugging (call from GDB)
{ int i;
printf("minimum distances:\n");
for (i = 1; i < nv; i++)
printf("%u\n",mind[i]);
}
101
102
103
104
105
106
107
108
109
110
111
112
113
114
115
116
117
void dowork()
{ int step, // index for loop of nv steps
i;
if (me == 0) T1 = MPI_Wtime();
for (step = 0; step < nv; step++) {
findmymin();
MPI_Reduce(mymin,overallmin,1,MPI_2INT,MPI_MINLOC,0,MPI_COMM_WORLD);
MPI_Bcast(overallmin,1,MPI_2INT,0,MPI_COMM_WORLD);
// mark new vertex as done
notdone[overallmin[1]] = 0;
updatemymind(startv,endv);
}
// now need to collect all the mind values from other nodes to node 0
MPI_Gather(mind+startv,chunk,MPI_INT,mind,chunk,MPI_INT,0,MPI_COMM_WORLD);
T2 = MPI_Wtime();
}
118
119
120
121
122
123
int main(int ac, char **av)
{ int i,j,print;
init(ac,av);
dowork();
print = atoi(av[2]);
125
126
if (print && me == 0) {
printf("graph weights:\n");
for (i = 0; i < nv; i++) {
for (j = 0; j < nv; j++)
printf("%u ",ohd[nv*i+j]);
printf("\n");
}
printmind();
}
if (me == 0) printf("time at node 0: %f\n",(float)(T2-T1));
MPI_Finalize();
124
125
126
127
128
129
130
131
132
133
134
135
CHAPTER 6. INTRODUCTION TO MPI
}
The new calls will be explained in the next section.
6.4.2
MPI Bcast()
In our original Dijkstra example, we had a loop
for (i = 1; i < nnodes; i++)
MPI_Send(overallmin,2,MPI_INT,i,OVRLMIN_MSG,MPI_COMM_WORLD);
in which node 0 sends to all other nodes. We can replace this by
MPI_Bcast(overallmin,2,MPI_INT,0,MPI_COMM_WORLD);
In English, this call would say,
At this point all nodes participate in a broadcast operation, in which node 0 sends 2 objects of
type MPI INT. The source of the data will be located at address overallmin at node 0, and the
other nodes will receive the data at a location of that name.
Note my word “participate” above. The name of the function is “broadcast,” which makes it sound like only
node 0 executes this line of code, which is not the case; all the nodes in the group (in this case that means all
nodes in our entire computation) execute this line. The only difference is the action; most nodes participate
by receiving, while node 0 participates by sending.
Actually, this call to MPI Bcast() is doing more than replacing the loop, since the latter had been part of an
if-then-else that checked whether the given process had rank 0 or not.
Why might this be preferable to using an explicit loop? First, it would obviously be much clearer. That
makes the program easier to write, easier to debug, and easier for others (and ourselves, later) to read.
6.4. COLLECTIVE COMMUNICATIONS
127
But even more importantly, using the broadcast may improve performance. We may, for instance, be using
an implementation of MPI which is tailored to the platform on which we are running MPI. If for instance
we are running on a network designed for parallel computing, such as Myrinet or Infiniband, an optimized
broadcast may achieve a much higher performance level than would simply a loop with individual send
calls. On a shared-memory multiprocessor system, special machine instructions specific to that platform’s
architecture can be exploited, as for instance IBM has done for its shared-memory machines. Even on
an ordinary Ethernet, one could exploit Ethernet’s own broadcast mechanism, as had been done for PVM,
a system like MPI (G. Davies and N. Matloff, Network-Specific Performance Enhancements for PVM,
Proceedings of the Fourth IEEE International Symposium on High-Performance Distributed Computing,
1995, 205-210).
6.4.2.1
MPI Reduce()/MPI Allreduce()
Look at our call
MPI_Reduce(mymin,overallmin,1,MPI_2INT,MPI_MINLOC,0,MPI_COMM_WORLD);
above. In English, this would say,
At this point all nodes in this group participate in a “reduce” operation. The type of reduce
operation is MPI MINLOC, which means that the minimum value among the nodes will be
computed, and the index attaining that minimum will be recorded as well. Each node contributes
a value to be checked, and an associated index, from a location mymin in their programs; the
type of the pair is MPI 2INT. The overall min value/index will be computed by combining all
of these values at node 0, where they will be placed at a location overallmin.
MPI also includes a function MPI Allreduce(), which does the same operation, except that instead of just
depositing the result at one node, it does so at all nodes. So for instance our code above,
MPI_Reduce(mymin,overallmin,1,MPI_2INT,MPI_MINLOC,0,MPI_COMM_WORLD);
MPI_Bcast(overallmin,1,MPI_2INT,0,MPI_COMM_WORLD);
could be replaced by
MPI_Allreduce(mymin,overallmin,1,MPI_2INT,MPI_MINLOC,MPI_COMM_WORLD);
Again, these can be optimized for particular platforms.
Here is a table of MPI reduce operations:
128
CHAPTER 6. INTRODUCTION TO MPI
MPI MAX
MPI MIN
MPI SUM
MPI PROD
MPI LAND
MPI LOR
MPI LXOR
MPI BAND
MPI BOR
MPI BXOR
MPI MAXLOC
MPI MINLOC
6.4.2.2
max
min
sum
product
wordwise boolean and
wordwise boolean or
wordwise exclusive or
bitwise boolean and
bitwise boolean or
bitwise exclusive or
max value and location or
min value and location or
MPI Gather()/MPI Allgather()
A classical approach to parallel computation is to first break the data for the application into chunks, then
have each node work on its chunk, and then gather all the processed chunks together at some node. The MPI
function MPI Gather() does this.
In our program above, look at the line
MPI_Gather(mind+startv,chunk,MPI_INT,mind,chunk,MPI_INT,0,MPI_COMM_WORLD);
In English, this says,
At this point all nodes participate in a gather operation, in which each node contributes data,
consisting of chunk number of MPI integers, from a location mind+startv in its program. All
that data is strung together and deposited at the location mind in the program running at node
0.
There is also MPI Allgather(), which places the result at all nodes, not just one.
6.4.2.3
The MPI Scatter()
This is the opposite of MPI Gather(), i.e. it breaks long data into chunks which it parcels out to individual
nodes.
Here is MPI code to count the number of edges in a directed graph. (A link from i to j does not necessarily
imply one from j to i.) In the context here, me is the node’s rank; nv is the number of vertices; oh is the
one-hop distance matrix; and nnodes is the number of MPI processes. At the beginning only the process of
rank 0 has a copy of oh, but it sends that matrix out in chunks to the other nodes, each of which stores its
chunk in an array ohchunk.
6.4. COLLECTIVE COMMUNICATIONS
1
2
3
4
5
6
7
129
MPI_Scatter(oh, nv*nv, MPI_INT, ohchunk, nv/nnodes, MPI_INT, 0,
MPI_COMM_WORLD);
mycount = 0;
for (i = 0; i < nv*nv/nnodes)
if (ohchunk[i] != 0) mycount++;
MPI_Reduce(&mycount,&numedge,1,MPI_INT,MPI_SUM,0,MPI_COMM_WORLD);
if (me == 0) printf("there are %d edges\n",numedge);
6.4.2.4
The MPI Barrier()
This implements a barrier for a given communicator. The name of the communicator is the sole argument
for the function.
Explicit barriers are less common in message-passing programs than in the shared-memory world.
6.4.3
Creating Communicators
Again, a communicator is a subset (either proper or improper) of all of our nodes. MPI includes a number
of functions for use in creating communicators. Some set up a virtual “topology” among the nodes.
For instance, many physics problems consist of solving differential equations in two- or three-dimensional
space, via approximation on a grid of points. In two dimensions, groups may consists of rows in the grid.
Here’s how we might divide an MPI run into two groups (assumes an even number of MPI processes to
begin with):
MPI_Comm_size(MPI_COMM_WORLD,&nnodes);
MPI_Comm_rank(MPI_COMM_WORLD,&me);
...
// declare variables to bind to groups
MPI_Group worldgroup, subgroup;
// declare variable to bind to a communicator
MPI_Comm subcomm;
...
int i,startrank,nn2 = nnodes/2;
int *subranks = malloc(nn2*sizeof(int));
if (me < nn2) start = 0;
else start = nn2;
for (i = 0; i < nn2; i++)
subranks[i] = i + start;
// bind the world to a group variable
MPI_Comm_group(MPI_COMM_WORLD, &worldgroup);
// take worldgroup the nn2 ranks in "subranks" and form group
// "subgroup" from them
MPI_Group_incl(worldgroup, nn2, subranks, subgroup);
// create a communicator for that new group
MPI_Comm_create(MPI_COMM_WORLD, subgroup, subcomm);
// get my rank in this new group
MPI_Group_rank (subgroup, &subme);
130
CHAPTER 6. INTRODUCTION TO MPI
You would then use subcomm instead of MPI COMM WORLD whenever you wish to, say, broadcast, only
to that group.
6.5
Buffering, Synchrony and Related Issues
As noted several times so far, interprocess communication in parallel systems can be quite expensive in
terms of time delay. In this section we will consider some issues which can be extremely important in this
regard.
6.5.1
Buffering, Etc.
To understand this point, first consider situations in which MPI is running on some network, under the
TCP/IP protocol. Say an MPI program at node A is sending to one at node B.
It is extremely import to keep in mind the levels of abstraction here. The OS’s TCP/IP stack is running at
the Session, Transport and Network layers of the network. MPI—meaning the MPI internals—is running
above the TCP/IP stack, in the Application layers at A and B. And the MPI user-written application could
be considered to be running at a “Super-application” layer, since it calls the MPI internals. (From here on,
we will refer to the MPI internals as simply “MPI.”)
MPI at node A will have set up a TCP/IP socket to B during the user program’s call to MPI Init(). The
other end of the socket will be a corresponding one at B. This setting up of this socket pair as establishing a
connection between A and B. When node A calls MPI Send(), MPI will write to the socket, and the TCP/IP
stack will transmit that data to the TCP/IP socket at B. The TCP/IP stack at B will then send whatever bytes
come in to MPI at B.
Now, it is important to keep in mind that in TCP/IP the totality of bytes sent by A to B during lifetime of the
connection is considered one long message. So for instance if the MPI program at A calls MPI Send() five
times, the MPI internals will write to the socket five times, but the bytes from those five messages will not
be perceived by the TCP/IP stack at B as five messages, but rather as just one long message (in fact, only
part of one long message, since more may be yet to come).
MPI at B continually reads that “long message” and breaks it back into MPI messages, keeping them ready
for calls to MPI Recv() from the MPI application program at B. Note carefully that phrase, keeping them
ready; it refers to the fact that the order in which the MPI application program requests those messages may
be different from the order in which they arrive.
On the other hand, looking again at the TCP/IP level, even though all the bytes sent are considered one long
message, it will physically be sent out in pieces. These pieces don’t correspond to the pieces written to the
socket, i.e. the MPI messages. Rather, the breaking into pieces is done for the purpose of flow control,
meaning that the TCP/IP stack at A will not send data to the one at B if the OS at B has no room for it. The
6.5. BUFFERING, SYNCHRONY AND RELATED ISSUES
131
buffer space the OS at B has set up for receiving data is limited. As A is sending to B, the TCP layer at B
is telling its counterpart at A when A is allowed to send more data.
Think of what happens the MPI application at B calls MPI Recv(), requesting to receive from A, with a
certain tag T. Say the first argument is named x, i.e. the data to be received is to be deposited at x. If MPI
sees that it already has a message of tag T, it will have its MPI Recv() function return the message to the
caller, i.e. to the MPI application at B. If no such message has arrived yet, MPI won’t return to the caller
yet, and thus the caller blocks.
MPI Send() can block too. If the platform and MPI implementation is that of the TCP/IP network context
described above, then the send call will return when its call to the OS’ write() (or equivalent, depending on
OS) returns, but that could be delayed if the OS’ buffer space is full. On the other hand, another implementation could require a positive response from B before allowing the send call to return.
Note that buffering slows everything down. In our TCP scenario above, MPI Recv() at B must copy messages from the OS’ buffer space to the MPI application program’s program variables, e.g. x above. This is
definitely a blow to performance. That in fact is why networks developed specially for parallel processing
typically include mechanisms to avoid the copying. Infiniband, for example, has a Remote Direct Memory
Access capability, meaning that A can write directly to x at B. Of course, if our implementation uses synchronous communication, with A’s send call not returning until A gets a response from B, we must wait
even longer.
Technically, the MPI standard states that MPI Send(x,...) will return only when it is safe for the application
program to write over the array which it is using to store its message, i.e. x. As we have seen, there are
various ways to implement this, with performance implications. Similarly, MPI Recv(y,...) will return only
when it is safe to read y.
6.5.2
Safety
With synchronous communication, deadlock is a real risk. Say A wants to send two messages to B, of types
U and V, but that B wants to receive V first. Then A won’t even get to send V, because in preparing to send
U it must wait for a notice from B that B wants to read U—a notice which will never come, because B sends
such a notice for V first. This would not occur if the communication were asynchronous.
But beyond formal deadlock, programs can fail in other ways, even with buffering, as buffer space is always
by nature finite. A program can fail if it runs out of buffer space, either at the sender or the receiver. See
www.llnl.gov/computing/tutorials/mpi_performance/samples/unsafe.c for an example of a test program which demonstrates this on a certain platform, by deliberating overwhelming the
buffers at the receiver.
In MPI terminology, asynchronous communication is considered unsafe. The program may run fine on
most systems, as most systems are buffered, but fail on some systems. Of course, as long as you know your
132
CHAPTER 6. INTRODUCTION TO MPI
program won’t be run in nonbuffered settings, it’s fine, and since there is potentially such a performance
penalty for doing things synchronously, most people are willing to go ahead with their “unsafe” code.
6.5.3
Living Dangerously
If one is sure that there will be no problems of buffer overflow and so on, one can use variant send and
receive calls provided by MPI, such as MPI Isend() and MPI Irecv(). The key difference between them
and MPI Send() and MPI Recv() is that they return immediately, and thus are termed nonblocking. Your
code can go on and do other things, not having to wait.
This does mean that at A you cannot touch the data you are sending until you determine that it has either been
buffered somewhere or has reached x at B. Similarly, at B you can’t use the data at x until you determine that
it has arrived. Such determinations can be made via MPI Wait(). In other words, you can do your send or
receive, then perform some other computations for a while, and then call MPI Wait() to determine whether
you can go on. Or you can call MPI Probe() to ask whether the operation has completed yet.
6.5.4
Safe Exchange Operations
In many applications A and B are swapping data, so both are sending and both are receiving. This too can
lead to deadlock. An obvious solution would be, for instance, to have the lower-rank node send first and the
higher-rank node receive first.
But a more convenient, safer and possibly faster alternative would be to use MPI’s MPI Sendrecv() function. Its prototype is
intMPI_Sendrecv_replace(void* buf, int count, MPI_Datatype datatype,
int dest, int sendtag, int source, int recvtag, MPI_Comm comm,
MPI_Status *status)
Note that the sent and received messages can be of different lengths and can use different tags.
6.6
Use of MPI from Other Languages
MPI is a vehicle for parallelizing C/C++, but some clever people have extended the concept to other languages, such as the cases of Python and R that we treat in Chapters 13 and 8.
Chapter 7
The Parallel Prefix Problem
An operation that arises in a variety of parallel algorithms is that of prefix (or scan). In its abstract form, it
inputs a sequence of objects (x0 , ..., xn−1 ), and outputs (s0 , ..., sn−1 ), where
sn−1
s0 = x0 ,
s 1 = x0 ⊗ x1 ,
...,
= x0 ⊗ x1 ⊗ ... ⊗ xn−1
(7.1)
where ⊗ is some associative operator.
That’s pretty abstract. The most concrete example would be that in which ⊗ is + and the objects are numbers.
The scan of (12,5,13) would then be (12,12+5,12+5+13) = (12,17,30).
This is called an inclusive scan, in which xi is included in si . The exclusive version of the above example
would be (0,12,17).
More examples will arise in succeeding chapters, but we’ll present one in the next section in order to illustrate the versatility of the prefix approach.
7.1
Example
An easily explained but more involved example than addition of numbers is well known: Find the Fibonacci
numbers fn , where
f0 = f1 = 1
133
(7.2)
134
CHAPTER 7. THE PARALLEL PREFIX PROBLEM
and
fn = fn−1 + fn−2 , n > 1
(7.3)
The point is that (7.3) can be couched in matrix terms as
fn+1
fn
=A
fn
(7.4)
fn−1
where
A=
1 1
1 0
(7.5)
Given the initial conditions (7.2) and (7.4), we have
fn+1
fn
=A
n−1
1
1
(7.6)
In other words, our problem reduces to one of finding the scan of the set A, A2 , ..., An−1 , with matrix
multiplication as our associative operator.
Note that among other things, this example shows that in finding a scan,
• the elements might be nonscalars, in this case matrices
• the associative operator need not be commutative
On the other hand, this is not a very good example in the sense that all the xi are identical past i = 0, each
being equal to A, with x0 being I. The problem with this is that in the parallel implementation presented
below, lots of duplicate work would be done.
A better example would be permutations. Say we have the vector (12,5,13,8,88). Applying the permutation
(2,1,0,3,4) would say the old element 0 becomes element 2, the old element 2 becomes element 0, and all
the rest stay the same. The result would be (13,5,12,8,88).
This too can be cast in matrix terms, by representing any permutation as a matrix multiplication. We just
7.2. GENERAL PARALLEL STRATEGIES
135
apply the permutation to the identity matrix I, so that the above example becomes
(12, 5, 13, 8, 88)
0
0
1
0
0
0
1
0
0
0
1
0
0
0
0
0
0
0
1
0
0
0
0
0
1
= (13, 5, 12, 8, 88)
(7.7)
So here x0 would be the identity matrix, xi for i > 0 would be the ith permutation matrix, and ⊗ would be
matrix multiplication.
Note, however, that although we’ve couched the problem in terms of matrix multiplication, these are sparse
matrices. We would thus write out code to actually just use the 1s.
7.2
General Parallel Strategies
For the time being, we’ll assume we have n threads, i.e. one for each datum. Clearly this condition will
often not hold, so we’ll extend things later.
We’ll describe what is known as a data parallel solution to the prefix problem.
Here’s the basic idea, say for n = 8:
Step 1:
Step 2:
x1 ← x0 + x1
(7.8)
x2 ← x1 + x2
(7.9)
x3 ← x2 + x3
(7.10)
x4 ← x3 + x4
(7.11)
x5 ← x4 + x5
(7.12)
x6 ← x5 + x6
(7.13)
x7 ← x6 + x7
(7.14)
136
CHAPTER 7. THE PARALLEL PREFIX PROBLEM
x2 ← x0 + x2
(7.15)
x3 ← x1 + x3
(7.16)
x4 ← x2 + x4
(7.17)
x5 ← x3 + x5
(7.18)
x6 ← x4 + x6
(7.19)
x7 ← x5 + x7
(7.20)
x4 ← x0 + x4
(7.21)
x5 ← x1 + x5
(7.22)
x6 ← x2 + x6
(7.23)
x7 ← x3 + x7
(7.24)
Step 3:
In Step 1, we look at elements that are 1 apart, then 2 apart, then 4.
Why does this work? Well, consider how the contents of x7 evolve over time. Let ai be the original xi , i =
0,1,...,n-1. Then here is x7 at the various steps:
step
1
2
3
contents
a6 + a7
a4 + a5 + a6 + a7
a0 + a1 + a2 + a3 + a4 + a5 + a6 + a7
Similarly, after Step 3, the contents of x7 will be a0 + a1 + a2 + a3 + a4 + a5 + a6 (check it!). So, in the
end, the locations of xi will indeed contain the prefix sums.
For general n, the routing is as follows. At Step i, each xj is routed both to itself and to xj+2i−1 , for
j >= 2i−1 . (Some threads, more in each step, are idle.)
There will be log2 n steps. This works even if n is not a power of 2, in which case the number of steps is
blog2 nc.
Note two important points:
• The location xi appears both as an input and an output in the assignment operations above. We need
to take care that the location is not written to before its value is read. One way to do this is to set up
an auxiliary array yi . In odd-numbered steps, the yi are written to with the xi as inputs, and vice versa
for the even-numbered steps.
7.3. IMPLEMENTATIONS
137
• As noted above, as time goes on, more and more threads are idle. Thus load balancing is poor.
• Synchronization at each step incurs overhead in a multicore/multiprocessr setting. (Worse for GPU if
multiple blocks are used).
Now, what if n is greater than p, our number of threads? Let Ti denote thread i. The standard approach is:
break the array into p blocks
parallel for i = 0,...,p-1
Ti does scan of block i, resulting in Si
form new array G of rightmost elements of each Si
do parallel scan of G
parallel for i = 1,...,p-1
Ti adds Gi to each element of block i
For example, say we have the array
2 25 26 8 50 3 1 11 7 9 29 10
and three threads. We break the data into three sections,
2 25 26 8
50 3 1 11
7 9 29 10
and then apply a scan to each section:
2 27 53 61
50 53 54 65
7 16 45 55
But we still don’t have the scan of the array overall. That 50, for instance, should be 61+50 = 111 and the 53
should be 61+53 = 114. In other words, 61 must be added to that second section, (50,53,54,65), and 61+65
= 126 must be added to the third section, (7,16,45,55). This then is the last step, yielding
2 27 53 61
111 114 115 126
133 142 171 181
Another possible approach would be make n “fake” threads FTj. Each Ti plays the role of n/p of the FTj.
The FTj then do the parallel scan as at the beginning of this section. Key point: Whenever a Ti becomes
idle, it is assigned to help other Tk.
7.3
Implementations
The MPI standard actually includes built-in parallel prefix functions, MPI Scan(). A number of choices are
offered for ⊗, such as maximum, minimum, sum, product etc.
138
CHAPTER 7. THE PARALLEL PREFIX PROBLEM
The CUDPP (CUDA Data Parallel Primitives Library) package contains CUDA functions for sorting and
other operations, many of which are based on parallel scan. See http://gpgpu.org/developer/
cudpp for the library code, and a detailed analysis of optimizing parallel prefix in a GPU context in the
book GPU Gems 3, available either in bookstores or free online at http://developer.nvidia.com/
object/gpu_gems_home.html.
Chapter 8
Introduction to Parallel R
(The placement of this chapter was chosen in order to facilitate those that follow. R has built-in matrix
and complex number types, so it will make it easier to illustrate some of the concepts. The main language,
though, will continue to be C.)
R is a widely used programming language for statistics and data manipulation. Given that huge statistical
problems—in either running time, size of data or both—have become commonplace today, a number of
“parallel R” packages have been developed.
It should be noted, though, that parallel R packages tend to work well only on embarrassingly parallel
problems (Sec. 1.5.3). This of course is often true for many parallel processing platforms, but is especially
so in the case of R. The functional programming nature of R implies that technically, any vector or matrix
write, say
x [ 3 ] <− 8
means that the entire vector or matrix is rewritten.1 There are exceptions to this, but generally we must
accept that vector and matrix code will be expensive.
8.1
Quick Introductions to R
See http://heather.cs.ucdavis.edu/r.html.
1
Element assignment in R is a function call, with arguments in the above case being x, 3 and 8.
139
140
CHAPTER 8. INTRODUCTION TO PARALLEL R
8.2
Some Parallel R Packages
Here are a few parallel R packages:
• Message-passing or quasi-message passing: Rmpi, snow, foreach
• Shared-memory: Rdsm, bigmemory
• GPU: gputools, rgpu
A far more extensive list is at http://cran.r-project.org/web/views/HighPerformanceComputing.
html.
Some of these packages will be covered in the following sections.
8.3
Installing the Packages
With the exception of Rgpu, all of the packages above are downloadable/installable from CRAN, the official
R repository for contributed code. Here’s what to do, say for Rmpi:
Suppose you want to install in the directory /a/b/c/. The easiest way to do so is use R’s install.packages()
function, say:
> i n s t a l l . p a c k a g e s ( ” Rmpi ” , ” / a / b / c / ” )
This will install Rmpi in the directory /a/b/c/Rmpi.
You’ll need to arrange for the directory /a/b/c (not /a/b/c/Rmpi) to be added to your R library search path.
I recommend placing a line
. libPaths (”/ a /b/ c /”)
in a file .Rprofile in your home directory (this is an R startup file).
In some cases, due to issues such as locations of libraries, you may need to install a CRAN package “by
hand.” See Section 8.7.1 and 8.7.3 below.
8.4
Rmpi
The Rmpi package provides an interface from R to MPI. (MPI is covered in detail in Chapter 6. Its author
is Hao Yu of the University of Western Ontario.
8.4. RMPI
141
It is arguably the most versatile of the parallel R packages, as it allows any node to communicate directly
with any other node, without passing through a “middleman.” (The latter is the manager program in snow,
and the server in Rdsm.) This could enable major reductions in communications costs, and thus major
increases in speed.
On the other hand, coding in Rmpi generally requires more work than for the other packages. In addition,
MPI is quite finicky, and subtle errors in your setup may prevent it from running; that problem may be
compounded if you run R and MPI together. (In online R discussion groups, one of the most common types
of queries concerns getting Rmpi to run.)
8.4.1
Usage
Fire up MPI, and then from R load in Rmpi, by typing
> l i b r a r y ( Rmpi )
Then start Rmpi:
> mpi . spawn . R s l a v e s ( )
On some systems, the call to mpi.spawn.Rslaves() may encounter problems. An alternate method of launching the worker processes is to copy the Rprofile file in the Rmpi distribution to .Rprofile in your home
directory. Then start R, say for two workers and a manager, by running something like (for the LAM case)
m p i r u n −c 3 R −−no−s a v e −q
This will start R on all machines in the group you started MPI on.
8.4.2
Available Functions
Most standard MPI functions are available, as well as many extras. Here are just a few examples:
• mpi.comm.size():
Returns the number of MPI processes, including the master that spawned the other processes.
• mpi.comm.rank():
Returns the rank of the process that executes it.
• mpi.send(), mpi.recv():
The usual send/receive operations.
142
CHAPTER 8. INTRODUCTION TO PARALLEL R
• mpi.bcast(), mpi.scatter(), mpi.gather():
The usual broadcast, scatter and gather operations.
8.4.3
Example: Inversion of a Diagonal-Block Matrix
Suppose we have a block-diagonal matrix, such as
1
3
0
0
2
4
0
0
0
0
8
1
0
0
1
5
and we wish to find its inverse. This is an embarrassingly parallel problem: If we have two processes,
we simply have one process invert that first 2x2 submatrix, have the second process invert the second 2x2
submatrix, and we then place the inverses back in the same diagonal positions. In addition, the granularity
here should be fairly coarse, since inversion of an nxn matrix takes O(n3 ) time while communication is only
O(n2 ).
Below is the Rmpi code, for general n x n matrices of this form, but to keep this introductory example
simple, we’ll assume that there are only two blocks, of the same size, with n/2 rows and n/2 columns:
1 p a r i n v <− f u n c t i o n ( b l k d g ) {
2
n <− nrow ( b l k d g )
3
k <− n / 2 # b l o c k s i z e
4
# send t h e worker i t s t a s k f u n c t i o n
5
mpi . b c a s t . R o b j 2 s l a v e ( b k i n v )
6
# g e t worker s t a r t e d running i t s t a s k
7
mpi . b c a s t . cmd ( b k i n v ( ) )
8
# send worker d a t a to feed i t s t a s k
9
mpi . s e n d . Robj ( b l k d g [ ( k + 1 ) : n , ( k + 1 ) : n ] , d e s t =1 , t a g = 1 )
10
# prepare output matrix
11
o u t m a t <− m a t r i x ( r e p ( 0 , n ˆ 2 ) , nrow=n , n c o l =n )
12
# manager d o e s i t s t a s k
13
o u t m a t [ 1 : k , 1 : k ] <− s o l v e ( b l k d g [ 1 : k , 1 : k ] )
14
# r e c e i v e r e s u l t from w o r k e r and p l a c e i n o u t p u t m a t r i x
15
o u t m a t [ ( k + 1 ) : n , ( k + 1 ) : n ] <−
16
mpi . r e c v . Robj ( s o u r c e =1 , t a g = 2 )
17
r e t u r n ( outmat )
18 }
19
8.5. THE R SNOW PACKAGE
143
20 # f u n c t i o n f o r w o r k e r t o e x e c u t e
21 b k i n v <− f u n c t i o n ( ) {
22
# r e c e i v e d a t a from manager
23
b l k <− mpi . r e c v . Robj ( s o u r c e =0 , t a g = 1 )
24
# i n v e r t m a t r i x and s e n d b a c k t o manager
25
mpi . s e n d . Robj ( s o l v e ( b l k ) , d e s t =0 , t a g = 2 )
26 }
27
28 t e s t <− f u n c t i o n ( ) {
29
nb <− 800
30
nb1 <− nb +1
31
nbx2 <− 2∗ nb
32
b l k <− m a t r i x ( r u n i f ( nb ˆ 2 ) , nrow=nb )
33
mat <− m a t r i x ( r e p ( 0 , nbx2 ˆ 2 ) , nrow=nbx2 )
34
mat [ 1 : nb , 1 : nb ] <− b l k
35
mat [ nb1 : nbx2 , nb1 : nbx2 ] <− b l k
36
p r i n t ( s y s t e m . t i m e ( p a r i n v ( mat ) ) )
37
p r i n t ( s y s t e m . t i m e ( s o l v e ( mat ) ) )
38 }
8.5
The R snow Package
The real virtue of snow is its simplicity. The concept is simple, the implementation is simple, and very little
can go wrong. Accordingly, it may be the most popular type of parallel R in use today.
The snow package runs on top of Rmpi or directly via sockets,2 allowing the programmer to more conveniently express the parallel disposition of work. It operates under a scatter/gather model (Sec. 5.4).
For instance, just as the ordinary R function apply() applies the same function to all rows of a matrix
(example below), the snow function parApply() does that in parallel, across multiple machines; different
machines will work on different rows.
8.5.1
Usage
Load snow:
> l i b r a r y ( snow )
2
As mentioned earlier, Rmpi may be difficult to get to run. The beginner might consider using the sockets approach, and then
later trying the Rmpi method if greater efficiency is neeed.
144
CHAPTER 8. INTRODUCTION TO PARALLEL R
One then sets up a cluster, by calling the snow function makeCluster(). The named argument type of that
function indicates the networking platform, e.g. “MPI,” “PVM” or “SOCK.” The last indicates that you wish
snow to run on TCP/IP sockets that it creates itself, rather than going through MPI or PVM. In the examples
here, I used “SOCK,” on machines named pc48 and pc49, setting up the cluster this way:3
> c l s <− m a k e C l u s t e r ( t y p e =”SOCK” , c ( ” pc48 ” , ” pc49 ” ) )
For MPI or PVM, one specifies the number of nodes to create, rather than specifying the nodes themselves.
Note that the above R code sets up worker nodes at the machines named pc48 and pc49; these are in
addition to the manager node, which is the machine on which that R code is executed.4
There are various other optional arguments. One you may find useful is outfile, which records the result of
the call in the file outfile. This can be helpful if the call fails.
8.5.2
Example: Matrix Multiplication
Let’s look at a simple example of multiplication of a vector by a matrix. We set up a test matrix:
1 > a <− m a t r i x ( c ( 1 : 1 2 ) , nrow = 6 )
2 > a
3
[ ,1] [ ,2]
4 [1 ,]
1
7
5 [2 ,]
2
8
6 [3 ,]
3
9
7 [4 ,]
4
10
8 [5 ,]
5
11
9 [6 ,]
6
12
We will multiply the vector (1, 1)T (T meaning transpose) by our matrix a. In this small example, of course,
we would do that directly:
1 > a %∗% c ( 1 , 1 )
2
[ ,1]
3 [1 ,]
8
4 [2 ,]
10
5 [3 ,]
12
6 [4 ,]
14
7 [5 ,]
16
8 [6 ,]
18
3
If you are on a shared-file system group of machines, try to stick to ones for which the path to R is the same for all, to avoid
problems.
4
In Rmpi notation, the official terms are slaves and master.
8.5. THE R SNOW PACKAGE
145
But let’s see how we could do it using R’s apply() function (still on just one machine), as it will set the stage
for extending to parallel computation.
R’s apply() function calls a user-specified function to each of the rows (or each of the columns) of a userspecified matrix. This returns a vector. To use apply() for our matrix-times-vector problem here, define a
dot product function:
> d o t <− f u n c t i o n ( x , y ) { r e t u r n ( x%∗%y ) }
Now call apply():
> apply ( a , 1 , dot , c ( 1 , 1 ) )
[ 1 ] 8 10 12 14 16 18
This call applies the function dot() to each row (indicated by the 1, with 2 meaning column) of a playing
the role of the first argument to dot(), and with c(1,1) playing the role of the second argument.
The snow library then extends apply() to parallel computation, with a function parApply(). Let’s use it to
parallelize our matrix multiplication, across our the machines in our cluster cls:
> parApply ( c l s , a , 1 , dot , c ( 1 , 1 ) )
[ 1 ] 8 10 12 14 16 18
What parApply() did was to send some of the rows of the matrix to each node, also sending them the
function dot(). Each node applied dot() to each of the nodes it was given, and then return the results to be
assembled by the manager node.
8.5.3
Other snow Functions
As noted earlier, the virtue of snow is its simplicity. Thus it does not have a lot of complex functions. But
there is certainly more than just parApply(). Here are a few more:
The function clusterCall(cls,f,...) sends the function f(), and the set of arguments (if any) represented by the
ellipsis above to each worker node, where f() is evaluated on the arguments. The return value is a list, with
the ith element is the result of the computation at node i in the cluster.
The function clusterExport(cls,varlist) copies the variables whose names appear in the character vector
varlist to each worker in the cluster cls. You can use this, for instance, to avoid constant shipping of large
data sets from the master to the workers; you just do so once, using clusterExport() on the corresponding
variables, and then access those variables as global. Again, the return value is a list, with the ith element is
the result of the computation at node i in the cluster.
Here is a trivial example:
1 > z <− f u n c t i o n ( ) r e t u r n ( x )
146
2
3
4
5
6
7
8
9
10
CHAPTER 8. INTRODUCTION TO PARALLEL R
> x <− 5
> y <− 12
> c l u s t e r E x p o r t ( cls , c (” x ” ,” y ” ) )
> c l u s t e r C a l l ( cls , z )
[[1]]
[1] 5
[[2]]
[1] 5
Here clusterExport() sent the variables x and y to both of the machines in the cluster. (Note that it sent
both their names and their values.) To check, we then ran clusterCall(), asking each of them to evaluate the
expression x for us, and sure enough, each of them returned 5 to the manager.
The function clusterEvalQ(cls,expression) runs expression at each worker node in cls. Continuing the
above example, we have
1 > c l u s t e r E v a l Q ( c l s , x <− x + 1 )
2 [[1]]
3 [1] 6
4
5 [[2]]
6 [1] 6
7
8 > c l u s t e r C a l l ( cls , z )
9 [[1]]
10 [ 1 ] 6
11
12 [ [ 2 ] ]
13 [ 1 ] 6
14
15 > x
16 [ 1 ] 5
Note that x still has its original version back at the manager.
The function clusterApply(cls,individualargs,f,...) runs f() at each worker node in cls. Here individualargs
is a list (if it is a vector, it will be converted to a list). When f() is called on node i of the cluster, its
arguments will be as follows. The The first argument will be the ith element of the individualargs, i.e.
individualargs[[i]]. If arguments indicated by the ellipsis are in the call (optional), then these will be
passed to f() as its second, third and so on arguments.
8.6. RDSM
147
Here for instance is how we can assign an ID to each worker node, like MPI rank:5
1
2
3
4
5
6
7
8
9
10
11
12
13
14
15
16
> myid <− 0
> c l u s t e r E x p o r t ( c l s , ” myid ” )
> s e t i d <− f u n c t i o n ( i ) { myid <<− i }
> clusterApply ( cls ,1:2 , s e t i d )
[[1]]
[1] 1
# note superassignment operator
[[2]]
[1] 2
> c l u s t e r C a l l ( c l s , f u n c t i o n ( ) { r e t u r n ( myid ) } )
[[1]]
[1] 1
[[2]]
[1] 2
How did this work? Consider what happened at node 1, for instance. It received the function setid() from
the manager, along with instructions to call that function with argument 1 (obtained as element 1 from the
vector 1:2). It thus executed
myid <<− 1
So, now the global address space of the R process running on node 1 included a variable myid with value 1.
(Note that no such variable would exist in the manager node’s global address space.)
The similar action occurred at node 2. So, when at the manager we then did the clusterCall() call above,
we got back the values 1 and 2.
Don’t forget to stop your clusters before exiting R, by calling stopCluster()clustername.
There are various other useful snow functions. See the user’s manual for details; you may wish to try the
“Snow Simplified” Web page first, at http://www.sfu.ca/˜sblay/R/snow.html.
8.6
Rdsm
My Rdsm package can be used as a threads system regardless of whether you are on a NOW or a multicore
machine. It is an extension of a similar package I wrote in 2002 for Perl, called PerlDSM. (N. Matloff,
5
I don’t see a provision in snow itself that does this.
148
CHAPTER 8. INTRODUCTION TO PARALLEL R
PerlDSM: A Distributed Shared Memory System for Perl, Proceedings of PDPTA 2002, 2002, 63-68.) It
gives the R programmer a shared memory view, but the objects are not physically shared. Instead, they are
stored in a server, and accessed through network sockets, thus enabling a threads-like view for R programmers even on NOWs. There is no manager/worker structure here. All of the R processes execute the same
code, as peers.
Shared objects in Rdsm can be numerical vectors or matrices, via the classes dsmv and dsmm, or R lists,
using the class dsml. Communication with the server in the vector and matrix cases is done in binary form
for efficiency, while serialization is used for lists. There is as a built-in variable myinfo that gives a process’
ID number and the total number of processes, analogous to the information obtained in Rmpi from the
functions mpi.comm.rank() and mpi.comm.size().
To install, again use install.packages() as above. There is built-in documentation, but it’s best to read
through the code MatMul.R in the examples directory of the Rdsm distribution first. It is heavily commented, with the goal of serving as an introduction to the package.
8.6.1
Example: Web Probe
The example below repeatedly cycles through a large list of Web sites, taking measurements on the time to
access each one. The data are stored in a shared variable accesstimes; the n most recent access times are
stored. Each process works on one Web site at a time.
An unusual feature here is that one of the processes immediately exits, returning to the R interactive command line. This allows the user to monitor the data that is being collected. Remember, the shared variables
are still accessible to that process. Thus while the other processes are continually adding data to accesstimes
(and deleted one item for each one added), the user can give commands to the exited process to analyze the
data, say with histograms, as the collection progresses.
Note the use of lock/unlock operations here, with the Rdsm variables of the same names.
1
2
3
4
5
6
7
8
9
10
11
12
# i f t h e v a r i a b l e a c c e s s t i m e s i s l e n g t h n , t h e n t h e Rdsm v e c t o r
# a c c e s s t i m e s s t o r e s t h e n most r e c e n t p r o b e d a c c e s s t i m e s , w i t h e l e m e n t
# i b e i n g t h e i −t h o l d e s t
# arguments :
#
s i t e f i l e : I P s , one Web s i t e p e r l i n e
#
ww: window w i d t h , d e s i r e d l e n g t h o f a c c e s s t i m e s
webprobe <− f u n c t i o n ( s i t e f i l e ,ww) {
i f ( myinfo$myid == 1 ) {
newdsm ( ” a c c e s s t i m e s ” , ” dsmv ” , ” d o u b l e ” , v a l = r e p ( 0 ,ww) )
} else {
newdsm ( ” a c c e s s t i m e s ” , ” dsmv ” , ” d o u b l e ” , s i z e =ww)
8.6. RDSM
149
}
barr ()
# l a s t p r o c e s s i s i n t e n d e d s i m p l y t o p r o v i d e a c c e s s t o humans , who
# c a n do a n a l y s e s on t h e d a t a , t y p i n g commands , s o h a v e i t e x i t t h i s
# f u n c t i o n and r e t u r n t o t h e R command p r o m p t
i f ( myinfo$myid == m y i n f o $ n c l n t ) {
return ()
} e l s e { # t h e o t h e r p r o c e s s e s c o n t i n u a l l y p r o b e t h e Web :
s i t e s <− s c a n ( s i t e f i l e , what = ” ” )
n s i t e s <− l e n g t h ( s i t e s )
repeat {
# c h o o s e random s i t e t o p r o b e
s i t e <− s i t e s [ s a m p l e ( 1 : n s i t e s , 1 ) ]
# now p r o b e i t
a c c <− s y s t e m . t i m e ( s y s t e m ( p a s t e ( ” wget −−s p i d e r −q ” , s i t e ) ) ) [ 3 ]
# add t o a c c e s s t i m e s , i n s l i d i n g −window f a s h i o n
lock (” acclock ”)
newvec <− c ( a c c e s s t i m e s [ − 1 ] , a c c )
a c c e s s t i m e s [ ] <− newvec
unlock (” acclock ”)
}
}
13
14
15
16
17
18
19
20
21
22
23
24
25
26
27
28
29
30
31
32
33
34
35 }
8.6.2
The bigmemory Package
Jay Emerson and Mike Kane developed the bigmemory package when I was developing Rdsm; neither of
us knew about the other.
The bigmemory package is not intended to provide a threads environment. Instead, it is used to deal with a
hard limit R has: No R object can be larger than 231 − 1 bytes. This holds even if you have a 64-bit machine
with lots of RAM. The bigmemory package solves the problem on a multicore machine, by making use of
operating system calls to set up shared memory between processes.6
In principle, bigmemory could be used for threading, but the package includes no infrastructure for this.
However, one can use Rdsm in conjunction with bigmemory, an advantage since the latter is very efficient.
6
It can also be used on distributed systems, by exploiting OS services to map memory to files.
150
CHAPTER 8. INTRODUCTION TO PARALLEL R
8.7
R with GPUs
The blinding speed of GPUs (for certain problems) is sure to of interest to more and more R users in the
coming years.
As of today, the main vehicle for writing GPU code is CUDA, on NVIDIA graphics cards. CUDA is a slight
extension of C.
You may need to write your own CUDA code, in which case you need to use the methods of Section 8.8.
But in many cases you can get what you need in ready-made form, via the two main packages for GPU
programming with R, gputools and rgpu. Both deal mainly with linear algebra operations. The remainder
of this section will deal with these packages.
8.7.1
Installation
Note that, due to issues involving linking to the CUDA libraries, in the cases of these two packages, you
probably will not be able to install them by merely calling install.packages(). The alternative I recommend
works as follows:
• Download the package in .tar.gz form.
• Unpack the package, producing a directory that we’ll call x.
• Let’s say you wish to install to /a/b/c.
• Modify some files within x.
• Then run
R CMD INSTALL − l / a / b / c x
Details will be shown in the following sections.
8.7.2
The gputools Package
In installing gputools, I downloaded the source from the CRAN R repository site, and unpacked as above. I
then removed the subcommand
-gencode arch=compute_20,code=sm_20
8.7. R WITH GPUS
151
from the file Makefile.in in the src directory. I also made sure that my shell startup file included my CUDA
executable and library paths, /usr/local/cuda/bin and /usr/local/cuda/lib.
I then ran R CMD INSTALL as above. I tested it by trying gpuLm.fit(), the gputools version of R’s regular
lm.fit().
The package offers various linear algebra routines, such as matrix multiplication, solution of Ax = b (and
thus matrix inversion), and singular value decomposition, as well as some computation-intensive operations
such as linear/generalize linear model estimation and hierarchical clustering.
Here for instance is how to find the square of a matrix m:
> m2 <− gpuMatMult (m,m)
8.7.3
The rgpu Package
In installing rgpu, I downloaded the source code from https://gforge.nbic.nl/frs/?group_
id=38 and unpacked as above. I then changed the file Makefile, with the modified lines being
1 LIBS = −L / u s r / l i b / n v i d i a −l c u d a − l c u d a r t − l c u b l a s
2 CUDA INC PATH ?= / home / m a t l o f f / NVIDIA GPU Computing SDK / C / common / i n c
3 R INC PATH ?= / u s r / i n c l u d e / R
The first line was needed to pick up -lcuda, as with gputools. The second line was needed to acquire the
file cutil.h in the NVIDIA SDK, which I had installed earlier at the location see above.
For the third line, I made a file z.c consisting solely of the line
# i n c l u d e <R . h>
and ran
R CMD SHLIB z . c
just to see whether the R include file was.
As of May 2010, the routines in rgpu are much less extensive than those of gputools. However, one very
nice feature of rgpu is that one can compute matrix expressions without bringing intermediate results back
from the device memory to the host memory, which would be a big slowdown. Here for instance is how to
compute the square of the matrix m, plus itself:
> m2m <− e v a l g p u (m %∗% m + m)
152
8.8
CHAPTER 8. INTRODUCTION TO PARALLEL R
Parallelism Via Calling C from R
R does interface to C—R can call C and vice versa—so we can take advantage of OpenMP and CUDA from
R.
8.8.1
Calling C from R
In C, two-dimensional arrays are stored in row-major order, in contrast to R’s column-major order. For
instance, if we have a 3x4 array, the element in the second row and second column is element number 5
of the array when viewed linearly, since there are three elements in the first column and this is the second
element in the second column. Of course, keep in mind that C subscripts begin at 0, rather than at 1 as with
R. In writing your C code to be interfaced to R, you must keep these issues in mind.
All the arguments passed from R to C are received by C as pointers. Note that the C function itself must
return void. Values that we would ordinarily return must in the R/C context be communicated through the
function’s arguments, such as result in our example below.
As an example, here is C code to extract subdiagonals from a square matrix.7 The code is in a file sd.c:
1 # i n c l u d e <R . h> / / r e q u i r e d
2
3 / / arguments :
4 //
m: a s q u a r e m a t r i x
5 //
n : number o f rows / c o l u m n s o f m
6 //
k:
t h e s u b d i a g o n a l i n d e x −−0 f o r main d i a g o n a l , 1 f o r f i r s t
7 //
s u b d i a g o n a l , 2 f o r t h e second , e t c .
8 //
r e s u l t : space for the requested subdiagonal , returned here
9
10 v o i d s u b d i a g ( d o u b l e ∗m, i n t ∗n , i n t ∗k , d o u b l e ∗ r e s u l t )
11 {
12
i n t n v a l = ∗n , k v a l = ∗k ;
13
i n t s t r i d e = nval + 1;
14
f o r ( i n t i = 0 , j = k v a l ; i < n v a l −k v a l ; ++ i , j += s t r i d e )
15
r e s u l t [ i ] = m[ j ] ;
16 }
For convenience, you can compile this by rubnning R in a terminal window, which will invoke GCC:
1 % R CMD SHLIB s d . c
2 g c c −s t d = gnu99 −I / u s r / s h a r e / R / i n c l u d e
7
−f p i c
−g −O2 −c s d . c −o s d . o
I wish to thank my former graduate assistant, Min-Yu Huang, who wrote an earlier version of this function.
8.8. PARALLELISM VIA CALLING C FROM R
3
g c c −s t d = gnu99 −s h a r e d
−o s d . s o s d . o
153
−L / u s r / l i b / R / l i b −lR
Note that here R showed us exactly what it did in invoking GCC. This allows us to do some customization.
But note that this simply produced a dynamic library, sd.o, not an executable program. (On Windows this
would presumably be a .dll file.) So, how is it executed? The answer is that it is loaded into R, using R’s
dyn.load() function. Here is an example:
1
2
3
4
5
6
7
8
9
10
11
12
13
14
15
16
> dyn . l o a d ( ” s d . s o ” )
> m <− r b i n d ( 1 : 5 , 6 : 1 0 , 1 1 : 1 5 , 1 6 : 2 0 , 2 1 : 2 5 )
> k <− 2
> . C ( ” s u b d i a g ” , a s . d o u b l e (m) , a s . i n t e g e r ( dim (m ) [ 1 ] ) , a s . i n t e g e r ( k ) ,
r e s u l t = d o u b l e ( dim (m) [ 1 ] − k ) )
[[1]]
[ 1 ] 1 6 11 16 21 2 7 12 17 22 3 8 13 18 23 4 9 14 19 24 5 10 15 20 25
[[2]]
[1] 5
[[3]]
[1] 2
$result
[ 1 ] 11 17 23
Note that we needed to allocate space for result in our call, in a variable we’ve named result. The
value placed in there by our function is seen above to be correct.
8.8.2
Calling C OpenMP Code from R
Since OpenMP is usable from C, that makes it in turn usable from R. (See Chapter 3 for a detailed discussion
of OpenMP.)
The code is compiled and then loaded into R as in Section 8.8, though with the additional step of specifying
the -fopenmp command-line option in both invocations of GCC (which you run by hand, instead of using
R CMD SHLIB).
154
8.9
CHAPTER 8. INTRODUCTION TO PARALLEL R
Debugging R Applications
The built-in debugging facilities in R are primitive. However, if you are a Vim editor fan, I’ve developed a
tool that greatly enhances the power of R’s debugger. Download edtdbg from R’s CRAN repository.
REvolution Analytics, a firm that offers R consulting and develops souped-up versions of R, offers an IDE
for R that includes nice debugging facilities. At this stage, it is only available on Windows. The developers
of StatET, a platform-independent Eclipse-based IDE for R, are working on adding a debugging tool. So are
the people developing RStudio, another a platform-independent Eclipse-based IDE for R.
Packages such as Rmpi, snow, foreach and so on do not set up a terminal for each process, thus making it
impossible to use R’s debugger on the workers. You are then forced to simply print out trace information,
e.g. values of variables. Note that you should use message() for this purpose, as print() won’t work in the
worker processes.
Rdsm allows full debugging, as there is a separate terminal window for each process.
For parallel R that is implemented via R calls to C code, producing a dynamically-loaded library as in Section
8.8, debugging is a little more involved. First start R under GDB, then load the library to be debugged. At
this point, R’s interpreter will be looping, anticipating reading an R command from you. Break the loop by
hitting ctrl-c, which will put you back into GDB’s interpreter. Then set a breakpoint at the C function you
want to debug, say subdiag() in our example above. Finally, tell GDB to continue, and it will then stop in
your function! Here’s how your session will look:
1 $ R −d gdb
2 GNU gdb 6.8 − d e b i a n
3 ...
4 ( gdb ) r u n
5 S t a r t i n g program : / u s r / l i b /R/ bin / exec /R
6 ...
7 > dyn . l o a d ( ” s d . s o ” )
Chapter 9
Introduction to Parallel Matrix Operations
9.1
“We’re Not in Physicsland Anymore, Toto”
In the early days parallel processing was mostly used in physics problems. Typical problems of interest
would be grid computations such as the heat equation, matrix multiplication, matrix inversion (or equivalent
operations) and so on. These matrices are not those little 3x3 toys you worked with in your linear algebra
class. In parallel processing applications of matrix algebra, our matrices can have thousands of rows and
columns, or even larger.
The range of applications of parallel processing is of course far broader today. In many of these applications,
problems which at first glance seem not to involve matrices, actually do have matrix solutions.
9.1.1
Example from Graph Theory
Let n denote the number of vertices in the graph. Define the graph’s adjacency matrix A to be the n x
n matrix whose element (i,j) is equal to 1 if there is an edge connecting vertices i an j (i.e. i and j are
“adjacent”), and 0 otherwise. The corresponding reachability matrix R has its (i,j) element equal to 1 if
there is some path from i to j, and 0 otherwise.
One can prove that
R = b[(I + A)n−1 ],
(9.1)
where I is the identity matrix and the function b() (‘b’ for “boolean”) is applied elementwise to its matrix
argument, replacing each nonzero element by 1 while leaving the elements which are 0 unchanged. The
graph is connected if and only if all elements of R are 1s.
155
156
CHAPTER 9. INTRODUCTION TO PARALLEL MATRIX OPERATIONS
So, the original graph connectivity problem reduces to a matrix problem.
9.2
Libraries
Of course, remember that CUDA provides some excellent matrix-operation routines, in CUBLAS. There is
also the CUSP library for sparse matrices.
More general (i.e. non-CUDA) parallel libraries for linear algebra include ScalaPACK and PLAPACK.
9.3
Partitioned Matrices
Parallel processing of course relies on finding a way to partition the work to be done. In the matrix algorithm
case, this is often done by dividing a matrix into blocks (often called tiles these days).
For example, let
1 5 12
A= 0 3 6
4 8 2
(9.2)
and
0 2 5
B = 0 9 10 ,
1 1 2
(9.3)
so that
12 59 79
C = AB = 6 33 42 .
2 82 104
(9.4)
We could partition A as
A=
A00 A01
A10 A11
,
(9.5)
9.3. PARTITIONED MATRICES
157
where
A00 =
1 5
0 3
,
(9.6)
A01 =
12
6
A10 =
4 8
,
(9.7)
(9.8)
and
A11 =
2
.
(9.9)
Similarly we would partition B and C into blocks of the same size as in A,
B=
B00 B01
B10 B11
C00 C01
C10 C11
(9.10)
and
C=
,
(9.11)
so that for example
B10 =
1 1
.
(9.12)
The key point is that multiplication still works if we pretend that those submatrices are numbers. For
example, pretending like that would give the relation
C00 = A00 B00 + A01 B10 ,
(9.13)
which the reader should verify really is correct as matrices, i.e. the computation on the right side really does
yield a matrix equal to C00 .
158
CHAPTER 9. INTRODUCTION TO PARALLEL MATRIX OPERATIONS
9.4
Matrix Multiplication
Since so many parallel matrix algorithms rely on matrix multiplication, a core issue is how to parallelize
that operation.
Let’s suppose for the sake of simplicity that each of the matrices to be multiplied is of dimensions n x n. Let
p denote the number of “processes,” such as shared-memory threads or message-passing nodes.
We assume that the matrices are dense, meaning that most of their entries are nonzero. This is in contrast to
sparse matrices, with many zeros. For instance, in tridiagonal matrices, in which the only nonzero elements
are either on the diagonal or on subdiagonals just below or above the diagonal, and all other elements are
guaranteed to be 0. Or we might just know that most elements are zeros but have no guarantee as to where
they are; here we might have a system of pointers to get from one nonzero element to another. Clearly we
would use differents type of algorithms for sparse matrices than for dense ones.
9.4.1
Message-Passing Case
For concreteness here and in other sections below on message passing, assume we are using MPI.
The obvious plan of attack here is to break the matrices into blocks, and then assign different blocks to
√
different MPI nodes. Assume that p evenly divides n, and partition each matrix into submatrices of size
√
√
n/ p x n/ p. In other words, each matrix will be divided into m rows and m columns of blocks, where
√
m = n/ p.
One of the conditions assumed here is that the matrices A and B are stored in a distributed manner across
the nodes. This situation could arise for several reasons:
• The application is such that it is natural for each node to possess only part of A and B.
• One node, say node 0, originally contains all of A and B, but in order to conserve communication
time, it sends each node only parts of those matrices.
• The entire matrix would not fit in the available memory at the individual nodes.
As you’ll see, the algorithms then have the nodes passing blocks among themselves.
9.4. MATRIX MULTIPLICATION
9.4.1.1
159
Fox’s Algorithm
Consider the node that has the responsibility of calculating block (i,j) of the product C, which it calculates
as
Ai0 B0j + Ai1 B1j + ... + Aii Bij + ... + Ai,m−1 Bm−1,j
(9.14)
Rearrange this as
Aii Bij + Ai,i+1 B,i+1j + ... + Ai,m−1 Bm−1,j + Ai0 B0j + Ai1 B1j + ... + Ai,i−1 Bi−1,j
(9.15)
Written more compactly, this is
m−1
X
Ai,(i+k)mod m B(i+k)mod m,j
(9.16)
k=0
In other words, start with the Aii term, then go across row i of A, wrapping back up to the left end when you
reach the right end. The order of summation in this rearrangement will be the actual order of computation.
It’s similar for B, in column j.
The algorithm is then as follows. The node which is handling the computation of Cij does this (in parallel
with the other nodes which are working with their own values of i and j):
1
2
3
4
5
6
7
8
9
iup = i+1 mod m;
idown = i-1 mod m;
for (k = 0; k < m; k++) {
km = (i+k) mod m;
broadcast(A[i,km]) to all nodes handling row i of C;
C[i,j] = C[i,j] + A[i,km]*B[km,j]
send B[km,j] to the node handling C[idown,j]
receive new B[km+1 mod m,j] from the node handling C[iup,j]
}
The main idea is to have the various computational nodes repeatedly exchange submatrices with each other,
timed so that a node receives the submatrix it needs for its computation “just in time.”
This is Fox’s algorithm. Cannon’s algorithm is similar, except that it does cyclical rotation in both rows and
columns, compared to Fox’s rotation only in columns but broadcast within rows.
The algorithm can be adapted in the obvious way to nonsquare matrices, etc.
160
9.4.1.2
CHAPTER 9. INTRODUCTION TO PARALLEL MATRIX OPERATIONS
Performance Issues
Note that in MPI we would probably want to implement this algorithm using communicators. For example,
this would make broadcasting within a block row more convenient and efficient.
Note too that there is a lot of opportunity here to overlap computation and communication, which is the best
way to solve the communication problem. For instance, we can do the broadcast above at the same time as
we do the computation.
Obviously this algorithm is best suited to settings in which we have PEs in a mesh topology. This includes
hypercubes, though one needs to be a little more careful about communications costs there.
9.4.2
9.4.2.1
Shared-Memory Case
OpenMP
Since a matrix multiplication in serial form consists of nested loops, a natural way to parallelize the operation
in OpenMP is through the for pragma, e.g.
1
2
3
4
5
6
7
#pragma omp parallel for
for (i = 0; i < ncolsa; i++)
for (j = 0; i < nrowsb; j++) {
sum = 0;
for (k = 0; i < ncolsa; i++)
sum += a[i][k] * b[k][j];
}
This would parallelize the outer loop, and we could do so at deeper nesting levels if profitable.
9.4.2.2
CUDA
Given that CUDA tends to work better if we use a large number of threads, a natural choice is for each
thread to compute one element of the product, like this:
1
2
3
4
5
6
7
8
9
__global__ void matmul(float *ma,float *mb,float *mc,int nrowsa,
int ncolsa,int ncolsb, float *total)
{ int k,i,j; float sum;
// find i,j according to thread and block ID
sum = 0;
for (k = 0; k < ncolsa; k++)
sum += a[i*ncolsa+k] * b[k*ncols+j];
*total = sum;
}
9.4. MATRIX MULTIPLICATION
161
This should produce a good speedup. But we can do even better, much much better.
The CUBLAS package includes very finely-tuned algorithms for matrix multiplication. The CUBLAS
source code is not public, though, so in order to get an idea of how such tuning might be done, let’s
look at Prof. Richard Edgar’s algorithm, which makes use of shared memory (http://astro.pas.
rochester.edu/˜aquillen/gpuworkshop/AdvancedCUDA.pdf):1
1
2
3
4
__global__ void MultiplyOptimise(const float *A, const float *B, float *C) {
// Extract block and thread numbers
int bx = blockIdx.x; int by = blockIdx.y;
int tx = threadIdx.x; int ty = threadIdx.y;
5
// Index of first A sub-matrix processed by this block
int aBegin = dc_wA * BLOCK_SIZE * by;
// Index of last A sub-matrix
int aEnd = aBegin + dc_wA - 1;
// Stepsize of A sub-matrices
int aStep = BLOCK_SIZE;
// Index of first B sub-matrix
// processed by this block
int bBegin = BLOCK_SIZE * bx;
// Stepsize for B sub-matrices
int bStep = BLOCK_SIZE * dc_wB;
// Accumulator for this thread
float Csub = 0;
for(int a = aBegin, b = bBegin; a <= aEnd; a += aStep, b+= bStep) {
// Shared memory for sub-matrices
__shared__ float As[BLOCK_SIZE][BLOCK_SIZE];
__shared__ float Bs[BLOCK_SIZE][BLOCK_SIZE];
// Load matrices from global memory into shared memory
// Each thread loads one element of each sub-matrix
As[ty][tx] = A[a + (dc_wA * ty) + tx];
Bs[ty][tx] = B[b + (dc_wB * ty) + tx];
// Synchronise to make sure load is complete
__syncthreads();
// Perform multiplication on sub-matrices
// Each thread computes one element of the C sub-matrix
for( int k = 0; k < BLOCK_SIZE; k++ ) {
Csub += As[ty][k] * Bs[k][tx];
}
// Synchronise again
__syncthreads();
}
// Write the C sub-matrix back to global memory
// Each thread writes one element
int c = (dc_wB * BLOCK_SIZE * by) + (BLOCK_SIZE*bx);
C[c + (dc_wB*ty) + tx] = Csub;
6
7
8
9
10
11
12
13
14
15
16
17
18
19
20
21
22
23
24
25
26
27
28
29
30
31
32
33
34
35
36
37
38
39
40
41
}
Here are the relevant portions of the calling code, including global variables giving the number of columns
(“width”) of the multiplier matrix and the number of rows (“height”) of the multiplicand:
1
Actually, this may be what CUBLAS uses.
162
CHAPTER 9. INTRODUCTION TO PARALLEL MATRIX OPERATIONS
#define BLOCK_SIZE 16
...
__constant__ int dc_wA;
__constant__ int dc_wB;
...
// Sizes must be multiples of BLOCK_SIZE
dim3 threads(BLOCK_SIZE,BLOCK_SIZE);
dim3 grid(wB/BLOCK_SIZE,hA/BLOCK_SIZE);
MultiplySimple<<<grid,threads>>>(d_A, d_B, d_C);
...
(Note the alternative way to configure threads, using the functions threads() and grid().)
Here the the term “block” in the defined value BLOCK SIZE refers both to blocks of threads and the
partitioning of matrices. In other words, a thread block consists of 256 threads, to be thought of as a 16x16
“array” of threads, and each matrix is partitioned into submatrices of size 16x16.
In addition, in terms of grid configuration, there is again a one-to-one correspondence between thread blocks
and submatrices. Each submatrix of the product matrix C will correspond to, and will be computed by, one
block in the grid.
We are computing the matrix product C = AB. Denote the elements of A by aij for the element in row i,
column j, and do the same for B and C. Row-major storage is used.
Each thread will compute one element of C, i.e. one cij . It will do so in the usual way, by multiplying
column j of B by row i of A. However, the key issue is how this is done in concert with the other threads,
and the timing of what portions of A and B are in shared memory at various times.
Concerning the latter, note the code
for(int a = aBegin, b = bBegin; a <= aEnd; a += aStep, b+= bStep) {
// Shared memory for sub-matrices
__shared__ float As[BLOCK_SIZE][BLOCK_SIZE];
__shared__ float Bs[BLOCK_SIZE][BLOCK_SIZE];
// Load matrices from global memory into shared memory
// Each thread loads one element of each sub-matrix
As[ty][tx] = A[a + (dc_wA * ty) + tx];
Bs[ty][tx] = B[b + (dc_wB * ty) + tx];
Here we loop across a row of submatrices of A, and a column of submatrices of B, calculating one submatrix
of C. In each iteration of the loop, we bring into shared memory a new submatrix of A and a new one of
B. Note how even this copying from device global memory to device shared memory is shared among the
threads.
As an example, suppose
A=
1 2 3 4 5 6
7 8 9 10 11 12
(9.17)
9.4. MATRIX MULTIPLICATION
163
and
B=
1
5
9
13
17
21
2
6
10
14
18
22
3
7
11
15
19
23
4
8
12
16
20
24
(9.18)
Further suppose that BLOCK SIZE is 2. That’s too small for good efficiency—giving only four threads per
block rather than 256—but it’s good for the purposes of illustration.
Let’s see what happens when we compute C00 , the 2x2 submatrix of C’s upper-left corner. Due to the fact
that partitioned matrices multiply “just like numbers,” we have
C00 = A00 B00 + A01 B10 + A02 B20
1 2
1 2
+ ...
=
5 6
7 8
(9.19)
(9.20)
Now, all this will be handled by thread block number (0,0), i.e. the block whose X and Y “coordinates” are
both 0. In the first iteration of the loop, A11 and B11 are copied to shared memory for that block, then in the
next iteration, A12 and B21 are brought in, and so on.
Consider what is happening with thread number (1,0) within that block. Remember, its ultimate goal is to
compute c21 (adjusting for the fact that in math, matrix subscripts start at 1). In the first iteration, this thread
is computing
1 2
1
5
= 11
(9.21)
It saves that 11 in its running total Csub, eventually writing it to the corresponding element of C:
int c = (dc_wB * BLOCK_SIZE * by) + (BLOCK_SIZE*bx);
C[c + (dc_wB*ty) + tx] = Csub;
Professor Edgar found that use of shared device memory resulted a huge improvement, extending the original speedup of 20X to 500X!
164
9.4.3
CHAPTER 9. INTRODUCTION TO PARALLEL MATRIX OPERATIONS
Finding Powers of Matrices
In Section 9.1, we saw a special case of matrix multiplication, powers. It also will arise in Section 9.7.2
below.
Finding a power such as A2 could be viewed as a special case of the matrix multiplication AB with A = B.
There are some small improvements that we could make in our algorithm in the previous section for this
case, but also there are other approaches that could yield much better dividends.
Suppose for instance we need to find A32 , as in the graph theory example above. We could apply the above
algorithm 31 times. But a much faster approach would be to first calculate A2 , then square that result to get
A4 , then square it to get A8 and so on. That would get us A32 by applying the algorithm in Section 9.4.1.1
only five times, instead of 31.
But we may need many powers of A, not just one specific one. In the graph theory example, we might want
to find the diameter of the graph, meaning the maximum number of hops from one vertiex to another. Here
we would compute
R = b[(I + A)k−1 ],
(9.22)
for various values of k, searching for the minimum k that gave us an all-1s result. In Section 9.7.2, we would
also need to find many powers of a matrix.
9.5
Solving Systems of Linear Equations
Suppose we have a system of equations
ai0 x0 + ... + ai,n−1 xn−1 = bi , i = 0, 1, ..., n − 1,
(9.23)
where the xi are the unknowns to be solved for.
As you know, this system can be represented compactly as
AX = b,
where A is n x n and X and b is n x 1.
(9.24)
9.5. SOLVING SYSTEMS OF LINEAR EQUATIONS
9.5.1
165
Gaussian Elimination
Form the n x (n+1) matrix C = (A | b) by appending the column vector b to the right of A. Then we work on
the rows of C, with the pseudocode for the sequential case in the most basic form being
1
2
3
4
5
for ii = 0 to n-1
divide row ii by c[i][i]
for r = ii+1 to n-1 // vacuous if r = n-1
replace row r by row r - c[r][ii] times row ii
set new b to be column n-1 of C
(In the divide operation in the above pseudocode, if cii is 0, or even close to 0, that row is first swapped with
another one further down.)
This transforms C to upper triangular form, i.e. all the elements cij with i > j are 0. Also, all diagonal
elements are equal to 1. This corresponds to a new set of equations,
c00 x0 + c11 x1 + c22 x2 + ... + c0,n−1 xn−1 = b0
c11 x1 + c22 x2 + ... + c1,n−1 xn−1 = b1
c22 x2 + ... + c2,n−1 xn−1 = b2
...
cn−1,n−1 xn−1 = bn−1
We then find the xi via back substitution:
1
2
3
x[n-1] = b[n-1] / c[n-1,n-1]
for i = n-2 downto 0
x[i] = (b[i] - c[i][n-1] * x[n-1] - ... - c[i][i+1] * x[i+1]) / c[i][i]
An obvious parallelization of this algorithm would be to assign each process one contiguous group of rows.
Then each process would do
1
2
3
4
5
6
7
8
9
for ii = 0 to n-1
if ii is in my group of rows
pivot = c[i][i]
divide row ii by pivot
broadcast row ii
else receive row ii
for r = ii+1 to n-1 in my group
subtract c[r][ii] times row ii from row r
set new b to be column n-1 of C
166
CHAPTER 9. INTRODUCTION TO PARALLEL MATRIX OPERATIONS
One problem with this is that in the outer loop, when ii gets past a given process’ group of column indices,
that process becomes idle. This can be solved by giving each process several groups of rows, in cyclic order.
For example, say we have four processes. Then process 0 could take rows 0-99, 400-499, 800-899 and so
on, process 1 would take rows 100-199, 500-599 etc.
9.5.2
The Jacobi Algorithm
One can rewrite (9.23) as
xi =
1
[bi − (ai0 x0 + ... + ai,i−1 xi−1 + ai,i+1 xi+1 + ... + ai,n−1 xn−1 )], i = 0, 1, ..., n − 1.
aii
(9.25)
This suggests a natural iterative algorithm for solving the equations. We start with our guess being, say,
xi = bi for all i. At our kth iteration, we find our (k+1)st guess by plugging in our kth guess into the
right-hand side of (9.25). We keep iterating until the difference between successive guesses is small enough
to indicate convergence.
This algorithm is guaranteed to converge if each diagonal element of A is larger in absolute value than the
sum of the absolute values of the other elements in its row.
Parallelization of this algorithm is easy: Just assign each process to handle a block of X. Note that this
means that each process must make sure that all other processes get the new value of this block after every
iteration.
Note too that in matrix terms (9.25) can be expressed as
x(k+1) = D−1 (b − Ox(k) )
(9.26)
where D is the diagonal matrix consisting of the diagonal elements of A (so its inverse is just the diagonal
matrix consisting of the reciprocals of those elements), O is the square matrix obtained by replacing A’s
diagonal elements by 0s, and x( i) is our guess for x in the ith iteration. This reduces the problem to one
of matrix multiplication, and thus we can parallelize the Jacobi algorithm by utilizing a method for doing
parallel matrix multiplication.
9.6
1
OpenMP Implementation of the Jacobi Algorithm
#include <omp.h>
2
3
// partitions s..e into nc chunks, placing the ith in first and last (i
9.7. MATRIX INVERSION
4
5
6
7
8
9
10
167
// = 0,...,nc-1)
void chunker(int s, int e, int nc, int i, int *first, int *last)
{ int chunksize = (e-s+1) / nc;
*first = s + i * chunksize;
if (i < nc-1) *last = *first + chunksize - 1;
else *last = e;
}
11
12
13
14
15
16
17
18
// returns the "dot product" of vectors u and v
float innerprod(float *u, float *v, int n)
{ float sum = 0.0; int i;
for (i = 0; i < n; i++)
sum += u[i] * v[i];
return sum;
}
19
20
21
22
23
24
25
26
27
28
29
30
31
32
33
34
35
36
37
38
39
40
41
42
43
44
45
46
47
48
49
// solves AX = Y, A nxn; stops iteration when total change is < n*eps
void jacobi(float *a, float *x, float *y, int n, float eps)
{
float *oldx = malloc(n*sizeof(float));
float se;
#pragma omp parallel
{ int i;
int thn = omp_get_thread_num();
int nth = omp_get_num_threads();
int first,last;
chunker(0,n-1,nth,thn,&first,&last);
for (i = first; i <= last; i++) oldx[i] = x[i] = 1.0;
float tmp;
while (1) {
for (i = first; i <= last; i++) {
tmp = innerprod(&a[n*i],oldx,n);
tmp -= a[n*i+i] * oldx[i];
x[i] = (y[i] - tmp) / a[n*i+i];
}
#pragma omp barrier
#pragma omp for reduction(+:se)
for (i = first; i <= last; i++)
se += abs(x[i]-oldx[i]);
#pragma omp barrier
if (se < n*eps) break;
for (i = first; i <= last; i++)
oldx[i] = x[i];
}
}
}
Note the use of the OpenMP reduction clause.
9.7
Matrix Inversion
Many applications make use of A−1 for an n x n square matrix A. In many cases, it is not computed directly,
but here we address methods for direct computation.
168
9.7.1
CHAPTER 9. INTRODUCTION TO PARALLEL MATRIX OPERATIONS
Using the Methods for Solving Systems of Linear Equations
Let Bi be the vector (0, 0, ..., 0, 1, 0, ..., 0)0 , where the 1 is in position i, i = 0,1,...,n-1. The Bi are then the
columns of the n x n identity matrix I. So, we can find A−1 by using the methods in Section 9.5, setting
b = Bi , i = 0,1,...,n-1; the n solutions x we obtain this way will then be the columns of A−1 .
This can be formalized by replacing the x and b vectors in (9.26) by the corresponding matrices.
Again, this is easily parallelized. For instance, each process could be responsible for a given group of
columns.
9.7.2
Power Series Method
Recall that for numbers x that are smaller than 1 in absolute value,
1
= 1 + x + x2 + ...
1−x
(9.27)
In algebraic terms, this would be that for an n x n matrix C,
(I − C)−1 = I + C + C 2 + ...
(9.28)
max |cij | < 1
(9.29)
This can be shown to converge if
i,j
To invert our matrix A, then, we can set C = I - A, giving us
A−1 = (I − C)−1 = I + C + C 2 + ... = I + (I − A) + (I − A)2 + ...
(9.30)
To meet the convergence condition, we could set à = dA, where d is small enough so that (9.29) holds for
I − Ã. This will be possible, if all the elements of A are nonnegative.
Chapter 10
Introduction to Parallel Sorting
Sorting is one of the most common operations in parallel processing applications. For example, it is central
to many parallel database operations, and important in areas such as image processing, statistical methodology and so on. A number of different types of parallel sorting schemes have been developed. Here we look
at some of these schemes.
10.1
Quicksort
You are probably familiar with the idea of quicksort: First break the original array into a “small-element”
pile and a “large-element” pile, by comparing to a pivot element. In a naive implementation, the first element
of the array serves as the pivot, but better performance can be obtained by taking, say, the median of the first
three elements. Then “recurse” on each of the two piles, and then string the results back together again.
This is an example of the divide and conquer approach seen in so many serial algorithms. It is easily
parallelized (though load-balancing issues may arise). Here, for instance, we might assign one pile to one
thread and the other pile to another thread.
Suppose the array to be sorted is named x, and consists of n elements.
10.1.1
The Separation Process
A major issue is how we separate the data into piles.
In a naive implementation, the piles would be put into new arrays, but this is bad in two senses: It wastes
memory space, and wastes time, since much copying of arrays needs to be done. A better implementation
places the two piles back into the original array x. The following C code does that.
169
170
CHAPTER 10. INTRODUCTION TO PARALLEL SORTING
The function separate() is intended to be used in a recursive quicksort operation. It operates on x[l] through
x[h], a subarray of x that itself may have been formed at an earlier stage of the recursion. It forms two piles
from those elements, and placing the piles back in the same region x[l] through x[h]. It also has a return
value, showing where the first pile ends.
int separate(int l, int h)
{ int ref,i,j,k,tmp;
ref = x[h]; i = l-1; j = h;
do {
do i++; while (x[i] < ref && i < h);
do j--; while (x[j] > ref && j > l);
tmp = x[i]; x[i] = x[j]; x[j] = tmp;
} while (j > i);
x[j] = x[i]; x[i] = x[h]; x[h] = tmp;
return i;
}
The function separate() rearranges the subarray, returning a value m, so that:
• x[l] through x[m-1] are less than x[m],
• x[m+1] through x[h] are greater than x[m], and
• x[m] is in its “final resting place,” meaning that x[m] will never move again for the remainder of the
sorting process. (Another way of saying this is that the current x[m] is the m-th smallest of all the
original x[i], i = 0,1,...,n-1.)
By the way, x[l] through x[m-1] will also be in their final resting places as a group. They may be exchanging
places with each other from now on, but they will never again leave the range i though m-1 within the x
array as a whole. A similar statement holds for x[m+1] through x[n-1].
Another approach is to do a prefix scan. As an illustration, consider the array
28
35
12
5
13
6
8
10
168
(10.1)
We’ll take the first element, 28, as the pivot, and form a new array of 1s and 0s, where 1 means “less than
the pivot”:
28
1
35
0
12
1
5
1
13
1
6
1
48
0
10
1
168
0
Now form the prefix scan (Chapter 7) of that second array, with respect to addition. It will be an exclusive
scan (Section 7.3). This gives us
10.1. QUICKSORT
28
0
0
35
0
0
12
1
0
5
1
1
171
13
1
2
6
1
3
48
0
3
10
1
4
168
0
4
Now, the key point is that for every element 1 in that second row, the corresponding element in the third row
shows where the first-row element should be placed under the separation operation! Here’s why:
The elements 12, 5, 13, 6 and 10 should go in the first pile, which in an in-place separation would means
indices 0, 1, 2, 3, and 4. Well, as you can see above, these are precisely the values shown in the third row
for 12, 5, 13, 6 and 10, all of which have 1s in the second row.
The pivot, 28, then should immediately follow that low pile, i.e. it should be placed at index 5.
We can simply place the high pile at the remaining indicies, 6 through 8 (though we’ll do it more systematically below).
In general for an array of length k, we:
• form the second row of 1s and 0s indicating < pivot
• form the third row, the exclusive prefix scan
• for each 1 in the second row, place the corresponding element in row 1 into the spot indicated by row
3
• place the pivot in the place indicated by 1 plus m, the largest value in row 3
• form row 4, equal to (0,1,...,k-1) minus row 3 plus m
• for each 0 in the second row, place the corresponding element in row 1 into the spot indicated by row
4
The split operation here is known as segmented scan.
Note that this operation, using scan, could be used an an alternative to the separate() function above. But it
could be done in parallel; more on this below.
10.1.2
Shared-Memory Quicksort
Here is OpenMP code which performs quicksort in the shared-memory paradigm (adapted from code in the
OpenMP Source Code Repository, http://www.pcg.ull.es/ompscr/):
1
2
3
void qs(int *x, int l, int h)
{ int newl[2], newh[2], i, m;
m = separate(x,l,h);
172
newl[0] = l; newh[0] = m-1;
newl[1] = m+1; newh[1] = h;
#pragma omp parallel
{
#pragma omp for nowait
for (i = 0; i < 2; i++)
qs(newl[i],newh[i]);
}
4
5
6
7
8
9
10
11
12
CHAPTER 10. INTRODUCTION TO PARALLEL SORTING
}
Note the nowait clause. Since different threads are operating on different portions of the array, they need
not be synchronized.
Recall that another implementation, using the task directive, was given earlier in Section 3.4.
In both of these implementations, we used the function separate() defined above. So, different threads apply
different separation operations to different subarrays. An alternative would be to place the parallelism in the
separation operation itself, using the parallel algorithms for prefix scan in Chapter 7.
10.1.3
Hyperquicksort
This algorithm was originally developed for hypercubes, but can be used on any message-passing system
having a power of 2 for the number of nodes.1
It is assumed that at the beginning each PE contains some chunk of the array to be sorted. After sorting,
each PE will contain some chunk of the sorted array, meaning that:
• each chunk is itself in sorted form
• for all cases of i < j, the elements at PE i are less than the elements at PE j
If the sorted array itself were our end, rather than our means to something else, we could now collect it at
some node, say node 0. If, as is more likely, the sorting is merely an intermediate step in a larger distributed
computation, we may just leave the chunks at the nodes and go to the next phase of work.
Say we are on a d-cube. The intuition behind the algorithm is quite simple:
for i = d downto 1
for each i-cube:
root of the i-cube broadcasts its median to all in the i-cube,
to serve as pivot
consider the two (i-1)-subcubes of this i-cube
each pair of partners in the (i-1)-subcubes exchanges data:
low-numbered PE gives its partner its data larger than pivot
high-numbered PE gives its partner its data smaller than pivot
1
See Chapter 5 for definitions of hypercube terms.
10.2. MERGESORTS
173
To avoid deadlock, have the lower-numbered partner send then receive, and vice versa for the highernumbered one. Better, in MPI, use MPI SendRcv().
After the first iteration, all elements in the lower (d-1)-cube are less than all elements in higher (d-1)-cube.
After d such steps, the array will be sorted.
10.2
Mergesorts
10.2.1
Sequential Form
In its serial form, mergesort has the following pseudocode:
1
2
3
4
5
6
7
// initially called with l = 0 and h = n-1, where n is the length of the
// array and is assumed here to be a power of 2
void seqmergesort(int *x, int l, int h)
{ seqmergesort(x,0,h/2-1);
seqmergesort(x,h/2,h);
merge(x,l,h);
}
The function merge() should be done in-place, i.e. without using an auxiliary array. It basically codes the
operation shown in pseudocode for the message-passing case in Section 10.2.3.
10.2.2
Shared-Memory Mergesort
This is similar to the patterns for shared-memory quicksort in Section 10.1.2 above.
10.2.3
Message Passing Mergesort on a Tree Topology
First, we organize the processing nodes into a binary tree. This is simply from the point of view of the
software, rather than a physical grouping of the nodes. We will assume, though, that the number of nodes is
one less than a power of 2.
To illustrate the plan, say we have seven nodes in all. We could label node 0 as the root of the tree, label
nodes 1 and 2 to be its two children, label nodes 3 and 4 to be node 1’s children, and finally label nodes 5
and 6 to be node 2’s children.
It is assumed that the array to be sorted is initially distributed in the leaf nodes (recall a similar situation for
hyperquicksort), i.e. nodes 3-6 in the above example. The algorithm works best if there are approximately
the same number of array elements in the various leaves.
174
CHAPTER 10. INTRODUCTION TO PARALLEL SORTING
In the first stage of the algorithm, each leaf node applies a regular sequential sort to its current holdings.
Then each node begins sending its now-sorted array elements to its parent, one at a time, in ascending
numerical order.
Each nonleaf node then will merge the lists handed to it by its two children. Eventually the root node will
have the entire sorted array. Specifically, each nonleaf node does the following:
do
if my left-child datum < my right-child datum
pass my left-child datum to my parent
else
pass my right-child datum to my parent
until receive the "no more data" signal from both children
There is quite a load balancing issue here. On the one hand, due to network latency and the like, one may
get better performance if each node accumulates a chunk of data before sending to the parent, rather than
sending just one datum at a time. Otherwise, “upstream” nodes will frequently have no work to do.
On the other hand, the larger the chunk size, the earlier the leaf nodes will have no work to do. So for
any particular platform, there will be some optimal chunk size, which would need to be determined by
experimentation.
10.2.4
Compare-Exchange Operations
These are key to many sorting algorithms.
A compare-exchange, also known as compare-split, simply means in English, “Let’s pool our data, and
then I’ll take the lower half and you take the upper half.” Each node executes the following pseudocode:
send all my data to partner
receive all my partner’s data
if I have a lower id than my partner
I keep the lower half of the pooled data
else
I keep the upper half of the pooled data
10.2.5
Bitonic Mergesort
Definition: A sequence (a0 , a1 , .., ak−1 ) is called bitonic if either of the following conditions holds:
(a) The sequence is first nondecreasing then nonincreasing, meaning that for some r
(a0 ≤ a1 ≤ ... ≤ ar ≥ ar+1 ≥ an−1 )
10.2. MERGESORTS
175
(b) The sequence can be converted to the form in (a) by rotation, i.e. by moving the last k elements from
the right end to the left end, for some k.
As an example of (b), the sequence (3,8,12,15,14,5,1,2) can be rotated rightward by two element positions to form (1,2,3,8,12,15,14,5). Or we could just rotate by one element, moving the 2 to forming
(2,3,8,12,15,14,5,1).
Note that the definition includes the cases in which the sequence is purely nondecreasing (r = n-1) or purely
nonincreasing (r = 0).
Also included are “V-shape” sequences, in which the numbers first decrease then increase, such as (12,5,2,8,20).
By (b), these can be rotated to form (a), with (12,5,2,8,20) being rotated to form (2,8,20,12,5), an “A-shape”
sequence.
(For convenience, from here on I will use the terms increasing and decreasing instead of nonincreasing and
nondecreasing.)
Suppose we have bitonic sequence (a0 , a1 , .., ak−1 ), where k is a power of 2. Rearrange the sequence by
doing compare-exchange operations between ai and an/2+i ), i = 0,1,...,n/2-1. Then it is not hard to prove that
the new (a0 , a1 , .., ak/2−1 ) and (ak/2 , ak/2+1 , .., ak−1 ) are bitonic, and every element of that first subarray
is less than or equal to every element in the second one.
So, we have set things up for yet another divide-and-conquer attack:
1
2
3
4
5
6
7
8
// x is bitonic of length n, n a power of 2
void sortbitonic(int *x, int n)
{ do the pairwise compare-exchange operations
if (n > 2) {
sortbitonic(x,n/2);
sortbitonic(x+n/2,n/2);
}
}
This can be parallelized in the same ways we saw for Quicksort earlier.
So much for sorting bitonic sequences. But what about general sequences?
We can proceed as follows, using our function sortbitonic() above:
1. For each i = 0,2,4,...,n-2:
• Each of the pairs (ai , ai+1 ), i = 0,2,...,n-2 is bitonic, since any 2-element array is bitonic!
• Apply sortbitonic() to (ai , ai+1 ). In this case, we are simply doing a compare-exchange.
• If i/2 is odd, reverse the pair, so that this pair and the pair immediately preceding it now form a
4-element bitonic sequence.
176
CHAPTER 10. INTRODUCTION TO PARALLEL SORTING
2. For each i = 0,4,8,...,n-4:
• Apply sortbitonic() to (ai , ai+1 , ai+2 , ai+3 ).
• If i/4 is odd, reverse the quartet, so that this quartet and the quartet immediately preceding it now
form an 8-element bitonic sequence.
3. Keep building in this manner, until get to a single sorted n-element list.
There are many ways to parallelize this. In the hypercube case, the algorithm consists of doing compareexchange operations with all neighbors, pretty much in the same pattern as hyperquicksort.
10.3
The Bubble Sort and Its Cousins
10.3.1
The Much-Maligned Bubble Sort
Recall the bubble sort:
1
2
3
4
5
void bubblesort(int *x, int n)
{ for i = n-1 downto 1
for j = 0 to i
compare-exchange(x,i,j,n)
}
Here the function compare-exchange() is as in Section 10.2.4 above. In the context here, it boils down to
if x[i] > x[j]
swap x[i] and x[j]
In the first i iteration, the largest element “bubbles” all the way to the right end of the array. In the second
iteration, the second-largest element bubbles to the next-to-right-end position, and so on.
You learned in your algorithms class that this is a very inefficient algorithm—when used serially. But it’s
actually rather usable in parallel systems.
For example, in the shared-memory setting, suppose we have one thread for each value of i. Then those
threads can work in parallel, as long as a thread with a larger value of i does not overtake a thread with a
smaller i, where “overtake” means working on a larger j value.
Once again, it probably pays to chunk the data. In this case, compare-exchange() fully takes on the meaning
it had in Section 10.2.4.
10.3. THE BUBBLE SORT AND ITS COUSINS
10.3.2
177
A Popular Variant: Odd-Even Transposition
A popular variant of this is the odd-even transposition sort. The pseudocode for a shared-memory version
is:
1
2
3
4
5
6
7
8
9
10
11
12
13
// the argument "me" is this thread’s ID
void oddevensort(int *x, int n, int me)
{ for i = 1 to n
if i is odd
if me is even
compare-exchange(x,me,me+1,n)
else // me is odd
compare-exchange(x,me,me-1,n)
else // i is even
if me is even
compare-exchange(x,me,me-1,n)
else // me is odd
compare-exchange(x,me,me+1,n)
If the second or third argument of compare-exchange() is less than 0 or greater than n-1, the function has
no action.
This looks a bit complicated, but all it’s saying is that, from the point of view of an even-numbered element
of x, it trades with its right neighbor during odd phases of the procedure and with its left neighbor during
even phases.
Again, this is usually much more effective if done in chunks.
10.3.3
1
2
3
CUDA Implementation of Odd/Even Transposition Sort
#include <stdio.h>
#include <stdlib.h>
#include <cuda.h>
4
5
6
7
8
9
10
11
12
13
14
15
16
17
// compare and swap; copies from the f to t, swapping f[i] and
// f[j] if the higher-index value is smaller; it is required that i < j
__device__ void cas(int *f,int *t,int i,int j, int n, int me)
{
if (i < 0 || j >= n) return;
if (me == i) {
if (f[i] > f[j]) t[me] = f[j];
else t[me] = f[i];
} else { // me == j
if (f[i] > f[j]) t[me] = f[i];
else t[me] = f[j];
}
}
18
19
20
// does one iteration of the sort
__global__ void oekern(int *da, int *daaux, int n, int iter)
178
21
{
22
23
24
25
26
27
28
29
CHAPTER 10. INTRODUCTION TO PARALLEL SORTING
int bix = blockIdx.x; // block number within grid
if (iter % 2) {
if (bix % 2) cas(da,daaux,bix-1,bix,n,bix);
else cas(da,daaux,bix,bix+1,n,bix);
} else {
if (bix % 2) cas(da,daaux,bix,bix+1,n,bix);
else cas(da,daaux,bix-1,bix,n,bix);
}
}
30
31
32
33
34
35
36
37
38
39
40
41
42
43
44
45
46
47
48
49
50
51
52
53
54
55
56
// sorts the array ha, length n, using odd/even transp. sort;
// kept simple for illustration, no optimization
void oddeven(int *ha, int n)
{
int *da;
int dasize = n * sizeof(int);
cudaMalloc((void **)&da,dasize);
cudaMemcpy(da,ha,dasize,cudaMemcpyHostToDevice);
// the array daaux will serve as "scratch space"
int *daaux;
cudaMalloc((void **)&daaux,dasize);
dim3 dimGrid(n,1);
dim3 dimBlock(1,1,1);
int *tmp;
for (int iter = 1; iter <= n; iter++) {
oekern<<<dimGrid,dimBlock>>>(da,daaux,n,iter);
cudaThreadSynchronize();
if (iter < n) {
// swap pointers
tmp = da;
da = daaux;
daaux = tmp;
} else
cudaMemcpy(ha,daaux,dasize,cudaMemcpyDeviceToHost);
}
}
Recall that in CUDA code, separate blocks of threads cannot synchronize with each other. Unless we deal
with just a single block, this necessitates limiting the kernel to a single iteration of the algorithm, so that as
iterations progress, execution alternates between the device and the host.
Moreover, we do not take advantage of shared memory. One possible solution would be to use syncthreads()
within each block for most of the compare-and-exchange operations, and then having the host take care of
the operations on the boundaries between blocks.
10.4
Shearsort
In some contexts, our hardware consists of a two-dimensional mesh of PEs. A number of methods have been
developed for such settings, one of the most well known being Shearsort, developed by Sen, Shamir and the
eponymous Isaac Scherson of UC Irvine. Again, the data is assumed to be initially distributed among the
10.5. BUCKET SORT WITH SAMPLING
179
PEs. Here is the pseudocode:
1
2
3
4
5
6
for i = 1 to ceiling(log2(n)) + 1
if i is odd
sort each even row in descending order
sort each odd row in ascending order
else
sort each column is ascending order
At the end, the numbers are sorted in a “snakelike” manner.
For example:
6
5
12
9
6
9
12
5
6
9
5
12
5
12
6↓
←9
No matter what kind of system we have, a natural domain decomposition for this problem would be for
each process to be responsible for a group of rows. There then is the question about what to do during the
even-numbered iterations, in which column operations are done. This can be handled via a parallel matrix
transpose operation. In MPI, the function MPI Alltoall() may be useful.
10.5
Bucket Sort with Sampling
For concreteness, suppose we are using MPI on message-passing hardware, say with 10 PEs. As usual in
such a setting, suppose our data is initially distributed among the PEs.
Suppose we knew that our array to be sorted is a random sample from the uniform distribution on (0,1). In
other words, about 20% of our array will be in (0,0.2), 38% will be in (0.45,0.83) and so on.
What we could do is assign PE0 to the interval (0,0.1), PE1 to (0.1,0.2) etc. Each PE would look at its local
data, and distribute it to the other PEs according to this interval scheme. Then each PE would do a local
sort.
In general, we don’t know what distribution our data comes from. We solve this problem by doing sampling.
In our example here, each PE would sample some of its local data, and send the sample to PE0. From all
180
CHAPTER 10. INTRODUCTION TO PARALLEL SORTING
of these samples, PE0 would find the decile values, i.e. 10th percentile, 20th percentile,..., 90th percentile.
These values, called splitters would then be broadcast to all the PEs, and they would then distribute their
local data to the other PEs according to these intervals.
10.6
Radix Sort
The radix sort is essentially a special case of a bucket sort. If we have 16 threads, say, we could determine a
datum’s bucket by its lower 4 bits. As long as our data is uniformly distributed under the mod 16 operation,
we would not need to do any sampling.
The CUDPP GPU library uses a radix sort. The buckets are formed one bit at a time, using segmented scan
as above.
10.7
Enumeration Sort
This one is really simple. Take for instance the array (12,5,13,18,6). There are 2 elements less than 12, so
in the end, it should go in position 2 of the sorted array, (5,6,12,13,18).
Say we wish to sort x, which for convenience we assume contains no tied values. Then the pseudocode for
this algorithm, placing the results in y, is
for all i in 0...n-1:
count = 0
elt = x[i]
for all j in 0...n-1:
if x[j] < elt then count++
y[count] = elt
The outer (or inner) loop is easily parallelized.
Chapter 11
Parallel Computation for Image Processing
Mathematical computations involving images can become quite intensive, and thus parallel methods are of
great interest. Here we will be primarily interested in methods involving Fourier analysis.
11.1
General Principles
11.1.1
One-Dimensional Fourier Series
A sound wave form graphs volume of the sound against time. Here, for instance, is the wave form for a
vibrating reed:1
1
Reproduced here by permission of Prof.
http://www.ipfw.edu/math/Workshop/PBC.html
Peter Hamburger, Indiana-Purdue University, Fort Wayne.
181
See
182
CHAPTER 11. PARALLEL COMPUTATION FOR IMAGE PROCESSING
Recall that we say a function of time g(t) is periodic (“repeating,” in our casual wording above) with period
T if if g(u+T) = g(u) for all u. The fundamental frequency of g() is then defined to be the number of periods
per unit time,
f0 =
1
T
(11.1)
Recall also from calculus that we can write a function g(t) (not necessarily periodic) as a Taylor series,
which is an “infinite polynomial”:
g(t) =
∞
X
cn tn .
(11.2)
n=0
The specific values of the cn may be derived by differentiating both sides of (11.2) and evaluating at t = 0,
yielding
cn =
g (n) (0)
,
n!
(11.3)
et =
∞
X
1 n
t
n!
(11.4)
where g (j) denotes the ith derivative of g().
For instance, for et ,
n=0
In the case of a repeating function, it is more convenient to use another kind of series representation, an
“infinite trig polynomial,” called a Fourier series. This is just a fancy name for a weighted sum of sines and
11.1. GENERAL PRINCIPLES
183
cosines of different frequencies. More precisely, we can write any repeating function g(t) with period T and
fundamental frequency f0 as
g(t) =
∞
X
an cos(2πnf0 t) +
n=0
∞
X
bn sin(2πnf0 t)
(11.5)
n=1
for some set of weights an and bn . Here, instead of having a weighted sum of terms
1, t, t2 , t3 , ...
(11.6)
as in a Taylor series, we have a weighted sum of terms
1, cos(2πf0 t), cos(4πf0 t), cos(6πf0 t), ...
(11.7)
and of similar sine terms. Note that the frequencies nf0 , in those sines and cosines are integer multiples of
the fundamental frequency of x, f0 , called harmonics.
The weights an and bn , n = 0, 1, 2, ... are called the frequency spectrum of g(). The coefficients are
calculated as follows:2
1
a0 =
T
2
an =
T
Z
2
T
Z
bn =
Z
T
g(t) dt
(11.8)
g(t) cos(2πnf0 t) dt
(11.9)
g(t) sin(2πnf0 t) dt
(11.10)
0
T
0
T
0
By analyzing these weights, we can do things like machine-based voice recognition (distinguishing one
person’s voice from another) and speech recognition (determining what a person is saying). If for example
one person’s voice is higher-pitched than that of another, the first person’s weights will be concentrated more
on the higher-frequency sines and cosines than will the weights of the second.
Since g(t) is a graph of loudness against time, this representation of the sound is called the time domain.
When we find the Fourier series of the sound, the set of weights an and bn is said to be a representation of
2
The get an idea as to how these formulas arise, see Section 11.8. But for now, if you integrate both sides of (11.5), you will at
least verify that the formulas below do work.
184
CHAPTER 11. PARALLEL COMPUTATION FOR IMAGE PROCESSING
the sound in the frequency domain. One can recover the original time-domain representation from that of
the frequency domain, and vice versa, as seen in Equations (11.8), (11.9), (11.10) and (11.5).
In other words, the transformations between the two domains are inverses of each other, and there is a
one-to-one correspondence between them. Every g() corresponds to a unique set of weights and vice versa.
Now here is the frequency-domain version of the reed sound:
Note that this graph is very “spiky.” In other words, even though the reed’s waveform includes all frequencies, most of the power of the signal is at a few frequencies which arise from the physical properties of the
reed.
Fourier series are often expressed in terms of complex numbers, making use of the relation
eiθ = cos(θ) + i sin(θ),
where i =
3
√
(11.11)
−1.3
There is basically no physical interpretation of complex numbers. Instead, they are just mathematical abstractions. However,
they are highly useful abstractions, with the complex form of Fourier series, beginning with (11.12), being a case in point.
11.2. DISCRETE FOURIER TRANSFORMS
185
The complex form of (11.5) is
g(t) =
∞
X
t
cj e2πij T .
(11.12)
j=−∞
The cj are now generally complex numbers. They are functions of the aj and bj , and thus form the frequency
spectrum.
Equation (11.12) has a simpler, more compact form than (11.5). Do you now see why I referred to Fourier
t
series as trig polynomials? The series (11.12) involves the jth powers of e2π T .
11.1.2
Two-Dimensional Fourier Series
Let’s now move from sounds images. Here g() is a function of two variables, g(u,v), where u and v are the
horizontal and vertical coordinates of a pixel in the image; g(u,v) is the intensity of the image at that pixel.
If it is a gray-scale image, the intensity is whiteness of the image at that pixel, typically with 0 being pure
black and 255 being pure white. If it is a color image, a typical graphics format is to store three intensity
values at a point, one for each of red, green and blue. The various colors come from combining three colors
at various intensities.
Since images are two-dimensional instead of one-dimensional like a sound wave form, the Fourier series for
an image is a sum of sines and cosines in two variables, i.e. a double sum Σj Σk ... instead of Σj ....
The terminology changes a bit. Our original data is now referred to as being in the spatial domain, rather
than the time domain. But the Fourier series coefficients are still said to be in the frequency domain.
11.2
Discrete Fourier Transforms
In sound and image applications, we seldom if ever know the exact form of the repeating function g(). All
we have is a sampling from g(), i.e. we only have values of g(t) for a set of discrete values of t.
In the sound example above, a typical sampling rate is 8000 samples per second.4 So, we may have g(0),
g(0.000125), g(0.000250), g(0.000375), and so on. In the image case, we sample the image pixel by pixel.
Thus we can’t calculate integrals like (11.8). So, how do we approximate the Fourier transform based on
the sample data?
4
See Section 11.9 for the reasons behind this.
186
11.2.1
CHAPTER 11. PARALLEL COMPUTATION FOR IMAGE PROCESSING
One-Dimensional Data
Let X = (x0 , ..., xn−1 ) denote the sampled values, i.e. the time-domain representation of g() based on
our sample data. These are interpreted as data from one period of g(), with the period being n and the
fundamental frequency being 1/n. The frequency-domain representation will also consist of n numbers,
c0 , ..., cn−1 , defined as follows:
ck =
n−1
n−1
j=0
j=0
1X
1X
xj e−2πijk/n =
xj q jk
n
n
(11.13)
where
q = e−2πi/n
(11.14)
√
again with i = −1. The array C of complex numbers ck is called the discrete Fourier transform (DFT)
of X. Note that (11.13) is basically a discrete analog of (11.9) and (11.10).
Note that instead of having infinitely many frequencies, we only have n of them, i.e. the n original data
points xj map to n frequency weights ck .5
The quantity q is a nth root of 1:
q n = e−2πi = cos(−2π) + i sin(−2π) = 1
(11.15)
Equation (11.13) can be written as
C=
1
AX,
n
(11.16)
where X is the vector xj and
1
1
1
1
q
q2
A=
... ...
...
1 q n−1 q 2(n−1)
5
...
1
...
q n−1
...
...
(n−1)(n−1)
... q
(11.17)
Actually, in the case of xj real, which occurs with sound data, we really get only n/2 frequencies. The weight of the frequences
after k = n/2 turn out to be the conjugates of those before n/2, where the conjugate of a+bi is defined to be a-bi.
11.2. DISCRETE FOURIER TRANSFORMS
11.2.2
187
Inversion
As in the continuous case, the DFT is a one-to-one transformation. so we can recover each domain from the
other. The details are important:
The matrix A in (11.17) is a special case of Vandermonde matrices, known to be invertible. In fact, if we
think of that matrix as a function of q, A(q), then it turns out that
[A(q)]−1 =
1 1
A( )
n q
(11.18)
Thus (11.16) becomes
1
X = n[A(q)]−1 C = A( )C
q
(11.19)
In nonmatrix terms:
xj =
n−1
X
ck e2πijk/n =
k=0
n−1
X
ck q −jk
(11.20)
k=0
Equation (11.20) is basically a discrete analog of (11.5).
11.2.2.1
Alternate Formulation
Equation (11.16) has a factor 1/n while (11.19) doesn’t. In order to achieve symmetry, some authors of
√
material on DFT opt to define the DFT and its inverse with 1/ n in (11.13) instead of 1/n, and by adding a
√
√
factor 1/ n in (11.20). They then include a factor 1/ n in (11.17), with the result that [A(q)]−1 = A(1/q).
Thus everything simplifies.
Other formulations are possible. For instance, the R fft() routine’s documentation says it’s “unnormalized,”
√
meaning that there is neither a 1/n nor a 1/ n in (11.20). When using a DFT routine, be sure to determine
what it assumes about these constant factors.
188
11.2.3
CHAPTER 11. PARALLEL COMPUTATION FOR IMAGE PROCESSING
Two-Dimensional Data
The spectrum numbers crs are double-subscripted, like the original data xuv , the latter being the pixel
intensity in row u, column v of the image, u = 0,1,...,n-1, v = 0,1,...,m-1. Equation (11.13) becomes
n−1 m−1
crs =
jr
ks
1 1 XX
xjk e−2πi( n + m )
nm
(11.21)
j=0 k=0
where r = 0,1,...,n-1, s = 0,1,...,m-1.
Its inverse is
xrs =
n−1
X m−1
X
jr
ks
cjk e2πi( n + m )
(11.22)
j=0 k=0
11.3
Parallel Computation of Discrete Fourier Transforms
11.3.1
CUFFT
Remember that CUDA includes some excellent FFT routines, in CUFFT.
11.3.2
The Fast Fourier Transform
Speedy computation of a discrete Fourier transform was developed by Cooley and Tukey in their famous
Fast Fourier Transform (FFT), which takes a “divide and conquer” approach:
Equation (11.13) can be rewritten as
ck =
where m = n/2.
m−1
X
1
n
j=0
x2j q 2jk +
m−1
X
j=0
x2j+1 q (2j+1)k ,
(11.23)
11.3. PARALLEL COMPUTATION OF DISCRETE FOURIER TRANSFORMS
189
After some algebraic manipulation, this becomes
ck =
11
2 m
m−1
X
x2j z jk + q k
j=0
1
m
m−1
X
x2j+1 z jk
(11.24)
j=0
where z = e−2πi/m .
A look at Equation (11.24) shows that the two sums within the brackets have the same form as Equation
(11.13). In other words, Equation (11.24) shows how we can compute an n-point FFT from two n2 -point
FFTs. That means that a DFT can be computed recursively, cutting the sample size in half at each recursive
step.
In a shared-memory setting such as OpenMP, we could implement this recursive algorithm in the manners
of Quicksort in Chapter 10.
In a message-passing setting, again because this is a divide-and-conquer algorithm, we can use the pattern
of Hyperquicksort, also in Chapter 10.
Some digital signal processing chips implement this in hardware, with a special interconnection network to
implement this algorithm.
11.3.3
A Matrix Approach
The matrix form of (11.13) is
C=
1
AX
n
(11.25)
where A is n x n. Element (j,k) of A is q jk , while element j of X is xj . This formulation of the problem then
naturally leads one to use parallel methods for matrix multiplication, as in Chapter 9.
Divide-and-conquer tends not to work too well in shared-memory settings, because after some point, fewer
and fewer threads will have work to do. Thus this matrix formulation is quite valuable.
11.3.4
Parallelizing Computation of the Inverse Transform
The form of the DFT (11.13) and its inverse (11.20) are very similar. For example, the inverse transform is
again of a matrix form as in (11.25); even the new matrix looks a lot like the old one.6
6
In fact, one can obtain the new matrix easily from the old, as explained in Section 11.8.
190
CHAPTER 11. PARALLEL COMPUTATION FOR IMAGE PROCESSING
Thus the methods mentioned above, e.g. FFT and the matrix approach, apply to calculation of the inverse
transforms too.
11.3.5
Parallelizing Computation of the Two-Dimensional Transform
Regroup (11.21) as:
n−1
crs =
1X
n
j=0
m−1
ks
1 X
xjk e−2πi( m )
m
!
jr
e−2πi( n )
(11.26)
k=0
n−1
=
jr
1X
yjs e−2πi( n )
n
(11.27)
j=0
Note that yjs , i.e. the expression between the large parentheses, is the sth component of the DFT of the
jth row of our data. And hey, the last expression (11.27) above is in the same form as (11.13)! Of course,
this means we are taking the DFT of the spectral coefficients rather than observed data, but numbers are
numbers.
In other words: To get the two-dimensional DFT of our data, we first get the one-dimensional DFTs of
each row of the data, place these in rows, and then find the DFTs of each column. This property is called
separability.
This certainly opens possibilities for parallelization. Each thread (shared memory case) or node (message
passing case) could handle groups of rows of the original data, and in the second stage each thread could
handle columns.
Or, we could interchange rows and columns in this process, i.e. put the j sum inside and k sum outside in
the above derivation.
11.4
Applications to Image Processing
In image processing, there are a number of different operations which we wish to perform. We will consider
two of them here.
11.4.1
Smoothing
An image may be too “rough.” There may be some pixels which are noise, accidental values that don’t fit
smoothly with the neighboring points in the image.
11.4. APPLICATIONS TO IMAGE PROCESSING
191
One way to smooth things out would be to replace each pixel intensity value7 by the mean or median among
the pixels neighbors. These could be the four immediate neighbors if just a little smoothing is needed, or we
could go further out for a higher amount of smoothing. There are many variants of this.
But another way would be to apply a low-pass filter to the DFT of our image. This means that after we
compute the DFT, we simply delete the higher harmonics, i.e. set crs to 0 for the larger values of r and s.
We then take the inverse transform back to the spatial domain. Remember, the sine and cosine functions of
higher harmonics are “wigglier,” so you can see that all this will have the effect of removing some of the
wiggliness in our image—exactly what we wanted.
We can control the amount of smoothing by the number of harmonics we remove.
The term low-pass filter obviously alludes to the fact that the low frequencies “pass” through the filter but
the high frequencies are blocked. Since we’ve removed the high-oscillatory components, the effect is a
smoother image.8
To do smoothing in parallel, if we just average neighbors, this is easily parallelized. If we try a low-pass
filter, then we use the parallelization methods shown here earlier.
11.4.2
Edge Detection
In computer vision applications, we need to have a machine-automated way to deduce which pixels in an
image form an edge of an object.
Again, edge-detection can be done in primitive ways. Since an edge is a place in the image in which there
is a sharp change in the intensities at the pixels, we can calculate slopes of the intensities, in the horizontal
and vertical directions. (This is really calculating the approximate values of the partial derivatives in those
directions.)
But the Fourier approach would be to apply a high-pass filter. Since an edge is a set of pixels which are
abruptly different from their neighbors, we want to keep the high-frequency components and block out the
low ones.
Again, this means first taking the Fourier transform of the original, then deleting the low-frequency terms,
then taking the inverse transform to go back to the spatial domain.
Below we have “before and after” pictures, first of original data and then the picture after an edge-detection
process has been applied.9
7
Remember, there may be three intensity values per pixel, for red, green and blue.
Note that we may do more smoothing in some parts of the image than in others.
9
These pictures are courtesy of Bill Green of the Robotics Laboratory at Drexel University. In this case he is using a Sobel
process instead of Fourier analysis, but the result would have been similar for the latter. See his Web tutorial at www.pages.
drexel.edu/˜weg22/edge.html, including the original pictures, which may not show up well in our printed book here.
8
192
CHAPTER 11. PARALLEL COMPUTATION FOR IMAGE PROCESSING
The second picture looks like a charcoal sketch! But it was derived mathematically from the original picture,
using edge-detection methods.
Note that edge detection methods also may be used to determine where sounds (“ah,” “ee”) begin and end
in speech-recognition applications. In the image case, edge detection is useful for face recognition, etc.
Parallelization here is similar to that of the smoothing case.
11.5
The Cosine Transform
It’s inconvenient, to say the least, to work with all those complex numbers. But an alternative exists in the
form of the cosine transform, which is a linear combination of cosines in the one-dimensional case, and of
products of cosines in the two-dimensional case.
n−1 m−1
duv = √
XX
2
(2k + 1)vπ
(2j + 1)uπ
Y (u)Y (v)
xjk cos
cos
,
2n
2m
mn
j=0 k=0
(11.28)
11.6. KEEPING THE PIXEL INTENSITIES IN THE PROPER RANGE
193
√
where Y (0) = 1/ 2 and Y (t) = 1 for t > 0.
n−1 m−1
xjk = √
11.6
2 XX
(2j + 1)uπ
(2k + 1)vπ
Y (u)Y (v)duv cos
cos
,
2n
2m
mn u=0 v=0
(11.29)
Keeping the Pixel Intensities in the Proper Range
Normally pixel intensities are stored as integers between 0 and 255, inclusive. With many of the operations
mentioned above, both Fourier-based and otherwise, we can get negative intensity values, or values higher
than 255. We may wish to discard the negative values and scale down the positive ones so that most or all
are smaller than 256.
Furthermore, even if most or all of our values are in the range 0 to 255, they may be near 0, i.e. too faint. If
so, we may wish to multiply them by a constant.
11.7
Does the Function g() Really Have to Be Repeating?
It is clear that in the case of a vibrating reed, our loudness function g(t) really is periodic. What about other
cases?
A graph of your voice would look “locally periodic.” One difference would be that the graph would exhibit
more change through time as you make various sounds in speaking, compared to the one repeating sound
for the reed. Even in this case, though, your voice is repeating within short time intervals, each interval
corresponding to a different sound. If you say the word eye, for instance, you make an “ah” sound and then
an “ee” sound. The graph of your voice would show one repeating pattern during the time you are saying
“ah,” and another repeating pattern during the time you are saying “ee.” So, even for voices, we do have
repeating patterns over short time intervals.
On the other hand, in the image case, the function may be nearly constant for long distances (horizontally
or vertically), so a local periodicity argument doesn’t seem to work there.
The fact is, though, that it really doesn’t matter in the applications we are considering here. Even though
mathematically our work here has tacitly assumed that our image is duplicated infinitely times (horizontally
and vertically),10 we don’t care about this. We just want to get a measure of “wiggliness,” and fitting linear
combinations of trig functions does this for us.
10
And in the case of the cosine transform, implicitly we are assuming that the image flips itself on every adjacent copy of the
image, first right-side up, then upside-own, then right-side up again, etc.
194
11.8
CHAPTER 11. PARALLEL COMPUTATION FOR IMAGE PROCESSING
Vector Space Issues (optional section)
The theory of Fourier series (and of other similar transforms), relies on vector spaces. It actually is helpful
to look at some of that here. Let’s first discuss the derivation of (11.13).
Define X and C as in Section 11.2. X’s components are real, but it is also a member of the vector space V
of all n-component arrays of complex numbers.
For any complex number a+bi, define its conjugate, a + bi = a − bi. Note that
eiθ = cos θ − i sin θ == cos(−θ) + i sin(−θ) = e−iθ
(11.30)
Define an inner product (“dot product”),
n−1
[u, w] =
1X
uj w̄j .
n
(11.31)
j=0
Define
vh = (1, q −h , q −2h , ..., q −(n−1)h ), h = 0, 1, ..., n − 1.
(11.32)
Then it turns out that the vh form an orthonormal basis for V.11 For example, to show orthnogonality, observe
that for r 6= s
n−1
[vr , vs ] =
=
1X
vrj vsj
n
j=0
1 X j(−r+s)
q
n
(11.33)
(11.34)
j=0
1 − q (−r+s)n
n(1 − q)
= 0,
=
due to the identity 1 + y + y 2 + .... + y k =
computation shows that [vr , vs ] = 1.
11
1−y k+1
1−y
(11.35)
(11.36)
and the fact that q n = 1. In the case r = s, the above
Recall that this means that these vectors are orthogonal to each other, and have length 1, and that they span V.
11.9. BANDWIDTH: HOW TO READ THE SAN FRANCISCO CHRONICLE BUSINESS PAGE (OPTIONAL SECTION)1
The DFT of X, which we called C, can be considered the “coordinates” of X in V, relative to this orthonormal
basis. The kth coordinate is then [X, vk ], which by definition is (11.13).
The fact that we have an orthonormal basis for V here means that the matrix A/n in (11.25) is an orthogonal
matrix. For real numbers, this means that this matrix’s inverse is its transpose. In the complex case, instead
t
of a straight transpose, we do a conjugate transpose, B = A/n , where t means transpose. So, B is the
inverse of A/n. In other words, in (11.25), we can easily get back to X from C, via
X = BC =
1 t
Ā C.
n
(11.37)
It’s really the same for the nondiscrete case. Here the vector space consists of all the possible periodic
functions g() (with reasonable conditions placed regarding continuity etc.) forms the vector space, and the
sine and cosine functions form an orthonormal basis. The an and bn are then the “coordinates” of g() when
the latter is viewed as an element of that space.
11.9
Bandwidth: How to Read the San Francisco Chronicle Business Page
(optional section)
The popular press, especially business or technical sections, often uses the term bandwidth. What does this
mean?
Any transmission medium has a natural range [fmin ,fmax ] of frequencies that it can handle well. For
example, an ordinary voice-grade telephone line can do a good job of transmitting signals of frequencies in
the range 0 Hz to 4000 Hz, where “Hz” means cycles per second. Signals of frequencies outside this range
suffer fade in strength, i.e are attenuated, as they pass through the phone line.12
We call the frequency interval [0,4000] the effective bandwidth (or just the bandwidth) of the phone line.
In addition to the bandwidth of a medium, we also speak of the bandwidth of a signal. For instance,
although your voice is a mixture of many different frequencies, represented in the Fourier series for your
voice’s waveform, the really low and really high frequency components, outside the range [340,3400], have
very low power, i.e. their an and bn coefficients are small. Most of the power of your voice signal is in that
range of frequencies, which we would call the effective bandwidth of your voice waveform. This is also the
reason why digitized speech is sampled at the rate of 8,000 samples per second. A famous theorem, due to
Nyquist, shows that the sampling rate should be double the maximum frequency. Here the number 3,400 is
“rounded up” to 4,000, and after doubling we get 8,000.
Obviously, in order for your voice to be heard well on the other end of your phone connection, the bandwidth
of the phone line must be at least as broad as that of your voice signal, and that is the case.
12
And in fact will probably be deliberately filtered out.
196
CHAPTER 11. PARALLEL COMPUTATION FOR IMAGE PROCESSING
However, the phone line’s bandwidth is not much broader than that of your voice signal. So, some of the
frequencies in your voice will fade out before they reach the other person, and thus some degree of distortion
will occur. It is common, for example, for the letter ‘f’ spoken on one end to be mis-heard as ‘s’on the other
end. This also explains why your voice sounds a little different on the phone than in person. Still, most
frequencies are reproduced well and phone conversations work well.
We often use the term “bandwidth” to literally refer to width, i.e. the width of the interval [fmin , fmax ].
There is huge variation in bandwidth among transmission media. As we have seen, phone lines have bandwidth intervals covering values on the order of 103 . For optical fibers, these numbers are more on the order
of 1015 .
The radio and TV frequency ranges are large also, which is why, for example, we can have many AM radio
stations in a given city. The AM frequency range is divided into subranges, called channels. The width of
these channels is on the order of the 4000 we need for a voice conversation. That means that the transmitter
at a station needs to shift its content, which is something like in the [0,4000] range, to its channel range. It
does that by multiplying its content times a sine wave of frequency equal to the center of the channel. If one
applies a few trig identities, one finds that the product signal falls into the proper channel!
Accordingly, an optical fiber could also carry many simultaneous phone conversations.
Bandwidth also determines how fast we can set digital bits. Think of sending the sequence 10101010... If
we graph this over time, we get a “squarewave” shape. Since it is repeating, it has a Fourier series. What
happends if we double the bit rate? We get the same graph, only horizontally compressed by a factor of two.
The effect of this on this graph’s Fourier series is that, for example, our former a3 will now be our new a6 ,
i.e. the 2π · 3f0 frequency cosine wave component of the graph now has the double the old frequency, i.e. is
now 2π · 6f0 . That in turn means that the effective bandwidth of our 10101010... signal has doubled too.
In other words: To send high bit rates, we need media with large bandwidths.
Chapter 12
Parallel Computation in Statistics/Data
Mining
How did the word statistics get supplanted by data mining? In a word, it is a matter of scale.
In the old days of statistics, a data set of 300 observations on 3 or 4 variables was considered large. Today,
the widespread use of computers and the Web yield data sets with numbers of observations that are easily in
the tens of thousands range, and in a number of cases even tens of millions. The numbers of variables can
also be in the thousands or more.
In addition, the methods have become much more combinatorial in nature. In a classification problem,
for instance, the old discriminant analysis involved only matrix computation, whereas a nearest-neighbor
analysis requires far more computer cycles to complete.
In short, this calls for parallel methods of computation.
12.1
Itemset Analysis
12.1.1
What Is It?
The term data mining is a buzzword, but all it means is the process of finding relationships among a set of
variables. In other words, it would seem to simply be a good old-fashioned statistics problem.
Well, in fact it is simply a statistics problem—but writ large, as mentioned earlier.
Major, Major Warning: With so many variables, the chances of picking up spurious relations between
variables is large. And although many books and tutorials on data mining will at least pay lip service to this
197
198
CHAPTER 12. PARALLEL COMPUTATION IN STATISTICS/DATA MINING
issue (referring to it as overfitting, they don’t emphasize it enough.1
Putting the overfitting problem aside, though, by now the reader’s reaction should be, “This calls for parallel
processing,” and he/she is correct. Here we’ll look at parallelizing a particular problem, called itemset
analysis, the most famous example of which is the market basket problem:
12.1.2
The Market Basket Problem
Consider an online bookstore has records of every sale on the store’s site. Those sales may be represented
as a matrix S, whose (i,j)th element Sij is equal to either 1 or 0, depending on whether the ith sale included
book j, i = 0,1,...,s-1, j = 0,1,...,t-1. So each row of S represents one sale, with the 1s in that row showing
which titles were bought. Each column of S represents one book title, with the 1s showing which sales
transactions included that book.
Let’s denote the entire line of book titles by T0 , ..., Tb−1 . An itemset is just a subset of this. A frequent
itemset is one which appears in many of sales transactions. But there is more to it than that. The store wants
to choose some books for special ads, of the form “We see you bought books X and Y. We think you may
be interested in Z.”
Though we are using marketing as a running example here (which is the typical way that this subject is
introduced), we will usually just refer to “items” instead of books, and to “database records” rather than
sales transactions.
We have the following terminology:
• An association rule I → J is simply an ordered pair of disjoint itemsets I and J.
• The support of an an association rule I → J is the proportion of records which include both I and J.
• The confidence of an association rule I → J is the proportion of records which include J, among
those records which include I.
Note that in probability terms, the support is basically P(I and J) while the confidence is P(J|I). If the
confidenc the book business, it means that buyers of the books in set I also tend to buy those in J. But this
information is not very useful if the support is low, because it means that the combination occurs so rarely
that it’s not worth our time to deal with it.
So, the user—let’s call him/her the “data miner”—will first set thresholds for support and confidence, and
then set out to find all association rules for which support and confidence exceed their respective thresholds.
1
Some writers recommend splitting one’s data into a training set, which is used to discover relationships, and a validation set,
which is used to confirm those relationships. However, overfitting can still occur even with this precaution.
12.1. ITEMSET ANALYSIS
12.1.3
199
Serial Algorithms
Various algorithms have been developed to find frequent itemsets and association rules. The most famous
one for the former task is the Apriori algorithm. Even it has many forms. We will discuss one of the
simplest forms here.
The algorithm is basically a breadth-first tree search. At the root we find the frequent 1-item itemsets. In the
online bookstore, for instance, this would mean finding all individual books that appear in at least r of our
sales transaction records, where r is our threshold.
At the second level, we find the frequent 2-item itemsets, e.g. all pairs of books that appear in at least r sales
records, and so on. After we finish with level i, we then generate new candidate itemsets of size i+1 from
the frequent itemsets we found of size i.
The key point in the latter operation is that if an itemset is not frequent, i.e. has support less than the
threshold, then adding further items to it will make it even less frequent. That itemset is then pruned from
the tree, and the branch ends.
Here is the pseudocode:
set F1 to the set of 1-item itemsets whose support exceeds the threshold
for i = 2 to b
Fi = φ
for each I in Fi−1
for each K in F1
Q=I ∪K
if support(Q) exceeds support threshold
add Q to Fi
if Fi is empty break
return ∪i Fi
Again, there are many refinements of this, which shave off work to be done and thus increase speed. For
example, we should avoid checking the same itemsets twice, e.g. first {1,2} then {2,1}. This can be
accomplished by keeping itemsets in lexicographical order. We will not pursue any refinements here.
12.1.4
Parallelizing the Apriori Algorithm
Clearly there is lots of opportunity for parallelizing the serial algorithm above. Both of the inner for loops
can be parallelized in straightforward ways; they are “embarrassingly parallel.” There are of course critical
sections to worry about in the shared-memory setting, and in the message-passing setting one must designate
a manager node in which to store the Fi .
200
CHAPTER 12. PARALLEL COMPUTATION IN STATISTICS/DATA MINING
However, as more and more refinements are made in the serial algorithm, then the parallelism in this algorithm become less and less “embarrassing.” And things become more challenging if the storage needs of
the Fi , and of their associated “accounting materials” such as a directory showing the current tree structure
(done via hash trees), become greater than what can be stored in the memory of one node.
In other words, parallelizing the market basket problem can be very challenging. The interested reader is
referred to the considerable literature which has developed on this topic.
12.2
Probability Density Estimation
Let X denote some quantity of interest in a given population, say people’s heights. Technically, the probability density function of X, typically denoted by f, is a function on the real line with the following
properties:
• f (t) ≥ 0 for all t
• for any r < s,
Z
P (r < X < s) =
s
f (t) dt
(12.1)
r
(Note that this implies that f integrates to 1.)
This seems abstract, but it’s really very simple: Say we have data on X, n sample values X1 , ..., Xn , and we
plot a histogram from this data. Then f is what the histogram is estimating. If we have more and more data,
the histogram gets closer and closer to the true f.2
So, how do we estimate f, and how do we use parallel computing to reduce the time needed?
12.2.1
Kernel-Based Density Estimation
Histogram computation breaks the real down into intervals, and then counts how many Xi fall into each
interval. This is fine as a crude method, but one can do better.
No matter what the interval width is, the histogram will consist of a bunch of rectanges, rather than a smooth
curve. This problem basically stems from a lack of weighting on the data.
For example, suppose we are estimating f(25.8), and suppose our histogram interval is [24.0,26.0], with 54
points falling into that interval. Intuitively, we can do better if we give the points closer to 25.8 more weight.
2
The histogram must be scaled to have total area 1. Most statistical programs have options for this.
12.2. PROBABILITY DENSITY ESTIMATION
201
One way to do this is called kernel-based density estimation, which for instance in R is handled by the
function density().
We need a set of weights, more precisely a weight function k, called the kernel. Any nonnegative function
which integrates to 1—i.e. a density function in its own right—will work. Typically k is taken to be the
Gaussian or normal density function,
1
2
k(u) = √ e−0.5u
2π
(12.2)
Our estimator is then
n
1 X
k
fb(t) =
nh
i=1
t − Xi
h
(12.3)
In statistics, it is customary to use the bsymbol (pronounced “hat”) to mean “estimate of.” Here fb means
the estimate of f.
Note carefully that we are estimating an entire function! There are infinitely many possible values of t,
thus infinitely many values of f(t) to be estimated. This is reflected in (12.3), as fb(t) does indeed give a
(potentially) different value for each t.
Here h, called the bandwidth, is playing a role analogous to the interval width in the case of histograms.
Again, this looks very abstract, but all it is doing is assigning weights to the data. Consider our example
above in which we wish to estimate f(25.8), i.e. t = 25.8 and h = 6.0. If say, X88 is 1209.1, very far as awa
from 25.8, we don’t want this data point to have much weight in our estimation of f(25.8). Well, it won’t
have much weight at all, because the quantity
u=
25.8 − 88
6
(12.4)
will be very large, and (12.2) will be tiny, as u will be way, way out in the left tail.
Now, keep all this in perspective. In the end, we will be plotting a curve, just like we do with a histogram.
We simply have a more sophiticated way to do this than plotting a histogram. Following are the graphs
generated first by the histogram method, then by the kernel method, on the same data:
202
CHAPTER 12. PARALLEL COMPUTATION IN STATISTICS/DATA MINING
200
0
100
Frequency
300
Histogram of x
0
5
10
15
20
x
0.10
0.00
0.05
Density
0.15
density.default(x = x)
0
5
10
15
20
N = 1000 Bandwidth = 0.7161
There are many ways to parallelize this computation, such as:
• Remember, we are going to compute (12.3) for many values of t. So, we can just have each process
compute a block of those values.
• We may wish to try several different values of h, just as we might try several different interval widths
for a histogram. We could have each process compute using its own values of h.
• It can be shown that (12.3) has the form of something called a convolution. The theory of convolution
12.2. PROBABILITY DENSITY ESTIMATION
203
would take us too far afield,3 but this fact is useful here, as the Fourier transform of a convolution can
be shown to be the product of the Fourier transforms of the two convolved components.4 In other
words, this reduces the problem to that of parallelizing Fourier transforms—something we know how
to do, from Chapter 11.
12.2.2
Histogram Computation for Images
In image processing, histograms are use to find tallies of how many pixels there are of each intensity. (Note
that there is thus no interval width issue, as there is a separate “interval” value for each possible intensity
level.) The serial pseudocode is:
for i = 1,...,numintenslevels:
count = 0
for row = 1,...,numrows:
for col = 1,...,numcols:
if image[row][col] == i: count++
hist[i] = count
On the surface, this is certainly an “embarrassingly parallel” problem. In OpenMP, for instance, we might
have each thread handle a block of rows of the image, i.e. parallelize the for row loop. In CUDA, we might
have each thread handle an individual pixel, thus parallelizing the nested for row/col loops.
However, to make this go fast is a challenge, say in CUDA, due to issues of what to store in shared memory,
when to swap it out, etc. A very nice account of fine-tuning this computation in CUDA is given in Histogram
Calculation in CUDA, by Victor Podlozhnyuk of NVIDIA, 2007, http://developer.download.
nvidia.com/compute/cuda/1_1/Website/projects/histogram256/doc/histogram.
pdf. The actual code is at http://developer.download.nvidia.com/compute/cuda/sdk/
website/Data-Parallel_Algorithms.html#histogram. A summary follows:
3
If you’ve seen the term before and are curious as to how this is a convolution, read on:
Write (12.3) as
fb(t) =
„
«
n
X
1
t − Xi
1
k
·
h
h
n
i=1
(12.5)
Now consider two artificial random variables U and V, created just for the purpose of facilitating computation, defined as follows.
The random variable U takes on the values ih with probability g · h1 k(i), i = -c,-c+1,...,0,1,...,c for some value of c that we choose
to cover most of the area under k, with g chose so that the probabilities sum to 1. The random variable V takes on the values
X1 , ..., Xn (considered fixed here), with probability 1/n each. U and V are set to be independent.
Then (g times) (12.5) becomes P(U+V=t), exactly what convolution is about, the probability mass function (or density, in the
continuous case) of a random variable arising as the sum of two independent nonnegative random variables.
4
Again, if you have some background in probability and have see characteristic functions, this fact comes from the fact that the
characteristic function of the sum of two independent random variables is equal to the product of the characteristic functions of the
two variables.
204
CHAPTER 12. PARALLEL COMPUTATION IN STATISTICS/DATA MINING
Podlozhnyuk’s overall plan is to have the threads compute subhistograms for various chunks of the image,
then merge the subhistograms to create the histogram for the entire data set. Each thread will handle 1/k of
the image’s pixels, where k is the total number of threads in the grid, i.e. across all blocks.
Since the subhistograms are accessed repeatedly, we want to store them in shared memory. In Podlozhnyuk’s
first cut at the problem, he maintains a separate subhistogram for each thread. He calls this version of the
code histogram64. The name stems from the fact that only 64 intensity levels are used, i.e. the more
significant 6 bits of each pixel’s data byte. The reason for this restriction will be discussed later.
The subhistograms in this code are one-dimensional arrays of length 64 bytes, one count per image intensity
level. However, these arrays must be placed judiciously within the shared memory for a block, so that the
threads get involved in as few bank conflicts as possible. Podlozhnyuk devised a clever way to do this, which
in fact generates no bank conflicts at all.
In the end, the many subhistograms within a block must be merged, and those merged counts must in turn
be merged across all blocks. The former operation is done again by careful ordering to avoid any bank
conflicts, and then (if the hardware has the capability) via calls to atomicAdd().
Now, why does histogram64 tabulate image intensities at only 6-bit granularity? It’s simply a matter of
resource limitations. Podlozhnyuk notes that NVIDIA says that for best efficiency, there should be between
128 and 256 threads per block. He takes the middle ground, 192. With 16K of shared memory per block,
16K/192 works out to about 85 bytes per thread. That eliminates computing a histogram for the full 8-bit
image data, with 256 intensity levels; all we can accommodate is 6 bits, for 64 levels.
Accordingly, Podlozhnyuk offers histogram256, which refines the process, by having one subhistogram per
warp, instead of per thread. This allows the full 8-bit data, 256 levels, to be tabulated, one word devoted to
each count, rather than just one byte. A subhistogram is now a table, 256 rows by 32 columns (one for each
thread in the warp), with each table entry being 4 bytes (1 byte is not sufficient, as 32 threads are tabulating
with it).
12.3
Clustering
Suppose you have data consisting of (X,Y) pairs, which when plotted look like this:
12.3. CLUSTERING
205
●
5
0
xy[,2]
10
● ●
● ●
●
●
●
● ●
●●
●
●
●
●
●
●
●
● ●
● ●●●
●●
●
●
● ●
● ● ● ●
●
●
●
●
● ●
●●
●
● ●
●
●●
●
●● ● ●
● ● ● ●●
● ●
●●
● ●
●
●●
●
●● ●
●
●●
●
●
●
●●
●
●
●●●
● ●
●
●●
●
●
● ● ●
●
●
● ●●
●
●
●
●
●●
●
●
●
●
●
●●●
●
● ●
●●
● ●●●●●
●
●
●
●●
●
●
● ●● ●
●
●
●
●
●
●
●
●
●● ●
●
●
● ●●
● ●●
●
● ●● ●●
●●●
●
●● ● ●●
●
● ●● ● ●● ● ●
●
● ●
●
●
●
● ●● ●
●
● ●●
●
●
●
●
● ●
●
●
●
●
●
●
●
●
●
●●●●●
●
●
●●
● ●●
●● ●
●
●
●
●
●
●
●●
●●
● ●
● ●
●
●●
●
● ●
● ●●
●●
●
●
● ●
●
●
● ● ●
●●
● ●
●
●
●●
●
●
●
●
●
● ●
●●● ● ●
●
●
● ● ● ●
●
● ●
●
●
●
●
● ● ●●●
●
●●●
●
●
●
● ●
●
●
● ●●●● ●●●●
●
●
●● ●
● ●
●
●
●
●
●● ●
● ●
●
● ●●●●
●
● ●●
●
●
●
●
●
●●
●
●●
●●
●●
●●
●
●
●
●
●
●
●
●
●
● ●
●
●
●
●
0
5
10
15
20
xy[,1]
It looks like there may be two or three groups here. What clustering algorithms do is to form groups, both
their number and their membership, i.e. which data points belong to which groups. (Note carefully that
there is no “correct” answer here. This is merely an exploratory data analysis tool.
Clustering is used is many diverse fields. For instance, it is used in image processing for segmentation and
edge detection.
Here we have to two variables, say people’s heights and weights. In general we have many variables, say p
of them, so whatever clustering we find will be in p-dimensional space. No, we can’t picture it very easily
of p is larger than (or even equal to) 3, but we can at least identify membership, i.e. John and Mary are in
group 1, Jenny is in group 2, etc. We may derive some insight from this.
There are many, many types of clustering algorithms. Here we will discuss the famous k-means algorithm,
developed by Prof. Jim MacQueen of the UCLA business school.
The method couldn’t be simpler. Choose k, the number of groups you want to form, and then run this:
1
2
3
4
5
6
7
8
# form initial groups from the first k data points (or choose randomly)
for i = 1,...,k:
group[i] = (x[i],y[i])
center[i] = (x[i],y[i])
do:
for j = 1,...,n:
find the closest center[i] to (x[j],y[j])
cl[j] = the i you got in the previous line
206
9
10
11
12
CHAPTER 12. PARALLEL COMPUTATION IN STATISTICS/DATA MINING
for i = 1,...,k:
group[i] = all (x[j],y[j]) such that cl[j] = i
center[i] = average of all (x,y) in group[i]
until group memberships do not change from one iteration to the next
Definitions of terms:
• Closest means in p-dimensional space, with the usual Euclidean distance: The distance from (a1 , ..., ap
to (b1 , ..., bp is
q
(b1 − a1 )2 + ... + (bp − ap )2
(12.6)
• The center of a group is its centroid, which is a fancy name for taking the average value in each
component of the data points in the group. If p = 2, for example, the center consists of the point
whose X coordinate is the average X value among members of the group, and whose Y coordinate is
the average Y value in the group.
In terms of parallelization, again we have an embarrassingly parallel problem.
12.4
Principal Component Analysis (PCA)
Consider data consisting of (X,Y) pairs as we saw in Section 12.3. Suppose X and Y are highly correlated
with each other. Then for some constants c and d,
Y ≈ c + dX
(12.7)
Then in a sense there is really just one random variable here, as the second is nearly equal to some linear
combination of the first. The second provides us with almost no new information, once we have the first.
In other words, even though the vector (X,Y) roams in two-dimensional space, it usually sticks close to a
one-dimensional object, namely the line (12.7).
Now think again of p variables. It may be the case that there exist r < p variables, consisting of linear
combinations of the p variables, that carry most of the information of the full set of p variables. If r is
much less than p, we would prefer to work with those r variables. In data mining, this is called dimension
reduction.
It can be shown that we can find these r variables by finding the r eigenvectors corresponding to the r largest
eigenvalues of a certain matrix. We will not pursue that here, but the point is that again we have a matrix
formulation, and thus parallelizing the problem can be done easily by using methods for parallel matrix
operations.
12.5. PARALLEL PROCESSING IN R
12.5
Parallel Processing in R
See Chapter 8.
207
208
CHAPTER 12. PARALLEL COMPUTATION IN STATISTICS/DATA MINING
Chapter 13
Parallel Python Threads and
Multiprocessing Modules
There are a number of ways to write parallel Python code.
13.1
The Python Threads and Multiprocessing Modules
Python’s thread system builds on the underlying OS threads. They are thus pre-emptible. Note, though, that
Python adds its own threads manager on top of the OS thread system; see Section 13.1.3.
13.1.1
Python Threads Modules
Python threads are accessible via two modules, thread.py and threading.py. The former is more primitive,
thus easier to learn from, and we will start with it.
13.1.1.1
The thread Module
The example here involves a client/server pair.1 As you’ll see from reading the comments at the start of the
files, the program does nothing useful, but is a simple illustration of the principles. We set up two invocations
of the client; they keep sending letters to the server; the server concatenates all the letters it receives.
1
It is preferable here that the reader be familiar with basic network programming. See my tutorial at http://heather.
cs.ucdavis.edu/˜matloff/Python/PyNet.pdf. However, the comments preceding the various network calls would
probably be enough for a reader without background in networks to follow what is going on.
209
210
CHAPTER 13. PARALLEL PYTHON THREADS AND MULTIPROCESSING MODULES
Only the server needs to be threaded. It will have one thread for each client.
Here is the client code, clnt.py:
1
# simple illustration of thread module
2
3
4
5
6
#
#
#
#
two clients connect to server; each client repeatedly sends a letter,
stored in the variable k, which the server appends to a global string
v, and reports v to the client; k = ’’ means the client is dropping
out; when all clients are gone, server prints the final string v
7
8
# this is the client; usage is
9
10
#
python clnt.py server_address port_number
11
12
13
import socket
import sys
# networking module
14
15
16
# create Internet TCP socket
s = socket.socket(socket.AF_INET, socket.SOCK_STREAM)
17
18
19
host = sys.argv[1] # server address
port = int(sys.argv[2]) # server port
20
21
22
# connect to server
s.connect((host, port))
23
24
25
26
27
28
29
30
31
while(1):
# get letter
k = raw_input(’enter a letter:’)
s.send(k) # send k to server
# if stop signal, then leave loop
if k == ’’: break
v = s.recv(1024) # receive v from server (up to 1024 bytes)
print v
32
33
s.close() # close socket
And here is the server, srvr.py:
1
# simple illustration of thread module
2
3
4
5
6
#
#
#
#
multiple clients connect to server; each client repeatedly sends a
letter k, which the server adds to a global string v and echos back
to the client; k = ’’ means the client is dropping out; when all
clients are gone, server prints final value of v
7
8
# this is the server
9
10
11
import socket
import sys
12
13
14
import thread
# networking module
13.1. THE PYTHON THREADS AND MULTIPROCESSING MODULES
15
16
17
# note the globals v and nclnt, and their supporting locks, which are
#
also global; the standard method of communication between threads is
#
via globals
18
19
20
21
22
23
24
25
26
27
28
29
30
31
32
33
34
35
36
# function for thread to serve a particular client, c
def serveclient(c):
global v,nclnt,vlock,nclntlock
while 1:
# receive letter from c, if it is still connected
k = c.recv(1)
if k == ’’: break
# concatenate v with k in an atomic manner, i.e. with protection
#
by locks
vlock.acquire()
v += k
vlock.release()
# send new v back to client
c.send(v)
c.close()
nclntlock.acquire()
nclnt -= 1
nclntlock.release()
37
38
39
# set up Internet TCP socket
lstn = socket.socket(socket.AF_INET, socket.SOCK_STREAM)
40
41
42
43
44
45
port = int(sys.argv[1]) # server port number
# bind lstn socket to this port
lstn.bind((’’, port))
# start listening for contacts from clients (at most 2 at a time)
lstn.listen(5)
46
47
48
49
50
# initialize concatenated string, v
v = ’’
# set up a lock to guard v
vlock = thread.allocate_lock()
51
52
53
54
55
# nclnt will be the number of clients still connected
nclnt = 2
# set up a lock to guard nclnt
nclntlock = thread.allocate_lock()
56
57
58
59
60
61
62
63
64
65
66
# accept calls from the clients
for i in range(nclnt):
# wait for call, then get a new socket to use for this client,
#
and get the client’s address/port tuple (though not used)
(clnt,ap) = lstn.accept()
# start thread for this client, with serveclient() as the thread’s
#
function, with parameter clnt; note that parameter set must be
#
a tuple; in this case, the tuple is of length 1, so a comma is
#
needed
thread.start_new_thread(serveclient,(clnt,))
67
68
69
# shut down the server socket, since it’s not needed anymore
lstn.close()
70
71
72
# wait for both threads to finish
while nclnt > 0: pass
211
212
CHAPTER 13. PARALLEL PYTHON THREADS AND MULTIPROCESSING MODULES
73
74
print ’the final value of v is’, v
Make absolutely sure to run the programs before proceeding further.2 Here is how to do this:
I’ll refer to the machine on which you run the server as a.b.c, and the two client machines as u.v.w and
x.y.z.3 First, on the server machine, type
python srvr.py 2000
and then on each of the client machines type
python clnt.py a.b.c 2000
(You may need to try another port than 2000, anything above 1023.)
Input letters into both clients, in a rather random pattern, typing some on one client, then on the other, then
on the first, etc. Then finally hit Enter without typing a letter to one of the clients to end the session for that
client, type a few more characters in the other client, and then end that session too.
The reason for threading the server is that the inputs from the clients will come in at unpredictable times. At
any given time, the server doesn’t know which client will sent input next, and thus doesn’t know on which
client to call recv(). One way to solve this problem is by having threads, which run “simultaneously” and
thus give the server the ability to read from whichever client has sent data.4 .
So, let’s see the technical details. We start with the “main” program.5
vlock = thread.allocate_lock()
Here we set up a lock variable which guards v. We will explain later why this is needed. Note that in order
to use this function and others we needed to import the thread module.
nclnt = 2
nclntlock = thread.allocate_lock()
2
You can get them from the .tex source file for this tutorial, located wherever your picked up the .pdf version.
You could in fact run all of them on the same machine, with address name localhost or something like that, but it would be
better on separate machines.
4
Another solution is to use nonblocking I/O. See this example in that context in http://heather.cs.ucdavis.edu/
˜matloff/Python/PyNet.pdf
5
Just as you should write the main program first, you should read it first too, for the same reasons.
3
13.1. THE PYTHON THREADS AND MULTIPROCESSING MODULES
213
We will need a mechanism to insure that the “main” program, which also counts as a thread, will be passive
until both application threads have finished. The variable nclnt will serve this purpose. It will be a count of
how many clients are still connected. The “main” program will monitor this, and wrap things up later when
the count reaches 0.
thread.start_new_thread(serveclient,(clnt,))
Having accepted a a client connection, the server sets up a thread for serving it, via thread.start new thread().
The first argument is the name of the application function which the thread will run, in this case serveclient().
The second argument is a tuple consisting of the set of arguments for that application function. As noted in
the comment, this set is expressed as a tuple, and since in this case our tuple has only one component, we
use a comma to signal the Python interpreter that this is a tuple.
So, here we are telling Python’s threads system to call our function serveclient(), supplying that function
with the argument clnt. The thread becomes “active” immediately, but this does not mean that it starts
executing right away. All that happens is that the threads manager adds this new thread to its list of threads,
and marks its current state as Run, as opposed to being in a Sleep state, waiting for some event.
By the way, this gives us a chance to show how clean and elegant Python’s threads interface is compared to
what one would need in C/C++. For example, in pthreads, the function analogous to thread.start new thread()
has the signature
pthread_create (pthread_t *thread_id, const pthread_attr_t *attributes,
void *(*thread_function)(void *), void *arguments);
What a mess! For instance, look at the types in that third argument: A pointer to a function whose argument
is pointer to void and whose value is a pointer to void (all of which would have to be cast when called).
It’s such a pleasure to work in Python, where we don’t have to be bothered by low-level things like that.
Now consider our statement
while nclnt > 0: pass
The statement says that as long as at least one client is still active, do nothing. Sounds simple, and it is, but
you should consider what is really happening here.
Remember, the three threads—the two client threads, and the “main” one—will take turns executing, with
each turn lasting a brief period of time. Each time “main” gets a turn, it will loop repeatedly on this line. But
all that empty looping in “main” is wasted time. What we would really like is a way to prevent the “main”
function from getting a turn at all until the two clients are gone. There are ways to do this which you will
see later, but we have chosen to remain simple for now.
214
CHAPTER 13. PARALLEL PYTHON THREADS AND MULTIPROCESSING MODULES
Now consider the function serveclient(). Any thread executing this function will deal with only one particular client, the one corresponding to the connection c (an argument to the function). So this while loop does
nothing but read from that particular client. If the client has not sent anything, the thread will block on the
line
k = c.recv(1)
This thread will then be marked as being in Sleep state by the thread manager, thus allowing the other client
thread a chance to run. If neither client thread can run, then the “main” thread keeps getting turns. When a
user at one of the clients finally types a letter, the corresponding thread unblocks, i.e. the threads manager
changes its state to Run, so that it will soon resume execution.
Next comes the most important code for the purpose of this tutorial:
vlock.acquire()
v += k
vlock.release()
Here we are worried about a race condition. Suppose for example v is currently ’abx’, and Client 0 sends
k equal to ’g’. The concern is that this thread’s turn might end in the middle of that addition to v, say right
after the Python interpreter had formed ’abxg’ but before that value was written back to v. This could be a
big problem. The next thread might get to the same statement, take v, still equal to ’abx’, and append, say,
’w’, making v equal to ’abxw’. Then when the first thread gets its next turn, it would finish its interrupted
action, and set v to ’abxg’—which would mean that the ’w’ from the other thread would be lost.
All of this hinges on whether the operation
v += k
is interruptible. Could a thread’s turn end somewhere in the midst of the execution of this statement? If
not, we say that the operation is atomic. If the operation were atomic, we would not need the lock/unlock
operations surrounding the above statement. I did this, using the methods described in Section 13.1.3.5, and
it appears to me that the above statement is not atomic.
Moreover, it’s safer not to take a chance, especially since Python compilers could vary or the virtual machine
could change; after all, we would like our Python source code to work even if the machine changes.
So, we need the lock/unlock operations:
vlock.acquire()
v += k
vlock.release()
13.1. THE PYTHON THREADS AND MULTIPROCESSING MODULES
215
The lock, vlock here, can only be held by one thread at a time. When a thread executes this statement, the
Python interpreter will check to see whether the lock is locked or unlocked right now. In the latter case, the
interpreter will lock the lock and the thread will continue, and will execute the statement which updates v.
It will then release the lock, i.e. the lock will go back to unlocked state.
If on the other hand, when a thread executes acquire() on this lock when it is locked, i.e. held by some other
thread, its turn will end and the interpreter will mark this thread as being in Sleep state, waiting for the lock
to be unlocked. When whichever thread currently holds the lock unlocks it, the interpreter will change the
blocked thread from Sleep state to Run state.
Note that if our threads were non-preemptive, we would not need these locks.
Note also the crucial role being played by the global nature of v. Global variables are used to communicate
between threads. In fact, recall that this is one of the reasons that threads are so popular—easy access to
global variables. Thus the dogma so often taught in beginning programming courses that global variables
must be avoided is wrong; on the contrary, there are many situations in which globals are necessary and
natural.6
The same race-condition issues apply to the code
nclntlock.acquire()
nclnt -= 1
nclntlock.release()
Following is a Python program that finds prime numbers using threads. Note carefully that it is not claimed
to be efficient at all (it may well run more slowly than a serial version); it is merely an illustration of the
concepts. Note too that we are using the simple thread module, rather than threading.
1
#!/usr/bin/env python
2
3
4
5
import sys
import math
import thread
6
7
8
9
10
11
12
13
14
15
16
17
def dowork(tn): # thread number tn
global n,prime,nexti,nextilock,nstarted,nstartedlock,donelock
donelock[tn].acquire()
nstartedlock.acquire()
nstarted += 1
nstartedlock.release()
lim = math.sqrt(n)
nk = 0
while 1:
nextilock.acquire()
k = nexti
6
I think that dogma is presented in a far too extreme manner anyway. See http://heather.cs.ucdavis.edu/
˜matloff/globals.html.
216
18
19
20
21
22
23
24
25
26
27
CHAPTER 13. PARALLEL PYTHON THREADS AND MULTIPROCESSING MODULES
nexti += 1
nextilock.release()
if k > lim: break
nk += 1
if prime[k]:
r = n / k
for i in range(2,r+1):
prime[i*k] = 0
print ’thread’, tn, ’exiting; processed’, nk, ’values of k’
donelock[tn].release()
28
29
30
31
32
33
34
35
36
37
38
39
40
41
42
43
44
45
46
def main():
global n,prime,nexti,nextilock,nstarted,nstartedlock,donelock
n = int(sys.argv[1])
prime = (n+1) * [1]
nthreads = int(sys.argv[2])
nstarted = 0
nexti = 2
nextilock = thread.allocate_lock()
nstartedlock = thread.allocate_lock()
donelock = []
for i in range(nthreads):
d = thread.allocate_lock()
donelock.append(d)
thread.start_new_thread(dowork,(i,))
while nstarted < nthreads: pass
for i in range(nthreads):
donelock[i].acquire()
print ’there are’, reduce(lambda x,y: x+y, prime) - 2, ’primes’
47
48
49
if __name__ == ’__main__’:
main()
So, let’s see how the code works.
The algorithm is the famous Sieve of Erathosthenes: We list all the numbers from 2 to n, then cross out all
multiples of 2 (except 2), then cross out all multiples of 3 (except 3), and so on. The numbers which get
crossed out are composite, so the ones which remain at the end are prime.
Line 32: We set up an array prime, which is what we will be “crossing out.” The value 1 means “not crossed
out,” so we start everything at 1. (Note how Python makes this easy to do, using list “multiplication.”)
Line 33: Here we get the number of desired threads from the command line.
Line 34: The variable nstarted will show how many threads have already started. This will be used later,
in Lines 43-45, in determining when the main() thread exits. Since the various threads will be writing this
variable, we need to protect it with a lock, on Line 37.
Lines 35-36: The variable nexti will say which value we should do “crossing out” by next. If this is, say,
17, then it means our next task is to cross out all multiples of 17 (except 17). Again we need to protect it
with a lock.
Lines 39-42: We create the threads here. The function executed by the threads is named dowork(). We also
13.1. THE PYTHON THREADS AND MULTIPROCESSING MODULES
217
create locks in an array donelock, which again will be used later on as a mechanism for determining when
main() exits (Line 44-45).
Lines 43-45: There is a lot to discuss here.
To start, recall that in srvr.py, our example in Section 13.1.1.1, we didn’t want the main thread to exit until
the child threads were done.7 So, Line 50 was a busy wait, repeatedly doing nothing (pass). That’s a waste
of time—each time the main thread gets a turn to run, it repeatedly executes pass until its turn is over.
Here in our primes program, a premature exit by main() result in printing out wrong answers. On the other
hand, we don’t want main() to engage in a wasteful busy wait. We could use join() from threading.Thread
for this purpose, to be discussed later, but here we take a different tack: We set up a list of locks, one for
each thread, in a list donelock. Each thread initially acquires its lock (Line 9), and releases it when the
thread finishes its work (Lin 27). Meanwhile, main() has been waiting to acquire those locks (Line 45). So,
when the threads finish, main() will move on to Line 46 and print out the program’s results.
But there is a subtle problem (threaded programming is notorious for subtle problems), in that there is no
guarantee that a thread will execute Line 9 before main() executes Line 45. That’s why we have a busy wait
in Line 43, to make sure all the threads acquire their locks before main() does. Of course, we’re trying to
avoid busy waits, but this one is quick.
√
Line 13: We need not check any “crosser-outers” that are larger than n.
Lines 15-25: We keep trying “crosser-outers” until we reach that limit (Line 20). Note the need to use the
lock in Lines 16-19. In Line 22, we check the potential “crosser-outer” for primeness; if we have previously
crossed it out, we would just be doing duplicate work if we used this k as a “crosser-outer.”
Here’s one more example, a type of Web crawler. This one continually monitors the access time of the Web,
by repeatedly accessing a list of “representative” Web sites, say the top 100. What’s really different about
this program, though, is that we’ve reserved one thread for human interaction. The person can, whenever
he/she desires, find for instance the mean of recent access times.
1
2
3
4
import
import
import
import
sys
time
os
thread
5
6
7
8
9
10
11
12
class glbls:
acctimes = [] # access times
acclock = thread.allocate_lock() # lock to guard access time data
nextprobe = 0 # index of next site to probe
nextprobelock = thread.allocate_lock() # lock to guard access time data
sites = open(sys.argv[1]).readlines() # the sites to monitor
ww = int(sys.argv[2]) # window width
13
7
The effect of the main thread ending earlier would depend on the underlying OS. On some platforms, exit of the parent may
terminate the child threads, but on other platforms the children continue on their own.
218
14
15
16
17
18
19
20
21
22
23
24
25
26
27
28
29
30
31
32
33
34
35
36
37
38
39
40
41
CHAPTER 13. PARALLEL PYTHON THREADS AND MULTIPROCESSING MODULES
def probe(me):
if me > 0:
while 1:
# determine what site to probe next
glbls.nextprobelock.acquire()
i = glbls.nextprobe
i1 = i + 1
if i1 >= len(glbls.sites): i1 = 0
glbls.nextprobe = i1
glbls.nextprobelock.release()
# do probe
t1 = time.time()
os.system(’wget --spider -q ’+glbls.sites[i1])
t2 = time.time()
accesstime = t2 - t1
glbls.acclock.acquire()
# list full yet?
if len(glbls.acctimes) < glbls.ww:
glbls.acctimes.append(accesstime)
else:
glbls.acctimes = glbls.acctimes[1:] + [accesstime]
glbls.acclock.release()
else:
while 1:
rsp = raw_input(’monitor: ’)
if rsp == ’mean’: print mean(glbls.acctimes)
elif rsp == ’median’: print median(glbls.acctimes)
elif rsp == ’all’: print all(glbls.acctimes)
42
43
44
def mean(x):
return sum(x)/len(x)
45
46
47
48
49
def median(x):
y = x
y.sort()
return y[len(y)/2]
# a little sloppy
50
51
52
def all(x):
return x
53
54
55
56
57
58
def main():
nthr = int(sys.argv[3]) # number of threads
for thr in range(nthr):
thread.start_new_thread(probe,(thr,))
while 1: continue
59
60
61
if __name__ == ’__main__’:
main()
62
13.1.1.2
The threading Module
The program below treats the same network client/server application considered in Section 13.1.1.1, but
with the more sophisticated threading module. The client program stays the same, since it didn’t involve
13.1. THE PYTHON THREADS AND MULTIPROCESSING MODULES
threads in the first place. Here is the new server code:
1
# simple illustration of threading module
2
3
4
5
6
#
#
#
#
multiple clients connect to server; each client repeatedly sends a
value k, which the server adds to a global string v and echos back
to the client; k = ’’ means the client is dropping out; when all
clients are gone, server prints final value of v
7
8
# this is the server
9
10
11
12
import socket # networking module
import sys
import threading
13
14
15
16
17
18
19
20
21
22
23
24
25
26
27
28
29
30
31
32
33
34
35
36
37
38
39
40
41
# class for threads, subclassed from threading.Thread class
class srvr(threading.Thread):
# v and vlock are now class variables
v = ’’
vlock = threading.Lock()
id = 0 # I want to give an ID number to each thread, starting at 0
def __init__(self,clntsock):
# invoke constructor of parent class
threading.Thread.__init__(self)
# add instance variables
self.myid = srvr.id
srvr.id += 1
self.myclntsock = clntsock
# this function is what the thread actually runs; the required name
#
is run(); threading.Thread.start() calls threading.Thread.run(),
#
which is always overridden, as we are doing here
def run(self):
while 1:
# receive letter from client, if it is still connected
k = self.myclntsock.recv(1)
if k == ’’: break
# update v in an atomic manner
srvr.vlock.acquire()
srvr.v += k
srvr.vlock.release()
# send new v back to client
self.myclntsock.send(srvr.v)
self.myclntsock.close()
42
43
44
45
46
47
48
49
# set up Internet TCP socket
lstn = socket.socket(socket.AF_INET, socket.SOCK_STREAM)
port = int(sys.argv[1]) # server port number
# bind lstn socket to this port
lstn.bind((’’, port))
# start listening for contacts from clients (at most 2 at a time)
lstn.listen(5)
50
51
nclnt = int(sys.argv[2])
# number of clients
52
53
54
55
mythreads = [] # list of all the threads
# accept calls from the clients
for i in range(nclnt):
219
220
56
57
58
59
60
61
62
63
64
65
CHAPTER 13. PARALLEL PYTHON THREADS AND MULTIPROCESSING MODULES
# wait for call, then get a new socket to use for this client,
#
and get the client’s address/port tuple (though not used)
(clnt,ap) = lstn.accept()
# make a new instance of the class srvr
s = srvr(clnt)
# keep a list all threads
mythreads.append(s)
# threading.Thread.start calls threading.Thread.run(), which we
#
overrode in our definition of the class srvr
s.start()
66
67
68
# shut down the server socket, since it’s not needed anymore
lstn.close()
69
70
71
72
# wait for all threads to finish
for s in mythreads:
s.join()
73
74
print ’the final value of v is’, srvr.v
Again, let’s look at the main data structure first:
class srvr(threading.Thread):
The threading module contains a class Thread, any instance of which represents one thread. A typical
application will subclass this class, for two reasons. First, we will probably have some application-specific
variables or methods to be used. Second, the class Thread has a member method run() which is meant to
be overridden, as you will see below.
Consistent with OOP philosophy, we might as well put the old globals in as class variables:
v = ’’
vlock = threading.Lock()
Note that class variable code is executed immediately upon execution of the program, as opposed to when
the first object of this class is created. So, the lock is created right away.
id = 0
This is to set up ID numbers for each of the threads. We don’t use them here, but they might be useful in
debugging or in future enhancement of the code.
def __init__(self,clntsock):
...
self.myclntsock = clntsock
13.1. THE PYTHON THREADS AND MULTIPROCESSING MODULES
221
# ‘‘main’’ program
...
(clnt,ap) = lstn.accept()
s = srvr(clnt)
The “main” program, in creating an object of this class for the client, will pass as an argument the socket for
that client. We then store it as a member variable for the object.
def run(self):
...
As noted earlier, the Thread class contains a member method run(). This is a dummy, to be overridden with
the application-specific function to be run by the thread. It is invoked by the method Thread.start(), called
here in the main program. As you can see above, it is pretty much the same as the previous code in Section
13.1.1.1 which used the thread module, adapted to the class environment.
One thing that is quite different in this program is the way we end it:
for s in mythreads:
s.join()
The join() method in the class Thread blocks until the given thread exits. (The threads manager puts the
main thread in Sleep state, and when the given thread exits, the manager changes that state to Run.) The
overall effect of this loop, then, is that the main program will wait at that point until all the threads are done.
They “join” the main program. This is a much cleaner approach than what we used earlier, and it is also
more efficient, since the main program will not be given any turns in which it wastes time looping around
doing nothing, as in the program in Section 13.1.1.1 in the line
while nclnt > 0: pass
Here we maintained our own list of threads. However, we could also get one via the call threading.enumerate().
If placed after the for loop in our server code above, for instance as
print threading.enumerate()
we would get output like
[<_MainThread(MainThread, started)>, <srvr(Thread-1, started)>,
<srvr(Thread-2, started)>]
Here’s another example, which finds and counts prime numbers, again not assumed to be efficient:
222
1
CHAPTER 13. PARALLEL PYTHON THREADS AND MULTIPROCESSING MODULES
#!/usr/bin/env python
2
3
# prime number counter, based on Python threading class
4
5
6
7
# usage: python PrimeThreading.py n nthreads
#
where we wish the count of the number of primes from 2 to n, and to
#
use nthreads to do the work
8
9
10
11
# uses Sieve of Erathosthenes: write out all numbers from 2 to n, then
# cross out all the multiples of 2, then of 3, then of 5, etc., up to
# sqrt(n); what’s left at the end are the primes
12
13
14
15
import sys
import math
import threading
16
17
18
19
20
21
22
23
24
25
26
27
28
29
30
31
32
33
34
35
36
37
38
39
40
41
42
class prmfinder(threading.Thread):
n = int(sys.argv[1])
nthreads = int(sys.argv[2])
thrdlist = [] # list of all instances of this class
prime = (n+1) * [1] # 1 means assumed prime, until find otherwise
nextk = 2 # next value to try crossing out with
nextklock = threading.Lock()
def __init__(self,id):
threading.Thread.__init__(self)
self.myid = id
def run(self):
lim = math.sqrt(prmfinder.n)
nk = 0 # count of k’s done by this thread, to assess load balance
while 1:
# find next value to cross out with
prmfinder.nextklock.acquire()
k = prmfinder.nextk
prmfinder.nextk += 1
prmfinder.nextklock.release()
if k > lim: break
nk += 1 # increment workload data
if prmfinder.prime[k]: # now cross out
r = prmfinder.n / k
for i in range(2,r+1):
prmfinder.prime[i*k] = 0
print ’thread’, self.myid, ’exiting; processed’, nk, ’values of k’
43
44
45
46
47
48
49
50
def main():
for i in range(prmfinder.nthreads):
pf = prmfinder(i) # create thread i
prmfinder.thrdlist.append(pf)
pf.start()
for thrd in prmfinder.thrdlist: thrd.join()
print ’there are’, reduce(lambda x,y: x+y, prmfinder.prime) - 2, ’primes’
51
52
53
if __name__ == ’__main__’:
main()
13.1. THE PYTHON THREADS AND MULTIPROCESSING MODULES
13.1.2
13.1.2.1
223
Condition Variables
General Ideas
We saw in the last section that threading.Thread.join() avoids the need for wasteful looping in main(),
while the latter is waiting for the other threads to finish. In fact, it is very common in threaded programs to
have situations in which one thread needs to wait for something to occur in another thread. Again, in such
situations we would not want the waiting thread to engage in wasteful looping.
The solution to this problem is condition variables. As the name implies, these are variables used by code
to wait for a certain condition to occur. Most threads systems include provisions for these, and Python’s
threading package is no exception.
The pthreads package, for instance, has a type pthread cond for such variables, and has functions such as
pthread cond wait(), which a thread calls to wait for an event to occur, and pthread cond signal(), which
another thread calls to announce that the event now has occurred.
But as is typical with Python in so many things, it is easier for us to use condition variables in Python
than in C. At the first level, there is the class threading.Condition, which corresponds well to the condition
variables available in most threads systems. However, at this level condition variables are rather cumbersome
to use, as not only do we need to set up condition variables but we also need to set up extra locks to guard
them. This is necessary in any threading system, but it is a nuisance to deal with.
So, Python offers a higher-level class, threading.Event, which is just a wrapper for threading.Condition,
but which does all the condition lock operations behind the scenes, alleviating the programmer of having to
do this work.
13.1.2.2
Event Example
Following is an example of the use of threading.Event. It searches a given network host for servers at
various ports on that host. (This is called a port scanner.) As noted in a comment, the threaded operation
used here would make more sense if many hosts were to be scanned, rather than just one, as each connect()
operation does take some time. But even on the same machine, if a server is active but busy enough that
we never get to connect to it, it may take a long for the attempt to timeout. It is common to set up Web
operations to be threaded for that reason. We could also have each thread check a block of ports on a host,
not just one, for better efficiency.
The use of threads is aimed at checking many ports in parallel, one per thread. The program has a selfimposed limit on the number of threads. If main() is ready to start checking another port but we are at the
thread limit, the code in main() waits for the number of threads to drop below the limit. This is accomplished
by a condition wait, implemented through the threading.Event class.
224
1
2
3
4
5
#
#
#
#
#
CHAPTER 13. PARALLEL PYTHON THREADS AND MULTIPROCESSING MODULES
portscanner.py: checks for active ports on a given machine; would be
more realistic if checked several hosts at once; different threads
check different ports; there is a self-imposed limit on the number of
threads, and the event mechanism is used to wait if that limit is
reached
6
7
# usage:
python portscanner.py host maxthreads
8
9
import sys, threading, socket
10
11
12
13
14
15
16
17
18
19
20
21
22
23
24
25
26
27
28
29
30
31
32
33
34
35
36
37
38
39
40
41
42
43
44
45
class scanner(threading.Thread):
tlist = [] # list of all current scanner threads
maxthreads = int(sys.argv[2]) # max number of threads we’re allowing
evnt = threading.Event() # event to signal OK to create more threads
lck = threading.Lock() # lock to guard tlist
def __init__(self,tn,host):
threading.Thread.__init__(self)
self.threadnum = tn # thread ID/port number
self.host = host # checking ports on this host
def run(self):
s = socket.socket(socket.AF_INET,socket.SOCK_STREAM)
try:
s.connect((self.host, self.threadnum))
print "%d: successfully connected" % self.threadnum
s.close()
except:
print "%d: connection failed" % self.threadnum
# thread is about to exit; remove from list, and signal OK if we
# had been up against the limit
scanner.lck.acquire()
scanner.tlist.remove(self)
print "%d: now active --" % self.threadnum, scanner.tlist
if len(scanner.tlist) == scanner.maxthreads-1:
scanner.evnt.set()
scanner.evnt.clear()
scanner.lck.release()
def newthread(pn,hst):
scanner.lck.acquire()
sc = scanner(pn,hst)
scanner.tlist.append(sc)
scanner.lck.release()
sc.start()
print "%d: starting check" % pn
print "%d: now active --" % pn, scanner.tlist
newthread = staticmethod(newthread)
46
47
48
49
50
51
52
53
54
55
56
57
58
def main():
host = sys.argv[1]
for i in range(1,100):
scanner.lck.acquire()
print "%d: attempting check" % i
# check to see if we’re at the limit before starting a new thread
if len(scanner.tlist) >= scanner.maxthreads:
# too bad, need to wait until not at thread limit
print "%d: need to wait" % i
scanner.lck.release()
scanner.evnt.wait()
else:
13.1. THE PYTHON THREADS AND MULTIPROCESSING MODULES
59
60
61
62
225
scanner.lck.release()
scanner.newthread(i,host)
for sc in scanner.tlist:
sc.join()
63
64
65
if __name__ == ’__main__’:
main()
As you can see, when main() discovers that we are at our self-imposed limit of number of active threads, we
back off by calling threading.Event.wait(). At that point main()—which, recall, is also a thread—blocks.
It will not be given any more timeslices for the time being. When some active thread exits, we have it call
threading.Event.set() and threading.Event.clear(). The threads manager reacts to the former by moving
all threads which had been waiting for this event—in our case here, only main()—from Sleep state to Run
state; main() will eventually get another timeslice.
The call to threading.Event.clear() is crucial. The word clear here means that threading.Event.clear()
is clearing the occurence of the event. Without this, any subsequent call to threading.Event.wait() would
immediately return, even though the condition has not been met yet.
Note carefully the use of locks. The main() thread adds items to tlist, while the other threads delete items
(delete themselves, actually) from it. These operations must be atomic, and thus must be guarded by locks.
I’ve put in a lot of extra print statements so that you can get an idea as to how the threads’ execution is
interleaved. Try running the program.8 But remember, the program may appear to hang for a long time if a
server is active but so busy that the attempt to connect times out.
13.1.2.3
Other threading Classes
The function Event.set() “wakes” all threads that are waiting for the given event. That didn’t matter in our
example above, since only one thread (main()) would ever be waiting at a time in that example. But in more
general applications, we sometimes want to wake only one thread instead of all of them. For this, we can
revert to working at the level of threading.Condition instead of threading.Event. There we have a choice
between using notify() or notifyAll().
The latter is actually what is called internally by Event.set(). But notify() instructs the threads manager to
wake just one of the waiting threads (we don’t know which one).
The class threading.Semaphore offers semaphore operations. Other classes of advanced interest are threading.RLock and threading.Timer.
8
Disclaimer: Not guaranteed to be bug-free.
226
13.1.3
CHAPTER 13. PARALLEL PYTHON THREADS AND MULTIPROCESSING MODULES
Threads Internals
The thread manager acts like a “mini-operating system.” Just like a real OS maintains a table of processes, a
thread system’s thread manager maintains a table of threads. When one thread gives up the CPU, or has its
turn pre-empted (see below), the thread manager looks in the table for another thread to activate. Whichever
thread is activated will then resume execution where it had left off, i.e. where its last turn ended.
Just as a process is either in Run state or Sleep state, the same is true for a thread. A thread is either ready
to be given a turn to run, or is waiting for some event. The thread manager will keep track of these states,
decide which thread to run when another has lost its turn, etc.
13.1.3.1
Kernel-Level Thread Managers
Here each thread really is a process, and for example will show up on Unix systems when one runs the
appropriate ps process-list command, say ps axH. The threads manager is then the OS.
The different threads set up by a given application program take turns running, among all the other processes.
This kind of thread system is is used in the Unix pthreads system, as well as in Windows threads.
13.1.3.2
User-Level Thread Managers
User-level thread systems are “private” to the application. Running the ps command on a Unix system will
show only the original application running, not all the threads it creates. Here the threads are not pre-empted;
on the contrary, a given thread will continue to run until it voluntarily gives up control of the CPU, either by
calling some “yield” function or by calling a function by which it requests a wait for some event to occur.9
A typical example of a user-level thread system is pth.
13.1.3.3
Comparison
Kernel-level threads have the advantage that they can be used on multiprocessor systems, thus achieving
true parallelism between threads. This is a major advantage.
On the other hand, in my opinion user-level threads also have a major advantage in that they allow one to
produce code which is much easier to write, is easier to debug, and is cleaner and clearer. This in turn
stems from the non-preemptive nature of user-level threads; application programs written in this manner
9
In typical user-level thread systems, an external event, such as an I/O operation or a signal, will also also cause the current
thread to relinquish the CPU.
13.1. THE PYTHON THREADS AND MULTIPROCESSING MODULES
227
typically are not cluttered up with lots of lock/unlock calls (details on these below), which are needed in the
pre-emptive case.
13.1.3.4
The Python Thread Manager
Python “piggybacks” on top of the OS’ underlying threads system. A Python thread is a real OS thread. If
a Python program has three threads, for instance, there will be three entries in the ps output.
However, Python’s thread manager imposes further structure on top of the OS threads. It keeps track of
how long a thread has been executing, in terms of the number of Python byte code instructions that have
executed.10 When that reaches a certain number, by default 100, the thread’s turn ends. In other words, the
turn can be pre-empted either by the hardware timer and the OS, or when the interpreter sees that the thread
has executed 100 byte code instructions.11
13.1.3.5
The GIL
In the case of CPython (but not Jython or Iron Python) Most importantly, there is a global interpreter lock,
the famous (or infamous) GIL. It is set up to ensure that only one thread runs at a time, in order to facilitate
easy garbage collection.
Suppose we have a C program with three threads, which I’ll call X, Y and Z. Say currently Y is running.
After 30 milliseconds (or whatever the quantum size has been set to by the OS), Y will be interrupted by
the timer, and the OS will start some other process. Say the latter, which I’ll call Q, is a different, unrelated
program. Eventually Q’s turn will end too, and let’s say that the OS then gives X a turn. From the point of
view of our X/Y/Z program, i.e. ignoring Q, control has passed from Y to X. The key point is that the point
within Y at which that event occurs is random (with respect to where Y is at the time), based on the time of
the hardware interrupt.
By contrast, say my Python program has three threads, U, V and W. Say V is running. The hardware timer
will go off at a random time, and again Q might be given a turn, but definitely neither U nor W will be given
a turn, because the Python interpreter had earlier made a call to the OS which makes U and W wait for the
GIL to become unlocked.
Let’s look at this a little closer. The key point to note is that the Python interpreter itself is threaded, say using
pthreads. For instance, in our X/Y/Z example above, when you ran ps axH, you would see three Python
processes/threads. I just tried that on my program thsvr.py, which creates two threads, with a command-line
argument of 2000 for that program. Here is the relevant portion of the output of ps axH:
28145 pts/5
10
11
Rl
0:09 python thsvr.py 2000
This is the “machine language” for the Python virtual machine.
The author thanks Alex Martelli for a helpful clarification.
228
CHAPTER 13. PARALLEL PYTHON THREADS AND MULTIPROCESSING MODULES
28145 pts/5
28145 pts/5
Sl
Sl
0:00 python thsvr.py 2000
0:00 python thsvr.py 2000
What has happened is the Python interpreter has spawned two child threads, one for each of my threads in
thsvr.py, in addition to the interpreter’s original thread, which runs my main(). Let’s call those threads UP,
VP and WP. Again, these are the threads that the OS sees, while U, V and W are the threads that I see—or
think I see, since they are just virtual.
The GIL is a pthreads lock. Say V is now running. Again, what that actually means on my real machine
is that VP is running. VP keeps track of how long V has been executing, in terms of the number of Python
byte code instructions that have executed. When that reaches a certain number, by default 100, UP will
release the GIL by calling pthread mutex unlock() or something similar.
The OS then says, “Oh, were any threads waiting for that lock?” It then basically gives a turn to UP or WP
(we can’t predict which), which then means that from my point of view U or W starts, say U. Then VP and
WP are still in Sleep state, and thus so are my V and W.
So you can see that it is the Python interpreter, not the hardware timer, that is determining how long a
thread’s turn runs, relative to the other threads in my program. Again, Q might run too, but within this
Python program there will be no control passing from V to U or W simply because the timer went off; such
a control change will only occur when the Python interpreter wants it to. This will be either after the 100
byte code instructions or when U reaches an I/O operation or other wait-event operation.
So, the bottom line is that while Python uses the underlying OS threads system as its base, it superimposes
further structure in terms of transfer of control between threads.
13.1.3.6
Implications for Randomness and Need for Locks
I mentioned in Section 13.1.3.2 that non-pre-emptive threading is nice because one can avoid the code clutter
of locking and unlocking (details of lock/unlock below). Since, barring I/O issues, a thread working on the
same data would seem to always yield control at exactly the same point (i.e. at 100 byte code instruction
boundaries), Python would seem to be deterministic and non-pre-emptive. However, it will not quite be so
simple.
First of all, there is the issue of I/O, which adds randomness. There may also be randomness in how the OS
chooses the first thread to be run, which could affect computation order and so on.
Finally, there is the question of atomicity in Python operations: The interpreter will treat any Python virtual
machine instruction as indivisible, thus not needing locks in that case. But the bottom line will be that unless
you know the virtual machine well, you should use locks at all times.
13.1. THE PYTHON THREADS AND MULTIPROCESSING MODULES
13.1.4
229
The multiprocessing Module
CPython’s GIL is the subject of much controversy. As we saw in Section 13.1.3.5, it prevents running true
parallel applications when using the thread or threading modules.
That might not seem to be too severe a restriction—after all if you really need the speed, you probably won’t
use a scripting language in the first place. But a number of people took the point of view that, given that they
have decided to use Python no matter what, they would like to get the best speed subject to that restriction.
So, there was much grumbling about the GIL.
Thus, later the multiprocessing module was developed, which enables true parallel processing with Python
on a multiprocore machine, with an interface very close to that of the threading module.
Moreover, one can run a program across machines! In other words, the multiprocessing module allows
to run several threads not only on the different cores of one machine, but on many machines at once, in
cooperation in the same manner that threads cooperate on one machine. By the way, this idea is similar
to something I did for Perl some years ago (PerlDSM: A Distributed Shared Memory System for Perl.
Proceedings of PDPTA 2002, 63-68). We will not cover the cross-machine case here.
So, let’s go to our first example, a simulation application that will find the probability of getting a total of
exactly k dots when we roll n dice:
1
# dice probability finder, based on Python multiprocessing class
2
3
4
5
6
# usage: python DiceProb.py n k nreps nthreads
#
where we wish to find the probability of getting a total of k dots
#
when we roll n dice; we’ll use nreps total repetitions of the
#
simulation, dividing those repetitions among nthreads threads
7
8
9
10
import sys
import random
from multiprocessing import Process, Lock, Value
11
12
13
14
15
16
17
class glbls: # globals, other than shared
n = int(sys.argv[1])
k = int(sys.argv[2])
nreps = int(sys.argv[3])
nthreads = int(sys.argv[4])
thrdlist = [] # list of all instances of this class
18
19
20
21
22
23
24
25
26
27
28
29
def worker(id,tot,totlock):
mynreps = glbls.nreps/glbls.nthreads
r = random.Random() # set up random number generator
count = 0 # number of times get total of k
for i in range(mynreps):
if rolldice(r) == glbls.k:
count += 1
totlock.acquire()
tot.value += count
totlock.release()
# check for load balance
230
30
CHAPTER 13. PARALLEL PYTHON THREADS AND MULTIPROCESSING MODULES
print ’thread’, id, ’exiting; total was’, count
31
32
33
34
35
36
37
def rolldice(r):
ndots = 0
for roll in range(glbls.n):
dots = r.randint(1,6)
ndots += dots
return ndots
38
39
40
41
42
43
44
45
46
47
48
49
def main():
tot = Value(’i’,0)
totlock = Lock()
for i in range(glbls.nthreads):
pr = Process(target=worker, args=(i,tot,totlock))
glbls.thrdlist.append(pr)
pr.start()
for thrd in glbls.thrdlist: thrd.join()
# adjust for truncation, in case nthreads doesn’t divide nreps evenly
actualnreps = glbls.nreps/glbls.nthreads * glbls.nthreads
print ’the probability is’,float(tot.value)/actualnreps
50
51
52
if __name__ == ’__main__’:
main()
As in any simulation, the longer one runs it, the better the accuracy is likely to be. Here we run the simulation
nreps times, but divide those repetitions among the threads. This is an example of an “embarrassingly
parallel” application, so we should get a good speedup (not shown here).
So, how does it work? The general structure looks similar to that of the Python threading module, using
Process() to create a create a thread, start() to get it running, Lock() to create a lock, acquire() and release()
to lock and unlock a lock, and so on.
The main difference, though, is that globals are not automatically shared. Instead, shared variables must be
created using Value for a scalar and Array for an array. Unlike Python in general, here one must specify
a data type, ‘i’ for integer and ‘d’ for double (floating-point). (One can use Namespace to create more
complex types, at some cost in performance.) One also specifies the initial value of the variable. One
must pass these variables explicitly to the functions to be run by the threads, in our case above the function
worker(). Note carefully that the shared variables are still accessed syntactically as if they were globals.
Here’s the prime number-finding program from before, now using multiprocessing:
1
#!/usr/bin/env python
2
3
# prime number counter, based on Python multiprocessing class
4
5
6
7
# usage: python PrimeThreading.py n nthreads
#
where we wish the count of the number of primes from 2 to n, and to
#
use nthreads to do the work
8
9
10
# uses Sieve of Erathosthenes: write out all numbers from 2 to n, then
# cross out all the multiples of 2, then of 3, then of 5, etc., up to
13.1. THE PYTHON THREADS AND MULTIPROCESSING MODULES
11
231
# sqrt(n); what’s left at the end are the primes
12
13
14
15
import sys
import math
from multiprocessing import Process, Lock, Array, Value
16
17
18
19
20
class glbls: # globals, other than shared
n = int(sys.argv[1])
nthreads = int(sys.argv[2])
thrdlist = [] # list of all instances of this class
21
22
23
24
25
26
27
28
29
30
31
32
33
34
35
36
37
def prmfinder(id,prm,nxtk,nxtklock):
lim = math.sqrt(glbls.n)
nk = 0 # count of k’s done by this thread, to assess load balance
while 1:
# find next value to cross out with
nxtklock.acquire()
k = nxtk.value
nxtk.value = nxtk.value + 1
nxtklock.release()
if k > lim: break
nk += 1 # increment workload data
if prm[k]: # now cross out
r = glbls.n / k
for i in range(2,r+1):
prm[i*k] = 0
print ’thread’, id, ’exiting; processed’, nk, ’values of k’
38
39
40
41
42
43
44
45
46
47
48
def main():
prime = Array(’i’,(glbls.n+1) * [1]) # 1 means prime, until find otherwise
nextk = Value(’i’,2) # next value to try crossing out with
nextklock = Lock()
for i in range(glbls.nthreads):
pf = Process(target=prmfinder, args=(i,prime,nextk,nextklock))
glbls.thrdlist.append(pf)
pf.start()
for thrd in glbls.thrdlist: thrd.join()
print ’there are’, reduce(lambda x,y: x+y, prime) - 2, ’primes’
49
50
51
if __name__ == ’__main__’:
main()
The main new item in this example is use of Array().
One can use the Pool class to create a set of threads, rather than doing so “by hand” in a loop as above.
You can start them with various initial values for the threads using Pool.map(), which works similarly to
Python’s ordinary map() function.
The multiprocessing documentation warns that shared items may be costly, and suggests using Queue and
Pipe where possible. We will cover the former in the next section. Note, though, that in general it’s difficult
to get much speedup (or difficult even to avoid slowdown!) with non-“embarrassingly parallel” applications.
232
13.1.5
CHAPTER 13. PARALLEL PYTHON THREADS AND MULTIPROCESSING MODULES
The Queue Module for Threads and Multiprocessing
Threaded applications often have some sort of work queue data structure. When a thread becomes free, it
will pick up work to do from the queue. When a thread creates a task, it will add that task to the queue.
Clearly one needs to guard the queue with locks. But Python provides the Queue module to take care of all
the lock creation, locking and unlocking, and so on. This means we don’t have to bother with it, and the
code will probably be faster.
Queue is implemented for both threading and multiprocessing, in almost identical forms. This is good, because the documentation for multiprocessing is rather sketchy, so you can turn to the docs for threading
for more details.
The function put() in Queue adds an element to the end of the queue, while get() will remove the head of
the queue, again without the programmer having to worry about race conditions.
Note that get() will block if the queue is currently empty. An alternative is to call it with block=False,
within a try/except construct. One can also set timeout periods.
Here once again is the prime number example, this time done with Queue:
1
#!/usr/bin/env python
2
3
4
# prime number counter, based on Python multiprocessing class with
# Queue
5
6
7
8
# usage: python PrimeThreading.py n nthreads
#
where we wish the count of the number of primes from 2 to n, and to
#
use nthreads to do the work
9
10
11
12
# uses Sieve of Erathosthenes: write out all numbers from 2 to n, then
# cross out all the multiples of 2, then of 3, then of 5, etc., up to
# sqrt(n); what’s left at the end are the primes
13
14
15
16
import sys
import math
from multiprocessing import Process, Array, Queue
17
18
19
20
21
class glbls: # globals, other than shared
n = int(sys.argv[1])
nthreads = int(sys.argv[2])
thrdlist = [] # list of all instances of this class
22
23
24
25
26
27
28
29
30
31
def prmfinder(id,prm,nxtk):
nk = 0 # count of k’s done by this thread, to assess load balance
while 1:
# find next value to cross out with
try: k = nxtk.get(False)
except: break
nk += 1 # increment workload data
if prm[k]: # now cross out
r = glbls.n / k
13.1. THE PYTHON THREADS AND MULTIPROCESSING MODULES
32
33
34
233
for i in range(2,r+1):
prm[i*k] = 0
print ’thread’, id, ’exiting; processed’, nk, ’values of k’
35
36
37
38
39
40
41
42
43
44
45
46
47
def main():
prime = Array(’i’,(glbls.n+1) * [1]) # 1 means prime, until find otherwise
nextk = Queue() # next value to try crossing out with
lim = int(math.sqrt(glbls.n)) + 1 # fill the queue with 2...sqrt(n)
for i in range(2,lim): nextk.put(i)
for i in range(glbls.nthreads):
pf = Process(target=prmfinder, args=(i,prime,nextk))
glbls.thrdlist.append(pf)
pfs.append(pf)
pf.start()
for thrd in glbls.thrdlist: thrd.join()
print ’there are’, reduce(lambda x,y: x+y, prime) - 2, ’primes’
48
49
50
if __name__ == ’__main__’:
main()
The way Queue is used here is to put all the possible “crosser-outers,” obtained in the variable nextk in the
previous versions of this code, into a queue at the outset. One then uses get() to pick up work from the
queue. Look Ma, no locks!
Below is an example of queues in an in-place quicksort. (Again, the reader is warned that this is just an
example, not claimed to be efficient.)
The work items in the queue are a bit more involved here. They have the form (i,j,k), with the first two
elements of this tuple meaning that the given array chunk corresponds to indices i through j of x, the original
array to be sorted. In other words, whichever thread picks up this chunk of work will have the responsibility
of handling that particular section of x.
Quicksort, of course, works by repeatedly splitting the original array into smaller and more numerous
chunks. Here a thread will split its chunk, taking the lower half for itself to sort, but placing the upper
half into the queue, to be available for other chunks that have not been assigned any work yet. I’ve written
the algorithm so that as soon as all threads have gotten some work to do, no more splitting will occur. That’s
where the value of k comes in. It tells us the split number of this chunk. If it’s equal to nthreads-1, this
thread won’t split the chunk.
1
2
# Quicksort and test code, based on Python multiprocessing class and
# Queue
3
4
5
# code is incomplete, as some special cases such as empty subarrays
# need to be accounted for
6
7
8
9
# usage: python QSort.py n nthreads
#
where we wish to test the sort on a random list of n items,
#
using nthreads to do the work
10
11
import sys
234
12
13
CHAPTER 13. PARALLEL PYTHON THREADS AND MULTIPROCESSING MODULES
import random
from multiprocessing import Process, Array, Queue
14
15
16
17
18
class glbls: # globals, other than shared
nthreads = int(sys.argv[2])
thrdlist = [] # list of all instances of this class
r = random.Random(9876543)
19
20
21
22
23
24
25
26
27
28
29
30
31
32
33
def sortworker(id,x,q):
chunkinfo = q.get()
i = chunkinfo[0]
j = chunkinfo[1]
k = chunkinfo[2]
if k < glbls.nthreads - 1: # need more splitting?
splitpt = separate(x,i,j)
q.put((splitpt+1,j,k+1))
# now, what do I sort?
rightend = splitpt + 1
else: rightend = j
tmp = x[i:(rightend+1)] # need copy, as Array type has no sort() method
tmp.sort()
x[i:(rightend+1)] = tmp
34
35
36
37
38
39
40
41
42
43
44
def separate(xc, low, high): # common algorithm; see Wikipedia
pivot = xc[low] # would be better to take, e.g., median of 1st 3 elts
(xc[low],xc[high]) = (xc[high],xc[low])
last = low
for i in range(low,high):
if xc[i] <= pivot:
(xc[last],xc[i]) = (xc[i],xc[last])
last += 1
(xc[last],xc[high]) = (xc[high],xc[last])
return last
45
46
47
48
49
50
51
52
53
54
55
56
57
58
59
60
61
def main():
tmp = []
n = int(sys.argv[1])
for i in range(n): tmp.append(glbls.r.uniform(0,1))
x = Array(’d’,tmp)
# work items have form (i,j,k), meaning that the given array chunk
# corresponds to indices i through j of x, and that this is the kth
# chunk that has been created, x being the 0th
q = Queue() # work queue
q.put((0,n-1,0))
for i in range(glbls.nthreads):
p = Process(target=sortworker, args=(i,x,q))
glbls.thrdlist.append(p)
p.start()
for thrd in glbls.thrdlist: thrd.join()
if n < 25: print x[:]
62
63
64
if __name__ == ’__main__’:
main()
13.2. USING PYTHON WITH MPI
13.1.6
235
Debugging Threaded and Multiprocessing Python Programs
Debugging is always tough with parallel programs, including threads programs. It’s especially difficult
with pre-emptive threads; those accustomed to debugging non-threads programs find it rather jarring to see
sudden changes of context while single-stepping through code. Tracking down the cause of deadlocks can
be very hard. (Often just getting a threads program to end properly is a challenge.)
Another problem which sometimes occurs is that if you issue a “next” command in your debugging tool,
you may end up inside the internal threads code. In such cases, use a “continue” command or something
like that to extricate yourself.
Unfortunately, as of April 2010, I know of no debugging tool that works with multiprocessing. However,
one can do well with thread and threading.
13.2
Using Python with MPI
(Important note: As of April 2010, a much more widely used Python/MPI interface is MPI4Py. It works
similarly to what is described here.)
A number of interfaces of Python to MPI have been developed.12 A well-known example is pyMPI, developed by a PhD graduate in computer science in UCD, Patrick Miller.
One writes one’s pyMPI code, say in x.py, by calling pyMPI versions of the usual MPI routines. To run the
code, one then runs MPI on the program pyMPI with x.py as a command-line argument.
Python is a very elegant language, and pyMPI does a nice job of elegantly interfacing to MPI. Following is
a rendition of Quicksort in pyMPI. Don’t worry if you haven’t worked in Python before; the “non-C-like”
Python constructs are explained in comments at the end of the code.
1
2
3
4
5
#
#
#
#
#
a type of quicksort; break array x (actually a Python "list") into
p quicksort-style piles, based # on comparison with the first p-1
elements of x, where p is the number # of MPI nodes; the nodes sort
their piles, then return them to node 0, # which strings them all
together into the final sorted array
6
7
import mpi
# load pyMPI module
8
9
10
11
12
13
14
# makes npls quicksort-style piles
def makepiles(x,npls):
pivot = x[:npls] # we’ll use the first npls elements of x as pivots,
# i.e. we’ll compare all other elements of x to these
pivot.sort() # sort() is a member function of the Python list class
pls = [] # initialize piles list to empty
12
If you are not familiar with Python, I have a quick tutorial at http://heather.cs.ucdavis.edu/˜matloff/
python.html.
236
15
16
17
18
19
20
21
22
23
24
25
26
27
28
29
CHAPTER 13. PARALLEL PYTHON THREADS AND MULTIPROCESSING MODULES
lp = len(pivot) # length of the pivot array
# pls will be a list of lists, with the i-th list in pls storing the
# i-th pile; the i-th pile will start with ID i (to enable
# identification later on) and pivot[i]
for i in range(lp): # i = 0,1,...lp-1
pls.append([i,pivot[i]]) # build up array via append() member function
pls.append([lp])
for xi in x[npls:]: # now place each element in the rest of x into
# its proper pile
for j in range(lp): # j = 0,1,...,lp-1
if xi <= pivot[j]:
pls[j].append(xi)
break
elif j == lp-1: pls[lp].append(xi)
return pls
30
31
32
33
34
35
36
37
38
39
40
41
42
43
44
45
46
47
48
49
50
51
52
53
54
55
56
def main():
if mpi.rank == 0: # analog of calling MPI_Rank()
x = [12,5,13,61,9,6,20,1] # small test case
# divide x into piles to be disbursed to the various nodes
pls = makepiles(x,mpi.size)
else: # all other nodes set their x and pls to empty
x = []
pls = []
mychunk = mpi.scatter(pls) # node 0 (not an explicit argument) disburses
# pls to the nodes, each of which receives
# its chunk in its mychunk
newchunk = [] # will become sorted version of mychunk
for pile in mychunk:
# I need to sort my chunk but most remove the ID first
plnum = pile.pop(0) # ID
pile.sort()
# restore ID
newchunk.append([plnum]+pile) # the + is array concatenation
# now everyone sends their newchunk lists, which node 0 (again an
# implied argument) gathers together into haveitall
haveitall = mpi.gather(newchunk)
if mpi.rank == 0:
haveitall.sort()
# string all the piles together
sortedx = [z for q in haveitall for z in q[1:]]
print sortedx
57
58
59
# common idiom for launching a Python program
if __name__ == ’__main__’: main()
Some examples of use of other MPI functions:
mpi.send(mesgstring,destnodenumber)
(message,status) = mpi.recv() # receive from anyone
print message
(message,status) = mpi.recv(3) # receive only from node 3
(message,status) = mpi.recv(3,ZMSG) # receive only message type ZMSG,
# only from node 3
(message,status) = mpi.recv(tag=ZMSG) # receive from anyone, but
# only message type ZMSG
13.2. USING PYTHON WITH MPI
13.2.1
237
Using PDB to Debug Threaded Programs
Using PDB is a bit more complex when threads are involved. One cannot, for instance, simply do something
like this:
pdb.py buggyprog.py
because the child threads will not inherit the PDB process from the main thread. You can still run PDB in
the latter, but will not be able to set breakpoints in threads.
What you can do, though, is invoke PDB from within the function which is run by the thread, by calling
pdb.set trace() at one or more points within the code:
import pdb
pdb.set_trace()
In essence, those become breakpoints.
For example, in our program srvr.py in Section 13.1.1.1, we could add a PDB call at the beginning of the
loop in serveclient():
while 1:
import pdb
pdb.set_trace()
# receive letter from client, if it is still connected
k = c.recv(1)
if k == ’’: break
You then run the program directly through the Python interpreter as usual, NOT through PDB, but then the
program suddenly moves into debugging mode on its own. At that point, one can then step through the code
using the n or s commands, query the values of variables, etc.
PDB’s c (“continue”) command still works. Can one still use the b command to set additional breakpoints?
Yes, but it might be only on a one-time basis, depending on the context. A breakpoint might work only once,
due to a scope problem. Leaving the scope where we invoked PDB causes removal of the trace object. Thus
I suggested setting up the trace inside the loop above.
Of course, you can get fancier, e.g. setting up “conditional breakpoints,” something like:
debugflag = int(sys.argv[1])
...
if debugflag == 1:
import pdb
pdb.set_trace()
238
CHAPTER 13. PARALLEL PYTHON THREADS AND MULTIPROCESSING MODULES
Then, the debugger would run only if you asked for it on the command line. Or, you could have multiple
debugflag variables, for activating/deactivating breakpoints at various places in the code.
Moreover, once you get the (Pdb) prompt, you could set/reset those flags, thus also activating/deactivating
breakpoints.
Note that local variables which were set before invoking PDB, including parameters, are not accessible to
PDB.
Make sure to insert code to maintain an ID number for each thread. This really helps when debugging.
13.2.2
RPDB2 and Winpdb
The Winpdb debugger (www.digitalpeers.com/pythondebugger/),13 is very good. Among
other things, it can be used to debug threaded code, curses-based code and so on, which many debuggers can’t. Winpdb is a GUI front end to the text-based RPDB2, which is in the same package. I have a
tutorial on both at http://heather.cs.ucdavis.edu/˜matloff/winpdb.html.
Another very promising debugger that handles threads is PYDB, by Rocky Bernstein (not to be confused
with an earlier debugger of the same name). You can obtain it from http://code.google.com/p/
pydbgr/ or the older version at http://bashdb.sourceforge.net/pydb/. Invoke it on your
code x.py by typing
$ pydb --threading x.py your_command_line_args_for_x
13
No, it’s not just for Microsoft Windows machines, in spite of the name.
Appendix A
Review of Matrix Algebra
This book assumes the reader has had a course in linear algebra (or has self-studied it, always the better
approach). This appendix is intended as a review of basic matrix algebra, or a quick treatment for those
lacking this background.
A.1
Terminology and Notation
A matrix is a rectangular array of numbers. A vector is a matrix with only one row (a row vector or only
one column (a column vector).
The expression, “the (i,j) element of a matrix,” will mean its element in row i, column j.
Please note the following conventions:
• Capital letters, e.g. A and X, will be used to denote matrices and vectors.
• Lower-case letters with subscripts, e.g. a2,15 and x8 , will be used to denote their elements.
• Capital letters with subscripts, e.g. A13 , will be used to denote submatrices and subvectors.
If A is a square matrix, i.e. one with equal numbers n of rows and columns, then its diagonal elements are
aii , i = 1,...,n.
The norm (or length) of an n-element vector X is
v
u n
uX
kX=t
x2i
i=1
239
(A.1)
240
APPENDIX A. REVIEW OF MATRIX ALGEBRA
A.1.1
Matrix Addition and Multiplication
• For two matrices have the same numbers of rows and same numbers of columns, addition is defined
elementwise, e.g.
1 5
6 2
7 7
0 3 + 0 1 = 0 4
4 8
4 0
8 8
(A.2)
• Multiplication of a matrix by a scalar, i.e. a number, is also defined elementwise, e.g.
2.8 2.8
7 7
0.4 0 4 = 0 1.6
3.2 3.2
8 8
(A.3)
• The inner product or dot product of equal-length vectors X and Y is defined to be
n
X
xk yk
(A.4)
k=1
• The product of matrices A and B is defined if the number of rows of B equals the number of columns
of A (A and B are said to be conformable). In that case, the (i,j) element of the product C is defined
to be
cij =
n
X
aik bkj
(A.5)
k=1
For instance,
7 6 19 66
1
6
0 4
= 8 16
2 4
8 8
24 80
(A.6)
It is helpful to visualize cij as the inner product of row i of A and column j of B, e.g. as shown in bold
face here:
7 6 7 70
1
6
0 4
= 8 16
2 4
8 8
8 80
(A.7)
A.2. MATRIX TRANSPOSE
241
• Matrix multiplicatin is associative and distributive, but in general not commutative:
A.2
A(BC) = (AB)C
(A.8)
A(B + C) = AB + AC
(A.9)
AB 6= BA
(A.10)
Matrix Transpose
• The transpose of a matrix A, denoted A0 or AT , is obtained by exchanging the rows and columns of
A, e.g.
0
7 70
7
8
8
8 16 =
70 16 80
8 80
(A.11)
(A + B)0 = A0 + B 0
(A.12)
(AB)0 = B 0 A0
(A.13)
• If A + B is defined, then
• If A and B are conformable, then
A.3
Linear Independence
Equal-length vectors X1 ,...,Xk are said to be linearly independent if it is impossible for
a1 X1 + ... + ak Xk = 0
unless all the ai are 0.
(A.14)
242
APPENDIX A. REVIEW OF MATRIX ALGEBRA
A.4
Determinants
Let A be an nxn matrix. The definition of the determinant of A, det(A), involves an abstract formula featuring
permutations. It will be omitted here, in favor of the following computational method.
Let A−(i,j) denote the submatrix of A obtained by deleting its ith row and jth column. Then the determinant
can be computed recursively across the kth row of A as
det(A) =
n
X
(−1)k+m det(A−(k,m) )
(A.15)
m=1
where
det
A.5
s t
u v
= sv − tu
(A.16)
Matrix Inverse
• The identity matrix I of size n has 1s in all of its diagonal elements but 0s in all off-diagonal elements.
It has the property that AI = A and IA = A whenever those products are defined.
• The A is a square matrix and AB = I, then B is said to be the inverse of A, denoted A−1 . Then BA =
I will hold as well.
• A−1 exists if and only if its rows (or columns) are linearly independent.
• A−1 exists if and only if det(A) 6= 0.
• If A and B are square, conformable and invertible, then AB is also invertible, and
(AB)−1 = B −1 A−1
A.6
Eigenvalues and Eigenvectors
Let A be a square matrix.1
1
For nonsquare matrices, the discussion here would generalize to the topic of singular value decomposition.
(A.17)
A.6. EIGENVALUES AND EIGENVECTORS
243
• A scalar λ and a nonzero vector X that satisfy
AX = λX
(A.18)
are called an eigenvalue and eigenvector of A, respectively.
• A matrix U is said to be orthogonal if its rows have norm 1 and are orthogonal to each other, i.e. their
inner product is 0. U thus has the property that U U 0 = I i.e. U −1 = U .
• If A is symmetric and real, then it is diagonalizable, i.e there exists an orthogonal matrix U such that
U 0 AU = D
(A.19)
for a diagonal matrix D. The elements of D are the eigenvalues of A, and the columns of U are the
eigenvectors of A.
244
APPENDIX A. REVIEW OF MATRIX ALGEBRA
Appendix B
R Quick Start
Here we present a five-minute introduction to the R data/statistical programming language. Further learning
resources are available at http://heather.cs.ucdavis.edu/˜/matloff/r.html.
R syntax is similar to that of C. It is object-oriented (in the sense of encapsulation, polymorphism and
everything being an object) and is a functional language (i.e. almost no side effects, every action is a
function call, etc.).
B.1
Correspondences
aspect
assignment
array terminology
array element
storage
mixed container
B.2
C
=
array
m[2,3]
2-D arrays in row-major order
struct, members denoted by .
R
<- (or =)
vector (1-D), matrix (2-D), array (2-D+)
m[2][3]
matrices in column-major order
list, members denoted by $
Starting R
To invoke R, just type “R” into a terminal window. On a Windows machine, you probably have an R icon
to click.
If you prefer to run from an IDE, the easiest one for a quick install is probably RStudio, www.rstudio.
org.
245
246
APPENDIX B. R QUICK START
R is (normally) interactive, with > as the prompt.
B.3
First Sample Programming Session
Below is a commented R session, to introduce the concepts. I had a text editor open in another window,
constantly changing my code, then loading it via R’s source() command.1 The original contents of the file
odd.R were:
1 o d d c o u n t <− f u n c t i o n ( x ) {
2
k <− 0 # a s s i g n 0 t o k
3
for (n in x ) {
4
i f ( n %% 2 == 1 ) k <− k+1
5
}
6
return (k)
7 }
# %% i s t h e modulo o p e r a t o r
The R session is shown below. You may wish to type it yourself as you go along, trying little experiments
of your own along the way.2
1
2
3
4
5
6
7
8
9
10
11
12
13
14
15
16
17
18
> s o u r c e ( ” odd . R ” ) # l o a d c o d e from t h e g i v e n f i l e
> l s ( ) # what o b j e c t s do we h a v e ?
[ 1 ] ” oddcount ”
> # what k i n d o f o b j e c t i s o d d c o u n t ( w e l l , we a l r e a d y know ) ?
> c l a s s ( oddcount )
[1] ” function ”
> # c a n p r i n t any o b j e c t by t y p i n g i t s name
> oddcount
function (x) {
k <− 0 # a s s i g n 0 t o k
for (n in x ) {
i f ( n %% 2 == 1 ) k <− k+1 # %% i s t h e modulo o p e r a t o r
}
return (k)
}
> # test it
> y <− c ( 5 , 1 2 , 1 3 , 8 , 8 8 ) # c ( ) i s t h e c o n c a t e n a t e f u n c t i o n
> y
1
I personally am not a big fan of using IDEs for my programming activities. If you use one, it probably has a button to click as
an alternative to using source().
2
The source code for this file is at http://heather.cs.ucdavis.edu/˜matloff/MiscPLN/R5MinIntro.tex.
B.3. FIRST SAMPLE PROGRAMMING SESSION
19
20
21
22
23
24
25
26
27
28
29
30
31
32
33
34
35
36
37
38
39
40
41
42
43
44
45
46
47
48
49
50
51
52
53
54
55
56
57
58
[ 1 ] 5 12 13 8 88
> o d d c o u n t ( y ) # s h o u l d r e p o r t 2 odd numbers
[1] 2
> # change code t o v e c t o r i z e t h e count o p e r a t i o n
> s o u r c e ( ” odd . R ” )
> oddcount
function (x) {
x1 <− ( x %% 2 ) == 1 # x1 now a v e c t o r o f TRUEs and FALSEs
x2 <− x [ x1 ] # x2 now h a s t h e e l e m e n t s o f x t h a t were TRUE i n x1
r e t u r n ( l e n g t h ( x2 ) )
}
> # t r y subset of y , elements 2 through 3
> oddcount ( y [ 2 : 3 ] )
[1] 1
> # t r y s u b s e t o f y , e l e m e n t s 2 , 4 and 5
> oddcount ( y [ c ( 2 , 4 , 5 ) ] )
[1] 0
> # c o m p a c t i f y t h e code
> s o u r c e ( ” odd . R ” )
> oddcount
function (x) {
l e n g t h ( x [ x %% 2 == 1 ] ) # l a s t v a l u e computed a u t o r e t u r n e d
}
> oddcount ( y )
[1] 2
> # now h a v e f t n r e t u r n odd c o u n t AND t h e odd numbers t h e m s e l v e s
> s o u r c e ( ” odd . R ” )
> oddcount
function (x) {
x1 <− x [ x %% 2 == 1 ]
r e t u r n ( l i s t ( o d d s =x1 , numodds= l e n g t h ( x1 ) ) )
}
> # R’ s l i s t t y p e c a n c o n t a i n any t y p e ; c o m p o n e n t s d e l i n e a t e d by $
> oddcount ( y )
$odds
[ 1 ] 5 13
$numodds
[1] 2
247
248
59
60
61
62
63
64
65
66
67
68
APPENDIX B. R QUICK START
> ocy <− o d d c o u n t ( y )
> ocy
$odds
[ 1 ] 5 13
$numodds
[1] 2
> ocy$odds
[ 1 ] 5 13
Note that the R function function() produces functions! Thus assignment is used. For example, here is what
odd.R looked like at the end of the above session:
1 o d d c o u n t <− f u n c t i o n ( x ) {
2
x1 <− x [ x %% 2 == 1 ]
3
r e t u r n ( l i s t ( o d d s =x1 , numodds= l e n g t h ( x1 ) ) )
4 }
We created some code, and then used function to create a function object, which we assigned to oddcount.
Note that we eventually vectorized our function oddcount(). This means taking advantage of the vectorbased, functional language nature of R, exploiting R’s built-in functions instead of loops. This changes the
venue from interpreted R to C level, with a potentially large increase in speed. For example:
1 > x <− r u n i f ( 1 0 0 0 0 0 0 ) # 1000000 random numbers from t h e i n t e r v a l ( 0 , 1 )
2 > s y s t e m . t i m e ( sum ( x ) )
3
user system elapsed
4
0.008
0.000
0.006
5 > s y s t e m . t i m e ( { s <− 0 ; f o r ( i i n 1 : 1 0 0 0 0 0 0 ) s <− s + x [ i ] } )
6
user system elapsed
7
2.776
0.004
2.859
B.4
Second Sample Programming Session
A matrix is a special case of a vector, with added class attributes, the numbers of rows and columns.
1 > # ” r o w b i n d ( ) f u n c t i o n c o m b i n e s rows o f m a t r i c e s ; t h e r e ’ s a c b i n d ( ) t o o
2 > m1 <− r b i n d ( 1 : 2 , c ( 5 , 8 ) )
3 > m1
4
[ ,1] [ ,2]
B.4. SECOND SAMPLE PROGRAMMING SESSION
5
6
7
8
9
10
11
12
13
14
15
16
17
18
19
20
21
22
23
24
25
26
27
28
29
30
31
32
33
34
35
36
37
38
39
40
41
42
43
44
249
[1 ,]
1
2
[2 ,]
5
8
> r b i n d ( m1 , c ( 6 , − 1 ) )
[ ,1] [ ,2]
[1 ,]
1
2
[2 ,]
5
8
[3 ,]
6
−1
> m2 <− m a t r i x ( 1 : 6 , nrow = 2 )
> m2
[ ,1] [ ,2] [ ,3]
[1 ,]
1
3
5
[2 ,]
2
4
6
> n c o l ( m2 )
[1] 3
> nrow ( m2 )
[1] 2
> m2 [ 2 , 3 ]
[1] 6
# g e t s u b m a t r i x o f m2 , c o l s 2 and 3 , any row
> m3 <− m2 [ , 2 : 3 ]
> m3
[ ,1] [ ,2]
[1 ,]
3
5
[2 ,]
4
6
> m1 ∗ m3 # e l e m e n t w i s e m u l t i p l i c a t i o n
[ ,1] [ ,2]
[1 ,]
3
10
[2 ,]
20
48
> 2 . 5 ∗ m3 # s c a l a r m u l t i p l i c a t i o n ( b u t s e e below )
[ ,1] [ ,2]
[1 ,]
7.5 12.5
[2 ,] 10.0 15.0
> m1 %∗% m3 # l i n e a r a l g e b r a m a t r i x m u l t i p l i c a t i o n
[ ,1] [ ,2]
[1 ,]
11
17
[2 ,]
47
73
> # m a t r i c e s a r e s p e c i a l c a s e s o f v e c t o r s , s o c a n t r e a t them a s v e c t o r s
> sum ( m1 )
[ 1 ] 16
> i f e l s e ( m2 %%3 == 1 , 0 , m2 ) # ( s e e below )
250
45
46
47
[1 ,]
[2 ,]
APPENDIX B. R QUICK START
[ ,1] [ ,2] [ ,3]
0
3
5
2
0
6
The “scalar multiplication” above is not quite what you may think, even though the result may be. Here’s
why:
In R, scalars don’t really exist; they are just one-element vectors. However, R usually uses recycling,
i.e. replication, to make vector sizes match. In the example above in which we evaluated the express
2.5 * m3, the number 2.5 was recycled to the matrix
2.5 2.5
2.5 2.5
(B.1)
in order to conform with m3 for (elementwise) multiplication.
The ifelse() function’s call has the form
i f e l s e ( boolean vectorexpression1 , vectorexpression2 , vectorexpression3 )
All three vector expressions must be the same length, though R will lengthen some via recycling. The
action will be to return a vector of the same length (and if matrices are involved, then the result also has
the same shape). Each element of the result will be set to its corresponding element in vectorexpression2
or vectorexpression3, depending on whether the corresponding element in vectorexpression1 is TRUE or
FALSE.
In our example above,
> i f e l s e ( m2 %%3 == 1 , 0 , m2 ) # ( s e e below )
the expression m2 %%3 == 1 evaluated to the boolean matrix
T
F
F
T
F
F
(B.2)
(TRUE and FALSE may be abbreviated to T and F.)
The 0 was recycled to the matrix
while vectorexpression3, m2, evaluated to itself.
0 0 0
0 0 0
(B.3)
B.5. ONLINE HELP
B.5
251
Online Help
R’s help() function, which can be invoked also with a question mark, gives short descriptions of the R
functions. For example, typing
> ?rep
will give you a description of R’s rep() function.
An especially nice feature of R is its example() function, which gives nice examples of whatever function
you wish to query. For instance, typing
> example ( wireframe ( ) )
will show examples—R code and resulting pictures—of wireframe(), one of R’s 3-dimensional graphics
functions.