1
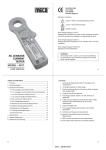
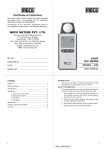
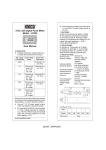
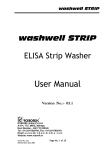
®
Plot No. EL-1, MIDC Electronic Zone, TTC Industrial Area, Mahape,
Navi Mumbai - 400710 (INDIA)
Tel : 0091-22-27673311-16, 27673300 (Board)
Fax : 0091-22-27673310, 27673330
E-mail : [email protected]
Web : www.mecoinst.com
PRESENTATION & CONTENT
Power Master Software (Version 02.04)
When the power master software is installed it is possible to monitor all the
quantities measures, alongwith their graphical view. In this way it is possible
to obtain data files and time trend of the signal.
- It contains :
- 1 diskettes for the complete loading of the programme.
- 1 Installation and User's Manual.
2
POWER LINE SUPERVISOR
MODEL : SPVR96
WITH MODBUS - RTU PROTOCOL SYSTEM SOFTWARE
User Licence
The " POWER MASTER " software and its enclosed documentation is the property
of MECO INSTRUMENTS PVT. LTD. The above mentioned programme is produced
with a view to providing a computerised aid to the monitoring and memorisation
of the data acquired by the line supervisors.
MECO INSTRUMENTS PVT. LTD. Declines
All responsibility in the event of tempering with or alteration of the inaccessible
files of the programme. The company recommended the use expressly described
in this manual and declines any responsibility derving from the use of the
software if this causes errors in the applications.
Prohibits
Any kind of modification, copying, translation, adaptation and creation of
applications using this software without the prior written consent of the
company.
Reserves the right
To alter the software and the instructions in the event of variations to its
characteristics or to the regulations in force.
POWER MASTER SOFTWARE_15082012
3
TECHNICAL SPECIFICATION
Name : Power Master Software Version : 02.04
Minimum Hardware Requirements :
l Pentium II processor (350MHz speed)
l 32 MB Ram Memory
l 10 MB Hard Disk (Free space)
l 1 COM serial port dedicated to RS-232 / 485 connection
l 1 RS485 / 232 interface device (to be connected to a COM serial port of
the PC).
l VGA Graphic Card : resolution 640 x 480 (recommanded super VGA 800
x 600)
l Colour Monitor
Software
l Windows 95/98/2000/ME/XP l Excel
Printers (If used)
l Printers compatible with Windows 95/98/2000/ME/XP
Distribution
l CD Rom
RS 485 / RS 232 Interface
The instrument has a RS 485 serial output & can be connected through RS
485 to RS 232 coverted to a personal computer.
Power the RS 485 / RS 232 interface module by means of its own power
supply (230V / 50Hz). Follow the connection diagram as shown in the
connection diagram as shown in fig. 'A'.
Check that the setting of dip-switch on the interface is effectively positioned
as shown in the connection diagram.
" SPVR96 Power Line Supervisor " is identified by its own address, which can
be configured from the instrument keyboard (see parameter setting mode
page).
The software communication protocol is dedicated to a network of analysers
and has following characteristics :
l Twisted screened duplex cable for connection upto 1200m.
l Speed : 9600 baud rate.
Follow the connector diagram referred to below with care. (fig. 'A')
5
4
RS 485 / RS 232 Interface Connection
RS 485 to RS 232
Converter
To Computer's
Com Port
Installation Procedure
1. Place CD in the drive. It will automatically run the set-up.
2. A window to confirm the installation of Power Master will be displayed.
Click "Next" to continue and installation and "Exit" to abort installation.
3. Next window displays information about the license agreement. Read it
and if acceptable, then click "Next".
4. Now next window will ask for the directory in which Power Master
software is to be installed.
5. Now click "Start" to start the installation.
6. When installation is successfully completed a window will confirm the
success of the installation operation, press "Next".
7. Now click "Exit".
fig. 'A'
6
POWER MASTER SOFTWARE_15082012
7
Commissioning Guide
Instrument does not communicate with Software?
1. Find the physical Communication Port (i.e. COMM Port) at computer
end where converter/instrument is attached. Please contact your
Computer Maintenance Department if you are not able to find out the
same. Configure the same port in the software. Default COMM Port in
the software is COMM1.
2. Check installed cables at all instruments as well as at RS485-232 converter
ends & computer end. Check for the firm connections at all the respective
ends.
3. Ensure that each instrument is having unique identification number
(i.e. Device ID). Please refer to instrument's user guide for changing
Device ID. Note that this ID is NOT a serial number. Add all
instruments one by one in software from Settings Options, which you
have physically added on the RS485/232 communication bus.
4. Read carefully about message shown by software. When you start the
software, if it says that it cannot open the Selected Port then find out
the software, which had already acquired the said port (Please contact
your Computer Maintenance Department for more details). Either stop
that software or Select another COMM Port from Settings Optionà Port
Settings.
5. Make sure that you have energized instrument(s) as well as converter if
any.
6. Now look at you converter if it has RX and TX LED's check out which
LED is blinking. If only TX LED is blinking that means software is sending
Query to instrument but there is some problem at instrument end. In
this case, please follow above steps (1 to 6) carefully before proceeding
further. If both the LED are blinking but in software the status is Not
connected then please check the 9/25 pin connector (connecting
converter/instrument) at computer end for any loose connections in
computer à converter à instrument.
7. Please follow this step only after following above steps carefully : Go to
the settings option in software click the port settings tab click "Restore
Defaults" then click apply and restart the software. This will restore the
9
8
default communication settings such as baud rate, parity, stop bits etc.
for the particular meter. If user suspects that the default settings are
not as per the instrument's settings then please refer the instrument's
user manual. Click apply and restart the software.
8. Even after following above steps, software is not able to communicate
with meter, then connect only one instrument at a time follow the above
steps check whether any instrument is defective. It may happen that
due to hardware fault one instrument is sinking all the bus power. So
other instruments are not communicating with the PC.
9. If instrument have a facility to turn off the RS485 communication then
turn it on. Refer to instrument's user guide for details.
10. If all instruments fail to communicate, then try to change computer, as
computer port (COMM port) might be the culprit.
10
How to add Instruments to Software?
Start the software, typically by double clicking icon on desktop, click settings
button enter user name and password (default user name is "administrator"
and password is "manager". Both are case sensitive. Change the default users
password after successful commissioning of the software. Add more users for
distributing the control to more peoples.) press login. In "General" tab, you will
see the instruments (by feeder name) added in the software. Press "Add" button
and enter instrument ID and feeder name. Press "Add". Note that you cannot
add same instrument ID again and same feeder name again. After you have
completed adding all the feeders, press "Done". Software needs to restart. Upon
restart you must be able to view all the added feeders.
POWER MASTER SOFTWARE_15082012
11
USING THE PROGRAMME
The mark that appears initially contains the following keys.
Feeder A
Settings
Help
13
12
Click on Feeder 'A' from the main mask for the general programme settings.
Preser..... the following options :
Real Time
Graph
History trend
Report
Alaram
Settings
Help
14
POWER MASTER SOFTWARE_15082012
15
Click on setting to set the following general parameters for login.
Enter Name :
Enter Passward :
Login
Click on General :
The programme returns to the main mask.
To Proceed click on 'General' to enter tha part of the programme used to activate
the SPVR connected.
Click on 'ADD' key :
The display 'ADD Meter' appears on the screen. This is used to set the number
of SPVR connected by proceeding as follows.
- Enter meter address, feeder name & meter serial no. than click on 'ADD' to
display all the SPVR's connected.
17
16
Click on Port Setting :
Select number of the serial port to which the RS 485 line is connected.
After setting the fields described, the serial port number is essential confirm
with ok.
18
POWER MASTER SOFTWARE_15082012
19
Back up :
The sake of security and to prevent the hard disk from being flooded with
excessive data, we recommend carrying out back-up operations at periodic
intervals.
The frequency of these will depend on the monitoring periods, but it should be
remembered that each SPV transmits a considerable qty. of data to the PC.
Back up of the sysytem file, " Data_spv.dlg ".
- Go to the " Service Procedures " page (see page 8).
- Click on " Back-up file ".
- Enter the filename whose data are to be saved and confirm by clicking
on "OK".
- In the " Creation of a back up file for the storage " page, the " Replace /
Copy " key can save in two different ways, depending on its position :
- Substitution position : creates a complete copy of the data memorisation
file and empties it at the same time (that is, it transfers the data memorised
to the file with the name given previously)
- Copy Position : creates a complete copy of the data memorisation file
without making any changes to it.
21
20
Click on Alarms :
Power Master logs the alarmed parameters. The parameters exceeding the higher
limits are shown in red background and the parameters crossing the lower
limits are shown in light green background.
To select the parameters for alarm.
- Go to settings
- Click on ' alarm '
- Select feeder and parameter
- Select Limit
- Click on apply
- Confirm by clicking on ' Done '
22
POWER MASTER SOFTWARE_15082012
23
Click on Administrater :
For changing password
- Go to settings page
- Click on ' administrator '
- Click on change password
- Enter password and retype password
- Click on ' change '
- Confirm by clicking on ' Done '
25
24
Real Time Value :
The real time values are displayed on the screen in the tabular format. The
values are displayed in different colours for easy identification ie. Phase I values
in red, Phase II values are in Yellow, Phase III values are in Blue and System
values are in Green. When any parameter value for the selected feeder goes
beyond the set limit (high / low), the particular parameter values are displayed
in different colours.
26
POWER MASTER SOFTWARE_15082012
27
Real Time Graphs :
Power Master supports graphical representation of the measured data. It draws
the real time graph of the parameters. The scaling of the graph is done
automatically. The date and the time of the running graphs is displayed on the
X-axis. The user is able to get any value present on the graph by clicking at the
desired position. Zooming feature of the graph zooms the graph horizontally
and vertically up to 500%.
29
28
History Trends :
It shows the historical data in graphical format. Date and time of the graph are
the date and time of the PC from when the Power Master has started. Format
of the date and time is DD-MM-YYYY & hh:mm:ss. User can select start-date,
start-time, end-date & end-time. Printing of the graph is also possible. User
can get any instantaneous value on the graph by clicking on any point of the
graph.
30
POWER MASTER SOFTWARE_15082012
31
Report :
Report presents the data in a tabular format. User can select single as well as
multiple parameters to view in the reports. Once the table has been generated
it can be exported to any spreadsheet utility like Excel, Lotus-Smart suit etc. The
generated file will be placed in the "c:\program files\power master\export\report\"
directory with date and time stamp of the report generation time. This file can
be used for further data processing and import into other software platforms.
33
32
Alarms :
Power Master logs the alarmed parameters. The parameters exceeding the higher
limits are shown in red background and the parameters crossing the lower
limits are shown in light green background. For viewing the alarmed data the
user has to set start-date and end-date and press the show button. In the
exported files, the indication for values crossing high limits is 'H' and values
crossing low limits is 'L' which is prefixed to the respective parameter value.
34
POWER MASTER SOFTWARE_15082012
35