1
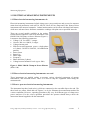
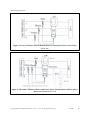
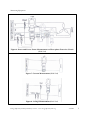
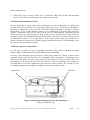
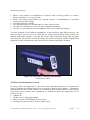
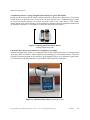
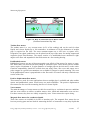
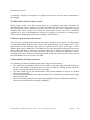
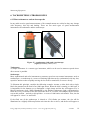
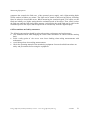
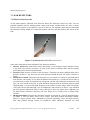
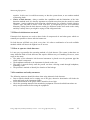
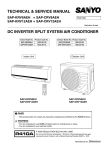
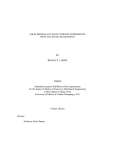
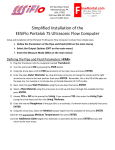
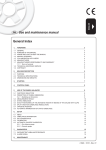
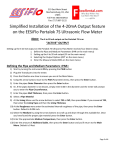
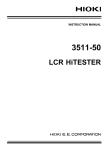
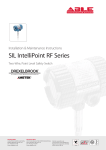
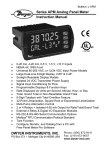
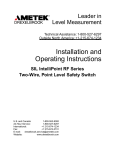
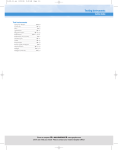
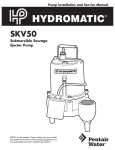
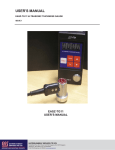
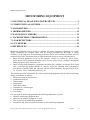
Monitoring Equipment
MONITORING EQUIPMENT
1. ELECTRICAL MEASURING INSTRUMENTS .........................................2
2. COMBUSTION ANALYZERS.....................................................................7
3. MANOMETERS...........................................................................................9
4. THERMOMETERS....................................................................................12
5. WATER FLOW METERS.........................................................................15
6. TACHOMETERS / STROBOSCOPES......................................................19
7. LEAK DETECTORS ..................................................................................22
8. LUX METERS............................................................................................24
9. REFERENCES ...........................................................................................26
Monitoring equipment can be useful to measure the actual operating parameters of various
energy equipment and compare them with the design parameters to determine if energy
efficiency can be improved. Or monitoring equipment can be used to identify measure steam or
compressed air leaks. Parameters that are often monitored during an energy assessment are:
§ Basic electrical parameters in AC & DC systems: voltage (V), current (I), power factor,
active power (kW), maximum demand (kVA), reactive power (kVAr), energy consumption
(kWh), frequency (Hz), harmonics, etc.
§ Other non-electrical parameters: temperature and heat flow, radiation, air and gas flow, liquid
flow, revolutions per minute (RPM), air velocity, noise and vibration, dust concentration,
total dissolved solids (TDS), pH, moisture content, relative humidity, flue gas analysis (CO2,
O 2, CO, SOx, NOx), combustion efficiency, etc.
This module provides information for various monitoring equipment that are often used during
energy assessments in industry:
1. Electrical measuring instruments
2. Combustion analyzer
3. Thermometers
4. Manometers
5. Water flow meters
6. Tachometers / Stroboscopes
7. Leak detectors
8. Lux meters
For each type of monitoring equipment the following information is given:
§ What the monitoring equipment does
§ Where the monitoring equipment is used
§ How to operate the monitoring equipment
§ Precautions and safety measures necessary for the monitoring equipment
Energy Efficiency Guide for Industry in Asia –www.energyefficiencyasia.org
©UNEP
1
Monitoring Equipment
1. ELECTRICAL MEASURING INSTRUMENTS
1.1 What electrical measuring instruments do
Electrical measuring instruments include clamp-on or power analyzers and are used to measure
main electrical parameters such as KVA, kW, PF, Hertz, KVAr, Amps and Volts. Some of these
instruments also measure harmonics. Instant measurements can be taken with hand- held meters,
while more advanced ones facilitates cumulative readings with print outs at specified intervals.
There are several models available in the market
from different companies. One suc h instrument is the
HIOKI 3286-20 Clamp-on Power Hitester (Figure 1).
It measures the following parameters:
§ Voltage: 150 V to 600 V, 3 ranges
§ Current: 200 A or 1000 A, 2 ranges
§ Voltage/current peak
§ Effective/reactive/apparent power (single-phase
or 3-phase): 30 kW to 1200 kW, 14 combination
patterns
§ Power factor
§ Reactivity
§ Phase angle
§ Frequency,
§ Phase detection (3-phase)
§ Voltage/current harmonic levels (up to 20th)
Figure 1. Hioki 3286-20 Clamp-on Power Hitester
(Hioko Ltd.)
1.2 Where electrical measuring instruments are used
These instruments are applied on-line to measure various electrical parameters of motors,
transformers, and electrical heaters. There is no need to stop the equipment while taking the
measurements.
1.3 How to operate electrical measuring instruments
The instrument has three leads (wires), which are connected to the crocodile clips at the end. The
three leads are yellow, black and red. Figures 2 to 8 give illustrate the measurement method for
various conditions. However, operating procedures may vary for different types of clamp-on or
power analyzers. For the correct operation procedure the operator should always check the
instruction manual supplied with the instrument.
Energy Efficiency Guide for Industry in Asia –www.energyefficiencyasia.org
©UNEP
2
Monitoring Equipment
Figure 2. Power Measurement on Single-phase Two -wire Circuit (Hioki Ltd)
Figure 3. Power and Power Factor Measurement on Single-phase Three-wire Circuit
(Hioki Ltd)
The power and power factor of a single-phase three-wire circuit are measured similarly to a single phase two-wire circuit. Connect the black lead to the neutral wire as shown, and then switch the red
lead and clamp sensor to the respective wires. Now the power and power factor between the wires can
be measured.
Energy Efficiency Guide for Industry in Asia –www.energyefficiencyasia.org
©UNEP
3
Monitoring Equipment
Figure 4. Power and Power Factor Measurement on Three-phase Three-wire Circuit
(Hioki Ltd)
Figure 5. Alternative Method of Power and Power Factor Measurement on Three-phase
Three-wire Circuit (Hioki Ltd)
Energy Efficiency Guide for Industry in Asia –www.energyefficiencyasia.org
©UNEP
4
Monitoring Equipment
Figure 6. Power and Power Factor Measurement on Three-phase Four-wire Circuit
(Hioki Ltd)
Figure 7. Current Measurement (Hioki Ltd)
Figure 8. Voltage Measurement (Hioki Ltd)
Energy Efficiency Guide for Industry in Asia –www.energyefficiencyasia.org
©UNEP
5
Monitoring Equipment
1.4 Precautions and safety measures
Some precautions and safety measures to be taken while using clamp-on and power analyzers
are:
§ To avoid short circuits and potentially life-threatening hazards, never attach the clamp to a
circuit that operates at more than the maximum rated voltage, or over bare conductors.
§ The clamp -on probe should be connected to the secondary side of a breaker, so the breaker
can prevent an accident if a short circuit occurs.
§ While using the instrument, use rubber hand gloves, boots, and a safety helmet, to avoid
electrical shocks, and do not use the instrument when hands are wet.
§ Check the operating manual of the monitoring equipment for more detailed instructions on
safety and precautions before using the equipment.
Energy Efficiency Guide for Industry in Asia –www.energyefficiencyasia.org
©UNEP
6
Monitoring Equipment
2. COMBUSTION ANALYZERS
2.1 What a combustion analyzer does
A combustion analyzer is used to measure the composition of the flue gases after combustion has
taken place. Different combustion analyzers can be ordered to match the requirements at a plant.
Basically all combustion analyzers measure the percentage oxygen (O 2) or carbon dioxide (CO2)
in the exit flue gases and then use an inbuilt programme to calculate the combustion efficiency if
required. The various types of combustion analyzers are given below:
Fuel Efficiency Monitor
This measures oxygen and temperature of the flue gas. Calorific values of common
fuels are fed into the microprocessor which calculates the combustion efficiency
Fyrite
A hand bellow pump draws the flue gas sample into a solution inside the fyrite. A
chemical reaction changes the liquid volume revealing the amount of gas. The
percentage oxygen or CO2 can be read from the scale.
Gas Analyzer
This instrument has in-built chemical cells which measure various gases such as CO2,
CO, NO X, SOX etc.
Energy Efficiency Guide for Industry in Asia –www.energyefficiencyasia.org
©UNEP
7
Monitoring Equipment
2.2 Where a combustion analyzer is used
Combustion analyzers are used to determine the composition of the flue gases in the duct. The
duct is the large piping arrangement of rectangular configuration and is used to flush out the
combusted gases to the chimney. The values for the different components of the flue gases are
volume-based. Mostly these instruments measure the percentage oxygen and carbon dioxide and
the temperature of the flue gas. During energy audits it is desirable to know the composition of
the flue gases in order to assess the combustion conditions and efficiency and leakages of
atmospheric air into the system.
2.3 How to operate
Different types of the combustion analyzers are operated differently. For all types of combustion
analyzers the probe is inserted into the duct through a small hole made in the duct for monitoring
purposes. In case of a fyrite combustion analyzer, which is manually operated, the flue gas from
the duct is sucked out using a manual pumping device. In most of the other analyzers the flue
gases are pumped out of the ducts using a suction pump. The collected gases react with the
chemical/cells and give readings of % oxygen or carbon dioxide.
2.4 Precautions and safety measures
Some precautions and safety measures to be taken while using combustion analyzers are:
§ Always calibrate the instrument in open fresh air before taking a set of measurements.
§ Check for the clogging of the air filters of the instrument.
§ During measurements, ensure that the rubber tubing carrying the gases from the duct to the
instrument is not bent.
§ After insertion of the probe into the duct, care should be taken to wrap the left opening space
with cotton rags to ensure that there is no filtration of air into the system or air escaping the
system.
§ Thick cotton hand gloves, goggles, a safety helmet and other safety gear should be worn
before taking the readings. Remember that the gases you are handling are very hot!
§ Check the operating manual of the monitoring equipment for more detailed instructions on
safety and precautions before using the equipment.
Energy Efficiency Guide for Industry in Asia –www.energyefficiencyasia.org
©UNEP
8
Monitoring Equipment
3. MANOMETERS
3.1 What a manometer does
Manometers are widely used instrument in energy audits for measuring the differential pressure
across two points. The oldest type is the liquid -column manometer. A very simple version of a
liquid-column manometer is a U-shaped tube (see Figure 9) that is half- full of liquid (usually
oil, water or mercury) where the measured pressure is applied to one side of the tube whilst the
reference pressure (which might be that of the atmosphere) is applied to the other. The difference
in liquid level represents the applied pressure.
a
b
c
Figure 9. Schematic illustration of a liquid-column manometer
(Dwyer Instruments Inc.)
The principles of how a manometer works are as follows:
§ Figure 9a. In its simplest form the manometer is a U-tube about half filled with liquid. With
both ends of the tube open, the liquid is at the same height in each leg.
§ Figure 9b. When positive pressure is applied to one leg, the liquid is forced down in that leg
and up in the other. The difference in height, "h," which is the sum of the readings above and
below zero, indicates the pressure.
§ Figure 9c. When a vacuum is applied to one leg, the liquid rises in that leg and falls in the
other. The difference in height, "h," which is the sum of the readings above and below zero,
indicates the amount of vacuum.
There are three main types of manometers:
§ Single- limb liquid-column manometer has a larger reservoir instead of one side of the U-tube
and has a scale beside the narrower column. This column can further amplify the liquid
movement. Liquid-column manometers can be used to measure small differences between
high pressures.
§ Flexible Membrane Type: This type uses the deflection of a flexible membrane that seals off
a volume with a fixed reference-pressure. The degree of deflection of the membrane
corresponds with a specific pressure. Reference tables exist to determine the pressure for
different deflections.
Energy Efficiency Guide for Industry in Asia –www.energyefficiencyasia.org
©UNEP
9
Monitoring Equipment
§
Coiled Tube Type: A third variant uses a coiled tube which will expand with increasing
pressure. This causes a rotation of an arm connected to the tube.
3.2 Where the manometer is used
During conducting of energy audit studies manometers are used to determine the differential
pressure between two points in a duct carrying exhaust gases or air. The pressure differential is
then used to calculate the velocity of flow in the duct using the Bernoulli’s equation. ( Pressure
Differential = v2/2g). A more detailed account of use of manometer is given in section on hoe to
operate a manometer. However the same can be used for measuring the differential pressure
across two points in a pipe carrying any fluid. In this case the precaution to be taken is that the
manometer should be compatible to be used for fluid flows. The velocity of flow of fluid is given
by Differential pressure = f LV2 /2gD where f is the friction factor of the pipe material, L is
distance between two points across which pressure differential is taken, D is the diameter of the
pipe and g is the gravitational constant.
3.3 How to operate a manometer
It is not easy to explain one way of operating manometers. The reason is that there are many
different kinds of manometers that require different ways of handling.
However, some operating steps are the same. During energy audits, air velocity in ducts can be
measured using a pitot tube and flows are calculated using a manometer. A sampling hole is
made in the duct (pipe carrying exhaust gases) and the pitot tube is inserted into the duct. The
two openings at the end of the pitot tube are connected to the two openings of the manometer.
The difference in level of the manometer gives the total velocity pressure. For example, in case
of a digital manometer the readings are displayed as mm of the water column.
Manometer
Pitot tube
Figure 10. Measurement using Pitot Tube and Manometer
(Dwyer Instruments Inc.)
Energy Efficiency Guide for Industry in Asia –www.energyefficiencyasia.org
©UNEP
10
Monitoring Equipment
3.4 Precautions and safety measures
§
§
Manometers should not be exposed to very high pressures. In case of high pressures inclined
tune manometers should be used.
Check the operating manual of the monitoring equipment for more detailed instructions on
safety and precautions before using the equipment.
Energy Efficiency Guide for Industry in Asia –www.energyefficiencyasia.org
©UNEP
11
Monitoring Equipment
4. THERMOMETERS
4.1 What a thermometer does
Thermometers are instruments used to measure the temperature of fluids, surfaces or gases, for
example of the flue gases after combustion has taken place. Thermometers are classified as
contact thermometers or non-contact or infrared thermometers and are described below.
Contact thermometer
There are many types of contact thermometers. A simple clinical thermometer is the best known
example of a contact thermometer. However, for the purpose of energy audits in an industrial
plant we generally use thermocouples for measuring temperatures with a high accuracy. It
consists of two dissimilar metals, joined together at one end. The thermocouple metal alloys are
commonly available as wire. A thermocouple is available in different co mbinations of metals or
calibrations. The four most common calibrations are J, K, T and E. There are high temperature
calibrations R, S, C and GB. Each calibration has a different temperature range and environment,
although the maximum temperature varies with the diameter of the wire used in the
thermocouple. Although the thermocouple calibration dictates the temperature range, the
maximum range is also limited by the diameter of the thermocouple wire.
Figure 11. Thermocouple Thermometer
(Reliability Direct, Inc)
Non-contact or infrared thermometer
A non-contact or infrared thermometer allows the measurement of temperatures without physical
contact between the thermometer and the object of which the temperature is determined. The
thermometer is directed at the surface and immediately gives a temperature reading. This
instrument is useful for measuring hot spots in furnaces, surface temperatures etc.
Infrared thermometer allows users to measure temperature in applications where conventional
sensors cannot be used or cannot produce accurate temperature readings, such as:
Energy Efficiency Guide for Industry in Asia –www.energyefficiencyasia.org
©UNEP
12
Monitoring Equipment
§
§
§
§
§
§
When a fast response or measurement is required, such as moving objects (i.e. rollers,
moving machinery, or a conveyor belt)
Where non-contact measurements are required because of contamination or hazardous
reasons (such as high voltage)
Too large distances or heights
Too high temperatures for thermocouples or other contact sensors
The object is contained in a vacuum or other controlled atmosphere
The object is surrounded by an electromagnetic field (such as induction heating)
The basic principle of the infrared thermometer is that all objects emit infrared energy. The
hotter an object, the more active its molecules are, and the more infrared energy it emits. An
infrared thermometer contains a lens that focuses the collected infrared energy from the object
onto a detector. The detector converts the energy into an electrical signal, which is amplified and
displayed in units of temperature after corrections for ambient temperature variations.
Figure 12. Non-contact or Infrared Thermometer
(Nitonuk Ltd. 2003)
4.2 Where the thermometer is used
In energy audits, the temperature is one of the most important parameters to be measured in
order to determine the thermal energy loss or to make a thermal energy balance. Temperature
measurements are taken for the audit of air conditioning units, boilers, furnaces, steam systems,
waste heat recovery systems, heat exchangers, etc. During the audits, the temperature can be
measured of the:
§ Ambient air
§ Chilled water in refrigeration plants
§ Inlet air into the Air Handling unit of AC plant
§ Cooling water inlet and out let at the Cooling Tower
Energy Efficiency Guide for Industry in Asia –www.energyefficiencyasia.org
©UNEP
13
Monitoring Equipment
§
§
§
§
§
§
Surfaces of steam pipelines, boilers, kilns
Input water to the boiler
Exhaust gases
Condensate returned
Pre heated air supply for combustion
Temperature of the fuel oil
4.3 How to operate a thermometer
The thermocouple (contact thermometer) consists of two dissimilar metals, joined together at one
end. When the junction of the two metals is heated or cooled a voltage is produced that can be
correlated back to the temperature. A probe is inserted into a liquid or gaseous stream to measure
the temperature of, for example, flue gas, hot air, or water. A leaf type probe is used to measure
surface temperatures. In most of the cases the thermocouple directly gives the reading in the
desired units( Centigrade or Fahrenheit) on a digital panel.
The operation of a non-contact or infrared thermometer is simple. The infrared thermometer
(gun) is pointed towards the surface where the temperature must be measured. The measurement
result is read directly from the panel.
4.4 Precautions and safety measures
The following precautions and safety measures apply when using a thermometer:
§ The probe must be immersed in the fluid and the measurement must be taken after 1-2
minutes, i.e. after the stabilization of the readings.
§ Before using the thermocouple, the temperature range for which the thermocouple is
designed for should be checked.
§ The probe of the thermocouple should never touch the bare flame.
§ Before using a non-contact thermometer the emissivity should be set in accordance with the
surface where the temperature is to be measured.
§ Check the operating manual of the monitoring equipment for more detailed instructions on
safety and precautions before using the equipment.
Energy Efficiency Guide for Industry in Asia –www.energyefficiencyasia.org
©UNEP
14
Monitoring Equipment
5. WATER FLOW METERS
5.1 What a water flow meter does
A flow meter is an instrument used to measure the linear, nonlinear, mass or volumetric flow rate
of a liquid or a gas. This section deals specifically with water flow meters. The choice of method
or type of water flow meter depends on the site conditions and the required measurement
accuracy.
Apart from water flow meters, there are several methods available to measure water flow during
an audit. Two common methods to obtain reasonably accurate estimates of the water flow are:
§ Time of fill method: Water is allowed to fill a known volume of a vessel or tank (m3 ). The
time taken to fill up this volume is recorded using a stop watch (seconds). The volume
divided by the time gives the average flow in m3/sec.
§ Float method: This method is generally used to measure the flow in an open channel. A
specific distance (for example 25 meters or 50 meters) is marked on the side of the channel.
A ping-pong ball is placed on the water and the time it takes for the ball to float to the
marked distance is recorded. Multiple readings are taken to get a more accurate timing. The
velocity of the water is calculated by Distance traveled by the ball / Average time taken.
Depending on the flow conditions and the site characteristics the calculated velocity is
further divided by a factor 0.8 to 0.9 to obtain the peak velocity in an open channel, since the
velocity at the surface is reduced due to drag forces of the wind etc.
Some of the most common types of flow meters are given below:
Rotameter or variable area flow meter for gases and liquids.
The rotameter consists of a tapered tube and a float. It is the most widely used variable-area flow
meter because of its low cost, simplicity, low pressure drop, relatively wide range ability, and
linear output.
Figure 13. Rotameter (Omega Engineering Ltd)
Energy Efficiency Guide for Industry in Asia –www.energyefficiencyasia.org
©UNEP
15
Monitoring Equipment
Variable flow meters - spring and piston flow meters for gases and liquids.
Piston-type flow meters use an annular orifice formed by a piston and a tapered cone. The piston
is held in place at the base of the cone (in the "no flow position") by a calibrated spring. Scales
are based on specific gravities of 0.84 for oil meters and 1.0 for water meters. Their simple
design and the ease with which they can be equipped to transmit electrical signals has made them
an economical alternative to rotameters for flow rate indication and control.
Figure 14. Spring and Piston Flow Meters
(Omega Engineering Ltd)
Ultrasonic flow meters (Non-Intrusive or Doppler) for Liquids
Ultrasonic doppler flow meters are commonly used in dirty applications such as wastewater and
other dirty fluids and slurries which ordinarily cause damage to conventional sensors. The basic
principle of operation employs the frequency shift (Doppler Effect) of an ultrasonic signal when
it is reflected by suspended particles or gas bubbles (discontinuities) in motion.
Figure 15. Ultrasonic Flow Meter (Dynasonics Ltd)
Energy Efficiency Guide for Industry in Asia –www.energyefficiencyasia.org
©UNEP
16
Monitoring Equipment
Figure 16. How an Ultrasonic Flow Meter works
(Eesiflow International Pty Ltd.)
Turbine flow meters
The turbine meter is a very accurate meter (0.5% of the reading) and can be used for clean
liquids and viscous liquids up to 100 centistokes. A minimum of 10 pipe diameters of straight
pipe is required on the inlet. The most common outputs are a sine wave or square wave
frequencies, but signal conditioners can be placed on the top of the meter for analog outputs and
explosion proof classifications. The meters consist of a multi-bladed rotor mounted at right
angles to the flow and suspended in the fluid stream on a free-running bearing.
Paddlewheel sensors
Paddlewheel sensors are one of the most popular cost effective flow meters for water or waterlike fluids. Many are offered with flow fittings or insertions styles. These meters, like the turbine
meter, require a minimum of 10 pipe diameters of straight pipe on the inlet and 5 on the outlet.
Chemical compatibility should be verified when not using water. Sine wave and square wave
pulse outputs are typical but transmitters are available for integral or panel mounting. The rotor
of the paddlewheel sensor is perpendicular to the flow and is in contact with only a limited cross
section of the flow.
Positive displacement flow meters
These meters are used for water applications when no straight pipe is available and when turbine
meters and paddlewheel sensor would cause too much turbulence. The positive displacement
flow meters are also used for measuring the flow of viscous liquids.
Vortex meters
The main advantages of vortex meters are their low sensitivity to variations in process conditions
and low wear relative to orifices or turbine meters. Also, initial and maintenance costs are low.
For these reasons, they have are widely accepted by users. Vortex meters do require sizing.
Magnetic flow meters for conductive liquids
These flow meters are available in in- line or insertion style. The magnetic flow meters do not
have any moving parts and are ideal for measuring the flow of wastewater or any dirty liquid that
Energy Efficiency Guide for Industry in Asia –www.energyefficiencyasia.org
©UNEP
17
Monitoring Equipment
is conductive. Displays are integral or an analog output can be used for remote monitoring or
data logging.
5.2 Where the water flow meter is used
During energy audits, water flow measurements are of significant importance. Generally the
measurements are taken to quantify the amo unt of liquid/water flowing in a pipe. If there is no
flow measurement device attached to the pipe line, then the flow can be quantified using an
ultrasonic flow meter. Typical cases where the measurement of the water flow is absolutely
essential are as pa rt of determining the efficiency of pumps, the efficiency of cooling towers,
chillers and air conditioning plants, heat exchangers, and condensers.
5.3 How to operate water flow meters
There are many varieties of the ultrasonic flow meters available on the market. The functioning
of each model differs from the other. However the basic principle of all remains same. The 2
probes/sensors of the ultrasonic flow meters are placed on the surface of the pipe at some
distance apart along a straight line. The diameter of the pipe determines the distance between the
probes. When the meter is turned on, it generates sonic waves which are transmitted via one of
the probes/sensors and are received by the other. The meter is calibrated to display the velocity
or volume of the flow of liquid inside the pipe, based on the time required by the sonic waves to
travel the distance from one sensor to the other.
5.4 Precautions and safety measures
The following precautions should be taken when using water flow meters:
§ The probes/sensors should be placed on the surface of the pipes after thorough cleaning of
the spot. Care should be taken that there is no speck of paint etc. Ideally the spot where the
sensors are placed should be filed by a emery paper.
§ The meter would not give the measurements if the internal condition of the pipe is corroded
or has any alga growth.
§ The measurement should be taken where the pipe flow is expected to be laminar and the pipe
must be flowing full.
§ Check the operating manual of the monitoring equipment for more detailed instructions on
safety and precautions before using the equipment.
Energy Efficiency Guide for Industry in Asia –www.energyefficiencyasia.org
©UNEP
18
Monitoring Equipment
6. TACHOMETERS / STROBOSCOPES
6.1 What tachometers and stroboscopes do
In any audit exercise speed measurements of for example motors are critical as they may change
with frequency, belt slip and loading. There are two main types of speed measurement
instruments: the tachometer and the stroboscope.
Figure 17. A tachometer (left) and a stroboscope
(right) (Reliability Direct, Inc)
Tachometer
A simple tachometer is a contact type instrument, which can be used to measure speeds where
direct access is possible.
Stroboscope
More sophisticated and safer instruments to measure speed are non-contact instruments, such as
stroboscopes. A stroboscope is a source of flashing light that can be synchronized with any fast,
repetitive motion so that a rapidly moving device seems to stand still, or to move slowly.
To illustrate this principle, consider the following example: Assume a white disk with a single
black dot mounted on the shaft of an 1800-rpm motor. When the disk is rotating at 1800 rpm, it
is impossible for the human eye to distinguish a single image and the dot will appear to be a
blurred continuous circle. When illuminated by the flashing stroboscope light, synchronized to
flash once every revolution of the disk (when the dot is at 3 o’
clock, for example), the dot will be
seen at this position - and only at this position - at a rate of 1800 times each minute. Thus, the dot
will appear to “freeze”or stand still.
If the flash rate of the stroboscope is slowed to 1799 flashes per minute, the dot will be
illuminated at a slightly different position each time the disc revolves, and the dot will appear to
Energy Efficiency Guide for Industry in Asia –www.energyefficiencyasia.org
©UNEP
19
Monitoring Equipment
move slowly in the direction of rotation through 360°and arrive at its original position 1 minute
later. A similar movement, but in a direction opposite the rotation of the dot, will be observed if
the flash rate of the stroboscope is increased to 1801 fpm. If desired, the rate of apparent
movement can be speeded up by further increases or decreases in the strobe flash rate.
When the image is stopped, the flash rate of the strobe equals the speed of the moving object.
And since the flash rate is known the speed of the object is also known. Thus the stroboscope has
a dual purpose of measuring speed and of apparently slowing down or stopping rapid motion for
observation. The practical significance of the slow-motion effect is that, since it is the true copy
of the high speed motion, all irregularities (vibration, torsion, chattering, whip) present in the
high speed motion can be st udied.
.
Figure 18. Principle of the Working of a Stroboscope
(NPC, 2006)
For audit studies we generally use contact type of tachometers since they are readily available.
6.2 Where tachometers and stroboscopes are used
Tachometers and stroboscopes are used measure the speed of rotation of motors, fans, pulleys
etc.
6.3 How to operate a tachometer and stroboscope
In a contact-type tachometer, the wheel of the tachometer is brought in contact with the rotating
body. Due to friction between the two, after few seconds the speed of the whe el of the
tachometer is the same as the speed of the rotating body. This speed is displayed on the panel as
rpm.
The digital stroboscope is a versatile flashing light source that is used to measure the speed of
fast- moving objects or to produce the optical effect of stopping or slowing down high-speed
motion for purposes of observation, analysis, or high-speed photography. The stroboscope emits
a high- intensity, short-duration flash of light. The instrument features an electronic pulse
Energy Efficiency Guide for Industry in Asia –www.energyefficiencyasia.org
©UNEP
20
Monitoring Equipment
generator that controls the flash rate, a line-operated power supply, and a light-emitting diode
(LED) readout in flashes per minute. The light can be aimed at most moving objects, including
those in otherwise inaccessible areas. When measuring the rotational speed of an object, set the
flash rate initially to a higher setting than the estimated speed of the object. Then, slowly reduce
the flash rate until the first single image appears. At this point, the strobe flash rate is equal to the
rotational speed of the object, and the speed can be read directly from the digital display.
6.4 Precautions and safety measures
The following precautions should be taken when using a tachometer and stroboscopes:
§ Care should be taken while bringing the wheel of the tachometer in contact with the rotating
body.
§ From a safety point of view never wear loose clothing when taking measurements with
tachometers.
§ Avoid being alone when taking measurements.
§ Check the operating manual of the monitoring equipment for more detailed instructions on
safety and precautions before using the equipment.
Energy Efficiency Guide for Industry in Asia –www.energyefficiencyasia.org
©UNEP
21
Monitoring Equipment
7. LEAK DETECTORS
7.1 What leak detectors do
As the name implies, ultrasonic leak detectors detect the ultrasonic sound of a leak. You are
probably familiar with the hissing sound a large leak makes. Smaller leaks also emit a sound,
however the frequency is too high for our ears to detect it. An ultrasonic leak detector transforms
the ultrasonic hissing sound to a sound that humans can hear, and thus leads to the source of the
leak.
Figure 19. Leak Detectors (Reliability Direct, Inc)
Some other information about ultrasonic leak detectors includes:
§ Distance and access. Some leaks can be heard from a several meters away, therefore access
to the leak is not always necessary. As long as the leak is turbulent, there will be enough
sound that can be detected ultrasonically.
§ Pressure. High pressure of leaks is not necessary. Ultrasonic can detect pinhole leaks with a
pressure as low as 1 psi. However, the more pressure behind the leak, the easier it will be to
locate.
§ Sensitivity to sound. Ultrasonic leak detectors are very sensitive to sound. A good ultrasonic
leak detector can actually let you hear the blink of the human eye. A leak test can be done in
an enclosed area which is saturated with refrigerant, and the only indication an ultrasonic will
give you is the sound of the leak. A good ultrasonic detector uses an electronic process called
“heterodyning”to convert this high frequency leak sound to a lower range where the hissing
of the leak can be heard through a set of headphones, and traced to its source. Any turbulent
gas will generate ultrasound when it leaks, therefore it does not matter what refrigerant you
are leak testing. Ultrasonic detectors will even detect air as it rushes into a system under
vacuum.
§ Background noises. Because the ultrasonic detector is focused on a specific band/frequency
of sound, it will not detect wind, voices, traffic, and most normal operational sounds.
However, larger systems with a multitude of pressure regulating valves and high velocity
flow may produce hissing sounds at frequencies where ultrasonic detectors are most
Energy Efficiency Guide for Industry in Asia –www.energyefficiencyasia.org
©UNEP
22
Monitoring Equipment
§
sensitive. In this case it would be necessary to shut the system down, or use another method
of detecting leaks.
Choice of leak detector. Always consider the capabilities and the limitations of the leak
detection method used. It is thereby important to consider more than just the sensitivity under
laboratory / testing conditions when choosing a leak detector. For example, a highly sensitive
“sniffer”type was able to detect a leak of 0.25oz. of refrigerant per year in a controlled
laboratory setting. But the leak detector would give different results when used on the windy
and dirty rooftop where you might be trying to find refrigerant leaks.
7.2 Where leak detectors are used
Ultrasonic leak detectors are used to detect leaks of compressed air and other gases which are
normally not possible to detect with the human ear.
No leak detector will find every leak, every time. It is often a combination of several available
methods which will insure the highest rate of success.
7.3 How to operate a leak detectors
It is not easy to generalize the operating method of a leak detector. The reason is that there are
many different kinds of leak detectors that require different ways of handling. However, some
steps are the same:
§ The probe of the ultrasonic leak detector instrument is placed near the gas/steam pipe line
where a leak is suspected
§ The headphone attached to the instrument is placed on the ears
§ The probe is moved slowly until the person can hear a hissing sound through headphone,
indicating a leak
§ The position is marked to identify the location of the leakage
7.4 Precautions and safety measures
The following measures should be taken when using ultrasonic leak detectors:
§ Dust or smoke should not be coming out of the pipe, otherwise dust/smoke will choke the
probe and leads to the instrument failure
§ Avoid measurement at the places where sound levels are high
§ Check the operating manual of the monitoring equipment for more detailed instructions on
safety and precautions before using the equipment.
Energy Efficiency Guide for Industry in Asia –www.energyefficiencyasia.org
©UNEP
23
Monitoring Equipment
8. LUX METERS
8.1 What lux meters do
Lux meters are used to measure illumination (light) levels.
Most lux meters consist of a body, a sensor with a photo cell, and a display panel. The sensor is
placed under the light source. The light that falls on the photo cell has energy, which is
transferred by the photo cell into electric current. The more light is absorbed by the cell, the
higher the generated current. The meter reads the electrical current and calculates the appropriate
value of either Lux or Foot candles. This value is shown on the display panel.
A key thing to remember about light is that it is usually made up of many different types (colors)
of light at different wavelengths. The reading, therefore, is a result of the combined effects of all
the wavelengths. A standard color can be referred to as colo r temperature and is expressed in
degrees Kelvin. The standard color temperature for calibration of most light meters is 2856
degrees Kelvin, which is more yellow than pure white. Different types of light bulbs burn at
different color temperatures. Lux meter readings will, therefore, vary with different light sources
of the same intensity. This is why some lights seem "harsher" or “softer”than others.
Figure 20. Lux Meters (Reliability Direct, Inc)
8.2 Where lux meters are used
Lux meters are used to measure illumination levels in offices, factories etc.
8.3 How to operate a lux meters
This instrument is very simple to operate. The sensor is to be placed at the work station or at the
place where intensity of the light is to be measured, and the instrument will directly give the
reading on the display panel.
Energy Efficiency Guide for Industry in Asia –www.energyefficiencyasia.org
©UNEP
24
Monitoring Equipment
8.4 Precautions and safety measures
The following measures should be taken when working with lux meters:
§ The sensor is to be properly placed on the work station to obtain an accurate reading
§ Due to the high sensitivity of sensor it should be stored safely
§ Check the operating manual of the monitoring equipment for more detailed instructions on
safety and precautions before using the equipment.
Energy Efficiency Guide for Industry in Asia –www.energyefficiencyasia.org
©UNEP
25
Monitoring Equipment
9. REFERENCES
The text for this chapter is based on the section with information on energy equipment from the
Energy Manager Training website, with kind permission from India’s Bureau of Energy
Efficiency, supplemented with field experience from the National Productivity Council of India.
www.energymanagertraining.com/energy_audit_instrume nts/new_energy_audit_equipment.htm
The references for the figures in this chapter are as follows:
§ Figure 1: Hioki Ltd. www.hioki.co.jp/eng/product/power/328620.html
§ Figure 2 –8: Hioki Ltd. Users Manual - Hioki Hi Tester 32860
§ Figure 9: Dwyer Instruments Inc., USA. Measurement of Pressure with the Manometer,
2005. www.dwyer-inst.com/htdocs/pressure/ManometerIntroduction.cfm
§ Figure 10: Dwyer Instruments Inc., USA. Air Velocity Introduction. www.dwyerinst.com/htdocs/airvelocity/AirVelocityIntroduction.cfm
§ Figure11: Reliability Direct, Inc. Extech Instruments, User Guide Model EA15. 2004.
www.extech.com/instrument/products/alpha/EA10_15ThermoCouple.html
§ Figure 12: Nitonuk Ltd. 2003. www.nitonuk.co.uk/infared/infaredTI213EL.shtml
§ Figure 13: Omega Engineering Ltd., USA. 2003. www.omega.com/pptst/FL77_78.html
§ Figure 14. Omega Engineering Ltd., USA. 2003. www.omega.com
§ Figure 15: Dynasonics Ltd. Flow Meter Data Sheets DXF Model. 2003.
www.dynasonics.com/resources/products/pdfs/DFX.pdf
§ Figure 16: Eesiflow International Pty Ltd. www.eesiflo.com/measuring.html
§ Figure 17: Reliability Direct, Inc. Extech 461840 Programmable Digital Stroboscope.
www.reliabilitydirect.com/strobeproducts/EXT-461840.htm
§ Figure 18 : National Productivity Council (NPC) India, experience from various industrial
studies. 2006
§ Figure 19: Reliability Direct, Inc. Whisper Ultrasonic Leak Detector.
www.reliabilitydirect.com/ultrasoundproducts/INF-whisper.htm
§ Figure 20: Reliability Direct, Inc. Extech Instruments, User Manual Model 401027 Pocket
Foot Candle Light Meter. www.reliabilitydirect.com/lightmeters
Copyright:
Copyright © United Nations Environment Programme (year 2006)
This publication may be reproduced in whole or in part and in any form for educational or non-profit purposes without special
permission from the copyright holder, provided acknowledgement of the source is made. UNEP would appreciate receiving a
copy of any publication that uses this publication as a source. No use of this publication may be made for resale or any other
commercial purpose whatsoever without prior permission from the United Nations Environment Programme.
Disclaimer:
This energy equipment module was prepared as part of the project “Greenhouse Gas Emission Reduction from Industry in Asia
and the Pacific” (GERIAP) by the National Productivity Council, India. While reasonable efforts have been made to ensure that
the contents of this publication are factually correct and properly referenced, UNEP does not accept responsibility for the
accuracy or completeness of the contents, and shall not be liable for any loss or damage that may be occasioned directly or
indirectly through the use of, or reliance on, the contents of this publication.
Energy Efficiency Guide for Industry in Asia –www.energyefficiencyasia.org
©UNEP
26