1
THE USE OF MOBILE MAPPING TECHNOLOGY TO AUTOMATE
SURVEYING AND MONITORING OF SOUTHERN PINE BEETLE
INFESTATIONS
A Thesis
by
SAUL DAVID PETTY
Submitted to the Office of Graduate Studies of
Texas A&M University
in partial fulfillment of the requirements for the degree of
MASTER OF SCIENCE
May 2005
Major Subject: Forest Science
THE USE OF MOBILE MAPPING TECHNOLOGY TO AUTOMATE
SURVEYING AND MONITORING OF SOUTHERN PINE BEETLE
INFESTATIONS
A Thesis
by
SAUL DAVID PETTY
Submitted to the Office of Graduate Studies of
Texas A&M University
in partial fulfillment of the requirements for the degree of
MASTER OF SCIENCE
Approved as to style and content by:
________________________
Robert N. Coulson
(Co-Chair of Committee)
________________________
C.T. Smith
(Co-Chair of Committee)
________________________
________________________
W. Todd Watson
Forrest L. Oliveria
(Member)
(Member)
______________________
C.T. Smith
Head of Department
May 2005
Major Subject: Forest Science
iii
ABSTRACT
The Use of Mobile Mapping Technology to Automate Surveying and Monitoring of
Southern Pine Beetle Infestations. (May 2005)
Saul David Petty, B.S., Texas A&M University
Co-Chairs of Advisory Committee: Dr. Robert N. Coulson
Dr. C.T. Smith
The USDA Forest Service, Forest Health Protection, is responsible for
maintaining an ORACLE database named the Southern Pine Beetle Information System
(SPBIS). SPBIS was designed to store survey data for Southern Pine Beetle (SPB)
infestations on federal land across the southern United States.
The main purpose of this project is to improve the SPBIS database to aid in
management of SPB infestations to reduce losses, to harvest compromised timber while it
still has value, and to assist resource managers in preventing further infestations from
becoming established. The SPBIS mobile mapping system addresses current problems
with the database and offers viable solutions to each.
Mobile mapping technology is a versatile tool, which is used to collect field data,
with unique geospatial time tags and attributes, for integrating into or updating a GIS
(Rasher 2001). The ability to efficiently collect data is essential to developing a useable
database.
The time required to manually enter data into the database is substantial. Ranger
district personnel often do not have the time or the desire to enter data. Currently, the
iv
database is lacking years of survey and infestation data due to these negligent data entry
practices, limiting the usefulness database.
Currently, SPBIS data is recorded on a paper survey form. This system introduces
a digital version of this form. A time study conducted to define the efficiency of each
survey showed that the digital form to be more efficient with a Mann-Whitney p- value of
0.004. A comparative study was conducted to define the difference between currently
estimated SPB infestation acreage and those measured using GPS. A Mann-Whitney pvalue of 0.000 shows the significant difference between the two acreage values. GPS
measured acreage proved to be more accurate thus promoting the use of GPS for
measuring acreage. Navigation us ing GPS coordinates was successful and will greatly
decrease the time required to locate a SPB infestation on the ground.
This thesis describes a mobile mapping system designed specifically to remedy
the problems associated with SPBIS. This system eliminates the need for manual entry of
field-collected data, while improving field data collection in terms of efficiency and
accuracy.
v
DEDICATION
I would like to dedicate this thesis to my family, for all their love and support.
vi
ACKNOWLEDGMENTS
I would like to thank the following people for their help with this project: Robert
N. Coulson, Forrest L. Oliveria, Crawford W. Johnson, James R. Meeker, Chris A.
Steiner, William Bruce, Alexander C. Mangini, Stephen R. Clarke, James D. Smith, Valli
Y. Peacher, Timothy J. Haley, Anthony W. Courter, Judy Adams, Maria Tchakerian,
Sindhu M. George, Audrey Bunting, Jaehyung Yu, Robert A. Smiley, Jay P. McClain,
and Ray C. Henderson
vii
TABLE OF CONTENTS
Page
ABSTRACT ………………………………………………………………………
iii
DEDICATION ……………………………………………………………………
v
ACKNOWLEDGMENTS ………………………………………………………...
vi
TABLE OF CONTENTS …………………………………………………………
vii
LIST OF FIGURES.……………………………………………………………….
ix
LIST OF TABLES ………………………………………………………………...
x
CHAPTER
I
INTRODUCTION ………………………………………………… 1
Goals and Objectives.………………………………………………
Purpose……………………………………………………………..
Approach …………………………………………………………...
Technologies Involved in Mobile Mapping and Automated Data
Collection…………………………………………………………...
Mobile Mapping…………………………………………….
Global Positioning System (GPS)…………………………..
Geographic Information System (GIS)……………………..
Automated Data Collection…………………………………
Overview of SPBIS Mobile Mapping Project……………………...
II
2
2
4
5
8
9
BACKGROUND.………………………………………………….. 12
GIS and GPS in Forestry.…………………………………………..
The Southern Pine Beetle…………………………………………..
The Southern Pine Beetle Information System…………………….
Mobile Devices…………………………………………………….
Base Maps………………………………………………………….
III
1
1
2
12
14
18
21
22
METHODS AND MATERIALS.………………………………….. 23
Approach for SPBIS Data Form Development……………………..
Approach for Uploading Data into SPBIS………………………….
Technological Components of the SPBIS Mobile Mapping System.
Trimble® GeoXT™………………………………………...
ArcPad 6.0.3®……………………………….……………..
23
27
30
30
31
viii
CHAPTER
Page
Methods for Field Testing Components of SPBIS Mobile Mapping
System………………………………………………………………
Time Study: Paper versus Digital…………………………..
Infestation Acreage: Estimated versus GPS………………..
Navigation Using the Trimble® GeoXT™………………...
Accuracy of the Trimble® GeoXT™ GPS
Receiver……………………………………………………..
IV
32
33
34
35
35
RESULTS…………………………………………………………... 37
Time Study: Paper versus Digital………………………………….. 37
Infestation Acreage: Estimated versus GPS……………………….. 38
Accuracy of the Trimble® GeoXT™ GPS Receiver………………. 38
V
VI
DISCUSSION.……………………………………………………… 40
Time Study: Paper versus Digital.………………………………….
Infestation Acreage: Estimated versus GPS………………………..
Navigation Using the Trimble® GeoXT™………………………...
Problems and Solutions…………………………………………….
Accuracy of the Trimble® GeoXT™ GPS Receiver………………
40
41
43
45
50
CONCLUSIONS.……………………………………….…………..
53
Future Applications………………………………………………… 53
Summary…………………………………………………………… 55
REFERENCES …………………………………………………………………….
57
APPENDIX A
SURVEY FORM CODE IN VB SCRIPT.………………… 59
APPENDIX B
SPBIS DATA UPLOAD APPLICATION CODE………… 78
APPENDIX C
SPBIS DATA COLLECTION USERS MANUAL ……….
APPENDIX D
PAPER SPBIS DATA COLLECTION FORM……………. 152
81
VITA ………………………………………………………………………………. 154
ix
LIST OF FIGURES
FIGURE
Page
1
Thesis outline……………………………………………………………...
3
2
SPBIS mobile mapping project flow chart………………………………..
11
3
Southern Pine Beetle distribution area…………………………………….
15
4
The life stages of Dendroctonous frontalis Zimmerman, the Southern
Pine Beetle………………………………………………………………..
17
5
The digital SPBIS survey form, pages 1-5……………………………….
24
6
The SPBIS User interface with the screen prompts for uploading data
from the mobile unit………………………………………………………
29
Components of the GeoXT™ version of the Trimble® GeoExplorer®
CE system……………………………………………………………….…
32
Southwide trend of acreage infested by SPB from 1979 through 2003…..
41
7
8
x
LIST OF TABLES
TABLE
Page
1
Means, standard deviations, sample sizes (N) and p-value from MannWhitney U test comparing the time required to complete the paper SPBIS
survey form and the digital SPBIS survey form. The p-value of 0.004
indicates a significant difference at a = 0.05……………………………… 37
2
Means, standard deviations, sample sizes (N) and p-value from MannWhitney U test comparing the estimated and measured acreage of 44
southern pine beetle infestations on the DeSoto National Forest,
Chickasawhay District in Mississippi. The p-value of 0.000 indicates a
significant difference at a = 0.05………………………………………….. 38
3
Trimble® GeoXT™ accuracy test under less than optimum conditions….. 39
1
CHAPTER I
INTRODUCTION
Goals and Objectives
The specific objectives of this project are to; (i) develop a digital version of the
Southern Pine Beetle Information System (SPBIS) field data collection form; (ii)
develop an interface between the SPBIS database the Trimble© GeoXT™ mobile unit to
facilitate seamless data upload; (iii) conduct comprehensive field testing of the Trimble©
GeoXT™ mobile unit and the digital form; (iv) develop a SPBIS mobile mapping
training manual for USDA Forest Service personnel at the Ranger District level and; (v)
streamline SPBIS data collection and entry process in order to make real-time data
available for operational purposes.
Purpose
The main purpose of this project is to improve the SPBIS database to aid in
management of SPB infestations to reduce losses, to harvest timber killed by SPB while
it still has value, and to prevent additional infestations from becoming established.
Current problems with the SPBIS data entry and collection process have prevented the
database from being a useful tool. Negligent data entry practice is the primary problem.
The new data collection system developed with this project will correct many of the
current problems and aid in developing SPBIS into a useful tool for operational resource
management decision- making.
___________
This thesis follows the style of Environmental Entomology.
2
Approach
This thesis is orga nized into six chapters. Chapter I provides goals and objectives
and a description of the project. Chapter II provides background information for each
component of this project. Chapter III details the methods and materials used to achieve
each objective. Chapter IV provides all measured results. Chapter V provides discussion
of each objective. Chapter VI provides conclusions and potential future applications.
Appendices to this thesis will include a hard copy of the VB Script code for the SPBIS
data form, the VB Script code for the SPBIS data upload application and a SPBIS Data
Collection User’s Manual. See Figure 1 for a complete thesis outline.
Technologies Involved in Mobile Mapping and Automated Data Collection
Mobile Mapping
Mobile mapping can be defined as “the ability to collect field data, with unique
geospatial time tags and attributes, for integrating into or updating a GIS” (Rasher 2001).
Mobile mapping allows for the collection of a variety of data types at any time and place.
The differences between mobile mapping and automated data collection are subtle.
Automated data collection can be done from a stationary position, while the term mobile
implies that data is collected on the move. Mobile mapping systems are designed to
facilitate automated data collection in the field. Mobile mapping was initially developed
by NASA’s Center for Mapping and the University of Calgary, Canada (Gajdamowicz as
in Xiao and Zhang 2002). Three major components comprise a mobile mapping system:
GPS, a GIS and a hand-held mobile device for data collection.
3
4
Global Positioning Systems (GPS)
Current uses for the Global Positioning System (GPS) range from recreational to
military applications. GPS was developed by the United States Department of Defense in
the 1960s. The original satellite positioning system, developed in 1964, was called the
Navy Navigation Satellite System. It was comprised of seven satellites orbiting the earth
and was used by ballistic missile submarines to update their internal navigation systems.
Current GPS technology can achieve sub-centimeter accuracy with high-end receivers,
which proves sufficient for most applications.
The GPS constellation consists of 30 Block II, Block IIA and Block IIR satellites.
The name block refers to the fact that the satellites were deployed in groups, or blocks.
The subsequent number refers to the design model. The Block IIs were the first fully
operational GPS satellites. These satellites were designed to operate 14 days without
contact from the Control Segment (USNO BLOCK Satellite Publication 2004). The
Control Segment consists of a Master Control Station located at Schriever Air Force Base
in Colorado Springs, Colorado and monitoring stations located on Hawaii, Kwajalein,
Diego Garcia and Ascension Island (NAVSTAR GPS Joint Program Office 2003). Nine
of these satellites were launched between February 1989 and October 1990. BLOCK IIAs
are second-generation GPS satellites. They were designed to operate 180 days without
contact from the Control Segment. Over this 180-day time period signal degradation
becomes evident. Nineteen of these satellites were put into orbit between November 1990
and November 1997. Both the BLOCK II and IIA were developed by Rockwell
International and have a projected life of 7.3 years. Each satellite contains four atomic
clocks and has Selective Availability capabilities (USNO BLOCK Satellite Publication
5
2004). The BLOCK IIR satellites are the newest generation of satellites utilized by the
GPS. First launched in January 1997, these satellites have a projected life of 7.8 years.
They were developed by Lockheed Martin and were designed to “provide at least 14 days
of operation without contact from the Control Segment and up to 180 days of operation
when operating in the autonomous navigation mode”(USNO BLOCK Satellite
Publication 2004).
GPS receivers utilize triangulation of satellite navigational signals to obtain a
position. When GPS was first introduced users were limited to certain “windows” in
which satellite signals could be acquired. The increased number of GPS satellites allows
users to have an extended period of time in which a signal can be acquired.
Geographic Information Systems (GIS)
GIS can be defined as “an arrangement of computer hardware, software, and
geographic data that people interact with to integrate, analyze, and visualize data; identify
relationships, patterns, and trends; and find solutions to problems. GIS are designed to
capture, store, update, manipulate, analyze, and display the geographic information”
(Kennedy 2002). GIS is being integrated into a variety of fields and is the preferred
method of manipulating and displaying spatial data. GIS technology has become more
readily available to consumers on both a technical and economical basis.
GIS technology was developed as its own entity, completely independent from the
workings of the organizations that utilized its output. The use of a GIS was limited to
relatively few, highly trained experts. GIS professionals generally carried out tasks on
behalf of others within an organization (Harrington and Lauer 2004). These professionals
performed operations on powerful stand-alone computers. Today users have access to
6
GIS software on their personal computers, and with relatively little training a user can
produce viable output.
GIS allows users to easily manipulate and display geographical data. The term
data is used to describe “any collection of related facts arranged in a particular format;
often, the basic elements of informa tion that are produced, stored, or processed by a
computer” (Kennedy 2001). Quality data is essential to creating a useable GIS
application.
There are three main ways in which GIS data can be obtained: public domain,
commercially, or self-produced. An abundance of GIS data can be accessed via the
Internet for little or no cost. Data that are considered public domain often includes census
information, public roads, public waterways, municipal boundaries, and many other
common features. This data are often made available by government agencies at the
local, county, state, or federal level. One drawback to public domain data is the fact that
the data are only available “as- is”.
Commercial data provides the user with more options, but at a higher price. Some
commercially collected data can be extremely expensive. Reasons for high costs include
the seller’s need to offset collection costs, and the desire to limit use of the data to serious
users only. Commercially collected data are often of a higher quality than that of public
domain as the collectors often have a wealth of resources at their disposal. In certain
cases it is possible to obtain customized data sets from commercially gathered data as it is
often more comprehensive, thus catering to a greater range of needs.
The third method of obtaining GIS data is self-production. The major advantage
of this method is the data will be collected to the user’s exact specifications. While this
7
would be the preferred method of collection for most, it is an extremely expensive
endeavor. Data collection, whether done by ground personnel or by remote sensing
equipment, is time consuming. Equipment and man-hour costs are extremely high
making this method ideal but often not feasible. As far as data acquisition is concerned,
“if the data you need for a project exists, use it; don’t take the time to replicate it”
(Srinivasan 2003).
GIS data come in many different forms. Current software packages can read a
variety of file formats. GIS data file formats include shapefiles, digital orthoquads
(DOQ), digital raster graphics (DRG), multi-resolution seamless image database
(MrSID), and bitmaps (BMP), among others. These file formats can be obtained using all
of the methods mentioned above. GIS files, if they are created correctly, have an
information file associated with them known as metadata. Metadata is defined as
information about the content, quality, condition, and other characteristics of data
(Kennedy 2001). Metadata is used to document how, when and where data were
collected, as well as, its projection, scale, resolution and accuracy. Metadata consists of
two features: properties and documentation. Properties are derived from the data source
and include coordinate systems and projections. It is important to have metadata files for
all data sets. When trying to combine data from many different sources, it may become
necessary to make transformations to ensure all the data combine properly. In order to
make certain transformations, information about a data file is needed. This information is
also contained in the metadata.
8
Automated Data Collection
The evolution of field data collection has increased exponentially in recent years.
Traditional data collection often consists of a field technician manually recording
observations. Advances in hand-held mobile device technology have increased the
opportunities for automated data collection. Hand- held mobile devices are personal
computers designed for field use. For mobile mapping applications, they integrate a userfriendly operating system, GIS software, and GPS capabilities to allow for efficient and
accurate data collection. Mobile devices come equipped with many different software and
hardware configurations to suit the needs of the individual user. It is important to
consider the environment in which the mobile device will be used. Field conditions are
more variable and often much harsher than those in an office environment. It is important
to consider the functionality of the device in the field and, most importantly, protection of
collected data. The memory capacity and processor speed of the device are also
important. The device must have enough memory to sufficiently store data, while being
able to efficiently operate GIS software, which is often graphically intense. The software
utilized by the device must also be compatible with the software on a desktop computer
in order to facilitate data transfer. Mobile devices are constantly changing, becoming
more compact yet more diverse in their capabilities.
This brief overview of the components of a mobile mapping system is intended to
show that these technologies, while having several inherent drawbacks, will continue to
improve. This thesis will discuss in depth one specific mobile mapping application in the
field of forest entomo logy.
9
Overview of the SPBIS Mobile Mapping Project
The USDA Forest Service, Forest Health Protection Unit is responsible for
surveying and monitoring all insect and plant pathogen problems on national forests in
the southern United States. The SPB is the most extensively monitored insect pest in
southern pine forests.
The sequential steps in surveying and monitoring the SPB are illustrated in Figure
2. The survey begins with aerial sketch mapping. The traditional method of aerial sketch
mapping involves manually marking the location of SPB infestations on a paper map.
Digital aerial sketch mapping is a new technology that utilizes GPS and GIS technologies
to allow the surveyor to mark areas on a digital map, which are in turn converted into a
data format that can be used in a GIS. Each location marked on the map has GPS
coordinates associated with it. This data can then be uploaded into a hand-held device
and used for navigation purposes. It is often difficult to locate infestations on the ground
using traditional navigation methods. GPS coordinates allow the surveyors to reach the
desired location more quickly.
Once a spot has been located, a survey form is completed. The current form
consists of a single sheet of paper containing blank fields for each desired data type. The
data are collected on the paper form and manually entered into the SPBIS database.
It has been determined that the primary restriction in the current SPBIS data
collection process is data entry. Entry of data into SPBIS is a time consuming process and
is often neglected. When SPB outbreaks occur during the summer, district personnel have
limited time in which to enter survey data into SPBIS. In order for SPBIS to be used as
an operational management tool data must be entered in timely manner. Given the current
10
situation SPBIS data are not used for operational forest management decision- making.
The database serves as storage for historical outbreak records. The combination of a
mobile GPS unit and a digital upload interface between the unit and SPBIS will allow
surveyors to collect data in a digital format and upload it directly into the database. This
will eliminate much of the need for manual data entry.
The shortcomings of the SPBIS database will continue to be compounded if the
development of a dependable system for data acquisition and processing is further
delayed. With little or no data entry occurring, information for decision- making is
limited. This severely limits the ability of managers to develop plans for prevention and
suppression.
11
Figure 2. SPBIS mobile mapping project flow chart
12
CHAPTER II
BACKGROUND
GIS and GPS in Forestry
Applications of mobile mapping in forestry are among the most diverse of any
field of study. One general example of the utilization of a GIS is in forest management.
The world over, forested lands are being managed for a variety of objectives, from
traditional timber harvest to aesthetic value for visitors. No matter what the objective, a
management plan is required. One option that is becoming more prevalent is spatial forest
planning. The term spatial refers to “any information about the location and shape of, and
relationships among, geographic features” (Kennedy 2001). Spatial forest planning can
serve as a means of guidance for management within an increasingly complex framework
of regulations, voluntary program guidelines, and the need to efficiently manage forest
resources in a changing management environment. Many regulatory, environmental, and
economic factors can be addressed using this method of planning (Bettinger and Sessions
2003). Spatial forest planning is a dynamic process that requires some degree of database
development and maintenance. Once a working database has been established,
researchers can utilize outputs to aid in making management decisions.
A more specific example of the use of a GIS in forestry is the digitizing of
national forest land in the United States. In recent years changing attitudes toward
national forests have increased demands to manage forests in a socially acceptable and
ecologically sustainable manner (Wiley and Weih 1997). GIS provides an easy way to
develop and maintain a management plan to meet these objectives. One of the first
objectives of national forest systems across the country was to create digital files of all
13
the geographic features that comprise the forest. Each National Forest was faced with the
enormous yet necessary task of digitizing all of their data.
When considering database development, it became necessary to determine what
types of data were being collected and devise methods to store, view, integrate and
evaluate many different data formats. Some of the data formats that were being digitized
were tabular records, tables, charts, analyses, color slides, color and black and white
photographs, stand maps, and plot diagrams to name a few (Wiley and Weih 1997).
The most prominent digitized geographical features include compartment
boundaries, stands, water, and road networks. Some secondary features may include
wilderness areas, landmarks, specific wildlife habitats, and controlled burn areas. Several
of these features are dynamic in nature and require continuous updates. For example,
features such as compartment boundaries do not change very often, but features such as
burn areas are likely to change from season to season. These features are often converted
into a digital format known as a shapefile. In general, shapefiles are delineated as points,
lines or polygons. They are easily created and manipulated within GIS software packages
and provide a digital view of any geographic feature. Once data are integrated into a GIS
it is possible to develop timely, real world models for planning and management.
In recent years several technological developments have had a significant impact
on how data are collected, manipulated and displayed. Identification and cataloging
attributes such as species, size, health, and location are important to developing a
successful management plan. The use of mobile mapping technology makes this task
easy to accomplish. GIS allows for the “rapid access, processing and updating of large
amounts of data” (Kane and Ryan as in Adnan et al. 2001). The combination of GIS and
14
GPS for forest management allows the manager to quickly produce accurate maps, which
can display a wide variety of information.
The Southern Pine Beetle
SPB is the most destructive insect pest in southern pine forests. The beetles range
from the southeastern United States to parts of Mexico and Central America, as shown in
Figure 3. The beetles are an indigenous species and damage reports date back to the late
1700s (Payne 1980). Due to the destructive nature of this pest, millions of dollars are
spent annually on control, monitoring, and research in an attempt to curtail losses.
The SPB is a very aggressive species of bark beetle that can kill many acres of
healthy forest when populations reach substantial numbers. The preferred hosts of this
insect include loblolly pine, Pinus taeda, and shortleaf pine, Pinus echinata, though
the beetles will attack several other pine species, as well (Payne 1980).
The SPB is about the size of a grain of rice. Figure 4 illustrates the life stages of
the beetle. Adult beetles attack living trees by boring into the bark and feeding on the
phloem tissue. Eggs are also deposited in the phloem. The new generation feeds in the
phloem, emerges through the bark and disperses to colonize new trees. The ability of the
beetle to kill a healthy tree is attributed, in part, to their mass attack of trees over a
relatively short period of time. The mass attack process is initiated by adult females,
which bore into the tree and release pheromones that in combination with volatiles from
the damaged tree attract large numbers of beetles.
15
Figure 3. Southern Pine Beetle distribution area (Payne 1980).
16
If a sufficient number respond they overwhelm the defenses of the host tree, and
then begin attack on adjacent trees. Infestation scale can range from one tree to hundreds
of acres. The duration of each generation of beetles ranges from 26 to 54 days, with three
to nine generations occurring per year depending on geographic location (Payne 1980).
To illustrate the magnitude of loss caused by these insects, an estimated $901.8 million in
damage was reported during the period from 1960 to 1990 (Price et al. 1992).
Despite years of research, there are currently no effective short-term control
measures for this pest. In order for this problem to be remedied in the future an accurate
historical record, as well as, real-time data must be made available. The Southern Pine
Beetle Information System (SPBIS), which will be discussed in detail in the next section of
this chapter, has the potential to meet both of these needs. Current problems with the
database have limited its utility. This thesis deals with a tool that will streamline the data
acquisition and storage process thus making SPBIS a functional tool.
17
Egg
Larvae
Pupa
Callow Adult
Adult
Figure 4. The life stages of Dendroctonous frontalis Zimmerman, the Southern Pine
Beetle (Payne 1980).
18
The Southern Pine Beetle Information System
The Southern Pine Beetle Information System (SPBIS) is an ORACLE® database
that was developed for and is maintained by the USDA Forest Service State and Private
Forestry Region 8 Forest Health Protection. The Southern Region (Region 8)
encompasses 13 states from Texas to Virginia, including Tennessee and Kentucky to the
north and Puerto Rico to the south. The SPBIS database is “a Ranger District based
system for the storage and retrieval of information about the location of individual SPB
infestations, scheduled activities, and accomplished activities” (SPBIS Installation Guide
2002).
The primary purpose of SPBIS is to store SPB infestation records that can be later
used for suppression and monitoring activities. Under ideal conditions, personnel on each
district enter data on a weekly basis. If data are entered on a regular basis, then the
database reflects real-time status of all current SPB activities as well as historical spot
records. Users can then produce status reports on a regular basis allowing them to make
informed decisions concerning monitoring and suppression activities. While this process
appears to be simple, SPBIS has seldom, if ever, been a useful tool. The following is a
brief history of the development of SPBIS.
SPBIS was originally developed in the late 1970s and resided at the Ft. Collins
Computer Center as a group of FORTRAN computer programs. In 1983, SPBIS was
revised and placed on Apple II computers at the District level. In 1988, SPBIS was
released utilizing the Forest Service Data General computers. SPBIS 2.0 was released
January 1999 and was designed to run on the IBM RISC 6000 computers at Forest
Service Regional, Forest, and District offices. SPBIS 2.0 uses the ORACLE® database
19
management system, and ORACLE® Forms. SPBIS 2.1 was released in December
1999. It moves the forms from Exceed to PC. SPBIS 3.0, released in March 2002,
included a new graphical user interface (GUI). The new GUI was developed in Visual
Basic, and provides the user with more assistance and functionality. Data entry has been
streamlined to minimize the need for training, and data integrity has been improved
through a new, supplemental error checking routine (SPBIS Installation Guide 2002).
The SPBIS database catalogs SPB infestations, which are commonly referred to
as spots. A unique number catalogs spots comprised of at least 10 trees. “Data fields in
SPBIS include national forest, district, spot number, detection date, ground-check date,
number of infested trees, acres affected, and suppression date, among others. Each spot is
assigned a primary treatment: cut-and-remove, cut-and- leave, cut-and- hand-spray, pileand-burn, inactive, or monitor. This primary treatment can be changed when the database
is updated based on subsequent management of the spot. Most monitored spots are
subsequently reclassified as inactive, because they typically contain very few or no
freshly attacked trees at the initial ground check. Saw timber and pulpwood volumes are
included for spots treated by cut-and-remove. Numbers of trees treated are recorded for
cut-and- leave and cut-and- hand-spray treatments. Treatment breakouts (missed infested
trees) were tracked by adding a letter to the end of the spot number, starting with A”
(Clarke and Billings 2003).
Since its initiation, SPBIS has been plagued with problems. The database has
evolved continuously since the 1970s but documentation of the code for ORACLE®
based version is not available. The code for the SPBIS database is of significant
20
complexity and without documentation of the structure it becomes extremely difficult to
manipulate.
SPBIS has several problems that need correction. These problems coupled with
the lack of knowledge of the code structure led to a period of time in which few changes
were made to the database. This lack of improvement led to widespread frustration
among the users of the database ultimately leading to almost complete abandonment of
data entry.
SPBIS data was traditionally collected in the field on paper forms. Each year data
were collected for each SPB infestation but, with the exception of a few districts, were
never entered into SPBIS. This backlog of data further compounded the problem of
retrieving usable data from the database.
In recent years, employees of the Forest Health Technology Enterprise Team
(FHTET) in Fort Collins have slowly mapped out the code structure allowing them to
make the needed improvements to the database. With SPBIS currently up to date, the
issue of historical data becomes important. The extensive collections of SPBIS data
sheets are in the process of being manually entered into the database.
When used properly, SPBIS can be a valuable tool for monitoring and
suppression activities on a district. In the event of a SPB epidemic, SPBIS allows
personnel to easily monitor the status of all infestations on the district. At times there can
be hundreds of infestations that are in some stage of being controlled or monitored and
the SPBIS system will produce reports that can assist in the rapid direct control of these
infestations (SPBIS Installation Guide 2002).
21
The future of SPBIS lies in the ability of data to be effectively entered into the
database. Negligent data entry is the primary hindrance to the utility of the database.
Efficient data entry is not only attainable but is one of the primary objectives of this thesis
project. The ability to upload data directly from the mobile device into the database will
eliminate the backlog of datasheets and transform the SPBIS database into a useful tool for
making management decisions.
Mobile Devices
In the past, hand-held mobile devices have had several drawbacks that made them
unavailable for many applications. The foremost drawback was the price of these units.
Many potential users simply could not afford to purchase these devices. The software used
by these early units was often complicated and difficult to learn. Early software packages
were also vendor specific, which meant they could not be used with any other technology
for other applications. Early mobile devices often had very slow processors, which made
data manipulation and processing very difficult (Wadhwani 2004). Other drawbacks
included small displays, inadequate battery life, and awkward, bulky construction.
Developers of the new generatio n of hand- held mobile devices have sought to
remedy the problems of the old devices. In most respects they have succeeded. The new
devices range in price from $300 - $6000 (Wadhwani 2004). Familiar names such as
Windows® and Palm® have developed operating systems that run on these units, making
use of these devices much easier than before. The newer units have faster processors,
longer battery life, larger displays with improved color, and are much more compact than
their predecessors. These improvements make mobile devices a feasible addition to many
field data collection applications.
22
Base Maps
A base map is defined as “a map depicting background reference information
such as landforms, roads, landmarks, and political boundaries, onto which other, thematic
information is placed” (Kennedy 2001). Base maps are used to orient the user to a
specific area. Each layer that comprises a base map must be geo-referenced alike. This
ensures the positional accuracy required while navigating on the ground. The accuracy of
a location garnered from a base map is only as good as the map itself. The layers used to
construct base maps are often shapefiles or data from remote sensing equipment.
Base map packages are an important part of any data collection project. In the case of
SPBIS data collection, these packages often consist of compartments, stands, water
features, roads, and wildlife habitats. Layers ranging from topographical maps to points of
interest can be utilized to meet the needs of any application. These layers can be
manipulated in any GIS software package such as ArcGIS® or ArcView®. Both of these
ESRI® products contain an extension that allows the user to prepare the maps for use in
ArcPad®. Within ArcPad®, maps are delineated by the extension (.apm), which stands for
ArcPad® Map file. This file contains information regarding the map layers, map extent and
settings specific to the map. Several base map packages can be saved within the GeoXT™
for use in several different areas. The composition of a base map package is entirely
decided by the user and can be tailored to meet the needs of any project.
23
CHAPTER III
METHODS AND MATERIALS
Approach for SPBIS Data Form Development
One of the main objectives of this project was to develop a digital version of the
SPBIS data collection form. The final version of the form consisted of five pages, which
contained all the fields needed for initial spot data collection. Figure 5 shows the form
pages as they appear on the mobile unit. Data entry associated with each page is
described below.
The form was developed using ArcPad® Studio within ArcPad® Application
Builder. ArcPad® Application Builder is a development environment for creating custom
GIS applications. Custom applications developed within this environment can be used on
any ArcPad® software-based mobile device. For tasks such as development of the survey
form for this project, “ArcPad® exposes an extensive object model that can be accessed
by writing VBScripts” (ESRI® ArcPad® White Paper 2004). The VBScript code for this
application was written by S.M. George and is available in Appendix A.
24
.
Figure 5. The digital SPBIS survey form, pages 1-5
25
The SPBIS database is designed to keep a record of all survey information. All
data are collected into a primary database file (DBF) table and a backup DBF table,
which is associated with a shapefile. Each field within the form has a column in the DBF
table. Each column in the DBF table corresponds to a field in the SPBIS database by
name. The backup DBF table is the record that is uploaded into SPBIS. Several fields can
be edited. Anytime a spot is edited any previous information is overwritten. Radio
buttons for adding a spot, a head, or a breakout are located at the top of the first page.
One of these choices must be made in order for data to be recorded. If a choice is not
made no data will be recorded.
SPB Spot Data is the heading on the first page. The fields on the first page include
the region, forest, district, spot number, head or breakout number, parent head or
breakout, and species of pest. The region, forest and district fields each have drop-down
menus that contain all the possible location choices. The head or breakout number and
parent head or breakout fields have default values if the user enters no value. Secondary
heads and breakouts rarely occur, therefore default values must be available in order for
the data to be uploaded into the database. The drop-down menu for pest species field
contains three choices: Southern Pine Beetle, any of the several species of Ips sp. beetles
that attack pine, and Black Turpentine Beetle, Dendroctonus terebrans Olivier. These
three pests are not the only species that will be encountered while conducting a survey
but they are the most prevalent.
Heads and breakouts are the heading for the second page. This page contains
fields for the compartment number, the stand number, wilderness identification,
26
wilderness name, pine basal area, total basal area, spot locator identification, spot
priority, and the estimated area. The wilderness identification field contains a simple yes
or no option. If a spot is in a wilderness area it greatly affects the treatments that can be
applied. If the spot is in a wilderness area the wilderness name field is activated. It
contains names of wilderness areas that correspond to the forest and dis trict chosen on the
first page. The pine and total basal area are determined for the stand in which the spot
occurs. The spot locator is the name of the person who found the spot. The priority field
contains three choices, high, medium and low. An option is chosen based on spot activity
and the value of the material contained in the spot and surrounding areas. The acreage
that is determined by traversing the spot with an activated GPS is entered into the
estimated area field.
Survey: Page 1 is the heading for the third page. This page contains fields for the
survey type, the initial detection date, the ground check date, the suggested treatment
plan, flagging color, and logging access. The survey type field contains the following
choices: aerial, ground, and video. These choices correspond to the manner in which the
spot was detected. The initial detection date is the date the spot was found, while the
ground check date is the date the spot is first visited on the ground. These dates can be
the same but often are not. The ground crew that conducts the initial spot survey
recommends the suggested treatment plan. Treatment recommendations are based on
current spot activity and value of the stand in which the spot is located. The flagging
color field has a drop-down menu that contains several common flagging colors.
Flagging color is important to know for revisiting the spot. The final field on this page is
logging access. The initial ground survey crew also determines logging access based on
27
the possibility that the spot will be logged and its location. This field has drop-down
menu with the choices poor, fair, regular, and good. The poor choice is made when the
spot is not a candidate for logging. Fair access is chosen when a logging decision cannot
be made during the initial survey. Regular is chosen when the site can be accessed at
most anytime. Good is chosen when the spot can be easily accessed and the logs easily
hauled from the site.
Survey: Page 2 is the heading for the fourth page. This page contains fields for
timber type, fresh attack determination, number of infested trees, number of red or fader
trees, number of green infested trees, and number of vacated trees. The timber type
choices include pulpwood, saw timber, and mixed. A choice is made based on the
composition of the spot. The fresh attack field contains a simple yes or no. This aids in
determining what actions should be taken for control of the spot. The subsequent four
fields are used to determine the composition and size of the spot. The number of infested
trees will equal the number of red and fader trees plus the number of green infested trees.
Each field has an increment counter that allows the user to add one tree at a time while
walking through a spot.
The final page of the form is for comments. Anything concerning the spot that the
surveyor would like to remember can be recorded here.
Approach for Uploading Data into SPBIS
Seamless upload of data into the SPBIS database is the most important aspect of
this project. One of the major problems with the current data collection system is data
entry. Manually entering data into the database is time consuming and impractical at the
degree required during SPB epidemics.
28
In order to streamline the data collection process, an application for uploading
data directly from a mobile device was developed. The Forest Health Technology
Enterprise Team (FHTET) in Fort Collins, CO and Forest Health Protection in Pineville,
LA in conjunction with the Knowledge Engineering Laboratory at Texas A&M
University developed an interface between the SPBIS Oracle tables and the backup
database file (DBF) table associated with the digital SPBIS data form. This application
was created in Visual Basic 6.0 and is embedded in SPBIS Version 5.0. The code for this
applicatio n is contained in Appendix B. The complex structure of the SPBIS database did
not lend itself to the development of a simple data upload interface. Fields within the
database are interconnected with one another. Therefore fields within the DBF table of
the data form must be connected to a corresponding field within SPBIS in order to have
successful routing of data.
The upload application reads data from each record on the mobile device in DBF
form and writes them to five individual SQL statements that insert the data into the
ORACLE® tables. After data has been uploaded the ORACLE® tables are queried to
determine what control number (CN) Oracle has assigned each record so the origin or
“parent” of each record can be tracked. The CN for a specific record is required if any
modifications are to be made. The CN allows the database to search for the parent record
and add newly collected data or overwrite existing data.
The mobile unit is linked to the SPBIS via a Universal Service Bus (USB)
connection. Once the unit and the database are in sync, data is automatically extracted
from the mobile unit and stored in the database. Figure 6 shows the initial graphical user
29
interface (GUI) and subsequent screen prompts, as they will appear on a desktop
computer.
Figure 6. The SPBIS User interface with the screen prompts for uploading data from the
mobile unit (Screen shots courtesy of Anthony Courter, FHTET, Ft. Collins, CO).
30
Technological Components of the SPBIS Mobile Mapping System
Trimble® GeoXT™
The hand-held mobile device being used for this project is the Trimble®
GeoXT™. The unit is advertised as providing “sub- meter accuracy required for
professional GPS/GIS data collection and data maintenance and EVEREST™ multipath
rejection technology for tough GPS environments, which will be discussed in detail in
Chapter IV. This device is ideal for working under forest canopy, in urban canyons, or
anywhere you need high-accuracy data collection and maintenance” (Trimble Customer
FAQ 2004).
The units being employed by this project utilize the Windows CE® 4.2 operating
system. This operating system has many of the same features as a typical Windows
desktop PC operating system, but it is designed for use on a mobile unit. The use of a
Windows product promotes more efficient training of field personnel, as most people are
familiar with Windows products in some capacity.
For this application, the GPS controller housed within ArcPad® is used for
gathering position information. The physical characteristics of the GeoXT™ also make it
an ideal candidate for this application. The unit can operate in a temperature range from
14°F to 122°F, while also being dustproof and shock and moisture resistant. The display
screen on this unit allows for use in direct sunlight and overcast conditions. High screen
resolution allows the user’s data to be displayed clearly, while a multi-stage light allows
for nighttime use. When fully charged, the unit battery has a life of 10 hours with the
GPS activated, which allows for an entire day of work to be done with a completely
charged unit. The unit is charged via the support module or charging cradle. An AC
31
adapter that plugs directly into an ordinary wall outlet powers the charger. It is important
to recharge when the battery is depleted below 50% of its maximum voltage. Trimble®
also recommends that the unit be charged for no more than four hours at a time. A classic
flaw of many mobile units is the loss of data when the battery is completely depleted.
With this unit any information saved to the disk is not lost. The unit is linked to a desktop
computer via a USB connection. This allows for the rapid and dependable exchange of
data. Microsoft ActiveSync® facilitates data transfer (Trimble® Datasheet and
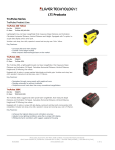
Specifications 2004). Each component of the Trimble® GeoXT™ package is illustrated
in Figure 7.
ArcPad 6.0.3®
The GIS software package used for this mobile mapping application was ESRI®
ArcPad 6.0.3®. This program is very similar to ESRI®’s desktop ArcGIS® package in
terms of user interface and basic functionality, but it is specifically designed for use on a
mobile unit. ArcPad® allows the user to import both vector and raster data types such as
shapefiles and DOQQs. ArcPad® is software for mobile GIS and field mapping
applications. This software provides an integration of GIS and GPS to field users via a
hand-held mobile device. ArcPad® has traditional GIS functionality such as map
navigation, layering, and querying. Data collection with ArcPad® is fast, easy and
improves field-based data validation and availability (ESRI® White Paper 2004).
ArcPad® supports almost every common data format associated with GIS. For this
reason, there is rarely a need to convert data formats between the desktop computer and
the mobile device.
32
Figure 7. Components of the GeoXT™ version of the Trimble® GeoExplorer® CE
system
Methods for Field Testing Components of SPBIS Mobile Mapping System
Field-testing of the SPBIS mobile mapping system was conducted in eastern
Mississippi, on the Chickasawhay Ranger District of the DeSoto National Forest. This
area was chosen for its abundance of Southern Pine Beetle spots. Each aspect of the field-
33
testing was limited to two people in order to minimize possible deviations in the data due
to varying degrees of surve y experience. The time required to conduct a survey by a
veteran employee at the district level would likely not be comparable to the time required
by a graduate student with limited survey experience.
For the sake of uniformity and time management each spot was visited after the
initial survey had been done. This approach allowed confirmation of spot locations by
number, as well as, access to data for comparisons. The testing objectives were to define
the difference in the time required to complete each version of the survey, to define the
difference in estimated spot acreage and measured spot acreage, to define the utility of
the navigation features on the Trimble GeoXT™, and to define problems that could be
encountered in the field and how to correct them.
Time Study: Paper vs. Digital
A time study was used to define the amount of time necessary to accomplish a
unit of work, using a given method, by a surveyor possessing sufficient skill to do the job
properly (Mundel 1947). Project coordinators are continually striving to maximize the
level of quality at which a task is completed while minimizing the amount of time
required for completion of the given task. While this delicate balance is often hard to
achieve, technological advances provide a range of options to streamline almost any
process.
Using a stopwatch, the action of completing each version of the SPBIS survey
was measured and recorded at each spot. The timing commences when the surveyor
begins assessing the spot and ends when the entire survey form is complete. The time
required to obtain a GPS position for the digital survey method was not considered, as we
34
did not obtain a GPS position for the paper survey. The time required to traverse the spot
for determining acreage was also not considered because it is not an aspect of the paper
survey. Only actions common to both surveys were included in the recorded time.
District surveyors using the paper survey method often use recreational GPS units, such
as those designed by Garmin®, to obtain positional information for each SPB spot. The
surveyors also mark the perimeter of each spot to aid in determining size and direction
but the time to do this is not recorded. The primary goal of this procedure was to measure
the time required to complete each survey type under field conditions. Times were
recorded for both form types on a total of 54 infestations.
Infestation Acreage: Estimated versus GPS
To determine acreage, an individual polygon was created for each spot. Under
normal operating conditions, the surveyor would determine the extent of the spot then
walk the perimeter to create a polygon and obtain the area. A useable polygon of each
spot was created by the continuous collection of GPS points. The attribute table
associated with each polygon has a record of the spot area. The area is reported in square
feet. A conversion must be made to determine the area in acreage if the spot area is
displayed in square feet. This conversion may be a slight inconvenience but can be done
quickly with the GeoXT™ built- in calculator. The step-by-step process for creating a
spot polygon is available in Appendix C.
As mentioned at the beginning of this chapter, the spots for this study were
ground checked by district personnel before we arrived. It is common procedure for the
district surveyors to flag the perimeter and the head(s) of the spot. This practice allows
the surveyor to make an educated estimate of the acreage and to learn the dynamics of the
35
spot. In order to make a comparison between the estimated acreage and measured acreage
the polygons were created using the flagged perimeter of the spot. Acreages were
measured for a total of 44 infestations.
Navigation Using the Trimble® GeoXT™
Aerially gathered GPS coordinates were not available for the area being fieldtested, therefore coordinates gathered during the initial ground check were used to test the
utility of the navigation features on the Trimble® GeoXT™®. The initial GPS
coordinates were entered into a Microsoft Excel spreadsheet, saved as a DBF file and
imported into ArcView® desktop GIS software and converted into a point shapefile. This
shapefile was added, as a layer, to the base map package. Using the point shapefile, a
district roads shapefile, and the GPS receiver activated we were able to navigate to SPB
spots.
Accuracy of the Trimble® GeoXT™ GPS Receiver
A small-scale accuracy test was preformed to determine the accuracy of the
GeoXT under less than optimal conditions. Two tenth-acre (4,356 ft²) plots were
traversed 30 times each using the GeoXT™. Both plots were 66 x 66- foot squares. They
were measured by hand using a logger’s tape. Transects were measured to ensure
accuracy of the area. Plot 1 was set-up in an open field with no land-based obstructions to
skew the GPS signal. Plot 2 was set-up in a post oak stand with a basal area of
approximately 70 ft² and an average height of 35 feet. GPS signal received while
measuring this plot were subject to substantially more obstructions than with Plot 1. The
plot measurements were taken on January 28 and 29, 2005. The weather for both days
36
included overcast skies, high relative humidity and an average temperature of 55º F. The
satellite geometry was adequate for receiving a GPS position fix.
37
CHAPTER IV
RESULTS
Time Study: Paper versus Digital
The data collected for this objective were analyzed using the Mann-Whitney U
test. The results of this test indicate with 95% confidence that the time required to
complete each survey type are significantly different. Table 1 contains the results of the
statistical analysis. The average time required to complete the paper form is 10 minutes
and 37 seconds while the digital form averages 8 minutes and 29 seconds. The digital
survey took an average of 2 minutes and 8 seconds less to complete than did the paper
form. While the time required to complete each form has the potential to vary
significantly between users, with proper training the digital system should prove to be
less cumbersome than the traditional paper method.
Table 1. Means, standard deviations, sample sizes (N) and p-value from Mann-Whitney
U test comparing the time requir ed to complete the paper SPBIS survey form and the
digital SPBIS survey form. The p- value of 0.004 indicates a significant difference at a =
0.05.
Paper Form
Time
Digital Form
Mean ± std dev
N
Mean ± std dev
N
10.622 ± 4.795
54
8.481 ± 4.256
54
Mann-Whitney U
P-value
0.004
38
Infestation Acreage: Estimated versus GPS
The data collected for this objective were analyzed using the Mann-Whitney U
test. The results of this test indicate with 95% confidence that the total estimated acreage
of the spots in this sample group is almost twice the total measured acreage. Table 2
contains the results of the statistical analysis. The average estimated area was 1.0455
acres while the average measured area was 0.5745 acres. This significant difference
should prove the need for a means of measuring acreage.
Table 2. Means, standard deviations, sample sizes (N) and p-value from Mann-Whitney
U test comparing the estimated and measured acreage of 44 southern pine beetle
infestations on the DeSoto National Forest, Chickasawhay District in Mississippi.
The p-value of 0.000 indicates a significant difference at a = 0.05.
Estimated Acreage
Measured Acreage
Mean ± std dev
N
Mean ± std dev
N
Acreage 1.0455 ± 0.2107
44
0.5745 ± 0.5164
44
Mann-Whitney U
P-value
0.000
Accuracy of the Trimble® GeoXT™ GPS Receiver
Table 3 illustrates the accuracy of the GeoXT™ under less than optimal
conditions. Table 3 gives the mean area for each plot under the given conditions. The
relation of these values to this project are found in the next chapter.
39
Table 3. Trimble® GeoXT™ accuracy test under less than optimal conditions.
Actual Area (0.1 acre)
GPS Mean ± std dev
N (sample size)
Plot 1
(Open)
Plot 2
(Under Canopy)
4356 sq ft
4207 sq ft ± 126.35
30
4356 sq ft
4082 sq ft ± 458.63
30
These are the results of the each quantitative field test conducted for the SPBIS
mobile mapping system.
40
CHAPTER V
DISCUSSION
Time Study: Paper vs. Digital
A major concern surrounding the implementation of SPBIS mobile mapping
system was the time required to complete the digital form in relation to the current paper
form. The utility of any tool is reduced if its use is more time consuming than the tool it
is proposed to replace.
The major difference in the comparison of these two survey formats and a typical
time comparison is the additional aspect of data processing after collection. This is where
the digital method becomes more efficient than the paper method. Due to the
cumbersome nature of data entry and negligent data entry practices, the paper survey
forms accumulated and were often forgotten. The digital system allows for the seamless
upload of data. The time saved by not having to manually enter data is one of the major
advantages of using a digital system. The results of the time study show a two- minute
advantage when using the digital system. This value was measured using only those data
collection steps common to both survey types. If the time required to locate a spot, data
collection time and data entry time were considered the total time advantage of the digital
system wo uld be substantially increased. These factors were not included because they
are not easily measured.
In addition to an advantage in operating time, the digital system has several other
advantages. The use of a paper survey form has long been a standard operation for
collecting field data. The obvious problems associated with using paper outdoors include
damage from the elements, physical deterioration enhanced by field activities, and
41
increased chance of the forms being lost. The digital system utilizes the weatherproof
Trimble® GeoXT™ mobile device for data collection. The device stores all records in a
location designated by the user and can only be lost if not saved to the system disk. The
mobile device can be added to a user’s field gear as easily as a hard hat.
Infestation Acreage: Estimated versus GPS
Each year thousands of acres of pine forest across the southern United States are
destroyed by southern pine beetle. Many of the infested acres occur on national forest
land. Each ranger district is responsible for identifying infestations and implementing
measures to control them. In recent years, however, there has been a significant
reduction in SPB populations in the majority of southern states. In 2003 the estimated
mortality due to SPB was 2,403,000 acres. While this is still a significant damage area,
the total was down from13,455,900 acres in 2002. (USDA Forest Service 2004). Figure 8
illustrates the trend of beetle- infested acres 1979 through 2003.
Figure 8. Southwide trend of acreage infested by SPB from 1979 through 2003
42
This trend continued in 2004 with “populations declining dramatically from those
of 2003 throughout the South. Only South Carolina, Tennessee, Alabama and Mississippi
reported substantial activity, and most of that dropped sharply as late summer
approached. Elsewhere, southern pine beetle populations were low to immeasurable”
(USDA Forest Service 2004). Research shows that SPB adhere to somewhat uniform
cycles in terms of population density and outbreak duration. Most outbreaks last a
relatively short time period usually from 2-3 years. This has led to the belief that “the
beetle is cyclical in nature, particularly since major epidemics seem to occur about every
10 years” (Payne 1980). Accurate and comprehensive data collection and storage are
essential to learning more about beetle populations. The need for an improved data
collection system will become more evident as the beetle populations begin to increase.
Federal suppression funds are allotted for each district as needed. While it is
difficult to predict the exact amount of support needed for the next year, each district is
given money based on data collected in the current year. These funds are rarely enough
for districts that are surprised by an epidemic. One factor that goes into determining the
amount of money given to a district is infested acreage. Estimation is the current method
for determining the acreage of a spot. Many of the ground personnel who conduct these
surveys have been doing so for many years and are quite proficient. In these cases the
estimated acreage can be fairly accurate. Despite the work of these veteran employees,
the margin of error with this method of determining acreage is too great. A second
problem lies with the SPBIS database. Past versions of SPBIS rounded acreage values to
the nearest whole acre. Surveyors would often record spot areas in tenths of an acre but
the database would round the value up to 1 acre if the spot were greater than half an acre.
43
If a spot were recorded as being less than half an acre it would be assigned acreage of
zero. This procedure of rounding in whole acre increments causes the total infested
acreage value to become substantially skewed. While this problem has been addressed in
the most recent version of SPBIS all the historical records reflect these errors. The need
for a more accurate method of determining acreage is evident and this mobile mapping
system will remedy this problem.
Navigation Using the Trimble® GeoXT™
One of the most time consuming aspects of ground checking SPB spots is site
location. The predominant method of locating a SPB spot is known as aerial sketch
mapping. Traditional aerial sketch mapping requires the surveyor to mark the spot
location on a paper map in reference to surrounding geographic features such as roads
and waterways. If a spot is marked incorrectly from the air it can be very difficult to
locate the spot on the ground. Increased use of GPS to mark the location of spots from the
air has aided in reducing the time required to find spots on the ground. The GPS
coordinates gathered in the air can be entered into most handheld GPS units for
navigation purposes.
Digital aerial sketch mapping is a new tool being used by Forest Health Protection
for pest surveying. This tool allows surveyors to have a digital representation of the area
they are flying and to mark problem spots directly on the digital map. There is a set of
GPS coordinates associated with each spot marked on the map. The coordinates will be
entered into the GeoXT® handheld device and used to navigate to each spot.
Another issue to consider when using the navigation feature on the Trimble unit is
the projection. Shapefiles are commonly used as layers in a base map package. In order
44
for various shapefiles to be displayed simultaneously they must have the same geographic
projection. A projection is defined as “a method by which the curved surface of the earth
is portrayed on a flat surface” (Kennedy 2001). All files, with the same projection, are
displayed at a scale relative to each other. Therefore if a water feature shapefile is
displayed over a compartment shapefile the water features will appear at a realistic scale
based on the given projection. This is important for data collection, as well. As
mentioned before, the SPBIS survey form has an associated point shapefile that is created
with each new survey. This file must also be projected the same as other layers of the
base map. This ensures that the data are collected and displayed in a realistic manner. In
order to use other data types, such as DOQQs, all files must be projected alike. It is
possible to display shapefiles and raster data simultaneously, but they must be projected
alike. Due to the size of most raster data files, very few can be displayed on the
GeoXT™. While more than one raster image can be displayed at a time, the use of two or
more with different resolutions at a given time is unlikely. The accuracy of the collected
data is dependant on the projection not the scale or resolution of the base map.
The scale of the base map display is also important to consider. If the map scale is
too large the point may seem closer to your position than it actually is. The “zoom” tool
allows the user to manipulate the map to achieve the desired scale. Another feature
available on the GeoXT™ that will aid in navigation is the addition of a waypoint to the
map. A waypoint can be placed directly over the destination point. Once this has been
done the compass on the unit will display the direction you are traveling in relation to the
point and the distance you are from the point. This feature is particularly useful when you
are in an unfamiliar area or if visibility is reduced.
45
The layers chosen for the base map are also very important to the utility of the
navigation feature. La yers such as roads, water features, and stand boundaries are
invaluable if the user is not familiar with the area. If the user is familiar with the area
labeled roads and water features aid in determining bearings. While GPS navigation is a
very useful tool it is important to have another means of navigation while in the field, as
GPS is not available in every situation.
Problems and Solutions
Problems are inevitable with any new tool. This mobile mapping system is no
exception. Many of the problems experienced during the field-testing of this tool were the
product of inexperience and lack of knowledge about the equipment. The majority of the
problems had very simple, easy to implement solutions. As with any new technology, a
certain amount of training is required to use the equipment proficiently. While most
devices and software packages come with ample documentation for proper use of the
product, the best way to become familiar with a product is to learn by trial and error. The
remainder of this section deals with the problems experienced while field-testing the
SPBIS mobile mapping system and the solutions to these problems.
The first problem experienced during testing was with the Trimble® GeoXT™. A
faulty connection was formed while attempting to connect the unit to the charging cradle
resulting in the unit “freezing- up”. This mistake led to the discovery of several other
problems. The unit required a system re-boot. With the Trimble® GeoXT™ there are two
ways to re-boot the system, a soft and a hard re-boot. The difference between the two reboots is the level at which the unit is restarted. A soft re-boot, in effect, restarts Windows
CE. This is usually sufficient to fix the problem. It the unit suffers a major software or
46
hardware conflict a hard re-boot is required. To perform a soft re-boot the power button is
held down for 5 seconds. Holding the power button down for 15 seconds results in a hard
re-boot.
An additional problem discovered when the unit was re-booted was the loss of
data. When the unit was restarted all data that was not saved to the system disk was
erased. To remedy this problem all data must be saved in the disk folder on the unit. It is
also advisable to have a backup copy of base maps and any other required data on a lap
top computer so it can be reloaded.
One of the major limitations to using GPS is the signal availability. As mentioned
in Chapter 1, a 24-satellite constellation makes up the global positioning sys tem. These
satellites are each in a unique orbital pattern, which means they are constantly changing
position throughout the day. This constant position change causes fluctuations in signal
availability. Due to signal availability variations on a daily basis, many GPS users consult
the almanac available on the unit to determine the best time to obtain a signal. The
almanac shows the user the times of peak signal availability. The GPS receiver within
ArcPad® has a feature called Satellite Skyplot. This feature displays all satellites
overhead at a given time. The various satellites are delineated by color based on their
current operational status. Satellites displayed in black are available and being used to
determine a position. Satellites displayed in blue indicate the satellite is available but not
currently being used. Satellites displayed in red indicate the satellite is not available. This
color-code allows the user to determine the likelihood of obtaining a “fix” in a timely
manner. Likewise the ArcPad® GPS receiver features a signal chart which displays the
relative signal strength from each satellite in the form of a horizontal bar chart. Each of
47
these features aid in determining the optimal time for receiving a GPS signal. Another
element of a GPS signal that has to be considered is dilution of precision (DOP). DOP is
defined as “an indicator of satellite geometry for a constellation of satellites used to
determine a position. Positions with a higher DOP value generally constitute poorer
measurement results than those with lower DOP. Factors determining the total geometric
dilution of precision (GDOP) for a set of satellites include PDOP (Positional DOP),
HDOP (Horizontal DOP), VDOP (Vertical DOP), and TDOP (Time DOP)” (Kennedy
2001). For this project the PDOP value is the main concern. By increasing this value the
GPS signal becomes more readily available, but at the expense of accuracy.
Depending on the amount time allotted for collecting field data, it may not be
possible to wait until the GPS signal is at its strongest. This was the case with fieldtesting the SPBIS mobile mapping system. A major field-testing objective was to survey
as many spots as possible for statistical analysis and to increase chances of identifying
problems with the system.
When testing began the GPS receiver was activated at each spot, the survey was
conducted and the receiver was deactivated. This was done, initially, to conserve battery
life. When doing this it became increasing harder to obtain a GPS fix due the constantly
changing satellite geometry. After several frustrating hours of waiting for a signal, it was
decided to leave the GPS receiver activated throughout the entire workday. This easily
solved the problem. Even though the signal was not constant the entire day a fix was
much easier to obtain when the receiver maintained communication with at least a few
satellites. Leaving the GPS receiver activated during the entire day did not affect the life
of the battery any more than if the receiver was turned on and off. The unit can also be
48
configured to conserve power by going dormant after a set period of inactivity. In order
to be able to run the unit continuously for 10 hours the battery must be completely
charged on a daily basis.
Another problem that arose was with the GPS receiver. When using a unit for the
first time the GPS receiver within ArcPad® would not activate. It was determined that the
COM port settings on the GeoXT™ were not properly set. The Trimble® GeoXT™ has a
total of four COM ports to which various applications are assigned. COM 1 is the
standard serial port for the connection of all external devices. The remaining three COM
ports support different communication protocols. COM 2 outputs NMEA-0183 messages.
The National Maritime Electronics Association or (NMEA) has “created a standard that
defines an electrical interface and data protocol for communications between marine
instrumentation that has been adopted as the standard by the GPS industry. The NMEA0183 standard “defines electrical signal requirements, data transmission protocol, timing
and specific sentence formats for a 4800-baud serial data bus” (Kennedy 2001). This is
the protocol utilized by the GPS embedded in ArcPad®. Therefore, if COM 2 is not
selected the GPS receiver within ArcPad® will not activate. COM 3 outputs and receives
Trimble Standard Interface Protocol (TSIP) messages. This protocol is utilized
exclusively by Trimble GPS applications with the exception of a few others. This is the
default COM port on the Trimble® GeoXT™ and must be changed to operate the GPS
receiver within ArcPad®. COM 4 is used to receive real- time correction messages
(GeoExplorer® CE Getting Started Guide 2002).
Another potential problem with this system deals with locating and manipulating
map layers on the unit. In several instances users asked where to locate the maps.
49
Navigating to a file within ArcPad® is essentially the same as navigating to a file on a
desktop computer. Locating a file presents a temporary challenge if the user did not load
the map layers or if the user is unfamiliar with ArcPad®. This problem will be addressed
in the User’s Guide and file navigation will be incorporated into several practice
exercises conducted during the training course.
Each data layer has several files associated with it that ensures that they function
properly within a GIS. There is a core group of required files and several other secondary
files that may be associated with a single layer. Shapefiles are actually a collection of at
least four other file types. The four essential files that make up a shapefile are a spatial
data format file, an index look-up file, a spatial index file, and a projection file. Every
shapefile must have these files or it will not function properly in a GIS. A shapefile might
also be associated with a variety of other files that have a specific function. A shapefile
attribute table file and a DBF file both serve as information storage files. One file
essential to the use of a data layer in ArcPad® is an application library file. This file is
required to enable the edit option of a data layer. A data layer must be able to be edited in
order to add waypoints, to change the appearance, and to add data such as points created
when a SPB survey is added to a map. Another file that is created when a map is created
in a desktop GIS environment and exported to ArcPad® is the ArcPad® map file. This
file can be created in two ways. The most obvious way is when a map project that is built
in ArcPad is saved as a whole in ArcPad®. The second method is by using the ArcPad®
extension in ArcGIS® or ArcView® on a desktop computer.
Shapefiles were not the only data type used for this project. Several raster data
formats were also used. Raster data files are also composed of a collection of other files
50
similar to shapefiles. When working with raster data it is important to make sure the data
has a world file. A world file is defined as “a text file containing the coordinate and
scaling information for converting the coordinates in an image (which usually start at
[0,0] and extend to the image's size in pixels) to map coordinates such as latitude–
longitude or State Plane” (Kennedy 2001). A world file is needed to lay vector data over
an image of the same geographic area. No matter what data type is being used, it is
important to have all required files to ensure the data is displayed properly in the GIS.
These potential problems are easily remedied and can be avoided with proper
training. This is not a comprehensive description of all the possible problems with this
mobile mapping system. Additional problems will be dealt with as they arise.
Accuracy of the Trimble® GeoXT™ GPS Receiver
While the results of this test show a significant variation between the known area
and the area each test plot, the accuracy of the unit is still sufficient for this application.
As stated in the results, this accuracy test was conducted in less than optimal conditions
and serves to illustrate the lower limits of the unit’s accuracy. Field conditions are rarely
the same on a day-to-day basis, and urgency to complete surveys will take precedence
over less than optimal conditions. The intent of this exercise was to illustrate the possible
range of data accuracy and precision based on field conditions. Also, many of the
accuracy errors that are overlooked by the GPS unit can be corrected with desktop
position correction software such as Trimble® GPS Pathfinder Office®. The utility of
this unit for navigation purposes has been proven. While there is some discrepancy in
accuracy, this unit is sufficient to locate and record the position of a SPB spot.
51
One question that was not addressed during field-testing was the effect of
elevation on accuracy of the collected data. This project was developed for and will be
used primarily on flat land districts, though there are several areas in the southern region
that have a variety of changes in elevation.
Objects such as trees, buildings and mountains can obstruct GPS signals.
Although SPB infestations on National Forest land, while varying slightly in size, host
species, and geographic location, are all surveyed in a similar manner, varying
geographic features can have an effect on GPS accuracy. To address these potential errors
many of the latest GPS units, including the Trimble® GeoXT™, are equipped with realtime position correction technology and are Wide Area Augmentation System (WAAS)
enabled.
Real-time corrections are transmitted to the hand-held unit from a ground-based
GPS receiver. The corrections from the ground-based unit are applied to each position as
it is recorded (Trimble Customer FAQ 2004). WAAS operates in a similar fashion. It is a
system of satellites and 25 ground stations that were originally developed by the Federal
Aviation Administration (FAA) to provide differential position correction for aircraft.
Both of these systems can be used to gain better position accuracy.
The GeoXT™ is also equipped with EVEREST multipath rejection technology.
Multipath occurs when a GPS signal is reflected off of an object before being recorded by
the GPS receiver. This technology is designed to reject the random errors caused by
multipath (Trimble Customer FAQ 2004). While most multipath errors are rejected by
the EVEREST system some are missed introducing a slight degree of error.
52
The Trimble® GeoXT™ is advertised as having “sub- meter accuracy”. This can be
achieved under optimal conditions such as clear skies, relatively few obstructions, and
favorable satellite geometry. However, optimal conditions are rarely available. It is often
necessary to conduct surveys under overcast skies, in dense stands, and at times when
fewer satellites are overhead. Each of these factors has an effect on the accuracy of the
collected data.
The manufacturer, Trimble, has tested the GeoXT™ for accuracy. It can be
assumed that the advertised accuracy can be achieved under optimum conditions. It was
not the purpose of this project to determine the accuracy of the unit, but to test its utility
as a survey tool. The Trimble® GeoXT™ proved to be sufficient for this application.
VB Script and Custom Form Development
Visual Basic is a programming language developed by Microsoft based on an
object-oriented form of the BASIC language and intended for application development.
VBScript is an extension of the Visual Basic language (Microsoft VBScript User’s Guide
2004). ArcPad® Application Builder allows the development of custom applications that
“match functionality and usability with the skill level and processes of field-workers.”
Mobile GIS applications built within Application Builder ensure accurate data collection
and streamlined workflow (ESRI® ArcPad® White Paper 2004).
53
CHAPTER VI
CONCLUSIONS
Future Applications
As seen with this project and others described within this thesis, mobile mapping
technology has many potential applications. In the field of forest entomology there are an
abundance of insect pests that are surveyed and monitored on a continual basis. Many of
these pests rival the Southern Pine Beetle in terms of time and resources allocated for
study.
One such pest is the gypsy moth, Lymantria dispar Linnaeus. The gypsy moth is
serious pest of hardwood trees in the eastern United States. Currently there is a joint
effort between Forest Health Protection of the USDA Forest Service and various state
and local agencies to control the spread of and minimize losses to gypsy moth. These
pests are surveyed in a manner similar to that of southern pine beetle. The data collected
is unique to this pest but many of the methods used in the field are the same. This fact
makes gypsy moth surveying a prime candidate for a mobile mapping system similar to
the one described by this thesis.
A joint project between the Texas Department of Agriculture and the Knowledge
Engineering Laboratory at Texas A&M University is being conducted to survey gypsy
moth in the Dallas, Texas area. A custom form containing the required data fields for
gypsy moth surveying has been developed and deployed on a hand-held mobile device.
Some of the other pests that are actively surveyed are indigenous species such as
the mountain pine beetle, western pine beetle, and red oak borer and exotic species such
as hemlock woolly adelgid, emerald ash borer, and the Asian longhorned beetle. These
54
insects represent only a small portion of the insect pests that are monitored in this
country.
Various forest pathogens also represent opportunities for the development mobile
mapping applications. Similar to forest insect pests, pathogens problem are often
encountered in the forest. Diseases such as oak wilt and sudden oak death have become
major problems in recent years. As a result of increased possibility of spread, wide ranges
of resources are being utilized to combat these problems. As with insects, surveying plays
an integral role in the study and prevention of diseases. Unique mobile mapping
applications can be developed to improve surveying efficiency.
Other governmental entities such as the Animal and Plant Health Inspection
Service (APHIS), who are responsible, in part, for monitoring all exotic pests in the
United States, could find custom mobile mapping systems very useful in their activities.
Digital aerial sketch mapping, which has been mentioned several times
throughout this thesis, is another technology that will improve the SPBIS data collection
process. When used in conjunction with the SPBIS mobile mapping system, digital aerial
sketch mapping serves to further improve the efficiency of the system. The ability to
collect GPS ground locations and spot polygons in a format that is easily transferred to
the mobile device is invaluable to the utility of this system. Another aspect of digital
aerial sketch mapping that complements the mobile mapping system is extensive
distribution at the district level. With the sketch mapping system in place on each district,
the integration of the mobile mapping system will be much easier. Both systems
incorporate GIS and GPS technologies making training on one system complement
training on the other.
55
ArcIMS® is a software package that allows dynamic maps and GIS data sets to be
published on the Internet. It provides “a highly scaleable framework for GIS Web
Publishing” (ESRI ArcIMS® Brochure 2005). With this software, geospatial information
can be shared worldwide via the Internet. Currently, an ArcIMS® application is being
developed by the Knowledge Engineering Laboratory at Texas A&M University to
publish dynamic maps created from data contained in the SPBIS database. This
application will give USDA Forest Service employees in the Southern Region access to
real-time SPB data, which can be used to make informed management decisions.
Summary
The intent of this thesis project was to develop an automated data collection
process using mobile mapping technology. This system will be used to increase the utility
of the SPBIS database as a decision making tool.
The shortcomings of the SPBIS database are discussed in detail throughout this
thesis. Data entry has always been the crux of the problem. With the successful
implementation of an automated data collection process and a seamless data upload
application, data entry will no longer be a problem.
Training will be a key element in the success of this system. The technologies
being implemented have a history of not being user- friendly. It has been a goal of this
project, from the onset, to design a system with the user in mind. While some basic
knowledge and training are required, the implementation of this system at a Ranger
District level should go smoothly.
Within the Forest Health Protection unit of the USDA Forest Service, real- time
data has not often been available to managers in decision- making roles. Decisions are
56
often made based on delayed data or historical trends. With the proper adjustments, the
SPBIS database has the potential to remedy this problem.
Once the SPBIS mobile mapping system has been implemented and data becomes
available, the true advantage of this system will be seen. It will then be possible for each
district to better manage its resources and reduce losses due to SPB attacks.
Currently, there are very few operational mobile mapping systems specifically
designed for data collection. The technology exists to facilitate automated data collection
in any field of study. This thesis will serve as a template for others to use when designing
a custom mobile mapping system.
The major advantage of this system is having an automatic data upload
application connected directly to the SPBIS database. Integration of the new system will
be done beginning with districts that have the most severe outbreaks. This system will
completely replace the current data collection process.
The utility of this system will become apparent when field personnel are able to
place the mobile device into its cradle and upload field data on the unit in a matter of
seconds. The need for manual data entry will be eliminated. This single advance in the
data collection process will make real-time data available for operational management.
57
REFERENCES
Adnan, M., M.N.A. Azaruddin, W.Y.W. Zahiri, and H. K. Aziz. 2001. Geographical
information and global positioning system for urban tree mapping and
management in Malaysia. Intl. Conf. On Forestry and Forest Products Research.
CFFPR 2001: 405-410.
Bettinger, P., and J. Sessions. 2003. Spatial forest planning: to adopt or not to adopt?
Journal of Forestry. 101(2): 24-29.
Clarke, S., and R. Billings. 2003. Analysis of the southern pine beetle suppression
program on the national forests in Texas in the 1990s. So. J. of App. For. 27(2):
122-129.
ESRI® ArcIMS® Product Brochure. 2005. Available online at http://www.esri.com/
library/brochures/pdfs/arcims_bro.pdf. Accessed January 8, 2005.
ESRI® ArcPad® White Paper. 2004. Available online at http://www.esri.com/library/
whitepapers/pdfs/arcpad.pdf. Accessed October 12, 2004.
Forest Health Technology Enterprise Team. 2002. The southern pine beetle
information system version 3.0 installation instructions. Forest Health Technology
Enterprise Team, Fort Collins, CO.
Harrington, A., and G. Lauer. 2004. Mobile GIS: using your enterprise GIS in the
field. Available online at http://www.gisdevelopment.net/technology/
mobilemapping/ techmp007pf.htm. Accessed on September 9, 2004.
Kennedy, K.H. 2001. ESRI press dictionary of GIS terminology. ESRI Press. Redlands,
CA.
Microsoft Corporation©. 2004. VBScript user’s guide. Microsoft Corporation©,
Redmond, WA.
Mundel, M. E. 1947. Systematic motion and time study. Prentice-Hall, New York, NY.
NAVSTAR Global Positioning System Joint Program Office. 2003. Control Segment
Program Office Available online at http://gps.losangeles.af.mil/control/. Accessed
January 8, 2005.
Payne, T. L. 1980. Life history and habits, pp. 7-28. In R. C. Thatcher, J. L. Searcy,
J. E. Coster, and G. D. Hertel [eds.] The Southern Pine Beetle. USDA Forest
Service Technical Bulletin 1631.
58
Price, T. S., C. Doggett, J. M. Pye, and T. P. Holmes. 1992. A history of southern
pine beetle outbreaks in the southeastern United States. The Georgia Forestry
Commission, Macon, GA.
Rasher, M. 2001. The use of GPS and mobile mapping for decision-based precision
agriculture. Available online at http://www.gisdevelopment.net/application/
agriculture/overview/agrio0011pf.htm. Accessed on September 9, 2004.
Srinivasan, R. 2003. FRSC 651: Geographic information systems for resource
Management. Lecture notes Fall 2003. Department of Forest Science. Texas
A&M University, College Station, TX.
Trimble Navigation Ltd.©. 2004. GeoExplorer® CE series: getting started guide.
Trimble Navigation Ltd.©, Sunnyvale, CA.
Trimble Navigation Ltd.©. 2004. GeoXT™ frequently asked questions. Trimble
Navigation Ltd.©, Sunnyvale, CA.
Trimble Navigation Ltd.©. 2004. GeoXT™ product datasheet and specifications.
Trimble Navigation Ltd.©, Sunnyvale, CA.
USDA Forest Service. 2004. Forest insect and disease conditions in the United States,
2004. Forest Pest Management, Washington, DC.
United States Naval Observatory. 2005. The current GPS constellation. Available
online at http://tycho.usno.navy.mil/gpscurr.html. Accessed January 8, 2005.
Wadhwani, A. 2004. Recent advances in mobile GPS/GIS mapping technology.
Available online at http://www.gisdevelopment.net/technology/mobilemapping/
techmp005pf.htm. Accessed on September 9, 2004.
Wiley, S. and R.C. Weih. 1997. Integrating GIS and remote sensing with ecosystem
research. J. of the Arkansas Academy of Science. 51: 188-192.
Xiao, B., and K. Zhang. 2002. Handheld GPS and mobile mapping. Cartography. 31(1):
99-108.
59
APPENDIX A
SURVEY FORM CODE IN VB SCRIPT
60
The following is the VBScript code for the SPBIS data collection form to be used in
ArcPad®.
Option Explicit
Dim objEF
Dim objPgOneCtrls
Dim objPgThreeCtrls
Dim objPgFiveCtrls
Dim objPgSixCtrls
Dim objPgSevenCtrls
Dim strDistCode
Dim strForestCode
Dim strNorthLat
Dim strWestLong
Dim strSpot
Dim strHbo
Dim strBreakout
Dim strSurvey
Dim strSpotFlagTemp
Dim strHboFlagTemp
Dim strFlag
'Initialization Routines
'----------------------Sub InitializeForm
Set objEF = ThisEvent.Object
Set objPgOneCtrls = objEF.Pages("pg1").Controls
Set objPgThreeCtrls = objEF.Pages("pg3").Controls
Set objPgFiveCtrls = objEF.Pages("pg5").Controls
Set objPgSixCtrls = objEF.Pages("pg6").Controls
Set objPgSevenCtrls = objEF.Pages("pg7").Controls
objPgSixCtrls("txtInfTrees").Enabled = False
If objEF.Mode = 3 Then
objPgOneCtrls("txtRegion").Value = "08"
objPgOneCtrls("txtRegion").Enabled = False
objPgOneCtrls("cboForest").ListIndex = -1
objPgOneCtrls("cboSpecies").ListIndex = -1
objPgOneCtrls("txtDistCode").Enabled = False
objPgOneCtrls("cboHboName").Enabled = False
objPgThreeCtrls("cboWild").ListIndex = -1
objPgThreeCtrls("cboWildCode").ListIndex = -1
objPgFiveCtrls("cboSurvType").ListIndex = -1
'
objPgFiveCtrls("dtpSurvDate").Value = Now
objPgFiveCtrls("cboSuggTrtpln").ListIndex = -1
objPgFiveCtrls("cboLogAccess").ListIndex = -1
objPgSixCtrls("cboPulpSaw").ListIndex = -1
objPgSixCtrls("cboGreenInf").ListIndex = -1
Else
61
Dim test
objPgOneCtrls("rdbAddNewSpot").Enabled = False
objPgOneCtrls("txtRegion").Enabled = False
objPgOneCtrls("cboForest").Enabled = False
objPgOneCtrls("txtDistCode").Enabled = False
objPgOneCtrls("cboDistrict").Enabled = False
objPgOneCtrls("txtSpotNum").Enabled = False
objPgOneCtrls("txtHboName").Enabled = False
objPgOneCtrls("cboHboName").SetFocus
Call LoadHboList("spb_survey_backup.dbf")
End If
End Sub
'|||||||||||||||||||||||||||||||||||||||||||||||||||||||||||||||||||||||||||||||||||||||||||||||||||
'Application Functi ons
'--------------------Sub LoadDependantList(strTableName)
Dim objRS
Dim strFilter
Dim cboFilter
Dim objControl
If "" & strTableName = "" Then
Exit Sub
End If
Set cboFilter = ThisEvent.Object
strFilter = cboFilter.Value
Set objRS = Application.CreateAppObject("recordset")
Set objControl = objPgOneCtrls("cboDistrict")
If instr(strTableName, "\")=0 Then
strTableName = LayerPath & strTableName
End If
On Error Resume Next
err.clear
objRS.open(strTableName)
If err.number<>0 Then
msgbox "Cannot open Table " & strTableName
Set objRS=Nothing
Exit Sub
End If
objControl.AddItem "",""
objControl.Clear
objRS.MoveFirst
While Not objRS.EOF
If objRS.fields(1) = strFilter Then
objControl.AddItem objRS.Fields(2), objRS.fields(3)
End If
62
objRS.MoveNext
Wend
objRS.close
Set objRS = Nothing
Set cboFilter = Nothing
Set objControl = Nothing
End Sub
'--------------------------------------------------------------------------------------Sub LoadHboList(strTableName)
Dim objRS
Dim strFilter, strRegion, strForest, strDistrict
Dim objControl
If "" & strTableName = "" Then
Exit Sub
End If
strFilter = CInt(objPgOneCtrls("txtSpotNum").Value)
strRegion = objPgOneCtrls("txtRegion").Value
strForest = objPgOneCtrls("cboForest").Value
strDistrict = objPgOneCtrls("txtDistCode").Value
Set objRS = Application.CreateAppObject("recordset")
Set objControl = objPgOneCtrls("cboHboName")
If instr(strTableName, "\")=0 Then
strTableName = LayerPath & strTableName
End If
On Error Resume Next
err.clear
objRS.open(strTableName)
If err.number<>0 Then
msgbox "Cannot open Table " & strTableName
Set objRS=Nothing
Exit Sub
End If
objControl.AddItem "",""
objControl.Clear
objRS.MoveFirst
While Not (objRS.EOF)
If (objRS.Fields(4).Value = strForest) And (objRS.Fields(5).Value = strDistrict) And (objRS.fields(2).Value =
strFilter) Then
objControl.AddItem objRS.Fields("HBO_NAME").Value, objRS.fields("HBO_NAME").Value
End If
objRS.MoveNext
Wend
objRS.close
Set objRS = Nothing
63
Set objControl = Nothing
End Sub
'----------------------------------------------------------------------Sub StoreHboName
Dim strSearch, objControl
Set objControl = ThisEvent.Object
strSearch = objControl.Value
objPgOneCtrls("txtHboName").Value = strSearch
Set objControl = Nothing
End Sub
'--------------------------------------------------------------------Function LayerPath
Dim objLyr
Dim strPath
Set objLyr = application.map.SelectionLayer
strPath = objLyr.FilePath
strPath = left(strPath,InstrRev(strPath,"\",-1,1))
LayerPath = strPath
Set objLyr = Nothing
End Function
'---------------------------------------------------------------------Sub StoreDistrictCode(strTableName)
Dim strSearch, objControl
Set objControl = ThisEvent.Object
strSearch = objControl.Value
'strDistCode = ReturnDistCode(strTableName, strSearch)
objPgOneCtrls("txtDistCode").Value = strSearch
Set objControl = Nothing
End Sub
'-----------------------------------------------------------------------Function ReturnDistCode (strTableName, strSearch)
Dim objRS
Dim strForestCode
Set objRS = Application.CreateAppObject("recordset")
strForestCode = objPgOneCtrls("cboForest").Value
If instr(strTableName, "\") = 0 Then
64
strTableName = LayerPath & strTableName
End If
objRS.Open(strTableName)
If err.number<>0 Then
msgbox "Cannot open Table " & strTableName
Set objRS = Nothing
Exit Function
End If
objRS.MoveFirst
While Not objRS.EOF
If (objRS.Fields(1) = strForestCode And objRS.fields(3) = strSearch) Then
ReturnDistCode = objRS.Fields(2)
Exit Function
End If
objRS.MoveNext
Wend
objRS.Close
strForestCode = ""
Set objRS = Nothing
End Function
'--------------------------------------------------------------------Function ReturnDistrictName(strTableName, strSearch)
Dim objRS
Dim strForestCode
Set objRS = Application.CreateAppObject("recordset")
strForestCode = objPgOneCtrls("cboForest").Value
If instr(strTableName, "\") = 0 Then
strTableName = LayerPath & strTableName
End If
objRS.Open(strTableName)
If err.number<>0 Then
msgbox "Cannot open Table " & strTableName
Set objRS = Nothing
Exit Function
End If
objRS.MoveFirst
While Not objRS.EOF
If (objRS.Fields(1) = strForestCode And objRS.fields(2) = strSearch) Then
ReturnDistrictName = objRS.Fields(3)
Exit Function
End If
objRS.MoveNext
Wend
objRS.Close
strForestCode = ""
Set objRS = Nothing
End Function
65
'--------------------------------------------------------------------Sub StoreForestCode(strTableName)
Dim strSearch, objControl
Set objControl = ThisEvent.Object
strSearch = objControl.Value
objPgOneCtrls("txtForestCode").Value = strSearch
Set objControl = Nothing
End Sub
'----------------------------------------------------------------------'Sub UpdateHBO
'
'Dim strHbo
'Dim strBreakout
'Dim strHBO
'strHbo = objPgOneCtrls("txtHead").Value
'strBreakout = objPgOneCtrls("txtBrk").Value
'strHBO = strHbo & strBreakout
'objPgOneCtrls("txtHboName").Value = strHBO
'End Sub
'---------------------------------------------------------------------Sub UpdateFlags
Dim strResponse
strResponse =
MsgBox("Would you like to send this data into SPBIS?", vbYesNo)
If strResponse = vbYes Then
Call CreateDbfCopy
End If
End Sub
'---------------------------------------------------------------------Sub CreateDbfCopy
Dim objRS
Dim strFileName
Dim strSurvEntered
Dim strTreatEntered
Dim strSmcEntered
strSurvEntered = "no"
strTreatEntered = "no"
strSmcEntered = "no"
strFileName = "spb_survey_backup.dbf"
66
Set objRS = Application.CreateAppObject("recordset")
If instr(strFileName, "\") = 0 Then
strFileName = LayerPath & strFileName
End If
objRS.Open strFileName, 2
If err.number<>0 Then
msgbox "Cannot open Table " & strFileName
Set objRS = Nothing
Exit Sub
End If
Dim intMax, intCurrVal
objRS.MoveFirst
If objRS.recordCount <> 0 Then
intMax = CInt(objRS.Fields(1).Value)
While Not objRS.EOF
intCurrVal = CInt(objRS.Fields(1).Value)
If (intCurrVal > intMax) Then
intMax = intCurrVal
End If
objRS.MoveNext
Wend
intMax = intMax + 1
Else
intMax = 1
End If
If ((objRS.recordcount = 0) And (strSpot = "N")) Then
objRS.AddNew
objRS.Fields(1).Value = 1
objRS.Fields(2).Value = objPgOneCtrls("txtSpotNum").Value
objRS.Fields(3).Value = objPgOneCtrls("txtRegion").Value
objRS.Fields(4).Value = objPgOneCtrls("cboForest").Value
objRS.Fields(5).Value = objPgOneCtrls("txtDistCode").Value
objRS.Fields(7).Value = objPgOneCtrls("cboSpecies").Value
objRS.Fields(8).Value = objPgOneCtrls("txtHboName").Value
objRS.Fields(9).Value = objPgOneCtrls("txtParentHbo").Value
objRS.Fields(10).Value = objPgThreeCtrls("txtComp").Value
objRS.Fields(11).Value = objPgThreeCtrls("txtSt").Value
objRS.Fields(13).Value = objPgThreeCtrls("txtEstimatedAcres").Value
objRS.Fields(14).Value = objPgThreeCtrls("cboPriority").Value
objRS.Fields(16).Value = objPgThreeCtrls("txtPBA").Value
objRS.Fields(17).Value = objPgThreeCtrls("txtTBA").Value
objRS.Fields(18).Value = objPgThreeCtrls("cboWild").Value
'objRS.Fields(19).Value = objPgThreeCtrls("cboWildCode").Value
'objRS.Fields(20).Value = objPgThreeCtrls("txtWildName").Value
objRS.Fields(21).Value = objPgThreeCtrls("txtSpotFndBy").Value
objRS.Fields("SPHEROID").Value = "WGS84"
objRS.Fields(65).Value = "N"
objRS.Fields(67).Value = "N"
If strSurvey = "N" Then
objRS.Fields(23).Value = objPgFiveCtrls("cboSurvType").Value
objRS.Fields(24).Value = objPgFiveCtrls("dtpSurvDate").Value
objRS.Fields(25).Value = objPgFiveCtrls("dtpGrdChkDate").Value
objRS.Fields(26).Value = objPgFiveCtrls("cboSuggTrtPln").Value
67
objRS.Fields(27).Value = objPgFiveCtrls("cboFlgClr").Value
objRS.Fields(28).Value = objPgFiveCtrls("cboLogAccess").Value
objRS.Fields(29).Value = objPgSixCtrls("cboPulpSaw").Value
objRS.Fields(30).Value = objPgSixCtrls("cboGreenInf").Value
objRS.Fields(31).Value = objPgSixCtrls("txtInfTrees").Value
objRS.Fields(32).Value = objPgSixCtrls("txtNumFading").Value
objRS.Fields(33).Value = objPgSixCtrls("txtNumGreen").Value
objRS.Fields(34).Value = objPgSixCtrls("txtNumVac").Value
objRS.Fields(38).Value = objPgSevenCtrls("txtComments3").Value
objRS.Fields(69).Value = "N"
strSurvEntered = "yes"
Else
objRS.Fields(69).Value = "B"
End If
End If
If ((objRS.recordcount <> 0) And (strSpot = "N")) Then
objRS.MoveLast
objRS.AddNew
objRS.Fields(1).Value = intMax
objRS.Fields(2).Value = objPgOneCtrls("txtSpotNum").Value
objRS.Fields(3).Value = objPgOneCtrls("txtRegion").Value
objRS.Fields(4).Value = objPgOneCtrls("cboForest").Value
objRS.Fields(5).Value = objPgOneCtrls("txtDistCode").Value
objRS.Fields(7).Value = objPgOneCtrls("cboSpecies").Value
objRS.Fields(8).Value = objPgOneCtrls("txtHboName").Value
objRS.Fields(9).Value = objPgOneCtrls("txtParentHbo").Value
objRS.Fields(10).Value = objPgThreeCtrls("txtComp").Value
objRS.Fields(11).Value = objPgThreeCtrls("txtSt").Value
objRS.Fields(13).Value = objPgThreeCtrls("txtEstimatedAcres").Value
objRS.Fields(14).Value = objPgThreeCtrls("cboPriority").Value
objRS.Fields(16).Value = objPgThreeCtrls("txtPBA").Value
objRS.Fields(17).Value = objPgThreeCtrls("txtTBA").Value
objRS.Fields(18).Value = objPgThreeCtrls("cboWild").Value
objRS.Fields(19).Value = objPgThreeCtrls("cboWildCode").Value
'objRS.Fields(20).Value = objPgThreeCtrls("txtWildName").Value
objRS.Fields(21).Value = objPgThreeCtrls("txtSpotFndBy").Value
objRS.Fields("SPHEROID").Value = "WGS84"
objRS.Fields(65).Value = "N"
objRS.Fields(67).Value = "N"
If strSurvey = "N" Then
objRS.Fields(23).Value = objPgFiveCtrls("cboSurvType").Value
objRS.Fields(24).Value = objPgFiveCtrls("dtpSurvDate").Value
objRS.Fields(25).Value = objPgFiveCtrls("dtpGrdChkDate").Value
objRS.Fields(26).Value = objPgFiveCtrls("cboSuggTrtPln").Value
objRS.Fields(27).Value = objPgFiveCtrls("cboFlgClr").Value
objRS.Fields(28).Value = objPgFiveCtrls("cboLogAccess").Value
objRS.Fields(29).Value = objPgSixCtrls("cboPulpSaw").Value
objRS.Fields(30).Value = objPgSixCtrls("cboGreenInf").Value
objRS.Fields(31).Value = objPgSixCtrls("txtInfTrees").Value
objRS.Fields(32).Value = objPgSixCtrls("txtNumFading").Value
objRS.Fields(33).Value = objPgSixCtrls("txtNumGreen").Value
objRS.Fields(34).Value = objPgSixCtrls("txtNumVac").Value
objRS.Fields(38).Value = objPgSevenCtrls("txtComments3").Value
objRS.Fields(69).Value = "N"
68
strSurvEntered = "yes"
Else
objRS.Fields(69).Value = "B"
End If
End If
If ((strSpot <> "N") And (strHbo = "N")) Then
objRS.MoveFirst
While Not objRS.EOF
If ((objRS.Fields(2).Value = objPgOneCtrls("txtSpotNum").Value) And (objRS.Fields(4).Value =
objPgOneCtrls("cboForest").Value) And (objRS.Fields(5).Value = objPgOneCtrls("txtDistCode").Value)) Then
strSpotFlagTemp = objRS.Fields(65).Value
strNorthLat = objRS.Fields("N_LAT_DD").Value
strWestLong = objRS.Fields("W_LON_DD").Value
End If
objRS.MoveNext
Wend
objRS.MoveLast
objRS.AddNew
objRS.Fields(1).Value = intMax
objRS.Fields(2).Value = objPgOneCtrls("txtSpotNum").Value
objRS.Fields(3).Value = objPgOneCtrls("txtRegion").Value
objRS.Fields(4).Value = objPgOneCtrls("cboForest").Value
objRS.Fields(5).Value = objPgOneCtrls("txtDistCode").Value
objRS.Fields(7).Value = objPgOneCtrls("cboSpecies").Value
objRS.Fields(8).Value = objPgOneCtrls("txtHboName").Value
objRS.Fields(9).Value = objPgOneCtrls("txtParentHbo").Value
objRS.Fields(10).Value = objPgThreeCtrls("txtComp").Value
objRS.Fields(11).Value = objPgThreeCtrls("txtSt").Value
objRS.Fields(13).Value = objPgThreeCtrls("txtEstimatedAcres").Value
objRS.Fields(14).Value = objPgThreeCtrls("cboPriority").Value
objRS.Fields(16).Value = objPgThreeCtrls("txtPBA").Value
objRS.Fields(17).Value = objPgThreeCtrls("txtTBA").Value
objRS.Fields(18).Value = objPgThreeCtrls("cboWild").Value
objRS.Fields(19).Value = objPgThreeCtrls("cboWildCode").Value
'objRS.Fields(20).Value = objPgThreeCtrls("txtWildName").Value
objRS.Fields(21).Value = objPgThreeCtrls("txtSpotFndBy").Value
'objRS.Fields("N_LAT_DD").Value = strNorthLat
'objRS.Fields("W_LON_DD").Value = strWestLong
objRS.Fields("SPHEROID").Value = "WGS84"
objRS.Fields(65).Value = strSpotFlagTemp
objRS.Fields(67).Value = "N"
If strSurvey = "N" Then
objRS.Fields(23).Value = objPgFiveCtrls("cboSurvType").Value
objRS.Fields(24).Value = objPgFiveCtrls("dtpSurvDate").Value
objRS.Fields(25).Value = objPgFiveCtrls("dtpGrdChkDate").Value
objRS.Fields(26).Value = objPgFiveCtrls("cboSuggTrtPln").Value
objRS.Fields(27).Value = objPgFiveCtrls("cboFlgClr").Value
objRS.Fields(28).Value = objPgFiveCtrls("cboLogAccess").Value
objRS.Fields(29).Value = objPgSixCtrls("cboPulpSaw").Value
objRS.Fields(30).Value = objPgSixCtrls("cboGreenInf").Value
objRS.Fields(31).Value = objPgSixCtrls("txtInfTrees").Value
objRS.Fields(32).Value = objPgSixCtrls("txtNumFading").Value
objRS.Fields(33).Value = objPgSixCtrls("txtNumGreen").Value
objRS.Fields(34).Value = objPgSixCtrls("txtNumVac").Value
69
'objRS.Fields(35).Value = strNorthLat
'objRS.Fields(36).Value = strWestLong
'objRS.Fields(37).Value = "WGS84"
objRS.Fields(38).Value = objPgSevenCtrls("txtComments3").Value
objRS.Fields(69).Value = "N"
strSurvEntered = "yes"
Else
objRS.Fields(69).Value = "B"
End If
End If
If ((strSpot <> "N") And (strBreakout = "N")) Then
objRS.MoveFirst
While Not objRS.EOF
If ((objRS.Fields(2).Value = objPgOneCtrls("txtSpotNum").Value) And (objRS.Fields(4).Value =
objPgOneCtrls("cboForest").Value) And (objRS.Fields(5).Value = objPgOneCtrls("txtDistCode").Value)) Then
strSpotFlagTemp = objRS.Fields(65).Value
strNorthLat = objRS.Fields("N_LAT_DD").Value
strWestLong = objRS.Fields("W_LON_DD").Value
End If
objRS.MoveNext
Wend
objRS.MoveLast
objRS.AddNew
objRS.Fields(1).Value = intMax
objRS.Fields(2).Value = objPgOneCtrls("txtSpotNum").Value
objRS.Fields(3).Value = objPgOneCtrls("txtRegion").Value
objRS.Fields(4).Value = objPgOneCtrls("cboForest").Value
objRS.Fields(5).Value = objPgOneCtrls("txtDistCode").Value
objRS.Fields(7).Value = objPgOneCtrls("cboSpecies").Value
objRS.Fields(8).Value = objPgOneCtrls("txtHboName").Value
objRS.Fields(9).Value = objPgOneCtrls("txtParentHbo").Value
objRS.Fields(10).Value = objPgThreeCtrls("txtComp").Value
objRS.Fields(11).Value = objPgThreeCtrls("txtSt").Value
objRS.Fields(13).Value = objPgThreeCtrls("txtEstimatedAcres").Value
objRS.Fields(14).Value = objPgThreeCtrls("cboPriority").Value
objRS.Fields(16).Value = objPgThreeCtrls("txtPBA").Value
objRS.Fields(17).Value = objPgThreeCtrls("txtTBA").Value
objRS.Fields(18).Value = objPgThreeCtrls("cboWild").Value
objRS.Fields(19).Value = objPgThreeCtrls("cboWildCode").Value
'objRS.Fields(20).Value = objPgThreeCtrls("txtWildName").Value
objRS.Fields(21).Value = objPgThreeCtrls("txtSpotFndBy").Value
'objRS.Fields("N_LAT_DD").Value = strNorthLat
'objRS.Fields("W_LON_DD").Value = strWestLong
objRS.Fields("SPHEROID").Value = "WGS84"
objRS.Fields(65).Value = strSpotFlagTemp
objRS.Fields(67).Value = "N"
If strSurvey = "N" Then
objRS.Fields(23).Value = objPgFiveCtrls("cboSurvType").Value
objRS.Fields(24).Value = objPgFiveCtrls("dtpSurvDate").Value
objRS.Fields(25).Value = objPgFiveCtrls("dtpGrdChkDate").Value
objRS.Fields(26).Value = objPgFiveCtrls("cboSuggTrtP ln").Value
objRS.Fields(27).Value = objPgFiveCtrls("cboFlgClr").Value
objRS.Fields(28).Value = objPgFiveCtrls("cboLogAccess").Value
objRS.Fields(29).Value = objPgSixCtrls("cboPulpSaw").Value
70
objRS.Fields(30).Value = objPgSixCtrls("cboGreenInf").Value
objRS.Fields(31).Value = objPgSixCtrls("txtInfTrees").Value
objRS.Fields(32).Value = objPgSixCtrls("txtNumFading").Value
objRS.Fields(33).Value = objPgSixCtrls("txtNumGreen").Value
objRS.Fields(34).Value = objPgSixCtrls("txtNumVac").Value
'objRS.Fields(35).Value = strNorthLat
'objRS.Fields(36).Value = strWestLong
'objRS.Fields(37).Value = "WGS84"
objRS.Fields(38).Value = objPgSevenCtrls("txtComments3").Value
objRS.Fields(69).Value = "N"
strSurvEntered = "yes"
Else
objRS.Fields(69).Value = "B"
End If
End If
If ((strSpot <> "N") And ((strHbo <> "N") Or (strBreakout <> "N")) And (strSurvey = "N")) Then
objRS.MoveFirst
While Not objRS.EOF
If ((objRS.Fields(2).Value = objPgOneCtrls("txtSpotNum").Value) And (objRS.Fields(4).Value =
objPgOneCtrls("cboForest").Value) And (objRS.Fields(5).Value = objPgOneCtrls("txtDistCode").Value) And
(objRS.Fields(8).Value = objPgOneCtrls("txtHboName").Value)) Then
strSpotFlagTemp = objRS.Fields(65).Value
strHboFlagTemp = objRS.Fields(67).Value
strNorthLat = objRS.Fields("N_LAT_DD").Value
strWestLong = objRS.Fields("W_LON_DD").Value
'MsgBox "Blah"
'MsgBox strSpotFlagTemp
If objRS.Fields(69).Value = "B" Then
objRS.Fields(23).Value = objPgFiveCtrls("cboSurvType").Value
objRS.Fields(24).Value = objPgFiveCtrls("dtpSurvDate").Value
objRS.Fields(25).Value = objPgFiveCtrls("dtpGrdChkDate").Value
objRS.Fields(26).Value = objPgFiveCtrls("cboSuggTrtPln").Value
objRS.Fields(27).Value = objPgFiveCtrls("cboFlgClr").Value
objRS.Fields(28).Value = objPgFiveCtrls("cboLogAccess").Value
objRS.Fields(29).Value = objPgSixCtrls("cboPulpSaw").Value
objRS.Fields(30).Value = objPgSixCtrls("cboGreenInf").Value
objRS.Fields(31).Value = objPgSixCtrls("txtInfTrees").Value
objRS.Fields(32).Value = objPgSixCtrls("txtNumFading").Value
objRS.Fields(33).Value = objPgSixCtrls("txtNumGreen").Value
objRS.Fields(34).Value = objPgSixCtrls("txtNumVac").Value
'objRS.Fields("N_LAT_DD").Value = strNorthLat
'objRS.Fields("W_LON_DD").Value = strWestLong
'objRS.Fields("SPHEROID").Value = "WGS84"
objRS.Fields(38).Value = objPgSevenCtrls("txtComments3").Value
objRS.Fields(69).Value = "N"
strSurvEntered = "yes"
End If
End If
objRS.MoveNext
Wend
If strSurvEntered = "no" Then
objRS.MoveLast
71
objRS.AddNew
objRS.Fields(1).Value = intMax
objRS.Fields(2).Value = objPgOneCtrls("txtSpotNum").Value
objRS.Fields(3).Value = objPgOneCtrls("txtRegion").Value
objRS.Fields(4).Value = objPgOneCtrls("cboForest").Value
objRS.Fields(5).Value = objPgOneCtrls("txtDistCode").Value
objRS.Fields(8).Value = objPgOneCtrls("txtHboName").Value
objRS.Fields(23).Value = objPgFiveCtrls("cboSurvType").Value
objRS.Fields(24).Value = objPgFiveCtrls("dtpSurvDate").Value
objRS.Fields(25).Value = objPgFiveCtrls("dtpGrdChkDate").Value
objRS.Fields(26).Value = objPgFiveCtrls("cboSuggTrtPln").Value
objRS.Fields(27).Value = objPgFiveCtrls("cboFlgClr").Value
objRS.Fields(28).Value = objPgFiveCtrls("cboLogAccess").Value
objRS.Fields(29).Value = objPgSixCtrls("cboPulpSaw").Value
objRS.Fields(30).Value = objPgSixCtrls("cboGreenInf").Value
objRS.Fields(31).Value = objPgSixCtrls("txtInfTrees").Value
objRS.Fields(32).Value = objPgSixCtrls("txtNumFading").Value
objRS.Fields(33).Value = objPgSixCtrls("txtNumGreen").Value
objRS.Fields(34).Value = objPgSixCtrls("txtNumVac").Value
objRS.Fields("N_LAT_DD").Value = strNorthLat
objRS.Fields("W_LON_DD").Value = strWestLong
objRS.Fields("SPHEROID").Value = "WGS84"
objRS.Fields(38).Value = objPgSevenCtrls("txtComments3").Value
objRS.Fields(65).Value = strSpotFlagTemp
objRS.Fields(67).Value = strHboFlagTemp
objRS.Fields(69).Value = "N"
strSurvEntered = "yes"
End If
End If
If ((objRS.recordcount = 0) And (strSpot = "M")) Then
objRS.AddNew
objRS.Fields(2).Value = objPgOneCtrls("txtSpotNum").Value
objRS.Fields(3).Value = objPgOneCtrls("txtRegion").Value
objRS.Fields(4).Value = objPgOneCtrls("cboForest").Value
objRS.Fields(5).Value = objPgOneCtrls("txtDistCode").Value
objRS.Fields(7).Value = objPgOneCtrls("cboSpecies").Value
objRS.Fields(65).Value = "M"
End If
If ((objRS.recordcount <> 0) And (strSpot = "M")) Then
objRS.MoveFirst
While Not objRS.EOF
If objRS.Fields(2).Value = objPgOneCtrls("txtSpotNum").Value Then
objRS.Fields(3).Value = objPgOneCtrls("txtRegion").Value
objRS.Fields(4).Value = objPgOneCtrls("cboForest").Value
objRS.Fields(5).Value = objPgOneCtrls("txtDistCode").Value
objRS.Fields(7).Value = objPgOneCtrls("cboSpecies").Value
objRS.Fields(65).Value = "M"
End If
objRS.MoveNext
Wend
End If
If strHbo = "M" Then
72
objRS.MoveFirst
While Not objRS.EOF
If ((objRS.Fields(2).Value = objPgOneCtrls("txtSpotNum").Value) And (objRS.Fields(4).Value =
objPgOneCtrls("cboForest").Value) And (objRS.Fields(5).Value = objPgOneCtrls("txtDistCode").Value) And
(objRS.Fields(8).Value = objPgOneCtrls("txtHboName").Value)) Then
objRS.Fields(9).Value = objPgOneCtrls("txtParentHbo").Value
objRS.Fields(10).Value = objPgThreeCtrls("txtComp").Value
objRS.Fields(11).Value = objPgThreeCtrls("txtSt").Value
objRS.Fields(13).Value = objPgThreeCtrls("txtEstimatedAcres").Value
objRS.Fields(14).Value = objPgThreeCtrls("cboPriority").Value
objRS.Fields(16).Value = objPgThreeCtrls("txtPBA").Value
objRS.Fields(17).Value = objPgThreeCtrls("txtTBA").Value
objRS.Fields(18).Value = objPgThreeCtrls("cboWild").Value
objRS.Fields(19).Value = objPgThreeCtrls("cboWildCode").Value
'objRS.Fields(20).Value = objPgThreeCtrls("txtWildName").Value
objRS.Fields(21).Value = objPgThreeCtrls("txtSpotFndBy").Value
objRS.Fields(67).Value = "M"
End If
objRS.MoveNext
Wend
End If
If strSurvey = "M" Then
objRS.MoveFirst
While Not objRS.EOF
If ((objRS.Fields(2).Value = objPgOneCtrls("txtSpotNum").Value) And (objRS.Fields(4).Value =
objPgOneCtrls("cboForest").Value) And (objRS.Fields(5).Value = objPgOneCtrls("txtDistCode").Value) And
(objRS.Fields(8).Value = objPgOneCtrls("txtHboName").Value) And (objRS.Fields(24).Value =
objPgFiveCtrls("dtpSurvDate").Value)) Then
objRS.Fields(23).Value = objPgFiveCtrls("cboSurvType").Value
objRS.Fields(25).Value = objPgFiveCtrls("dtpGrdChkDate").Value
objRS.Fields(26).Value = objPgFiveCtrls("cboSuggTrtPln").Value
objRS.Fields(27).Value = objPgFiveCtrls("cboFlgClr").Value
objRS.Fields(28).Value = objPgFiveCtrls("cboLogAccess").Value
objRS.Fields(29).Value = objPgSixCtrls("cboPulpSaw").Value
objRS.Fields(30).Value = objPgSixCtrls("cboGreenInf").Value
objRS.Fields(31).Value = objPgSixCtrls("txtInfTrees").Value
objRS.Fields(32).Value = objPgSixCtrls("txtNumFading").Value
objRS.Fields(33).Value = objPgSixCtrls("txtNumGreen").Value
objRS.Fields(34).Value = objPgSixCtrls("txtNumVac").Value
'objRS.Fields("N_LAT_DD").Value = strNorthLat
'objRS.Fields("W_LONG_DD").Value = strWestLong
'objRS.Fields(37).Value = "WGS84"
objRS.Fields(38).Value = objPgSevenCtrls("txtComments3").Value
objRS.Fields(69).Value = "M"
End If
objRS.MoveNext
Wend
End If
objRS.Update
objRS.Close
Set objRS = Nothing
strSpotFlagTemp = ""
strHboFlagTemp = ""
73
End Sub
'------------------------------------------------------------------------------------------------'|||||||||||||||||||||||||||||||||||||||||||||||||||||||||||||||||||||||||||||||||||||||||||||||||||
'Validation Routines
'------------------Sub ValidateWild
If ThisEvent.Object.Value = "Y" Then
objPgThreeCtrls("cboWildCode").Enabled = True
objPgThreeCtrls("cboWildCode").ListIndex = -1
Else
objPgThreeCtrls("cboWildCode").Enabled = False
End If
End Sub
'----------------------------------------------------------------------------Sub ValidateBATotal
Dim dblPBA, dblTBA
dblPBA = CDbl(objPgThreeCtrls("txtPBA").Value)
dblTBA = CDbl(objPgThreeCtrls("tx tTBA").Value)
If dblPBA > dblTBA Then
ThisEvent.Result = False
ThisEvent.MessageText = "The basal area for Pine should be less than or equal to the total basal area.
Please re-enter the values"
ThisEvent.messageType = vbExclamation
End If
End Sub
'------------------------------------------------------------------------------Sub ValidateNumeric
Dim strValue
strValue = ThisEvent.Object.Value
If strValue <> "" Then
If Not IsNumeric(strValue) Then
ThisEvent.Result = False
ThisEvent.MessageText = "Please enter a numeric value"
ThisEvent.messageType = vbExclamation
End If
End If
End Sub
'---------------------------------------------------------------------------Sub ValidateComma
74
Dim objControl
Set objControl = ThisEvent.Object
Dim intComma
Dim intLength
Dim strSearchString
strSearchString = objControl.Value
intComma = InStr(strSearchString, ",")
If intComma > 0 Then
ThisEvent.Result = False
ThisEvent.MessageText = "Commas are not acceptable entries!!!! Please delete the commas."
ThisEvent.messageType = vbExclamation
End If
End Sub
'------------------------------------------------------------------------------Sub ValidateInitialDetection
Dim strResponse
Dim strDate
strDate = objPgFiveCtrls("dtpSurvDate").Value
MsgBox "Please verify Initial Detection date of" & strDate
strResponse =
MsgBox("Is this value correct?", vbYesNo)
If strResponse = vbNo Then
ThisEvent.Result = False
ThisEvent.MessageType = vbExclamation
objPgFiveCtrls("dtpSurvDate").SetFocus
End If
End Sub
'---------------------------------------------------------------------Sub ValidateRadioButtons
If strSurvey = "" Then
ThisEvent.Result = False
ThisEvent.MessageText = "Please choose from one of the radio button options at the top of the page."
ThisEvent.messageType = vbExclamation
End If
End Sub
'|||||||||||||||||||||||||||||||||||||||||||||||||||||||||||||||||||||||||||||||||||||||||||||||||||
'Data-entry Control Functions
'---------------------------Sub IncrementNum (strNum)
Dim intNum
If strNum = "2" Then
intNum = CInt(objPgSixCtrls("txtNumFading").Value)
75
objPgSixCtrls("txtNumFading").Value = intNum + 1
ElseIf strNum = "3" Then
intNum = CInt(objPgSixCtrls("txtNumGreen").Value)
objPgSixCtrls("txtNumGreen").Value = intNum + 1
ElseIf strNum = "4" Then
intNum = CInt(objPgSixCtrls("txtNumVac").Value)
objPgSixCtrls("txtNumVac").Value = intNum + 1
End If
End Sub
'-------------------------------------------------------------------------------Sub DecrementNum (strNum)
Dim intNum
If strNum = "2" Then
intNum = CInt(objPgSixCtrls("txtNumFading").Value)
objPgSixCtrls("txtNumFading").Value = intNum - 1
ElseIf strNum = "3" Then
intNum = CInt(objPgSixCtrls("txtNumGreen").Value)
objPgSixCtrls("txtNumGreen").Value = intNum - 1
ElseIf strNum = "4" Then
intNum = CInt(objPgSixCtrls("txtNumVac").Value)
objPgSixCtrls("txtNumVac").Value = intNum - 1
End If
End Sub
'-------------------------------------------------------------------------------Sub SumTreeCounts
Dim intNum1, intNum2, intTotal
intNum1 = CInt(objPgSixCtrls("txtNumFading").Value)
intNum2 = CInt(objPgSixCtrls("txtNumGreen").Value)
intTotal = intNum1 + intNum2
objPgSixCtrls("txtInfTrees").Value = intTotal
End Sub
'|||||||||||||||||||||||||||||||||||||||||||||||||||||||||||||||||||||||||||||||||||||||||||||||||||
'Exit Routines
'------------Sub GPS_Update
Dim objLayer, objRS, strInput, strFileName
Set objLayer = Application.Map.SelectionLayer
Set objRS = objLayer.Records
objRS.Bookmark = Map.SelectionBookmark
If (GPS.IsOpen) Then
objRS.Fields("N_LAT_DD").Value = GPS.Latitude
strNorthLat = GPS.Latitude
76
objRS.Fields("W_LON_DD").Value = GPS.Longitude
strWestLong = GPS.Longitude
End If
objRS.Update
Set objRS = Nothing
Set objLayer = Nothing
If strSpot = "N" or strHbo = "N" or strBreakout = "N" Then
strFileName = "spb_survey_backup.dbf"
Set objRS = Application.CreateAppObject("recordset")
If instr(strFileName, "\") = 0 Then
strFileName = LayerPath & strFileName
End If
objRS.Open strFileName, 2
If err.number<>0 Then
msgbox "Cannot open Table " & strFileName
Set objRS = Nothing
Exit Sub
End If
objRS.MoveLast
objRS.Fields("N_LAT_DD").Value = strNorthLat
objRS.Fields("W_LON_DD").Value = strWestLong
objRS.Update
objRS.Close
End If
Set objRS = Nothing
End Sub
'---------------------------------------------------------------------------------Sub GPS_Activate
Dim strInput
If Not((GPS.IsOpen)) Then
strInput = MsgBox ("Would you like to activate the GPS?", 4)
If (strInput = vbYes) Then
Application.GPS.Open
End If
End If
End Sub
'---------------------------------------------------------------------------------Sub FreeMemory
'objPgOneCtrls("cboForest").Clear
'objPgOneCtrls("cboDistrict").Clear
Set objPgSevenCtrls = Nothing
Set objPgSixCtrls = Nothing
Set objPgFiveCtrls = Nothing
Set objPgThreeCtrls = Nothing
77
Set objPgOneCtrls = Nothing
strForestCode = ""
strNorthLat = 0
strWestLong = 0
strSpot = ""
strHbo = ""
strBreakout = ""
strSurvey = ""
strSpotFlagTemp = ""
strHboFlagTemp = ""
strFlag = ""
End Sub
'||||||||||||||||||||||||||||||||||||||||||||||||||||||||||||||||||||||||||||||||||||||||||
'Flag Update Routines
Sub UpdateSpotFlag(strFlag)
strSpot = strFlag
objPgOneCtrls("txtHboName").Value = 1
objPgOneCtrls("txtParentHbo").Value = "Master"
End Sub
Sub UpdateHeadFlag(strFlag)
strHbo = strFlag
objPgOneCtrls("cboHboName").ListIndex = -1
objPgOneCtrls("cboHboName").Enabled = False
objPgOneCtrls("txtHboName").Enabled = True
End Sub
Sub UpdateBreakoutFlag(strFlag)
strBreakout = strFlag
objPgOneCtrls("cboHboName").ListIndex = -1
objPgOneCtrls("cboHboName").Enabled = False
objPgOneCtrls("txtHboName").Enabled = True
End Sub
Sub UpdateSurveyFlag(strFlag)
strSurvey = strFlag
End Sub
78
APPENDIX B
SPBIS DATA UPLOAD APPLICATION CODE
79
The following is the code for the upload interface between SPBIS and the mobile device.
SQL = "INSERT INTO spb_main_spots_table " + _
"(SPOT_NUMBER, REGION,
FOREST,DISTRICT,SPECIES,COMMENTS,INPUT_TYPE)" + _
"VALUES (" + spotNum + "," + _
region + "," + _
Forest + "," + _
District + ", '" + _
Species + "', '" + _
commMain + "', " + _
"'P')"
ADOC.Execute SQL
SQL = "INSERT INTO spb_heads_breakouts " + _
"(SPOT_CN, HBO_NAME, PARENT_HBO, COMPARTMENT," + _
"STAND, USTAND, EST_ACRES, PRIORITY, HAZARD_RATING, " +
_
"BA_PINE, BA_TOTAL, WILDERNESS, WILD_CODE,
WILDERNESS_NAME,
FOUND_BY, COMMENTS) " + _
"VALUES ('" + spotCN + "', '" + _
hboName + "', '" + _
Parent_HBO + "', " + _
comp + ", " + _
stand + ", '" + _
ustand + "', " + _
est_Acres + ", '" + _
priority + "',' " + _
Haz_rate + "', " + _
BA_pine + ", " + _
BA_total + ", '" + _
wild + "', '" + _
wild_code + "', '" + _
wildName + "', '" + _
found_by + "', '" + _
comm_HBO + "')"
ADOC.Execute SQL
SQL = "INSERT INTO SPB_SURVEYS " + _
"(HBO_CN, SURVEY_TYPE_CODE, DATE_SURVEYED,
DATE_GROUND_CHECKED," + _
"FLAGGING_COLOR, LOGGING_ACCESS_CODE, PULP_OR_SAW,
TREATMENT_CODE, " + _
"FRESH_ATTACK, NUM_GREEN_TREES, NUM_INFESTED_TREES,
NUM_RED_FADED_TREES, " + _
"NUM_VACATED_TREES, N_LAT_DD, W_LON_DD, SPHEROID,
Comments) " + _
"VALUES ('" + hboCN + "', '" + _
SURV_TYPE + "', '" + _
SURV_DATE + "', '" + _
GR_CH_DATE + "', '" + _
FLG_COLOR + "', '" + _
LOG_CODE + "', '" + _
PULP_SAW + "', '" + _
TRT_CODE + "', '" + _
80
FRESH_ATT + "', " + _
NUM_GR_TR + ", " + _
NUM_INF_TR + ", " + _
NUM_RF_TR + ", " + _
NUM_VAC_TR + ", " + _
N_LAT_DD + ", " + _
W_LON_DD + ", '" + _
SPHEROID + "', '" + _
COMM_SURV + "')"
ADOC.Execute SQL
SQL = "INSERT INTO SPB_TREATMENTS " + _
"(HBO_CN, SALE_ID, CUTTING_UNIT_ID, PERMIT_NUM,
TREATMENT_CODE, DATE_MARKED, DATE_SOLD, DATE_TREATED, DATE_SUPPRESSED,
"+
_
"CONTRACTOR_ID, CALCULATED_ACRES, NUM_TREES_TREATED,
PAINT_COLOR, SALVAGE_VOLUME_PULP, SALVAGE_VOLUME_SAW, " + _
"SUPP_VOLUME_DATE, SUPP_VOLUME_PULP,
SUPP_VOLUME_SAW,
MARKERS, comments) VALUES ('" + hboCN + "', " + _
SALE_ID + ", " + _
CUT_ID + ", '" + _
PERMIT_NUM + "', '" + _
PRIM_TRT + "', '" + _
DATE_MARK + "', '" + _
DATE_SOLD + "', '" + _
DATE_TRT + "', '" + _
DATE_SUPP + "', '" + _
CONTR_ID + "', " + _
CALC_ACRES + ", " + _
NUM_TR_TRT + ", '" + _
PNT_COLOR + "', " + _
SAL_V_PULP + ", " + _
SAL_V_SAW + ", '" + _
SUP_V_DATE + "', " + _
SUP_V_PULP + ", " + _
SUP_V_SAW + ", '" + _
MARKERS + "', '" + _
COMM_TRT + "')"
ADOC.Execute SQL
SQL = "INSERT INTO spb_special_mgt_considerations " + _
"(HBO_CN , SMC_CODE, DATE_INITIATED, DATE_CLEARED,
REVIEWER, Approved, Comments ) " + _
"VALUES ('" + hboCN + "', '" + _
SMC_CODE + "', '" + _
DATE_INIT + "', '" + _
DATE_CLEAR + "', '" + _
REVIEWER + "', '" + _
Approved + "', '" + _
COMM_SMC + "')"
ADOC.Execute SQL
81
APPENDIX C
SPBIS DATA COLLECTION USERS MANUAL
82
TABLE OF CONTENTS
Page
Introduction
• What is GIS?…………………………………………………..
• Working with ArcPad®……………………………………….
2
10
The SPBIS Data Collection Process
•
•
•
•
•
•
Steps in the data collection process……………………………
Loading data onto the unit……………………………………..
Manipulating layers, building and editing maps………………
Determining Area………………………………………………
Using the SPBIS data collection form…………………………
Components of Trimble® GeoXT™ system…………………..
25
34
36
38
42
44
Trimble Support Information
•
•
•
•
•
•
References
Windows® CE Operating System……………………………..
System Configuration for use of ArcPad®…………………….
Memory…………………………………………………………
GPS……………………………………………………………..
Battery and Power………………………………………………
Troubleshooting…………………………………………………
45
53
56
61
65
68
83
84
85
86
87
88
89
90
91
92
93
94
95
96
97
98
99
100
101
102
103
104
105
106
Working with layers and editing features in ArcPad®
For this exercise, assume you work for the County where it's your job to update the GIS
data. Recently, you've been asked to add a hydrant and three streets to the GIS database.
You will use ArcPad to collect the features. You would normally use GPS in combination
with ArcPad to create new data, but in this exercise you will add features using ArcPad’s
drawing tools.
Note on "tapping" versus "clicking" buttons, tools, icons etc. in this exercise. This
exercise has been designed to run on a mobile device. With a mobile device, you tap your
pen or stylus on the buttons and menus in your software instead of clicking them. If
you're running ArcPad on a desktop computer, "clicking" your mouse will have the same
affect as "tapping" the display on a mobile device.
Estimated time to complete: 25 minutes
Step 1. Open ArcPad and add layers Open ArcPad, if
necessary.
Tap the Add Layer button
.
In the Add Layer(s) dialog, tap the Directory Browser button
.
In the Directory Browser dialog, tap your mobile_mapping
folder (e.g., C:\Temp\mobile_mapping ), then tap OK.
Tap the boxes next to hydrants, parcels, and subdivisions.
Step 2. Change the map units
The scale bar in yo ur map is using metric units, but
the map units of your data use feet. You will use the
Properties dialog in ArcPad to make your scale bar
and map units match.
From the Main toolbar, tap the Tools button
.
In the top-right corner of the ArcPad Options dialog,
107
use the right facing arrow to scroll through the options until you see the Display tab.
Tap the Display tab.
For Display Units, tap the Statute (US Units) option.
Step 3. Change the layers drawing order
To make the data easier to work with, you will
change its drawing order so the hydrant layer
draws on top of the parcels layer, and the
parcels layer draws on top of the subdivisions
layer.
Tap the Layers button
.
In the Layers dialog, highlight the hydrants
layer.
On the right side of the layers dialog, tap the up arrow to move the hydrants layer above
both the subdivisions and parcels layers. Use the same method to place parcels above
Subdivisions.
Step 4. Change the hydrant symbols
The drawing order is appropriate for your needs,
but the symbology of your data does not let you
see all three layers at once. To clear things up,
you will change the symbology of the layers.
Tap the Layers button.
Highlight the hydrants layer, then tap the Layer
Properties button
.
In the Layer Properties dialog, tap the Point Style
tab.
Make sure the Fill Points box is checked, then tap the Fill Color symbol.
In the Color Designer, tap a dark red color from the color palette.
108
In ArcPad Version 6.0, the color you chose is copied to the new color chip that is located
in the upper-right corner of the Color Designer. In Version 6.0.1, the new color is
displayed as the background color in the OK button; the old color is displayed as
background color in the Cancel button.
Tap the New color chip to confirm your choice
(Version 6.0) or tap the OK button (Version
6.0.1).
If necessary, change the Outline Color to black.
Change the size of the hydrants to 4.
The color and size of the hydrants is set.
Step 5. Turn on the hydrant labels In the
Layer
Properties dialog, tap the Labels tab.
Check the "Label Features in this layer" box.
If necessary, from the Field dropdown list,
choose HYDRANT_ID.
For Size type 10.
Tap the Color symbol.
In the Color Designer, choose a red color from the color palette, then tap the new color
chip (Version 6.0) or tap the OK button (Version 6.0.1).
Check the Opaque Background option. This will put a background behind each label.
109
Step 6. Change the parcel symbology
Double-tap the parcels layer in the
Layers dialog.
This is a shortcut for opening the Layer
Properties dialog.
Tap the Polygon Style tab.
Set the Outline Width to 2.
Change the outline color to dark gray.
Make sure the Fill Polygons option is
unchecked.
Tap OK to close the Layer Properties dialog.
Close the Layers dialog.
Step 7. Locate a parcel
The hydrant you are going to add is located in the
southwest corner of Parcel 29. Before you can add the
new hydrant, you must locate parcel 29.
On the Browse toolbar, tap the Find button
.
In the Find dialog, tap the Select Layers button
.
In the Field Browser dialog, tap the plus sign next to
parcels.shp.
In the list of fields, tap the PID field to highlight it.
Tap OK.
In the Find text box, enter 29, and then tap the Search
button
.
One match is found and posted in the results list.
In the results table, tap the record to highlight it.
Notice the associated feature is also highlighted in the
ArcPad display.
110
In the lower-right corner of the Find dialog, tap the dropdown arrow and choose Zoom to
Feature.
Close the Find Dialog.
Tap the Clear Selected Features button
.
You have located the parcel, now you can record the location of the hydrant that is on it.
Step 8. Activate hydrant editing
Before you can add the hydrant, you must make
the hydrant layer available for editing.
Tap the Layers button.
In the Layers dialog, check the editing box for the
hydrants layer.
Close the Layers dialog.
Step 9. Add the hydrant
In most cases, capturing a hydrant with ArcPad
would occur in the field with GPS. In this
exercise, you will add the hydrant by tapping its
approximate location in the display.
On the Edit/Drawing toolbar, tap the Point
button
.
Tap the southwest corner of the parcel at the
location shown below.
111
The Feature Properties dialog appears once you've added the hydrant. This dialog is used
to assign attributes to a feature. It can also be used to edit the geometry of a feature by
allowing you to explicitly define the coordinate values of a feature’s vertexes or a point.
Within the Feature Properties dialog, tap to the immediate right of the field type icon
to bring up the text cursor. If it does not activate on the first try, try again.
Enter 14 for the Hydrant_ID, and then tap OK.
Step 10. Reset the display
Before you begin adding the streets, you'll turn
off the hydrants layer and change some of the
display properties.
Tap the Zoom to Full Extent button
.
Tap the Layers button.
Turn off the visibility and the editing status of the
hydrant layer.
Close the Layers dialog.
To save room in your display, you will turn off the scale bar.
Tap the Tools dropdown arrow
, then tap the Scale Bar option to turn it off.
Tap the Tools dropdown arrow again, and then turn on the Panning Frame.
The display is cleaned up and ready for adding streets, but before you can do this you will
need to create a streets layer.
Step 11. Create a new streets layer
Tap the dropdown arrow next to the Open Map
button
. Choose New Layer.
In the New Shapefile dialog, tap the Type
dropdown arrow, and choose Polyline.
Tap the Add Field button .
In the Field dialog, name the field STREET.
112
Tap OK.
In the Create New ShapeFile Layer dialog,
name the new shapefile Streets, and save it in
your MyData folder (e.g.,
C:\Temp\mobile_mapping\MyData).
Tap the Layers button.
After you create a new shapefile in ArcPad, it is
automatically added to the current map with its
visibility and editing status activated.
Close the Layers dialog.
Step 12. Use the Zoom-In Tool
You will add the first street to the cul-de-sac located at
the north end of the study area. Before you can draw
the street you need to zoom in closer to its location.
Tap the Zoom In button
.
Zoom in to the area shown below.
Step 13. Digitize Kansas Street
Tap the Line button
.
To draw a line with this tool, tap where you want the line
to start, then, while holding the pen down, drag to the
location you want the line to end. The location where you
lift the pen off the display defines where the line ends.
Using the tap-and-drag technique described above, draw
the cul-de-sac’s street centerline at the location shown
below.
After you draw the street, enter Kansas St for the street name, and then tap OK.
Click the Full Extent button.
113
Step 14. Digitize State Street
The next street you will add is south of the one you just
added.
Zoom in to the area shown in the graphic below.
To add this street, you will use the Polyline tool. To use
this tool, tap the location where you want the line to
start, then tap and drag to define each successive
vertex. After adding the final vertex, tap the Polyline
button to finish the sketch.
From the Editing tools dropdown list, choose Polyline.
Tap the location shown below to begin drawing the
street.
Tap just to the right of the first vertex and drag to the
next location where you want to place a vertex, when you
remove the styles from display (or release the mouse
button) the vertex is added. Digitize the rest of the street
by using the tap and drag process to add the polyline's
vertices. When you get to the edge of the display, use the
panning frame to bring the rest of the street into view, or
click the Full Extent button and continue adding vertexes.
When you're finished drawing the street, tap the Polyline
button.
Name the street State St, then tap OK to close the
Feature Properties dialog.
Tap the dropdown arrow next to the Feature Properties
button
and choose Zoom to Selected Feature.
114
Step 15. Save your map and close ArcPad
Your work is done for now, but you should save the current map just in case you need to
return to this study area again.
Tap the Zoom to Full Extent button.
Tap the Save Map button
.
Name the map Streets.apm and save it in your MyData folder.
115
Loading Data onto the Trimble©
GeoXT®
Step 1. Data Preparation
Possible base map folder names
Collect all desired base map files
(compartments, stands, water features,
roads etc.) on your desktop PC and place
them in a folder that will be easy to
locate. It is important to make sure all
files are projected alike, including the
SPBIS survey shapefile. Failure to
project the files alike will result in layers
that will not line- up properly.
Projections can easily be changed using
desktop GIS software such as ArcGIS®
or ArcView®.
Step 2. Transfer of data to the mobile
unit
In order for your mobile unit to
communicate with your desktop PC,
Microsoft ActiveSync® is required. This
program can be downloaded at no cost
from the Microsoft website. To begin,
connect the Trimble© GeoXT® support
module, or cradle to the desktop PC via
the USB data cable. Press the unit into
the cradle to form a connection. When a
proper connection has been made the
unit will flash a message across the
screen, and a screen prompt will appear
on the desktop PC. This prompt will ask
if you would like to synchronize your
unit with the PC. For most applicatio ns
choose NO, and click next. A window
will appear stating that a connection has
been established. You are now ready to
transfer data. The following are the steps
in the transfer process:
1. Double-click the My
Computer icon on your
desktop PC.
116
2. Double-click the Mobile
Device icon
3. Double-click the Disk icon
4. Double-click the My
Documents icon
5. Minimize the My
Documents folder. Navigate
to your base map folder on
your desktop PC. Minimize
the window. Drag the desired
folder into the My
Documents window. You
may also right-click on the
folder, chose copy, and paste
the data into the My
Documents folder. Your data
is now on the mobile unit.
117
List of necessary files in addition to
secondary GIS data files:
ArcPad.apm
:The ArcPad Map
Document for
displaying data and
forms in ArcPad
Spb_survey files (.apl, .dbf, ..prj, .shp, .xml,
.shx, .shx ) :
Point shapefile to
store and display
data collected on
field, and to display
active dada
collection forms in
ArcPad.
District_codes.dbf
: Dbase file
containing District
Code information
for use in ArcPad
Flg_color.dbf
: Dbase file
containing Flagging
Color Code
information for use
in ArcPad
Forest_codes.bdf
: Dbase file
containing Forest
Code information
for use in ArcPad
Log_access.dbf
: Dbase file
containing Logging
Access Code
information for use
in ArcPad
Prim_trt.dbf
: Dbase file
containing Primary
Treatment Code
information for use
in ArcPad
Priority.dbf
: Dbase file
containing Priority
Code information
for use in ArcPad
Pulp_saw.dbf
: Dbase file
containing
Pulp/Saw Code
information for use
in ArcPad
Smc_code.dbf
: Dbase file
containing Special
Management
Consideration Code
information for use
in ArcPad
Species.dbf
: Dbase file
containing Species
Code information
for use in ArcPad
Surv_type.dbf
: Dbase file
containing Survey
Type Code
information for use
in ArcPad
Trt_plan.dbf
: Dbase file
containing
Treatment Plan
Code information
for use in ArcPad
Wilderness_codes.dbf : Dbase file
containing
Wilderness Code
information for use
in ArcPad
Yes_no.dbf
: Dbase file
containing “yes”
and “no” values for
use in ArcPad
Note:
All GIS files, including
“spb_survey.shp” files should be in the
same geographic projection before files
are checked out into ArcPad. Also make
sure that “spb_survey.shp” has been
added to the map document and is part
of the check-out bundle before
packaging the files.
118
SPBIS Data Collection Forms
This exercise is an introduction to using the Trimble GeoXT with custom ArcPad forms
for data collection. After this exercise you should be able to
• Open and load an existing ArcPad Application
• Activate the in-built GPS unit from ArcPad
• Load and populate an ArcPad data collection form; Capture corresponding
GPS points for the data
• Save and close the application
Step 1. Open and load and existing ArcPad application
•
Turn on the Trimble GeoXT by pressing once
on the large gray power button at the bottom.
Opening an existing application
•
Double-tap the ArcPad icon on the display
screen to launch ArcPad. This may also be
done from the “Start” menu at the bottom left
corner of the screen as follows:
Start
Programs
ArcPad
•
When the program has loaded, open the
particular application by tapping on the
“File” menu at the top right corner of the
main menu bar, using the following steps:
File – Open Map – Disk – My Documents –
Training – ArcPad.apm – Open
This will load the particular application called
“ArcPad” located in the “Disk” portion of the
main memory. All data and applications are
loaded into the “Disk” portion of the memory,
which is the non- volatile and permanent portion
of the Trimble unit’s memory.
Tap on the black arrow next to the
“File” icon
119
Activate the in-built GPS unit from ArcPad
•
•
Tap once on the black arrow next to the
(insert image) icon on the main menu, to
view the drop-down options.
Activating the in-built GPS unit
Tap once on the “GPS Active” option. A red
rectangle appears around the corresponding
icon to the left.
This will activate the in-built GPS unit of the
GeoXT from within ArcPad. ArcPad will use the
GPS configurations of the in-built GPS
Controller. If the configuration is changed within
ArcPad, it will over-write the settings of the GPS
Controller.
Tap on the black arrow next to the
“GPS” icon to view the drop-down
menu and GPS options.
120
Step 2. Traversing a Spot to
Determine Area
A new polygon shapefile is created
for each spot to determine the area
•
Tap the black arrow next to the
“File” icon; choose the “New
Layer” option.
•
From the “Type” dropdown
menu choose “Polygon”, and tap
the plus sign in the lower lefthand corner.
•
When a polygon has been added,
a “Field” window will appear.
Give the spot a unique
identification in the “Name”
field, and click “OK”
•
The “New Shapefile” window
will appear. Check to make sure
the type is correct and tap “OK”.
•
You will be prompted to save the
new shapefile. Save the file in
the same folder as your base map
for easy access.
“File” icon
Add a polygon
Give the polygon a unique name
Make sure the correct type is chose
121
•
After your shapefile has been
saved, tap the “Layers” icon to
activate the layer control
window. The system will default
to the most recently created
shapefile, but if several are
created at one time check to
make sure the spot being
traversed is open for editing.
•
Mark a location, in the field, on
the perimeter of the spot to begin
traversing. Use flagging tape to
make sure you can return to your
starting point. It is best to walk
the spot before creating the
shapefile to ensure that all
infested trees are included in the
area. When a starting point has
been determined, activate the
GPS, if it is not already. Use the
“zoom in” tool to reduce the map
scale to a level at which the spot
polygon can be seen.
•
•
Tap the black arrow next to the
“Feature Type” icon. Choose
polygon. When the GPS is
activated the “Add GPS Vertices
Continuously” icon will also be
activated. When you are ready to
being traversing, tap the icon
once. The icon will remain
depressed until tapped again.
Begin walking the perimeter of
the spot. It is important to keep
moving as a new vertex is added
whether you are moving or not.
Stopping can skew the polygon.
If you need to stop, tap the “Add
GPS Vertices Continuously” icon
again to pause. When you are
ready to continue tap the icon
again.
“Layers” icon; Edit option activated
“Zoom-In” Tool
Choose “Polygon” from the “Feature
Type” drop-down menu. Tap “Add
GPS Vertices Continuo usly” icon to
start
122
•
When the entire spot has been
traversed, and you have returned
to the starting point, tap the “Add
GPS Vertices Continuously” icon
once again to stop additional
vertices from being added. Tap
the last vertex and hold the stylus
down. A menu will appear.
Chose the “Finish Sketch”
option. The polygon is now
complete. Tap the “Save” icon to
ensure no data is lost.
•
Once the sketch has been
finished, an attribute table will
appear. Click the Geography tab
to view the coordinates for each
point taken by the GPS and the
area in square feet or acres,
depending on spot size. Make
sure the display units are Statue
or US units. This can be set
under ArcPad Options, Display.
•
SPBIS requires the area estimates
in acreage. The unit will not
output acreage if the spot is less
than 1 acre. This is a slight
inconvenience, but the square
footage value can be converted to
acreage using the unit calculator.
It is accessed by clicking the
Start Menu, Programs,
Accessories, and Calculator.
The conversion equation is:
Sq ft value / 43,560 = Acreage
Tap the “Add GPS Vertices
Continuously” icon to stop adding
vertices. Place stylus on last vertex,
hold down until menu appears, chose
“Finish Sketch” to complete the
polygon. Tap the “Save” icon.
Attribute table containing the area
123
Setting display units to Statute, US Units
124
Step 4. Load and populate an ArcPad® data collection form; Capture
corresponding GPS points for the data
Before loading the forms and creating new point features the correct layer needs to be set
to the “Edit” mode. For this exercise we will be adding data and records for the Southern
Pine Beetle, hence the corresponding layer should be set in the Edit mode.
•
Tap on the “Layers” icon (indicated by the
red box) to activate the layer control box.
•
Place a check mark on the last box against
the layer named “spb_survey”. This will
make that layer editable.
•
Tap on “GPS Point” icon to create a point
and activate the forms. As a new point is
being created the data form associated with
the form will be displayed.
•
Enter the required values in the fields and tap
“OK” to close the form and save the
information. Clicking “OK” will close the
form and save the information entered into
the .dbf table, which can be opened in Excel
if required.
•
Click on “Yes” when prompted about
entering data into SPBIS.
All the information entered into the form will be
stored as one record linked to the new point that
is created. The information is stored in the .dbf
file associated with the point.
In the application, at this a backup .dbf file is
also created which will contain all the fields
required by SPBIS, in a format different from the
.dbf file associated with the shapefile. In addition
it also contains some flag fields required for
accurate entry into SPBIS.
Again, this is an important step in for this
application,, since data will be prepared for entry
into the SPBIS database only if “Yes” is
selected. In the event that the data is incomplete
Activating the Layer control Box
Making “spb_survey” Layer editable
Adding a new point
125
the option “No” may be selected and the missing
data entered at a later date. However, only the
most current information will be stored, hence if
a value had been changed without having entered
the previous one into SPBIS that particular entry
for that control will be lost, since the old value
will be overwritten in the default .dbf table.
•
Repeat previous steps if necessary to add a
second point and record.
Step 5. Saving and Exiting ArcPad
•
Save the file by tapping on “File” from the
main menu using the following steps:
File – Save Map
•
Close ArcPad either by tapping on the close
icon at the top right corner of the screen as
you would any windows application or by
tapping on “Exit” from the main “File”
menu.
Saving and exiting the application
Tap on the black arrow next to the
“File” icon
126
127
128
129
130
131
132
133
134
135
136
137
138
139
140
141
142
143
144
145
146
147
148
149
150
151
References:
Introduction to GIS (Lecture)
GEOG 255 Lecture note from University of Waterloo
http://www.watleo.uwaterloo.ca/~piwowar/geog255/Geog255.html
Introduction to ArcPad (Lecture and Exercise)
ESRI Virtual Campus (http://campus.esri.com)
GeoXT® Fact Sheets
Trimble Navigation Ltd.©. S unnyvale, CA. 2004.
GeoXT® Frequently Asked Questions.
http://www.trimble.com/geoxt_ts.asp?Nav=Collection-22389
Got a question?
Please do not hesitate to contact us.
Dr. Maria Tchackerian
979-845-9735
[email protected]
Saul Petty
318-473-7062
[email protected]
Knowledge Engineering Laboratory
408 Heep Center
Department of Entomology
Texas A&M University
College Station, TX 77843
USDA Forest Service
Forest Health Protection
2500 Shreveport Highway
Pineville, LA 71360
152
APPENDIX D
PAPER SPBIS DATA COLLECTION FORM
153
The following is the paper SPBIS data collection form. Each “X” represents an essential
field for initial data collection. These fields are represented in the digital form.
154
VITA
Saul David Petty was born to Kirk H. and Sandra D. Petty on September 17, 1980
in Houston, Texas. Saul started elementary school in Needville, Texas in 1986. In 1991
the family moved to Gilmer, Texas where Saul attended school until December of 1996.
In January 1997 the family moved to Joes, Colorado. Saul graduated from Idalia High
School in Idalia, Colorado with honors in May 1999. Saul attended Hill College in
Hillsboro, Texas for one year before transferring to Texas A&M University in College
Station, Texas in August 2000. He received his B.S. in Horticulture from Texas A&M
University in August 2003. He completed his M.S. in Forest Science at Texas A&M
University in May 2005. In July 2003, he began a student internship with the USDA
Forest Service, Forest Health Protection Unit in Pineville, Louisiana. As part of this
internship, he began work on a M.S. degree in Forest Science at Texas A&M University.
Following graduation he will start a permanent position with the Forest Health Protection
Unit in Pineville, Louisiana.
Permanent mailing address:
2637 Lakeside Drive
Burleson, Texas 76028
817.484.2400