1
TRACING AND DEBUGGING
8.2
TRACE MODES
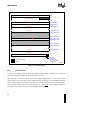
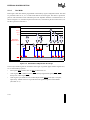
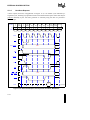
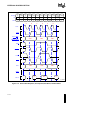
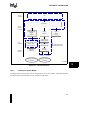
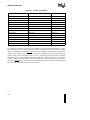
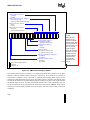
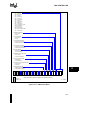
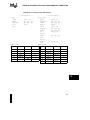
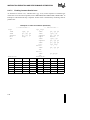
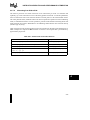
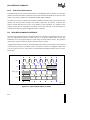
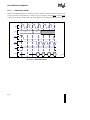
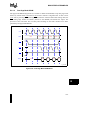
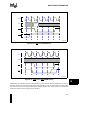
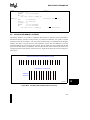
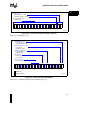
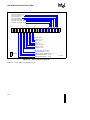
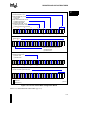
This section defines trace modes enabled through the TC register. These modes can be enabled
individually or several modes can be enabled at once. Some modes overlap, such as call-trace
mode and supervisor-trace mode. section 8.4, “HANDLING MULTIPLE TRACE EVENTS” (pg.
8-8) describes processor function when multiple trace events occur.
•
Instruction trace
•
Branch trace
•
Breakpoint trace
•
Call trace
•
Return trace
•
Supervisor trace
8.2.1
•
Prereturn trace
Instruction Trace
When the instruction-trace mode is enabled, the processor generates an instruction-trace event
each time an instruction executes. A debug monitor can use this mode to single-step the processor.
8.2.2
Branch Trace
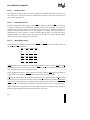
When the branch-trace mode is enabled, the processor generates a branch-trace event when a
branch instruction executes and the branch is taken. A branch-trace event is not generated for
conditional-branch instructions that do not branch for branch-and-link, call or return instructions.
8.2.3
Call Trace
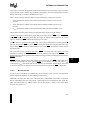
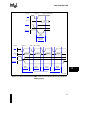
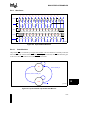
When the call-trace mode is enabled, the processor generates a call-trace event when a call
instruction (call, callx or calls) or a branch-and-link instruction (bal or balx) executes. An
implicit call — such as the action used to invoke a fault handling or an interrupt handling
procedure — also causes a call-trace event to be generated.
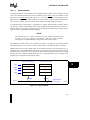
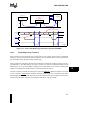
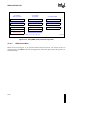
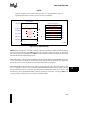
When the processor detects a call-trace event, it sets the prereturn-trace flag (PFP register bit 3) in
the new frame created by the call operation or — if a branch-and-link operation was performed —
it sets this flag in the current frame. The processor uses this flag to determine when to signal a
prereturn-trace event on a ret instruction.
8.2.4
Return Trace
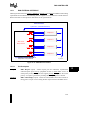
When the return-trace mode is enabled, the processor generates a return-trace event any time a ret
instruction executes.
8-4