1
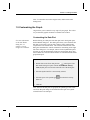
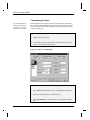
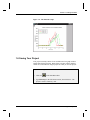
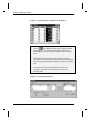
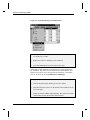
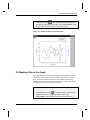
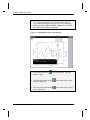
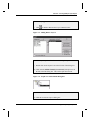
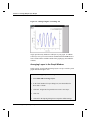
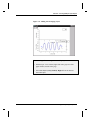
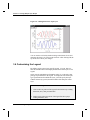
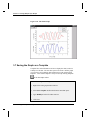
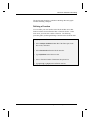
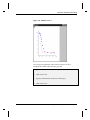
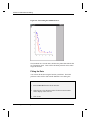
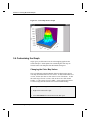
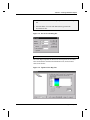
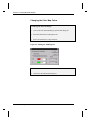
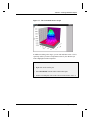
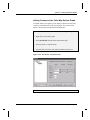
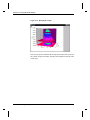
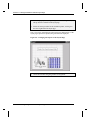
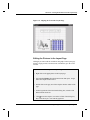
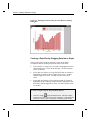
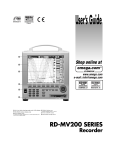
Tutorial 2: Exploring Your Data
4) Click Double Y Axis
on the 2D Graphs Extended toolbar. (To
open the 2D Graphs Extended toolbar, select View:Toolbars, select
the 2D Graphs Extended check box, then click Close.)
Figure 2.6: Plotting a Range of Worksheet Data
2.5 Masking Data in the Graph
The Mask toolbar is provided for excluding data from Origin's analysis
and fitting routines. You can mask individual data points or a range of
data. Once data is masked, options become available to change the
masked data color, hide or show the masked data, swap the masked and
unmasked data, and enable or disable masking.
To Mask a Data Point in the Graph:
1) Click Mask Point Toggle
on the Mask toolbar. This activates
the Data Reader tool. (To open the Mask toolbar, select
View:Toolbars, select the Mask check box, then click Close.)
2.5 Masking Data in the Graph •17