1
HP 64758
70632 Emulator
Terminal Interface
User’s Guide
HP Part No. 64758-97004
Printed in U.S.A.
March, 1993
Edition 2
Notice
Notice
Hewlett-Packard makes no warranty of any kind with regard to
this material, including, but not limited to, the implied warranties
of merchantability and fitness for a particular purpose.
Hewlett-Packard shall not be liable for errors contained herein or for
incidental or consequential damages in connection with the furnishing,
performance, or use of this material.
Hewlett-Packard assumes no responsibility for the use or reliability of
its software on equipment that is not furnished by Hewlett-Packard.
© Copyright 1990,1993 Hewlett-Packard Company.
This document contains proprietary information, which is protected by
copyright. All rights are reserved. No part of this document may be
photocopied, reproduced or translated to another language without the
prior written consent of Hewlett-Packard Company. The information
contained in this document is subject to change without notice.
HP is a trademark of Hewlett Packard Comapny.
UNIX is a registered trademark of UNIX System Laboratories Inc. in
the U.S.A. and other countries.
V70 is trademark of NEC Electronics Inc.
Hewlett-Packard Company
P.O. Box 2197
1900 Garden of the Gods Road
Colorado Springs, CO 80901-2197, U.S.A.
RESTRICTED RIGHTS LEGEND Use, duplication, or disclosure
by the U.S.A. Government is subject to restrictions as set forth in
subparagraph (c)(1)(ii) of the Rights in Technical Data and Computer
Software Clause at DFARS 252.227-7013. Hewlett-Packard Company,
3000 Hanover Street, Palo Alto, CA 94304 U.S.A. Rights for
non-DOD U.S. Government Departments and Agencies are as set forth
in FAR 52.227-19(c)(1,2)
Printing History
New editions are complete revisions of the manual. The date on the
title page changes only when a new edition is published.
A software code may be printed before the date; this indicates the
version level of the software product at the time the manual was issued.
Many product updates and fixes do not require manual changes, and
manual corrections may be done without accompanying product
changes. Therefore, do not expect a one-to-one correspondence
between product updates and manual revisions.
Edition 1
64758-97000, August 1990
Edition 2
64758-97004, April 1993
Using This manual
This manual is designed to give you an introduction to the
HP 64758G/H 70632 Emulator. This manual will also help define how
these emulators differ from other HP 64700 Emulator.
This manual will:
give you an introduction to using the emulator.
explore various ways of applying the emulator to accomplish
your tasks.
show you emulator commands which are specific to the 70632
Emulator.
This manual will not:
tell you how to use each and every emulator/analyzer
command (refer to the User’s Reference manual).
Organization
Chapter 1
Introduction. This chapter lists the 70632 emulator features and
describes how they can help you in developing new hardware and
software.
Chapter 2
Getting Started. This chapter shows you how to use emulation
commands by executing them on a sample program. The chapter
describes the sample program and how to: load programs into the
emulator, map memory, display and modify memory, display registers,
step through programs, run programs, set software breakpoints, search
memory for data, and use the analyzer.
Chapter 3
Virtual Mode Emulation Topics. This chapter shows you how to use
emulator in virtual mode. The chapter describes a sample program and
how to: load programs into the emulator, display on-chip MMU
registers, privilege registers and TCB, set software breakpoints, and use
the analyzer in virtual mode.
Chapter 4
Using the Emulator. This chapter describes emulation topics that are
not covered in the "Getting Started" and "Virtual Mode Emulation
Topics" chapters (for example, coordinated measurements and storing
memory).
Chapter 5
In-Circuit Emulation. This chapter shows you how to plug the
emulator into a target system, and how to use the "in-circuit" emulation
features.
Appendix A
70632 Emulator Specific Command Syntax. This appendic describes
the command syntax which is specific to the 70632 emulator. Included
are: emulator configuration items, address syntax, display and access
mode
Appendix B
Using the Foreground Monitor. This appendix describes the
advantages and disadvantages of foreground and background monitors
and how to use foreground monitors.
Contents
1
Introduction to the 70632 Emulator
Introduction . . . . . . . . . . . . . . . . . . . . .
Purpose of the 70632 Emulator . . . . . . . . . . .
Features of the 70632 Emulator . . . . . . . . . .
Supported Microprocessor . . . . . . . . . . .
Clock Speeds . . . . . . . . . . . . . . . . . .
Emulation Memory . . . . . . . . . . . . . . .
Analysis . . . . . . . . . . . . . . . . . . . . .
FPU . . . . . . . . . . . . . . . . . . . . . . .
MMU . . . . . . . . . . . . . . . . . . . . . .
FRM . . . . . . . . . . . . . . . . . . . . . . .
Registers . . . . . . . . . . . . . . . . . . . . .
Single-Step . . . . . . . . . . . . . . . . . . .
Breakpoints . . . . . . . . . . . . . . . . . . .
Reset Support . . . . . . . . . . . . . . . . . .
Software Debugging . . . . . . . . . . . . . . .
Configurable Target System Interface . . . . .
Real-Time Operation . . . . . . . . . . . . . .
Foreground or Background Emulation Monitor
Out-of-Circuit or In-Circuit Emulation . . . . .
2
.
.
.
.
.
.
.
.
.
.
.
.
.
.
.
.
.
.
.
.
.
.
.
.
.
.
.
.
.
.
.
.
.
.
.
.
.
.
.
.
.
.
.
.
.
.
.
.
.
.
.
.
.
.
.
.
.
.
.
.
.
.
.
.
.
.
.
.
.
.
.
.
.
.
.
.
.
.
.
.
.
.
.
.
.
.
.
.
.
.
.
.
.
.
.
.
.
.
.
.
.
.
.
.
.
.
.
.
.
.
.
.
.
.
.
.
.
.
.
.
.
.
.
.
.
.
.
.
.
.
.
.
.
.
.
.
.
.
.
.
.
.
.
.
.
.
.
.
.
.
.
.
.
.
.
.
.
.
.
.
.
.
.
.
.
.
.
.
.
.
.
1-1
1-1
1-3
1-3
1-3
1-3
1-4
1-4
1-4
1-4
1-4
1-4
1-5
1-5
1-5
1-5
1-5
1-6
1-6
Introduction . . . . . . . . . . . . . . . . . . . . . . . . .
Prerequisites . . . . . . . . . . . . . . . . . . . . . . .
A Look at the Sample Program . . . . . . . . . . . . .
Using the "help" Facility . . . . . . . . . . . . . . . . . .
Becoming Familiar with the System Prompts . . . . .
Initializing the Emulator . . . . . . . . . . . . . . . . . .
Other Types of Initialization . . . . . . . . . . . . . .
Using The Default Emulation Configuration . . . . . . .
Loading Firmware Sample Programs . . . . . . . . . . .
Mapping Memory . . . . . . . . . . . . . . . . . . . .
Loading the Sample Program into Emulation Memory .
Displaying Memory In Mnemonic Format . . . . . . . . .
.
.
.
.
.
.
.
.
.
.
.
.
.
.
.
.
.
.
.
.
.
.
.
.
.
.
.
.
.
.
.
.
.
.
.
.
.
.
.
.
.
.
.
.
.
.
.
.
. 2-1
. 2-2
. 2-2
. 2-6
. 2-7
. 2-8
. 2-9
. 2-9
2-10
2-10
2-14
2-16
Getting Started
Contents-1
Stepping Through the Program . . . . . . . . . . .
Displaying Registers . . . . . . . . . . . . . . . .
Combining Commands . . . . . . . . . . . . .
Using Macros . . . . . . . . . . . . . . . . . .
Command Recall . . . . . . . . . . . . . . . .
Repeating Commands . . . . . . . . . . . . . .
Command Line Editing . . . . . . . . . . . . .
Modifying Memory . . . . . . . . . . . . . . . . .
Specifying the Access and Display Modes . . .
Searching Memory for Data . . . . . . . . . . . .
Breaking into the Monitor . . . . . . . . . . . . .
Using Software Breakpoints . . . . . . . . . . . .
Displaying and Modifying the Break Conditions
Defining a Software Breakpoint . . . . . . . .
Using the Analyzer . . . . . . . . . . . . . . . . .
Predefined Trace Labels . . . . . . . . . . . . .
Predefined Status Equates . . . . . . . . . . . .
Specifying a Simple Trigger . . . . . . . . . .
Trigger Position . . . . . . . . . . . . . . . . .
For a Complete Description . . . . . . . . . . .
Copying Memory . . . . . . . . . . . . . . . . . .
Testing for Coverage . . . . . . . . . . . . . . . .
Resetting the Emulator . . . . . . . . . . . . . . .
3
.
.
.
.
.
.
.
.
.
.
.
.
.
.
.
.
.
.
.
.
.
.
.
.
.
.
.
.
.
.
.
.
.
.
.
.
.
.
.
.
.
.
.
.
.
.
.
.
.
.
.
.
.
.
.
.
.
.
.
.
.
.
.
.
.
.
.
.
.
.
.
.
.
.
.
.
.
.
.
.
.
.
.
.
.
.
.
.
.
.
.
.
.
.
.
.
.
.
.
.
.
.
.
.
.
.
.
.
.
.
.
.
.
.
.
.
.
.
.
.
.
.
.
.
.
.
.
.
.
.
.
.
.
.
.
.
.
.
.
.
.
.
.
.
.
.
.
.
.
.
.
.
.
.
.
.
.
.
.
.
.
2-17
2-18
2-18
2-19
2-19
2-19
2-21
2-21
2-21
2-22
2-23
2-23
2-24
2-24
2-26
2-26
2-26
2-27
2-29
2-30
2-31
2-31
2-33
.
.
.
.
.
.
.
.
.
.
.
.
.
.
.
.
.
.
.
.
.
.
.
.
.
.
.
.
.
.
.
.
.
.
.
.
.
.
.
.
.
.
.
.
.
.
.
.
.
.
.
.
.
.
.
.
.
.
.
.
.
.
.
.
.
.
.
.
.
.
.
.
.
.
.
.
.
.
.
.
.
.
.
.
.
.
.
.
.
.
.
.
.
.
.
.
.
.
.
.
.
.
.
.
.
.
.
.
.
.
.
.
.
.
.
.
.
.
.
.
.
.
.
.
.
.
.
.
. 3-1
. 3-1
. 3-9
3-13
3-15
3-15
3-15
3-17
3-17
3-17
3-17
3-18
3-18
3-19
3-20
3-20
Virtual Mode Emulation Topics
Introduction . . . . . . . . . . . . . . . . . . .
Sample Program for Virtual Mode Emulation .
Multiple Virtual Space of the Sample Program
Sample Program Flow . . . . . . . . . . . . .
Setting Up the Emulator . . . . . . . . . . . .
Using The Emulator In Virtual Mode . . . . .
Address Mode suffixes . . . . . . . . . . .
Setting Breakpoints in Real Address . . . .
Running the Sample Program . . . . . . . .
Displaying the CPU Address Mode . . . . .
Which Breakpoint Has Hit ? . . . . . . . .
Displaying MMU Registers . . . . . . . . .
Displaying Address Translation Tables . .
Continuing the Execution . . . . . . . . . .
Enabling Breakpoints in Virtual Address . .
Setting Breakpoints in Virtual Address . . .
2-Contents
.
.
.
.
.
.
.
.
.
.
.
.
.
.
.
.
.
.
.
.
.
.
.
.
.
.
.
.
.
.
.
.
.
.
.
.
.
.
.
.
.
.
.
.
.
.
.
.
.
.
.
.
.
.
.
Display Privilege registers . . . . . . .
Displaying TCB . . . . . . . . . . . . .
Using the XMMU Function . . . . . . . .
Displaying the XMMU Class Registers .
Modifying the XMMU Class Registers .
Using the Analyzer . . . . . . . . . . . . .
4
.
.
.
.
.
.
.
.
.
.
.
.
.
.
.
.
.
.
.
.
.
.
.
.
.
.
.
.
.
.
.
.
.
.
.
.
.
.
.
.
.
.
.
.
.
.
.
.
.
.
.
.
.
.
.
.
.
.
.
.
.
.
.
.
.
.
.
.
.
.
.
.
3-21
3-21
3-22
3-23
3-23
3-25
Introduction . . . . . . . . . . . . . . . . . . . . . . . . . . . .
Prerequisites . . . . . . . . . . . . . . . . . . . . . . . . . . .
Register Manipulation . . . . . . . . . . . . . . . . . . . . . .
Stack Pointer Modification . . . . . . . . . . . . . . . . . .
Displaying/Modifying Registers In Floating-Format . . . . .
Analyzer Topics . . . . . . . . . . . . . . . . . . . . . . . . .
Analyzer Status Qualifiers . . . . . . . . . . . . . . . . . .
Specifying Trigger Condition at Desired
Instruction Execution . . . . . . . . . . . . . . . . . . . .
Disassembles In Trace Listing . . . . . . . . . . . . . . . .
Execution States Location in Trace Listing . . . . . . . . . .
Specifying Data For Trigger Condition or Store Condition .
Analyzer Clock Speed . . . . . . . . . . . . . . . . . . . .
Finding Out the Cause of a Monitor Break . . . . . . . . . .
Hardware Breakpoints . . . . . . . . . . . . . . . . . . . . . .
Example Configuration for Hardware Breakpoints Features.
Software Breakpoints . . . . . . . . . . . . . . . . . . . . . . .
Target Memory Access . . . . . . . . . . . . . . . . . . . . .
Commands Not Allowed when Real-Time Mode is Enabled
Breaking out of Real-Time Execution . . . . . . . . . . . .
FPU Support . . . . . . . . . . . . . . . . . . . . . . . . . . .
MMU Support . . . . . . . . . . . . . . . . . . . . . . . . . .
Making Coordinated Measurements . . . . . . . . . . . . . . .
Unfamiliar Prompts . . . . . . . . . . . . . . . . . . . . . . .
Waiting for Target Ready . . . . . . . . . . . . . . . . . . .
Halt or Machine Fault . . . . . . . . . . . . . . . . . . . . .
70108/70116 Emulation Mode . . . . . . . . . . . . . . . . . .
Displaying Memory In 70108/70116 Mnemonic Format . . .
Single-stepping . . . . . . . . . . . . . . . . . . . . . . . .
Tracing States In Both Mode . . . . . . . . . . . . . . . . .
Real-time Emulation Memory Access . . . . . . . . . . . . . .
Virtual Address Translation . . . . . . . . . . . . . . . . . . .
Using the Caches of Area Table Register Pairs . . . . . . . .
.
.
.
.
.
.
.
.
.
.
.
.
.
.
.
.
.
.
.
.
.
.
.
.
.
.
.
.
.
.
.
.
.
.
.
.
.
.
.
. 4-4
. 4-5
. 4-6
. 4-7
. 4-8
4-10
4-11
4-12
4-14
4-16
4-16
4-17
4-17
4-18
4-19
4-19
4-20
4-20
4-21
4-21
4-21
4-21
4-22
4-23
4-23
Using The Emulator
4-1
4-2
4-2
4-2
4-3
4-4
4-4
Contents-3
Specifying Virtual Address Space . . . . . . . . . . . . . . . 4-24
Restrictionas and Considerations . . . . . . . . . . . . . . . . . . 4-26
5
In-Circuit Emulation Topics
Introduction . . . . . . . . . . . . . . . . . . . . . .
Prerequisites . . . . . . . . . . . . . . . . . . . . .
Installing the Emulator Probe into a Target System .
Pin Protector . . . . . . . . . . . . . . . . . . . .
Conductive Pin Guard . . . . . . . . . . . . . . .
Installing the Target System Probe . . . . . . . .
In-Circuit Configuration Options . . . . . . . . .
Allowing the Target System to Insert Wait States
Target ROM Debug Topics . . . . . . . . . . . . . .
Using Software Breakpoints with ROMed Code .
Coverage Testing ROMed Code . . . . . . . . .
Modifying ROMed Code . . . . . . . . . . . . .
User Interrupts . . . . . . . . . . . . . . . . . . . .
DMA Operation . . . . . . . . . . . . . . . . . . .
The Usage of I/O Command . . . . . . . . . . . . .
FRM Function . . . . . . . . . . . . . . . . . . . .
Pin State on Emulation Probe . . . . . . . . . . . .
Target system Interface . . . . . . . . . . . . . . . .
A
.
.
.
.
.
.
.
.
.
.
.
.
.
.
.
.
.
.
.
.
.
.
.
.
.
.
.
.
.
.
.
.
.
.
.
.
.
.
.
.
.
.
.
.
.
.
.
.
.
.
.
.
.
.
.
.
.
.
.
.
.
.
.
.
.
.
.
.
.
.
.
.
.
.
.
.
.
.
.
.
.
.
.
.
.
.
.
.
.
.
.
.
.
.
.
.
.
.
.
.
.
.
.
.
.
.
.
.
. 5-1
. 5-2
. 5-2
. 5-3
. 5-3
. 5-5
. 5-5
. 5-7
. 5-7
. 5-8
. 5-8
. 5-8
. 5-9
5-10
5-10
5-11
5-12
5-14
.
.
.
.
.
.
.
.
.
.
.
.
.
.
.
.
.
.
.
.
.
.
.
.
.
.
.
.
.
.
.
.
.
.
.
.
.
.
.
.
.
.
.
.
.
.
.
.
.
.
.
.
.
.
.
.
.
.
.
.
.
.
.
.
.
.
.
.
.
.
.
.
.
.
.
.
.
. A-3
. A-5
. A-8
A-15
A-17
A-19
A-21
A-23
A-25
A-27
A-28
70632 Emulator Specific Command Symtax
ACCESS_MODE . . . . . . . .
ADDRESS . . . . . . . . . . .
CONFIG_ITEMS . . . . . . . .
DISPLAY_MODE . . . . . . .
REGISTER CLASS and NAME
ate . . . . . . . . . . . . . . . .
pte . . . . . . . . . . . . . . . .
freg . . . . . . . . . . . . . . .
tcb . . . . . . . . . . . . . . . .
cpmmu . . . . . . . . . . . . .
Error and Status Message . . . .
B
.
.
.
.
.
.
.
.
.
.
.
.
.
.
.
.
.
.
.
.
.
.
.
.
.
.
.
.
.
.
.
.
.
.
.
.
.
.
.
.
.
.
.
.
.
.
.
.
.
.
.
.
.
.
.
.
.
.
.
.
.
.
.
.
.
.
.
.
.
.
.
.
.
.
.
.
.
.
.
.
.
.
.
.
.
.
.
.
.
.
.
.
.
.
.
.
.
.
.
.
.
.
.
.
.
.
.
.
.
.
.
.
.
.
.
.
.
.
.
.
.
.
.
.
.
.
.
.
.
.
.
.
.
.
.
.
.
.
.
Using the Foreground Monitor
Comparison of Foreground and Background Monitors . . . . . . . B-1
Background Monitors . . . . . . . . . . . . . . . . . . . . . . . B-1
Foreground Monitors . . . . . . . . . . . . . . . . . . . . . . . B-2
4-Contents
Foreground Monitor Selection . . . . . . . . . . . . . . . . .
Using Built-in Foreground monitor . . . . . . . . . . . . . .
Interrupt/Exception Handler . . . . . . . . . . . . . . . .
Using Custom Foreground monitor . . . . . . . . . . . . . .
Interrupt/Exception Handler . . . . . . . . . . . . . . . .
Loading Foreground Monitor . . . . . . . . . . . . . . . .
Loading User Program . . . . . . . . . . . . . . . . . . . . .
Loading into Target Memory . . . . . . . . . . . . . . . .
Loading into Emulation Memory . . . . . . . . . . . . . .
Restrictions and Considerations . . . . . . . . . . . . . . . .
An Example Configuration of the Foreground Monitor . . . .
Modify Monitor Source Program . . . . . . . . . . . . . .
Defining System Base Table in Your Program . . . . . . .
Defining Address Translation Tables for Monitor Program
Assembling and Linking the Foreground Monitor . . . . .
Setting Up the Monitor Configuration Item . . . . . . . . .
Mapping Memory for Your Program . . . . . . . . . . . .
Loading Foreground Monitor . . . . . . . . . . . . . . . .
Loading User Program . . . . . . . . . . . . . . . . . . .
.
.
.
.
.
.
.
.
.
.
.
.
.
.
.
.
.
.
.
.
.
.
.
.
.
.
.
.
.
.
.
.
.
.
.
.
.
.
. B-2
. B-3
. B-3
. B-4
. B-4
. B-5
. B-6
. B-6
. B-6
. B-7
. B-8
. B-8
. B-8
. B-8
. B-9
. B-9
. B-9
. B-9
B-10
.
.
.
.
.
.
.
.
.
.
.
.
.
.
.
.
. 1-2
. 2-3
. 3-2
3-10
3-11
3-12
3-14
. 5-4
Index
Illustrations
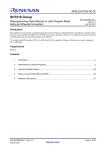
Figure 1-1. HP 64758 Emulator for the 70632 . . . . . .
Figure 2-1. Sample Program Listing . . . . . . . . . . .
Figure 3-1. Sample Program Listing . . . . . . . . . . .
Figure 3-2. Virtual Address Space for Sample Program .
Figure 3-3. Mapping of the Sample Operating System .
Figure 3-4. Mapping of the Tasks . . . . . . . . . . . .
Figure 3-5. The Execution Flows of the Sample Program
Figure 5-1. Installing Emulation Probe Into PGA Socket
.
.
.
.
.
.
.
.
.
.
.
.
.
.
.
.
.
.
.
.
.
.
.
.
Contents-5
Notes
6-Contents
1
Introduction to the 70632 Emulator
Introduction
The topics in the this chapter include:
Purpose of the emulator
Features of the emulator
Purpose of the
70632 Emulator
The 70632 emulator is designed to replace the NEC uPD70632
microprocessor in your target system to help you integrate target
system software and hardware. The 70632 emulator performs just like
the NEC uPD70632 microprocessor, but at the same time, it gives you
information about the operation of the processor. The emulator gives
you control over target system execution and allows you to view or
modify the contents of processor registers and, target system memory.
Introduction 1-1
Figure 1-1. HP 64758 Emulator for the 70632
1-2 Introduction
Features of the
70632 Emulator
Supported
Microprocessor
Clock Speeds
Emulation Memory
The emulator probe has a 132-pin PGA connector. The HP 64758G/H
emulator supports the NEC uPD70632 microprocessor.
Measurements can be made using the emulator’s internal 20 MHz
clock or an external clock from 8 MHz to 20 MHz with no wait states
added to target memory.
Depending on the emulator model number, there are 512K/1M bytes of
emulation memory. Memory mapping configuration maps physical
memory only. If the MMU is enabled, the user is responsible for
knowing user physical memory usage.
Dual-ported memory allows you to display or modify physical
emulation memory without stopping the processor. Flexible memory
mapping lets you define address ranges over the entire 4 Gbyte address
range of the 70632. You can define up to 8 memory ranges (at 4 Kbyte
boundaries and at least 4Kbytes in length). The monitor occupies 4K
bytes leaving 508K or 1020K bytes of emulation memory which you
may use. You can characterize memory ranges as emulation RAM,
emulation ROM, target system RAM, target system ROM, or as
guarded memory. The emulator generates an error message when
accesses are made to guarded memory locations; additionally, you can
configure the emulator so that writes to memory defined as ROM cause
emulator execution to break out of target program execution. You can
select whether the memory accesses honor /READY and /BERR
signals from target system for each emulation memory range.
Introduction 1-3
Analysis
The integrated emulation bus analyzer provides real-time analysis of all
bus-cycle activity. You can define break conditions based on address
and data bus cycle activity. In addition to hardware break, software
breakpoints can be used for execution breakpoints.
The 70632 microprocessor has on-chip MMU which provides a 4
Giga-byte virtual space for each task. When you use the on-chip MMU,
you will want to analyze either actual or virtual address space. You can
configure which address space should be recognized by the emulation
analyzer. Analysis functions include trigger, storage, count, and
context directives. The analyzer can capture up to 1024 events,
including all address, data, and status lines.
FPU
The emulation bus analyzer can capture bus states accessing to a
Floating Point Processor.
MMU
The emulator will support development when using the internal
Memory Management Unit.
FRM
The emulator supports the master mode of the 70632 FRM function. In
the master mode, you can use the analyzer feature of the emulator. If
signal is asserted by your target system, the emulator bus signals are
held. So the emulator does not work as checker.
Registers
You can display or modify the 70632 internal CPU register contents.
This includes the ability to modify the program counter (PC) value so
you can control where the emulator starts a program run. You can also
display or modify the 70632 MMU register contents.
Single-Step
You can direct the emulation processor to execute a single instruction
or a specified number of instructions.
1-4 Introduction
Breakpoints
Reset Support
You can set the emulator/analyzer interaction so the emulator will
break to the monitor program when the analyzer finds a specific state
or states, allowing you to perform post-mortem analysis of the program
execution. You can also set software breakpoints in your program.
With the 70632 emulator, setting a software breakpoint inserts a 70632
BRK instruction into your program at the desired location.
The emulator can be reset from the emulation system under your
control; or your target system can reset the emulation processor.
Software Debugging
The HP 64758G/H Real-Time Emulator for 70632 microprocessors is a
powerful tool for both software and hardware designers. Using the HP
64758G/H Emulator’s emulation memory (up to 512 Kilo/1 Mega
bytes), software debugging can be done without functional target
system memory.
Configurable Target
System Interface
You can configure the emulator so that it honors target system wait and
retry requests when accessing emulation memory. Additionally, the
processor signals /READY, /BERR, BFREZ, RT/EP, /NMI, INT, and
/HLDRQ may be enabled or disabled independently of the 70632
processor.
Real-Time Operation
Real-time signifies continuous execution of your program at full rated
processor speed without interference from the emulator. (Such
interference occurs when the emulator needs to break to the monitor to
perform an action you requested, such as displaying target system
memory.) Emulator features performed in real time include: running
and analyzer tracing. Emulator features not performed in real time
include: display or modify of target system memory; load/dump of
target memory, and display or modification of registers and some
virtual related functionality.
Introduction 1-5
Foreground or
Background
Emulation Monitor
The emulation monitor is a program executed by the emulation
processor. It allows the emulation controller to access target system
resources. For example, when you display target system memory, the
monitor program executes 70632 instructions to read the target
memory locations and send their contents to the emulation controller.
The monitor program can execute in foreground, the mode in which
the emulator operates as would the target processor. The foreground
monitor occupies processor address space and executes as if it were
part of the target program.
The monitor program also can execute in background, the emulator
mode in which foreground operation is suspended so the emulation
processor can access target system resources. The background monitor
does not occupy processor address space.
Out-of-Circuit or
In-Circuit Emulation
1-6 Introduction
The 70632 emulator can be used for both out-of-circuit emulation and
in-circuit emulation. The emulation can be used in multiple emulation
systems using other HP 64700 Series emulators/analyzers.
2
Getting Started
Introduction
This chapter lead you through a basic, step by step tutorial designed to
familiarize you with the HP 64758G/H emulator for the 70632
microprocessor in real mode.
This chapter:
Describes the sample program used for this chapter’s
examples.
Shows you how to use the "help" facility.
Shows you how to map memory.
Shows you how to enter emulation commands to view
execution of the sample program. The commands described
in this chapter include:
– displaying and modifying memory,
– stepping,
– displaying registers,
– defining breaking, using software breakpoints,
– tracing program execution,
– copying memory,
– and testing coverage.
This chapter does not:
Describe any virtual mode debbugging informations.
The description for virtual mode emulation is shown in the "Virtual
Mode Emulation Topics" chapter.
Getting Started 2-1
Before You begin
Before beginning the tutorial presented in this chapter, you must have
completed the following tasks:
1. Completed hardware installation of the HP 64700 emulator in
the configuration you intend to use for your work;
– Standalone configuration
– Transparent configuration
– Remoto configuration
– Local Area Network configuration
Reference:HP 64700 Series Installation/Service manual
2. If you are using the Remote configuration, you must have
completed installation and configuration of a terminal
emulator program which will allow your host to act as a
terminal xonnected to the emulator. In addition, you must start
the termunal emulator program before you can work thr
examples in this chapter.
3. If you have properly completed step 1 above, you should be
able to hit <RETURN> (or <ENTER> on some keyboards)
and get one of the following command prompts on your
terminal screen.:
U>
R>
M>
If you do not see one of these command prompts, retrace your
steps through the hardware installation procedure outlined in
the manual referenced above, verifying all connections and
procedural steps.
In any case, you must have a command prompt on your
terminal screen before proceeding with the tutorial.
A Look at the Sample
Program
2-2 Getting Started
The sample program used in this chapter is listed in figure 2-1. The
program emulates a primitive command interpreter.
#cmd_rds.s
D 00000000
.file
"cmd_rds.s"
D 00000000
D 00000000
.equ
.equ
Dest_Size,0x30
Stack_Size,0x100
D 00000000
D 00000000
D 00000034 6D000100
.data
.org
.word
"sbt" (RW) >0x00000000
.+0x34
Dummy_Text
T 00010000
T 00010000
.text (RX) >0x00010000
.align 4
T
T
T
T
00010000
00010007
0001000E
00010015
Init:
mov.w
movea.w
movea.w
mov.b
#Stack+Stack_Size,sp
Command_Input,r0
Message_Dest,r1
#’ ’,r26
T 00010019 0980E060
Clear:
mov.b
#0x00,[r0]
T 0001001D 092260
T 00010020 B822E0
T 00010023 64FA
Read_Input:
mov.b
cmp.b
je
[r0],r2
#0x00,r2
Read_Input
T
T
T
T
T
Process_Comm:
cmp.b
je
cmp.b
je
jr
#’A’,r2
Command_A
#’B’,r2
Command_B
Unrecognized
T 00010033 4423F2CDFF0000
T 0001003A 2D24F411000000
T 00010041 6A20
Command_A:
movea.w Message_A,r3
mov.w
#Message_B-Message_A,r4
jr
Output
T 00010043 4423F2CEFF0000
T 0001004A 2D24F411000000
T 00010051 6A10
Command_B:
movea.w Message_B,r3
mov.w
#Invalid_Input-Message_B,r4
jr
Output
T 00010053 4423F2CFFF0000
T 0001005A 2D24F40F000000
Unrecognized:
movea.w Invalid_Input,r3
mov.w
#Message_End-Invalid_Input,r4
T 00010061 588A6384F2A3FF01
0030
T 0001006B 6AAE
Output:
movcfu.b [r3],r4,Message_Dest,#Dest_Size
T 0001006D 00
Dummy_Text:
00010025
00010029
0001002B
0001002F
00010031
2D3FF434010300
4420F2F9FF0100
4421F2F6FF0100
093AF420
B822F441
640A
B822F442
6414
6A22
jr
D 00020000
Clear
halt
.data (R) >0x00020000
D 00020000 5448495320495320
4D45535341474520
41
D 00020011 5448495320495320
4D45535341474520
42
D 00020022 494E56414C494420
434F4D4D414E44
D 00020031
Message_A:
.str
"THIS IS MESSAGE A"
Message_B:
.str
"THIS IS MESSAGE B"
Invalid_Input:
.str
"INVALID COMMAND"
Message_End:
Figure 2-1. Sample Program Listing
Getting Started 2-3
B
B
B
B
00030000
00030000
00030004
00030034
.bss (RW) >0x00030000
.lcomm Command_Input, 4,4
.lcomm Message_Dest,Dest_Size,4
.lcomm Stack,Stack_Size,4
Figure 2-1. Sample Program Listing (Cont’d)
System Base Table
The "sbt" section defines 70632 System Base Table containing the
vectors for 70632 interrupts and exceptions. The sample program
defines BRK instruction vector pointing to an address in the "text"
section. This is requirement for emulation software breakpoints feature.
Refer to "Using Software Breakpoints" section in this chapter for
details.
Data Declarations
The "data" section defines the messages used by the program to
respond to various command inputs. These messages are labeled
Message_A, Message_B, and Message_I.
The Destination Area
The "bss" section declares memory storage for the command input byte
(Command_Input), the destination area (Message_Dest), and the
stack area.
Initialization
The program instructions from the Init label to the Clear label perform
initialization. The stack pointer is set up and the addresses labeled
Command_Input and Message_Dest are loaded into registers; R0 and
R1.
Register R26 is set up to 20H for filling remaining locations after
transferring a message to the destination area (Message_Dest) with
blank.
2-4 Getting Started
Reading Input
The instruction at the Clear label clears any random data or previous
commands from the Cmd_Input byte. The Read_Input loop
continually reads the Cmd_Input byte to see if a command is entered
(a value other than 0H).
Processing Commands
When a command is entered, the instructions from Process_Comm to
Command_A determine whether the command was "A", "B", or an
invalid command.
If the command input byte is "A" (ASCII 41H), execution is transferred
to the instructions at Command_A.
If the command input byte is "B" (ASCII 42H), execution is transferred
to the instructions at Command_B.
If the command input byte is neither "A" nor "B", an invalid command
has been entered, and execution is transferred to the instructions at
Unrecognized.
The instructions at Command_A, Command_B, and Unrecognized
each load register R3 with the starting location of the appropriate
message and register R4 with the length of the message to be
displayed. Then, execution transfers to Output which writes the
appropriate message to the destination location, Message_Dest. At the
same time, the remaining locations are filled with blanks; the content
of register R26.
Then, the program jumps back to read the next command.
Getting Started 2-5
Using the "help"
Facility
The HP 64700 Series emulator’s Terminal Interface provides an
excellent help facility to provide you with quick information on the
various commands and their options. From any system prompt, you
can enter "help" or "?" as shown below.
R>help
help
- display help information
help <group>
help -s <group>
help <command>
help
-
print
print
print
print
help for desired group
short help for desired group
help for desired command
this help screen
--- VALID <group> NAMES --gram
- system grammar
proc
- processor specific grammar
sys
emul
trc
*
-
system commands
emulation commands
analyzer trace commands
all command groups
Commands are grouped into various classes. To see the commands
grouped into a particular class, you can use the help command with that
group. Viewing the group help information in short form will cause the
commands or the grammar to be listed without any description. For
example, if you want to get some information for group gram, enter
"help gram". Following help information should be displayed.
R>help gram
gram - system grammar
------------------------------------------------------------------------------- SPECIAL CHARACTERS --# - comment delimiter
; - command separator
Ctl C - abort signal
{} - command grouping
"" - ascii string
‘‘
- ascii string
Ctl R - command recall
Ctl B - recall backwards
--- EXPRESSION EVALUATOR --number bases: t-ten
y-binary
q-octal
o-octal
h-hex
repetition and time counts default to decimal - all else default to hex
operators:
() ~ * / % + - << <<< >> >>> & ^ | &&
--- PARAMETER SUBSTITUTION --&token& - pseudo-parameter included in macro definition
- cannot contain any white space between & pairs
- performs positional substitution when macro is invoked
Example
Macro definition: mac getfile={load -hbs"transfer -t &file&"}
Macro invocation: getfile MYFILE.o
Expanded command: load -hbs"transfer -t MYFILE.o"
Help information exists for each command. Additionally, there is help
information for each of the emulator configuration items.
2-6 Getting Started
Becoming Familiar
with the System
Prompts
A number of prompts are used by the HP 64700 Series emulators.
Each of them has a different meaning, and contains information about
the status of the emulator before and after the commands execute.
These prompts may seem cryptic at first, but there are two ways you
can find out what a certain prompt means if you are not familiar with it.
Using "help proc" to View Prompt Description
The first way you can find information on the various system prompts
is to look at the proc help text.
R>help proc
--- Address format --32 bit address for memory with optional function code.
An address is usually interpreted as real unless the function
code contains a ’v’ specifying a virtual or real address.
Address format is either XXXXXXXX or XXXXXXXX@fc where
XXXXXXXX is a 32 bit address and fc is any of the following:
r - real
v - virtual
--- Address range format --32 bit address thru 32 bit address with optional function codes.
Address range format is any of the following:
XXXXXXXX..XXXXXXXX
XXXXXXXX..XXXXXXXX@fc
--- Emulation Status Characters --R - emulator in reset state
U - running user program
M - running monitor program
W - waiting for CMB to become ready
T - waiting for target reset
g - frozen or held or in checker mode
? - unknown state
--- Equates
base
coprd
data
datawr
fetch
fault
halt
int
iord
lock
retry
shortrd trans
transwr -
c
r
h
w
b
i
for Analyzer Label stat --system base table
coproc
co processor read
copwr
data cycle
datard
data write
exe
instruction fetch
fetchbr
machine fault
grd
halt acknowledge
hold
interrupt acknowledge io
io read
iowr
bus lock
mon
retry cycle
short
data short read
shortwr
translation table
transrd
trans. table write
wrrom
[email protected]@fc
-
no target system clock
target system reset active
halt or machine fault
waiting for target ready
no bus cycles
invalid virtual cpu
-
co processor cycle
co processor write
data read
instruction execution
fetch after branch
guarded access
hold tag
io cycle
io write
background cycle
data short cycle
data short write
trans. table read
write to rom
Getting Started 2-7
Using the Emulation Status Command (es) for Description
of Current Prompt
When using the emulator, you will notice that the prompt changes after
entering certain commands. If you are not familiar with a new prompt
and would like information about that prompt only, enter the es
(emulation status) command for more information about the status of
the emulator.
U>es
N70632--Running user program
Initializing the
Emulator
If you plan to follow this tutorial by entering commands on your
emulator as shown in this chapter, verify that no one else is using the
emulator. To initialize the emulator, enter the following command:
R>init
# Limited initialization completed
The init command with no options causes a limited initialization, also
known as a warm start initialization. Warm start initialization does not
affect system configuration. However, the init command will reset
emulator and analyzer configurations. The init command:
Resets the memory map.
Resets the emulator configuration items.
Resets the break conditions.
Clears software breakpoints.
The init command does not:
Clear any macros.
Clear any emulation memory locations; mapper terms are
deleted, but if you respecify the mapper terms, you will find
that the emulation memory contents are the same.
2-8 Getting Started
Other Types of
Initialization
There are two options to the init command which specify other types of
initializations. The -p option specifies a powerup initialization, also
known as a cold start initialization. The cold start initialization
sequence includes the emulator, analyzer, system controller, and
communications port initialization; additionally, performance
verification tests are run.
The -c option also specifies a cold start initialization, except that
performance verification tests are not run.
Using The Default
Emulation
Configuration
Emulation configuration is needed adapting to your specific
development. To view the items of emulation configuration, enter:
R>help cf
You will see:
cf - display or set emulation configuration
cf
- display current settings for all config items
cf <item>
- display current setting for specified <item>
cf <item>=<value> - set new <value> for specified <item>
cf <item> <item>=<value> <item> - set and display can be combined
help cf <item>
- display long help for specified <item>
--- VALID CONFIGURATION <item> NAMES --clk - select internal/external clock source
rrt - enable/disable restriction to real time runs
mil - selection of memory inverse assembler
mon - selection of a foreground or background monitor
dbc - en/dis drive of background cycles to the target system
bbk - select memory block during background operation
th
- en/dis Target /HLDRQ signal
tbf - en/dis Target /BFREZ signal
ti
- en/dis Target INT signal
tn
- en/dis Target /NMI signal
trh - en/dis emulation analyzer tag of the bus hold handshake
tre - en/dis emulation analyzer trace execution cycles
tra - select virtual / real address trace
loa - select virtual / real address for file loading
To view the current emulation configuration, enter:
R>cf
Getting Started 2-9
As you have initialized the emulator, the emulation configuration items
have the default value. So you should see the default configuration
values as follows.
cf
cf
cf
cf
cf
cf
cf
cf
cf
cf
cf
cf
cf
cf
clk=int
rrt=dis
mil=v70
mon=bg
dbc=dis
bbk=0
th=en
tbf=en
ti=en
tn=en
trh=en
tre=en
tra=real
loa=real
Since the default configuration is sufficient to execute the sample
program, you don’t have to change any configuration items in this
tutorial.
Loading Firmware
Sample Programs
For convenience of demonstration, two sample programs are included
in the emulator, one for this chapter and the other for next chapter.
Usually, you need to map memory and load program into the memory
after configuring the emulator.
You don’t have to enter the commands in the following two
sections ( "Mapping Memory" and "Loading the Sample Program into
Emulation Memory" sections).
Enter the following command instead.
R>demo 1
The "demo" command performs the same as the commands will do.
However, you should read through the sections to learn how to map
memory and load program for debugging your development.
Mapping Memory
2-10 Getting Started
Depending on the emulator model number, emulation memory consists
of 512K or 1M bytes, mappable in 4K byte blocks. The monitor
occupies 4K bytes, leaving 508K or 1020K bytes of emulation memory
which you may use. You can examine the emulation memory size of
your emulator, type:
R>ver
The resulting display includes the information of emulation memory
size. If your emulator’s model number is:
HP64758G, you’ll find:
Memory:
508 KBytes Emulation Memory
Memory:
1020 KBytes Emulation Memory
HP64758H, you’ll find:
By default, the emulation memory system does not introduce wait
states. The memory mapper allows you to characterize memory
locations. It allows you specify whether a certain range of memory is
present in the target system or whether you will be using emulation
memory for that address range. You can also specify whether the target
system memory is ROM or RAM, and you can specify that emulation
memory be treated as ROM or RAM. If you are using the emulator in
in-circuit, additionally; you can choose whether the emulation accesses
honor /READY or /BERR signals from the target system (wait or retry
cycles are inserted if requested).
Note
Target system access to emulation memory is not allowed. Target
system devices that take control of the bus (for example, coprocessors
or external DMA controllers) cannot access emulation memory.
Blocks of memory can also be characterized as guarded memory.
Guarded memory accesses will generate "break to monitor" requests.
Writes to ROM will generate "break to monitor" requests if the rom
break condition is enabled. Memory is mapped with the map
command. To view the memory mapping options, enter:
R>help map
Getting Started 2-11
map - display or modify the processor memory map
map
map
map
map
map
- display the current map structure
<addr>..<addr> <type> <attrib> - define address range as memory type
other <type>
- define all other ranges as memory type
-d <term#>
- delete specified map term
-d *
- delete all map terms
--- VALID <type> OPTIONS --eram - emulation ram
erom - emulation rom
tram - target ram
trom - target rom
grd - guarded memory
--- VALID <attrib> OPTIONS --<none> - do not see /READY and /BERR signal during emulation memory cycles
lock
- see READY , BERR and RT/EP signal during emulation memory cycles
Enter the map command with no options to view the default map
structure.
R>map
# remaining number of terms
# remaining emulation memory
map other tram
: 8
: 7f000h bytes
If your emulator’s model number is HP64758B, the size of remaining
emulation memory will be displayed "0ff000h bytes" instead of
"7f000h bytes".
Mapping the Appropriate Memory Location
The sample program consists of four sections; the system base table
area named "sbt", the program area named "text", the data area named
"data", the destination area named "bss".
The sbt area which contains 70632 System Base Table occupies
locations 0 through 4ffH. The program area ("text" section), which
contains the opcodes and operands which make up the sample program,
occupies locations 10000H through 1006dH. The data area ("data"
section), which contains the ASCII values of the messages the program
transfers, occupies locations 20000H through 20031H. The destination
area ("bss" section), which contains the command input byte and the
locations of the message destination, occupies locations 30000H
through 30117H.
2-12 Getting Started
Since the program writes to the destination locations, the mapper block
of destination area should not be characterized as ROM memory.
Enter the following commands to map memory for the sample program.
R>map
R>map
R>map
R>map
0..4ff erom
10000..1006c erom
20000..20031 erom
30000..30117 eram
By default, unmapped area attribute is defined as target RAM.
However, when emulation without plugging the emulator into your
target system, unmapped area should be defined as "guarded" to detect
the illegal accesses to the area.
R>map other grd
To confirm the memory map you’ve just done.
R>map
# remaining number of terms
# remaining emulation memory
map 000000000..000000fff@r
map 000010000..000010fff@r
map 000020000..000020fff@r
map 000030000..000030fff@r
map other grd
: 4
: 7b000h bytes
eram
# term 1
erom
# term 2
erom
# term 3
eram
# term 4
As you can see, the mapper rounded up the second term to 4 Kbytes
blocks, since those are minimum size blocks supported by the 70632
emulator.
When mapping memory for your target system programs, you may
wish to characterize emulation memory locations containing programs
and constants (locations which should not be written to) as ROM. This
will prevent programs and constants from being written over
accidentally, and will cause breaks when instructions or commands
attempt to do so (if the rom break condition is enabled).
Note
Software breakpoints should be removed before altering the memory
map. If they are NOT, BRK instructions will be left at unknown
locations.
Getting Started 2-13
Loading the Sample
Program into
Emulation Memory
This section assumes you are using the emulator in one of three
configurations:
1. Connected only to a terminal, which is called the standalone
configuration. In the standalone configuration, you must
modify memory to load the sample program.
2. Connected between a terminal and a host computer, which is
called the transparent configuration. In the transparent
configuration, you can load the sample program by
downloading from the "other" port.
3. Connected to a host computer and accessed via a terminal
emulation program (for example, the terminal window of the
PC Interface). Configurations in which the emulator is
connected to, and accessed from, a host computer are called
remote configurations. In the remote configuration, you can
load the sample program by downloading from the same port.
Standalone Configuration
If you are operating the emulator in the standalone configuration, the
only way to get the sample program into emulation memory is by
modifying emulation memory locations with the m (memory
display/modification) command. You can enter the sample program
into memory with the m command.
Transparent Configuration
If your emulator is connected between a terminal and a host computer,
you can download programs into memory using the load command
with the -o (from other port) option. The load command will accept
absolute files in the following formats:
HP absolute.
Intel hexadecimal.
Tektronix hexadecimal.
Motorola S-records.
The examples which follow will show you the methods used to
download HP absolute files and the other types of absolute files.
2-14 Getting Started
HP Absolutes Downloading HP format absolute files requires the
transfer protocol. The example below assumes that the transfer utility
has been installed on the host computer (HP 64884 for HP 9000 Series
500, or HP 64885 for HP 9000 Series 300).
Note
Notice that the transfer command on the host computer is terminated
with the <ESCAPE>g characters; by default, these are the characters
which temporarily suspend the transparent mode to allow the emulator
to receive data or commands.
R>load -hbo <RETURN> <RETURN>
$ transfer -rtb cmd_rds.X <ESCAPE>g
#####
R>
Other Supported Absolute Files The example which follows
shows how to download Intel hexadecimal files, but the same method
(and a different load option) can be used to load Tektronix
hexadecimal and Motorola S-record files as well.
R>load -io <RETURN> <RETURN>
$ cat ihexfile <ESCAPE>g
#####
Data records = 00003
R>
Checksum error = 00000
Remote Configuration
If the emulator is connected to a host computer, and you are accessing
the emulator from the host computer via a terminal emulation program,
you can also download files with the load command. However, in the
remote configuration, files are loaded from the same port that
commands are entered from. For example, if you wish to download a
Tektronix hexadecimal file from a Vectra personal computer, you
would enter the following commands.
R>load -t <RETURN>
After you have entered the load command, exit from the terminal
emulation program to the MS-DOS operating system. Then, copy your
hexadecimal file to the port connected to the emulator, for example:
Getting Started 2-15
C:\copy thexfile com1: <RETURN>
Now you can return to the terminal emulation program and verify that
the file was loaded.
For More Information
For more information on downloading absolute files, refer to the load
command description in the HP 64700 Emulators Terminal Interface:
User’s Reference manual.
Displaying
Memory In
Mnemonic Format
Once you have loaded a program into the emulator, you can verify that
the program has indeed been loaded by displaying memory in
mnemonic format.
R>m -dm 10000..1006c
000010000@r
000010007@r
00001000e@r
000010015@r
000010019@r
00001001d@r
000010020@r
000010023@r
000010025@r
000010029@r
00001002b@r
00001002f@r
000010031@r
000010033@r
00001003a@r
000010041@r
000010043@r
00001004a@r
000010051@r
000010053@r
00001005a@r
000010061@r
00001006b@r
-
MOV.W
MOVEA.W
MOVEA.W
MOV.B
MOV.B
MOV.B
CMP.B
BE/Z
CMP.B
BE/Z
CMP.B
BE/Z
BR
MOVEA.W
MOV.W
BR
MOVEA.W
MOV.W
BR
MOVEA.W
MOV.W
MOVCFU.B
BR
#00030134H,SP
00030000H,R0
00030004H,R1
#20H,R26
#0H,[R0]
[R0],R2
#0H,R2
0001001dH
#41H,R2
00010033H
#42H,R2
00010043H
00010053H
00020000H,R3
#00000011H,R4
00010061H
00020011H,R3
#00000011H,R4
00010061H
00020022H,R3
#0000000fH,R4
[R3],R4,00030004H,#30H
00010019H
To display in processor mnemonics, the -dm option was used. You can
specify one of display modes with the option like this; -d followed by
one character. It allows you to display contents of memory in various
formats. The following display modes are available in the memory
display command.
2-16 Getting Started
b ... byte
h ... half word (2 bytes)
w ... word (4 bytes)
d ... double word (8 bytes)
s ... short float
l ... long float
m ... processor mnemonic
The display mode option, which is used last except for ’s’ or ’l’, is
registered as current default display mode. The current default display
mode is used when you don’t specify display mode with this option. To
view the current default display command, type:
R>mo
mo -ab -dm
Stepping Through
the Program
The emulator allows you to execute one instruction or a number of
instructions with the s (step) command. Enter the help s to view the
options available with the step command.
R>help s
s - step emulation processor
s
s
s
s
s
s
<count>
<count> $
<count> <addr>
-q <count> <addr>
-w <count> <addr>
-
step
step
step
step
step
step
one from current PC
<count> from current
<count> from current
<count> from <addr>
<count> from <addr>,
<count> from <addr>,
PC
PC
quiet mode
whisper mode
--- NOTES --STEPCOUNT MUST BE SPECIFIED IF ADDRESS IS SPECIFIED!
If <addr> is not specified, default is to step from current PC.
A <count> of 0 implies step forever.
A step count of 0 will cause the stepping to continue "forever" (until
some break condition, such as "write to ROM", is encountered, or until
you enter <CTRL>c). The following command will step from the first
address of the sample program.
R>s 1 10000
000010000@r PC = 000010007@r
MOV.W
#00030134,SP
Getting Started 2-17
Displaying
Registers
The step command shown above executed a
MOV.W #00030118,SP instruction. Enter the following command to
view the contents of the registers.
M>reg
The resulting display will be similar to the following.
reg
reg
reg
reg
reg
reg
reg
reg
pc=00010007
r0=000000ff
r5=00000000
r10=00000000
r15=00000000
r20=00000000
r25=00004040
r30=00000000
psw=10000000 sycw=00000070
r1=00000000
r2=00000000
r6=00000000
r7=00000000
r11=00000000 r12=00000000
r16=00000000 r17=00000000
r21=00000000 r22=00000000
r26=00000000 r27=00000000
r31=00030134
ap=04420010
Combining
Commands
r3=00000000
r8=00000000
r13=00000000
r18=00000000
r23=00000000
r28=00000000
fp=00000000
r4=00000000
r9=00000000
r14=00000000
r19=00000000
r24=00000000
r29=04420010
sp=00030134
More than one command may be entered in a single command line if
the commands are separated by semicolons (;). For example, you
could execute the next instruction(s) and display the registers by
entering the following.
M>s;reg
000010007@r PC = 00001000e@r
reg
pc=0001000e
reg
r0=00030000
reg
r5=00000000
reg r10=00000000
reg r15=00000000
reg r20=00000000
reg r25=00004040
reg r30=00000000
2-18 Getting Started
MOVEA.W
00030000H,R0
psw=10000000 sycw=00000070
r1=00000000
r2=00000000
r6=00000000
r7=00000000
r11=00000000 r12=00000000
r16=00000000 r17=00000000
r21=00000000 r22=00000000
r26=00000000 r27=00000000
r31=00030134
ap=04420010
r3=00000000
r8=00000000
r13=00000000
r18=00000000
r23=00000000
r28=00000000
fp=00000000
r4=00000000
r9=00000000
r14=00000000
r19=00000000
r24=00000000
r29=04420010
sp=00030134
Using Macros
Suppose you want to continue stepping through the program,
displaying registers after each step. You could continue entering s
commands followed by reg commands, but you may find this tiresome.
It is easier to use a macro to perform a sequence of commands which
will be entered again and again.
Macros allow you to combine and store commands. For example, to
define a macro which will display registers after every step, enter the
following command.
M>mac st={s;reg}
Once the st macro has been defined, you can use it as you would any
other command.
M>st
# s ; reg
00001000e@r PC = 000010015@r
reg
pc=00010015
reg
r0=00030000
reg
r5=00000000
reg r10=00000000
reg r15=00000000
reg r20=00000000
reg r25=00004040
reg r30=00000000
MOVEA.W
00030004H,R1
psw=10000000 sycw=00000070
r1=00030004
r2=00000000
r6=00000000
r7=00000000
r11=00000000 r12=00000000
r16=00000000 r17=00000000
r21=00000000 r22=00000000
r26=00000000 r27=00000000
r31=00030134
ap=04420010
Command Recall
Repeating Commands
r3=00000000
r8=00000000
r13=00000000
r18=00000000
r23=00000000
r28=00000000
fp=00000000
r4=00000000
r9=00000000
r14=00000000
r19=00000000
r24=00000000
r29=04420010
sp=00030134
The command recall feature is yet another, easier way to enter
commands again and again. You can press <CTRL>r to recall the
commands which have just been entered. If you go past the command
of interest, you can press <CTRL>b to move forward through the list
of saved commands. To continue stepping through the sample program,
you could repeatedly press <CTRL>r to recall and <RETURN> to
execute the st macro.
The rep command is also helpful when entering commands
repetitively. You can repeat the execution of macros as well
commands. For example, you could enter the following command to
cause the st macro to be executed four times.
M>rep 4 st
Getting Started 2-19
# s ; reg
000010015@r PC = 000010019@r
reg
pc=00010019
reg
r0=00030000
reg
r5=00000000
reg r10=00000000
reg r15=00000000
reg r20=00000000
reg r25=00004040
reg r30=00000000
# s ; reg
000010019@r PC = 00001001d@r
reg
pc=0001001d
reg
r0=00030000
reg
r5=00000000
reg r10=00000000
reg r15=00000000
reg r20=00000000
reg r25=00004040
reg r30=00000000
# s ; reg
00001001d@r PC = 000010020@r
reg
pc=00010020
reg
r0=00030000
reg
r5=00000000
reg r10=00000000
reg r15=00000000
reg r20=00000000
reg r25=00004040
reg r30=00000000
# s ; reg
000010020@r PC = 000010023@r
reg
pc=00010023
reg
r0=00030000
reg
r5=00000000
reg r10=00000000
reg r15=00000000
reg r20=00000000
reg r25=00004040
reg r30=00000000
2-20 Getting Started
MOV.B
#20H,R26
psw=10000000 sycw=00000070
r1=00030004
r2=00000000
r6=00000000
r7=00000000
r11=00000000 r12=00000000
r16=00000000 r17=00000000
r21=00000000 r22=00000000
r26=00000020 r27=00000000
r31=00030134
ap=04420010
MOV.B
r3=00000000
r8=00000000
r13=00000000
r18=00000000
r23=00000000
r28=00000000
fp=00000000
r4=00000000
r9=00000000
r14=00000000
r19=00000000
r24=00000000
r29=04420010
sp=00030134
[R0],R2
psw=10000000 sycw=00000070
r1=00030004
r2=00000000
r6=00000000
r7=00000000
r11=00000000 r12=00000000
r16=00000000 r17=00000000
r21=00000000 r22=00000000
r26=00000020 r27=00000000
r31=00030134
ap=04420010
CMP.B
r4=00000000
r9=00000000
r14=00000000
r19=00000000
r24=00000000
r29=04420010
sp=00030134
#0H,[R0]
psw=10000000 sycw=00000070
r1=00030004
r2=00000000
r6=00000000
r7=00000000
r11=00000000 r12=00000000
r16=00000000 r17=00000000
r21=00000000 r22=00000000
r26=00000020 r27=00000000
r31=00030134
ap=04420010
MOV.B
r3=00000000
r8=00000000
r13=00000000
r18=00000000
r23=00000000
r28=00000000
fp=00000000
r3=00000000
r8=00000000
r13=00000000
r18=00000000
r23=00000000
r28=00000000
fp=00000000
r4=00000000
r9=00000000
r14=00000000
r19=00000000
r24=00000000
r29=04420010
sp=00030134
r3=00000000
r8=00000000
r13=00000000
r18=00000000
r23=00000000
r28=00000000
fp=00000000
r4=00000000
r9=00000000
r14=00000000
r19=00000000
r24=00000000
r29=04420010
sp=00030134
#0H,R2
psw=10000001 sycw=00000070
r1=00030004
r2=00000000
r6=00000000
r7=00000000
r11=00000000 r12=00000000
r16=00000000 r17=00000000
r21=00000000 r22=00000000
r26=00000020 r27=00000000
r31=00030134
ap=04420010
Command Line
Editing
The terminal interface supports the use of HP-UX ksh(1)-like editing
of the command line. The default is for the command line editing
feature to be disabled to be compatible with earlier versions of the
interface. Use the cl command to enable command line editing.
M>cl -e
Refer to "Command Line Editing" in the HP 64700-Series Emulators
Terminal Interface Reference for information on using the command
line editing feature.
Modifying Memory
The preceding step and register commands show the sample program is
executing Read_Input loop, where it continually reads the command
input byte to check if a command had been entered. Use the m
(memory) command to modify the command input byte.
M>m -db 30000=41
To verify that 41H has been written to 30000H, enter the following
command.
M>m 30000
000030000@r
41
The display mode described in the above "Display Memory In
Mnemonic Format" section also functions when modifying memory
contents.
When memory was displayed in byte format earlier, the current display
mode was changed to "byte". The display and access modes from
previous commands are saved and they become the defaults.
In "mnemonic" current display mode, last display mode in ’b’, ’h’, ’w’
and ’d’ is used when modifying memory command with no display
mode option.
Specifying the
Access and Display
Modes
There are a couple of different ways to modify the display and access
modes. One is to explicitly specify the mode with the command you
are entering, as with the command m -db 30000. The mo (display and
access mode) command is another way to change the default mode. For
example, to display the current modes, display 20000H in the current
Getting Started 2-21
mode "byte", define the display mode as "word", and redisplay
20000H, enter the following commands.
M>mo
mo -ab -db
M>m 20000
000020000@r
54
M>mo -dw
M>m 20000
000020000@r
53494854
To continue the rest of program ..
M>r
U>
Display the Message_Dest memory locations (destination of the
message, 30004H) to verify that the program moved the correct ASCII
bytes. At this time we want to see correct byte value, so "-db" option
(display with byte) is used.
U>m -db 30004..30023
000030004@r
000030014@r
54 48 49 53 20 49 53 20 4d 45 53 53 41 47 45 20
41 20 20 20 20 20 20 20 20 20 20 20 20 20 20 20
Searching
Memory for Data
The ser (search memory for data) command is another way to verify
that the program did what it was supposed to do.
U>ser 30000..3003f="THIS IS MESSAGE
A"
pattern match at address: 000030004@r
If any part of the data specified in the ser command is not found, no
match is displayed (No message displayed).
2-22 Getting Started
Breaking into the
Monitor
You can use the break (b) command to generate a break to the
background monitor. While the break will occur as soon as possible,
the actual stopping point may be many cycles after the break request
(depend on the type of instruction being executed and whether the
processor is in a hold state).
U>b
M>
Using Software
Breakpoints
Software breakpoints are realized by the 70632 BRK instruction.
When you define or enable a software breakpoint (with the bp
command), the emulator will replace the opcode at the software
breakpoint address with a breakpoint interrupt instruction (BRK).
If the BRK interrupt was generated by a software breakpoint, execution
breaks to the monitor, and the breakpoint interrupt instruction (BRK) is
replaced by the original opcode. A subsequent run or step command
will execute from this address.
Note
When using software breakpoints feature of the emulator, you must
define the BRK instruction vector to point to an address where
instruction fetches is allowed; typically in the program code area. In
this sample program, the BRK instruction vector points to a "HALT"
instruction. When a software breakpoint occurs, the emulator reads the
BRK interrupt vector, push the next PC, PSW and a word of exception
code to stack, fetch one word of instruction pointed by the vector same
as the actual CPU. And then, break occurs but the instruction, "HALT"
in this example, will never be executed.
There are some notices to use the software breakpoints features. Refer
to the "Software Breakpoints" section of the "Using the Emulator"
chapter.
Getting Started 2-23
Displaying and
Modifying the Break
Conditions
Before you can define software breakpoints, you must enable software
breakpoints with the bc (break conditions) command. To view the
default break conditions and change the software breakpoint condition,
enter the bc command with no option. This command displays current
configuration of break conditions.
M>bc
bc
bc
bc
bc
bc
bc
-d
-e
-d
-d
-d
-d
bp #disable
rom #enable
bnct #disable
cmbt #disable
trig1 #disable
trig2 #disable
To enable the software breakpoint feature enter
M>bc -e bp
To confirm modified break condition, enter:
M>bc
bc
bc
bc
bc
bc
bc
-e
-e
-d
-d
-d
-d
bp #enable
rom #enable
bnct #disable
cmbt #disable
trig1 #disable
trig2 #disable
Defining a Software
Breakpoint
Now that the software breakpoint feature is enabled, you can define
software breakpoints. Enter the following command to break on the
address of the Command_A (address 10033H) label.
M>bp 10033
M>bp
### BREAKPOINT FEATURE IS ENABLED ###
bp 000010033@r #enabled
Run the program, and verify that execution broke at the appropriate
address.
M>r 10000
U>m -db 30000=41
!ASYNC_STAT
615! Software breakpoint: 000010033@r
M>st
2-24 Getting Started
# s ; reg
000010033@r PC = 00001003a@r
reg
pc=0001003a
reg
r0=00030000
reg
r5=00000000
reg r10=00000000
reg r15=00000000
reg r20=00000000
reg r25=00004040
reg r30=00000000
MOVEA.W
00020000H,R3
psw=10000001 sycw=00000070
r1=00030004
r2=00000041
r6=00000000
r7=00000000
r11=00000000 r12=00000000
r16=00000000 r17=00000000
r21=00000000 r22=00000000
r26=00000020 r27=00030034
r31=00030134
ap=04420010
r3=00020000
r8=00000000
r13=00000000
r18=00000000
r23=00000000
r28=00020011
fp=00000000
r4=00000011
r9=00000000
r14=00000000
r19=00000000
r24=00000000
r29=04420010
sp=00030134
When a breakpoint is hit, it becomes disabled. You can use the -e
option to the bp command to re-enable the software breakpoint.
M>bp
### BREAKPOINT FEATURE IS ENABLED ###
bp 000010033@r #disabled
M>bp -e 10033
M>bp
### BREAKPOINT FEATURE IS ENABLED ###
bp 000010033@r #enabled
M>r
U>m -db 30000=41
!ASYNC_STAT
615! Software breakpoint: 000010033@r
M>bp
### BREAKPOINT FEATURE IS ENABLED ###
bp 000010033@r #disabled
Getting Started 2-25
Using the Analyzer
Predefined Trace
Labels
Three trace labels are predefined in the 70632 emulator. You can view
these labels by entering the tlb (trace label) command with no options.
M>tlb
#### Emulation trace labels
tlb addr 32..63
tlb data 0..31
tlb stat 64..79
Predefined Status
Equates
Common values for the 70632 status trace signals have been
predefined. You can view these predefined equates by entering the equ
command with no options.
M>equ
###
equ
equ
equ
equ
equ
equ
equ
equ
equ
equ
equ
equ
equ
equ
equ
equ
equ
equ
equ
equ
equ
equ
equ
equ
equ
equ
equ
equ
Equates ###
base=0xxxxxxxxxxxx0100y
coprd=0x1xxxxxxxxxx1000y
coproc=0xxxxxxxxxxxx1000y
copwr=0x0xxxxxxxxxx1000y
data=0xxxxxxxxxxxx0011y
datard=0x1xxxxxxxxxx0011y
datawr=0x0xxxxxxxxxx0011y
exe=0xxxxxxxxxxxx0000y
fault=0xxxxxxxxxxxx1100y
fetch=0x1xxxxxxxxxx011xy
fetchbr=0x1xxxxxxxxxx0111y
grd=0xxxxxxxxxx0x0xxxy
halt=0xxxxxxxxxxxx1101y
hold=0xxxxxxxxxxxx0001y
int=0xxxxxxxxxxxx1110y
io=0xxxxxxxxxxxx1011y
iord=0x1xxxxxxxxxx1011y
iowr=0x0xxxxxxxxxx1011y
lock=0xxxxxxxx0xxxxxxxy
mon=0xxxxxxxxxxx0xxxxy
retry=0xxxxxxxxxxxxxxxy
short=0xxxxxxxxxxxx0010y
shortrd=0x1xxxxxxxxxx0010y
shortwr=0x0xxxxxxxxxx0010y
trans=0xxxxxxxxxxxx0101y
transrd=0x1xxxxxxxxxx0101y
transwr=0x0xxxxxxxxxx0101y
wrrom=0x0xxxxxxx0xx0xxxy
These equates may be used to specify values for the stat trace label
when qualifying trace conditions.
For the description of these equates, refer to the "Analyzer Topics"
section of the "Using the Emulator" chapter.
2-26 Getting Started
Specifying a Simple
Trigger
The tg analyzer command is a simple way to specify a condition on
which to trigger the analyzer. Suppose you wish to trace the states of
the program after the read of a "B" (42H) command from the command
input byte. Enter the following commands to set up the trace, run the
program, issue the trace, and display the trace status. (Note that the
analyzer is to search for a lowest byte read of 42H because the address
is a multiple of four.)
M>tg addr=30000 and data=0xxxxxx42
M>t
Emulation trace started
U>r
U>ts
--- Emulation Trace Status --NEW User trace running
Arm ignored
Trigger not in memory
Arm to trigger ?
States ? (0) ?..?
Sequence term 1
Occurrence left 1
The trace status shows that the trigger condition has not been found.
You would not expect the trigger to be found because no commands
have been entered. Modify the command input byte to "B"(42H) and
display the trace status again.
U>m -db 30000=42
U>ts
--- Emulation Trace Status --NEW User trace complete
Arm ignored
Trigger in memory
Arm to trigger ?
States 1024 (1024) 0..1023
Sequence term 2
Occurrence left 1
The trace status shows that the trigger has been found, and that 1024
states have been stored in trace memory. Enter the following command
to display the first 20 states of the trace.
U>tl 0..19
Getting Started 2-27
Line
----0
1
2
3
4
5
6
7
8
9
10
11
12
13
14
15
16
17
18
19
addr,H
-------00030000
00010020
00010030
00010023
00010034
00010025
00010029
00010038
0001002b
0001003c
0001002f
00010043
00010044
00010048
0001004c
00010050
00010054
00010043
00010058
0001004a
data,H
-------ffffff42
64226a14
44226a14
44226a14
ffcdf223
ffcdf223
ffcdf223
242d0000
242d0000
000011f4
44ffffff
44ffffff
ffcef223
242d0000
000011f4
44106a00
ffcff223
242d0000
242d0000
00000ff4
uPD70632 Mnemonic,H
-------------------------------------......42H data read
No fetch cycle found
fetch
No fetch cycle found
fetch
No fetch cycle found
No fetch cycle found
fetch
No fetch cycle found
fetch
No fetch cycle found
fetch aft br
fetch
fetch
fetch
fetch
fetch
MOVEA.W
00020011H,R3
fetch
MOV.W
#00000011H,R4
count,R
--------*********
*********
*********
*********
*********
*********
*********
*********
*********
*********
*********
*********
*********
*********
*********
*********
*********
*********
*********
*********
Line 0 in the trace list above shows the state which triggered the
analyzer. The trigger state is always on line 0. To list the next lines of
the trace, enter the following command.
U>tl
Line
----20
21
22
23
24
25
26
27
28
29
30
31
32
33
34
35
36
37
38
39
addr,H
-------0001005c
00010061
00010051
00010064
00010068
0001006c
00010070
00010074
00010061
00010078
00020011
00020012
00030004
00020013
00030005
00020014
00030006
00020015
00030007
00020016
2-28 Getting Started
data,H
-------00000ff4
638a58ff
ffa3f284
ffa3f284
6a300001
000000ae
fffffff3
dfffabff
dfffabff
55555557
ffff54ff
ff48ffff
00000054
49ffffff
00004800
ffffff53
00490000
ffff20ff
53000000
ff49ffff
uPD70632 Mnemonic,H
-------------------------------------fetch
fetch aft br
BR
00010061H
fetch
fetch
fetch
fetch
fetch
MOVCFU.B [R3],R4,00030004H,#30H
fetch
....54..H data read
..48....H data read
......54H data write
49......H data read
....48..H data write
......53H data read
..49....H data write
....20..H data read
53......H data write
..49....H data read
count,R
--------*********
*********
*********
*********
*********
*********
*********
*********
*********
*********
*********
*********
*********
*********
*********
*********
*********
*********
*********
*********
Trigger Position
You can specify where the trigger state will be positioned with in the
emulation trace list. The following three basical trigger positions are
defined.
s
c
e
start
center
end
When s (start) trigger position is selected, the trigger is positioned at
the start of the trace list. You can trace the states after the trigger state.
When c (center) trigger position is selected, the trigger is positioned at
the center of the trace list. You can trace the states around the trigger
state.
When e (end) trigger position is selected, the trigger is positioned at the
end of the trace list. You can trace the states before the trigger.
In the above section, you have traced the states of the program after a
certain state, because the default trigger position was s (start). If you
want to trace the states of the program around a certain state, you need
to change the trigger position.
For example, if you wish to trace the transition to the command A
process, change the trigger position to "center" and specify the trigger
condition.
To specify the trigger position, issue the tp command like this:
U>tp c
Specify the trigger condition by typing:
U>tg addr=10033 and stat=exe
Issue the trace command to start the trace.
U>t
Emulation trace started
Modify the command input byte to "A" and display the trace status
again.
U>m -db 30000=41
U>ts
--- Emulation Trace Status --NEW User trace complete
Arm ignored
Trigger in memory
Getting Started 2-29
Arm to trigger ?
States 1024 (1024) -512..511
Sequence term 2
Occurrence left 1
The trace status shows that the trigger has been found. Enter the
following command to display the states about the execution state of
the address 10033H.
U>tl -10..13
Line
-----10
-9
-8
-7
-6
-5
-4
-3
-2
-1
0
1
2
3
4
5
6
7
8
9
10
11
12
13
addr,H
-------00010023
00010034
00010025
00010029
00010033
00010034
00010038
0001003c
00010040
00010044
00010033
00010048
0001003a
0001004c
00010061
00010041
00010064
00010068
0001006c
00010070
00010074
00010061
00010078
00020000
data,H
-------44226a14
ffcdf223
ffcdf223
44fdffff
44ffffff
ffcdf223
242d0000
000011f4
44206a00
ffcef223
242d0000
242d0000
000011f4
000011f4
638a58ff
ffa3f284
ffa3f284
6a300001
000000ae
78ef4120
ffff1028
ffff1028
015d0aaa
ffffff54
uPD70632 Mnemonic,H
-------------------------------------BE/Z
0001001dH
fetch
CMP.B
#41H,R2
BE/Z
00010033H
fetch aft br
fetch
fetch
fetch
fetch
fetch
MOVEA.W
00020000H,R3
fetch
MOV.W
#00000011H,R4
fetch
fetch aft br
BR
00010061H
fetch
fetch
fetch
fetch
fetch
MOVCFU.B [R3],R4,00030004H,#30H
fetch
......54H data read
count,R
--------*********
*********
*********
*********
*********
*********
*********
*********
*********
*********
*********
*********
*********
*********
*********
*********
*********
*********
*********
*********
*********
*********
*********
*********
The transition states to the process for the command A are displayed.
For a Complete
Description
2-30 Getting Started
For a complete description of the HP 64700 Series analyzer, refer to
the HP 64700 Emulators Terminal Interface: Analyzer User’s Guide.
Copying Memory
The cp (copy memory) command gives you the ability to copy the
contents of one range of memory to another. This is a handy feature to
test things like the relocatability of programs, etc. To test if the sample
program is relocatable within the same segment, enter the following
command to copy the program to an unused, but mapped, area of
emulation memory. After the program is copied, run it from its new
start address to verify that the program is indeed relocatable.
U>cp 10800=10000..1006d
U>cp 20800=20000..20031
U>r 10800
U>
The prompt shows that the emulator is executing user code, so it looks
as if the program is relocatable. You may want to issue a simple trace
to verify that the program works while running from its new location.
U>tg any
U>t
Emulation trace started
U>tl
Testing for
Coverage
For each 4 bytes of emulation memory, there is an additional bit of
emulation RAM used by the emulator to provide coverage testing.
When the emulator is executing the target program and an access is
made to a byte in emulation memory, the corresponding bit of coverage
memory is set. With the cov command, you can see which bytes in a
range of emulation memory have (or have not) been accessed.
For example, suppose you want to determine how extensive some test
input is in exercising a program (in other words, how much of the
program is covered by using the test input). You can run the program
with the test input and then use the cov command to display which
locations in the program range were accessed.
Before coverage testing, break the emulator into monitor, by typing:
U>b
Getting Started 2-31
The examples which follow use the cov command to perform coverage
testing on the sample program. Before performing coverage tests, reset
all coverage bits to non-accessed by entering the following command.
M>cov -r
Run the program from the start address (10000H) and use the cov
command to display how much of the program (instructions and data)
is accessed before any commands are entered.
M>r 10000
U>cov -a 10000..1006c 20000..20030
# coverage list - list of address ranges accessed
000010000..000010033@r
percentage of memory accessed:
% 32.9
Now enter the sample program commands "A", "B", and an invalid
command ("C" will do); display the coverage bits for the address range
of the sample program after each command. You can see that more of
the sample program address range is covered after each command is
entered.
U>m 30000=41
U>cov -a 10000..1006c 20000..20030
# coverage list - list of address ranges accessed
000010000..00001004f@r
000010060..00001006c@r
000020000..000020013@r
percentage of memory accessed:
% 71.5
As you have entered command "A", the memory access for the
command A process is added to the address ranges. Each term of the
address ranges displayed is rounded to 4 byte boundaries because the
coverage resolution is 4 byte.
U>m 30000=42
U>cov -a 10000..1006c 20000..20030
# coverage list - list of address ranges accessed
000010000..00001006c@r
000020000..000020023@r
percentage of memory accessed:
% 91.7
The address range 10000H through 1006cH contains all instructions in
the sample program. Although you have never enter the invalid
command "C", the report shows that all instructions including the
instructions for the invalid command process have been accessed. This
2-32 Getting Started
reason is because the 70632 microprocessor prefetched the instructions
for the invalid command. Note this when you use the coverage tester
for the purpose of measuring memory locations of instructions
executed.
U>m 30000=43
U>cov -a 10000..1006c 20000..20030
# coverage list - list of address ranges accessed
000010000..00001006c@r
000020000..000020030@r
percentage of memory accessed:
Resetting the
Emulator
% 100.0
To reset the emulator, enter the following command.
U>rst
R>
The emulator is held in a reset state (suspended) until a b (break), r
(run), or s (step) command is entered. A CMB execute signal will also
cause the emulator to run if reset.
The -m option to the rst command specifies that the emulator begin
executing in the monitor after reset instead of remaining in the
suspended state.
R>rst -m
M>
Getting Started 2-33
Notes
2-34 Getting Started
3
Virtual Mode Emulation Topics
Introduction
The on-chip Memory Management Unit (MMU) of the 70632
microprocessor translates virtual addresses to physical (actual)
addresses that are placed on the processor address bus. This chapter
shows you how to use the emulator when the 70632 MMU is active.
This chapter:
Describes the sample program used for this chapter’s
examples.
Shows you how to enter emulation commands to view
execution of the sample program. The commands described in
this chapter include:
– using virtual address expression in command lines.
– displaying on-chip MMU registers and privilege registers.
– displaying address translation tables.
– displaying TCB.
– using software breakpoint.
– using XMMU function.
– using the analyzer.
Sample Program
for Virtual Mode
Emulation
The sample program listed in figure 3-1 is a multi-task system which
consists of a simple operating system and two tasks. Each of two tasks
transfers its own message from an independent area to a common area.
System Base Table
The "sys_sbt" part located at address range 00000000H through
00000fffH defines the 70632 Break-point instruction trap vector and
Virtual Mode Emulation Topics 3-1
#mul_task.s
D 00000000
.file
"mul_task.s"
D
D
D
D
D
D
D
D
D
D
D
D
D
D
D
D
D
D
D
D
D
D
D
D
00000000
00000000
00000000
00000000
00000000
00000000
00000000
00000000
00000000
00000000
00000000
00000000
00000000
00000000
00000000
00000000
00000000
00000000
00000000
00000000
00000000
00000000
00000000
00000000
.equ
.equ
.equ
.equ
.equ
.equ
.equ
.equ
.equ
.equ
.equ
.equ
.equ
.equ
.equ
.equ
.equ
.equ
.equ
.equ
.equ
.equ
.equ
.equ
isp,0
l0sp,1
l1sp,2
l2sp,3
l3sp,4
sbr,5
tr,6
sycw,7
tkcw,8
pir,9
psw2,15
atbr0,16
atlr0,17
atbr1,18
atlr1,19
atbr2,20
atlr2,21
atbr3,22
atlr3,23
trmod,24
adtr0,25
adtr1,26
adtmr0,27
adtmr1,28
D 00000000
D 00000000
.equ
.equ
Stack_Size,0x1000
Dest_Size,0x20
.data
"sys_sbt" (RW) >0x00000000
.org
.word
.org
.word
0x34
Dummy_Text
0xc0
Sys_Trap
.data
.word
.word
"sys_tcb" (RW) >0x00001000
0
2
.word
.word
.word
.word
.word
.word
TCB_A
0x7f000000
0x00000000
0x40000000
0x40002000
0
.word
.word
.word
.word
.word
.word
TCB_B
0x7f000000
0x00000000
0x40000000
0x40002000
0
D
D
D
D
D
D
00000000
00000000
00000000
00000034 C1500000
00000038
000000C0 88500000
Sys_SBT:
D 000000C4
D 00001000 00000000
D 00001004 02000000
D
D
D
D
D
D
00001008
0000100C
00001010
00001014
00001018
0000101C
38100000
0000007F
00000000
00000040
00200040
00000000
D
D
D
D
D
D
00001020
00001024
00001028
0000102C
00001030
00001034
64100000
0000007F
00000000
00000040
00200040
00000000
Current_Task:
Num_Of_Task:
TCB_Entry:
Figure 3-1. Sample Program Listing
3-2 Virtual Mode Emulation Topics
D 00001038 00E00000
D 0000103C
D 0000105C 0920000000000000
TCB_A:
.word
.space
.word
0x0000e000
8*4
0x00002009,0x00000000
D 00001064 00E00000
D 00001068
D 00001088 1120000000000000
TCB_B:
.word
.space
.word
0x0000e000
8*4
0x00002011,0x00000000
D 00001090
D 00002000 0330000000050000
ATE0:
.data
.word
"sys_ate" (RW) >0x00002000
0x00003003,0x00000500
D 00002008 0331000000030000
D 00002010 0332000000030000
ATE1_A:
ATE1_B:
.word
.word
0x00003103,0x00000300
0x00003203,0x00000300
.data
.word
.word
.word
.word
.word
.word
"sys_pte" (RW) >0x00003000
0x00000e05
0x00001e05
0x00002e05
0x00003e05
0x00004e05
0x00005e05
.org
.word
.word
.word
.word
0x100
0x00006e05
0x00008e05
0x0000ae05
0x0000ce05
.org
.word
.word
.word
.word
0x200
0x00007e05
0x00009e05
0x0000be05
0x0000ce05
B 00004000
B 00004000
.bss
.lcomm
"sys_stk" (RW) >0x00004000
Sys_Stack,Stack_Size,4
T 00005000
T 00005000
.text
.align
"sys_text" (RX) >0x00005000
4
mov.w
ldpr
#Sys_Stack+Stack_Size,sp
#Sys_SBT,#sbr
T 0000500F 1280F401200000F4
10000000
T 0000501B 1280E0F411000000
T 00005023 1280E0F412000000
T 0000502B 1280E0F414000000
T 00005033 1280E0F416000000
ldpr
#0x2001,#atbr0
ldpr
ldpr
ldpr
ldpr
#0x00000000,#atlr0
#0,#atbr1
#0,#atbr2
#0,#atbr3
T 0000503B 1280F471210000E7
ldpr
#0x2171,#sycw
mov.w
mov.w
Num_Of_Task,r0
#TCB_Entry,r1
D
D
D
D
D
D
D
00002018
00003000
00003004
00003008
0000300C
00003010
00003014
050E0000
051E0000
052E0000
053E0000
054E0000
055E0000
PTE0:
D
D
D
D
D
00003018
00003100
00003104
00003108
0000310C
056E0000
058E0000
05AE0000
05CE0000
PTE1_A:
D
D
D
D
D
00003110
00003200
00003204
00003208
0000320C
057E0000
059E0000
05BE0000
05CE0000
PTE1_B:
T 00005000 2D3FF400500000
T 00005007 1280F400000000E5
T 00005043 2D20F2C1BFFFFF
T 0000504A 2D21F408100000
Sys_Init:
Setup_Task:
Figure 3-1. Sample Program Listing (Cont’d)
Virtual Mode Emulation Topics 3-3
T
T
T
T
T
T
T
T
00005051
00005056
0000505A
0000505E
00005063
00005068
0000506D
00005074
0180010461
2D220110
2DA0E0A2
2DA00108A2
2DA0010CA2
2D42010004
8421F418000000
C6A0DDFF
Setup_Task_0:
T 00005078 0180F294BFFFFFF2
90BFFFFF
T 00005084 FAE4
T
T
T
T
T
T
T
T
T
T
T
T
T
T
00005086
00005088
0000508F
00005092
00005095
0000509C
000050A0
000050A2
000050A9
000050AB
000050AE
000050B5
000050B8
000050BF
2D20F278BFFFFF
2D4062
8522E6
2D21F408100000
FDC20104
DD60
BC00F262BFFFFF
6505
B44060
2D00F252BFFFFF
8520E6
01E0C00104C061
FAE4
T 000050C1 00
T
T
T
T
Sys_Trap:
Sys_Trap_0:
Dummy_Text:
000050C2
00006000 2D3AF420000000
00006007 2D38F417000000
0000600E 588AF30020004098
Transfer_A:
F30030004020
T 0000601C F8F4A0
T 0000601F D6F2E1FFFFFF
T
T
T
T
00006025
00007000 2D3AF420000000
00007007 2D38F413000000
0000700E 588AF30020004098
ldtask
mov.w
mov.w
mov.w
mov.w
mov.w
add.w
dbr
4[r1],[r1]
0x10[r1],r2
#0,[-r2]
8[r1],[-r2]
12[r1],[-r2]
r2,4[[r1]]
#0x18,r1
r0,Setup_Task_0
ldtask
TCB_Entry+4,TCB_Entry
retis
#4
.align
mov.w
mov.w
mul.w
mov.w
sttask
inc.w
cmp.w
jnz
xor.w
mov.w
mul.w
ldtask
retis
4
Current_Task,r0
r0,r2
#0x6,r2
#TCB_Entry,r1
4[r1](r2)
r0
r0,Num_Of_Task
Sys_Trap_0
r0,r0
r0,Current_Task
#0x6,r0
4[r1](r0),[r1](r0)
#4
halt
.text
"text_a" (RW) >0x00006000
mov.w
#’ ’,r26
mov.w
#Message_A_End-Message_A,r24
movcfu.b /0x40002000,r24,
/0x40003000,#Dest_Size
trap
jmp
Transfer_B:
#0xa0
Transfer_A
.text
"text_b" (RW) >0x00007000
mov.w
#’ ’,r26
mov.w
#Message_B_End-Message_B,r24
movcfu.b /0x40002000,r24,
/0x40003000,#Dest_Size
F30030004020
T 0000701C F8F4A0
T 0000701F D6F2E1FFFFFF
trap
jmp
#0xa0
Transfer_B
B 00008000
B 00008000
.bss
.lcomm
"stack_a" (RW) >0x00008000
Stack_A,Stack_Size,4
B 00009000
B 00009000
.bss
.lcomm
"stack_b" (RW) >0x00009000
Stack_B,Stack_Size,4
.data
.str
"data_a" (RW) >0x0000a000
"THIS IS TASK A MESSAGE."
D 0000A000
D 0000A000 5448495320495320
5441534B2041204D
4553534147452E
Message_A:
Figure 3-1. Sample Program Listing (Cont’d)
3-4 Virtual Mode Emulation Topics
D 0000A017
D 0000A017
D 0000B000 5461736B2042203A
2052756E6E696E67
2E2E2E
D 0000B013
B 0000C000
B 0000C000
Message_A_End:
Message_B:
.data
.str
"data_b" (RW) >0x0000b000
"Task B : Running..."
.bss
.lcomm
"dest" (RW) > 0x0000c000
Message_Dest,Dest_Size,4
Message_B_End:
Figure 3-1. Sample Program Listing (Cont’d)
the Software trap 0 vector. The break-point instruction vector is
required for the software breakpoint feature of the emulator. The
software trap 0 vector is used for aborting task and transfering
execution to the operating system.
Task Context Block
The "sys_tcb" part at address range 00001000H through 00001fffH
defines task context block. The operating system manages tasks with
this block.
The address labeled Current_Task contains a task number which is
currently executed. Tasks are numbered from 0. This address initialized
to 0 when the program is started. First, the task numbered 0 will be
executed.
The address labeled Num_Of_Task contains the number of tasks the
operating system manages. This program has two tasks, which are
alternately executed. So this address contains the value "2".
The address labeled TCB_Entry contains task control blocks for each
task. Each block consists of pointer and register list of TCB managed
under the 70632 processor, and the initial values of registers PSW, PC
and SP, and a word of flags.
The address labeled TCB_A contains the TCB, managed under the
processor, for one of the tasks. This task will be called as "Task A" in
this example. The task number mentioned above is "0".
The address labeled TCB_B contains the TCB for the other task, which
will be called as "Task B". The task number is "1".
Virtual Mode Emulation Topics 3-5
Area Table Entry
The "ate" part at address range 00002000H through 00002fffH defines
the 70632 Area Table Entry.
The address labeled ATE0 contains Area Table Entry (ATE) in Section
0. In this example, Section 0 is a common part between Task A and
Task B. Section 0 has one area.
The address labeled ATE1_A and ATE1_B contains ATE in Section 1
for each task. Section 1 is independent between Task A and Task B.
ATE1_A is for Task A, and ATE1_B is for Task B. Section 1 has one
area each other.
Page Table Entry
The "pte" part at address range 00003000H through 00003fffH defines
the 70632 Page Table Entry.
The address labeled PTE0 contains Page Table Entry (PTE) in Section
0, Area 0. This area has six pages.
The addresses labeled PTE1_A and PTE1_B contains PTE in Section
1, Area 0 for each task. PTE1_A is for Task A, and PTE1_B is for
Task B. Each area has four pages.
System Stack
The "sys_stk" part at address range 00004000H through 00004fffH
defines a stack for the operating system. The stack is pointed by the
register ISP.
System Program Code
The "sys_text" part at address range 00005000H through 00005fffH
defines program codes for the operating system.
The program instructions from the Sys_Init label to the Setup_Task
perform initialization of the operating system. The privilege registers
are set up and the processor address mode is switched to virtual mode.
The instructions from the Setup_task to Start_Ini_Task perform
initialization for the tasks. The stack for each task is set up with initial
PC and PSW.
3-6 Virtual Mode Emulation Topics
The instructions from Start_Ini_Task transfer the execution to initial
task (Task A).
The instructions from Sys_Trap perform switching task. When a task
aborts the execution, the processor executes from the address labeled
Sys_Trap. The instructions store the task execution environment of the
aborted task to corresponding TCB, update the Current_Task to the
another task number to be switched, load the TCB, and switch the
execution.
Task A Program Code
The "text_a" part defines program codes of Task A. This part located at
00006000H through 00006fffH of actual memory address. However,
when Task A is running, this part is executed as it is located at
40000000H through 40000fffH by using the on-chip MMU.
Task A transfers a message of character string data from the address
labeled Message_A to the address labeled Message_Dest. After the
transfer, the processor executes trap instruction. The trap instruction
causes the execution aborting into the operating system. At this time,
the execution of Task A is stopped until next dispatch by the operating
system.
Task B Program Code
The "text_b" part defines program codes of Task B. This part is at
00007000H through 00007fffH of actual memory address. Under the
Task B virtual space, this part is executed as it is at 40000000H through
40000fffH as same as Task A.
Task B does same as Task A except for the message data, which is
located at address labeled Message_B.
Task A Data
The "data_a" part defines the message transferred by Task A.
This part located at 0000a000H through 0000afffH of actual memory
address. Under the Task A virtual space, location of this part is
recognized as 40002000H through 40002fffH.
Virtual Mode Emulation Topics 3-7
Task B Data
The "data_b" part defines the message transferred by Task B.
This part located at 0000b000H through 0000bfffH of actual memory
address. Under the Task B virtual space, location of this part is
recognized as 40002000H through 40002fffH as same as Task A.
Task A Stack
The "stack_a" part at 00008000H through 00008fffH of actual memory
address defines stack of Task A. The location of the Task A virtual
space is at 40001000H through 40001fffH.
Task B Stack
The "stack_b" part at 00009000H through 00009fffH of actual memory
address defines stack of Task B. The location of the Task B virtual
space is at 40001000H through 40001fffH as same as Task A.
Common Destination Area
The "common" part defines common destination of message from both
Task A and Task B tasks.
This part is located at 0000c000H through 0000cfffH of actual memory
address. Both locations of the Task A and Task B virtual space are at
the same address range 40003000H through 40003fffH.
Multiple Virtual
Space of the
Sample Program
The sample program is a multi-tasking program. There are two tasks
and each task has an independent virtual space.
Figure 3-2 shows the virtual spaces of each task. Section 0 which
contains the operating system resources is 1:1 mapping at the same
address between real address and virtual address. The mapping of
3-8 Virtual Mode Emulation Topics
section 1 is different between each virtual space, for Task A and Task
B, except for the destination area.
Figure 3-3 shows the detail of the operating system locations.
Figure 3-4 shows the detail of the virtual space of each task in Section
1.
Virtual Mode Emulation Topics 3-9
Figure 3-2. Virtual Address Space for Sample Program
3-10 Virtual Mode Emulation Topics
Figure 3-3. Mapping of the Sample Operating System
Virtual Mode Emulation Topics 3-11
Figure 3-4. Mapping of the Tasks
3-12 Virtual Mode Emulation Topics
Sample Program
Flow
Figure 3-5 shows the flow of the sample program.
1. The initialization of the operating system is executed, and the
execution is switched to Task A.
2. Task A reads the characters from address Message_A and
writes to address Message_Dest.
3. When the trap instruction of Task A is executed, the execution
of Task A is stopped, and the task dispatcher of the operating
system stores environment of Task A and loads the Task B’s
one.
4. The execution of the operating system is exited, then the
execution is switched to Task B. Task B reads the characters
from address Message_B and writes to address Message_Dest.
5. After the transfer, the execution is returned to the operating
system by the trap instruction of Task B.
6. Task A is executed via the operating system again. The next
instruction which has made abort to the operating system
restarts the execution from address Transfer_A. The transfer
of the Task A message is executed again.
The procedures numbered from 2 to 6 are repeated infinitely. As a
result, the address Message_Dest is written the messages of Task A and
Task B alternately, because the address Message_Dest is same actual
memory.
Virtual Mode Emulation Topics 3-13
Figure 3-5. The Execution Flows of the Sample Program
3-14 Virtual Mode Emulation Topics
Setting Up the
Emulator
To set up the emulator, the demo command is provided for this
example. The demo command performs the following tasks.
Limited initialization of the emulator.
Mapping memory for this example.
Loading the sample program into the emulator.
Enter the following command.
R>demo 2
Using The
Emulator In
Virtual Mode
Address Mode
suffixes
This section shows a example usage of the emulator in virtual mode.
When you issue a command, the emulator displays the result of the
command. According to circumstance, the resulting display includes
address information such as "00004000@r" or "00008000@v".
The suffix "@r" indicates that the address is displayed in real address
space. The suffix "@v" indicates that the address is displayed in virtual
address space. When the emulator displays an address information, the
address space mode will be different as the case may be.
Specifying An Address Mode
When you designate addresses, you can select either real or virtual
address by adding a suffix with a few exceptions such as map and cov
commands. These exceptions are shown in "ADDRESS" section in the
"70632 Emulator Specific Command Syntax" appendixa. The
following suffixes are allowed.
Virtual Mode Emulation Topics 3-15
"@r"
real address
"@v"
virtual address
You can also designate addresses with no suffix. In this case, the
address mode, which is required to evaluate the addresses, is
determined as follows.
1. When the processor is reset, the addresses are evaluated as
real address.
2. When the processor never runs in virtual mode after reset, the
addresses are evaluated as real address.
3. Once the processor has run in virtual mode after reset, the
addresses are evaluated as virtual address.
Note
If the processor has ever run in virtual mode since the processor was
reset, the address expression without suffix is evaluated as virtual
address, even if the processor is running in real mode.
If you specify a virtual address in a command, the emulator has to
translate the virtual address, which you have specified,to the real
address. The method of the address translation is same as the actual
70632 microprocessor. In this case, the emulator use the current value
of the 70632 address table register pairs, ATBR0, ATLR0, ATBR1 ....,
to translate the address by default. The details of the address translation
are shown in chapter 4.
3-16 Virtual Mode Emulation Topics
Setting Breakpoints
in Real Address
First, set the software breakpoints at the entry of both tasks. The real
address of Task A entry is 00006000H, and Task B is 00007000H.
Enter the following commands.
R>bc -e bp
R>bp 6000
R>bp 7000
The address expressions used in the above commands have no suffix.
The emulator recognized the address as real because the processor is
reset. You could also enter the addresses using the "@r" suffixes such
as "6000@r" and "7000@r".
To confirm the breakpoints set, type:
R>bp
### BREAKPOINT FEATURE IS ENABLED ###
bp 000006000@r #enabled
bp 000007000@r #enabled
Running the Sample
Program
Start the program from address 00005000H by typing the following
command.
R>r 5000
!ASYNC_STAT
M>
615! Software breakpoint: 040000000@v
You will see the execution has stopped at virtual address 40000000H
which is one of the breakpoints you set. Because the processor ran in
virtual mode, the address which caused breaking into monitor was
displayed in virtual address.
Displaying the CPU
Address Mode
You can confirm the CPU is in virtual mode, type:
M>reg sycw
reg sycw=00002171
You can find the bit 0 of SYCW register is set. This bit indicates the
CPU is in virtual mode.
Which Breakpoint
Has Hit ?
You will be unable to find which breakpoint has been hit in this
information because the virtual address 40000000H corresponds to
both real addresses 00006000H and 00007000H.
Virtual Mode Emulation Topics 3-17
To show the breakpoint status, type:
M>bp
### BREAKPOINT FEATURE IS ENABLED ###
bp 000006000@r #disabled
bp 000007000@r #enabled
Now, you can find the breakpoint is the real address 00006000H
because it is disabled. The address is the entry of the program Task A.
Displaying MMU
Registers
To display the on-chip MMU registers, enter:
M>reg mmu
reg
reg
atbr0=00002001
atbr2=00000000
atlr0=00000000
atlr2=00000000
atbr1=00002009
atbr3=00000000
atlr1=00000000
atlr3=00000000
You will verify the CPU is in Task A address space from the value of
atbr1 displayed.
Displaying Address
Translation Tables
You can display the 70632 Area Table Entry (ATE). To display the
ATE corresponding with address 40000000, enter:
M>ate 40000000
1:000 at 000002008 Present
PTB=000003100 Limit=003 Growth=positive
Execute level=0 Write level=0 Read level=0
You can also display the 70632 Page Table Entry (PTE). To display the
PTE corresponding with address 40000000, enter:
M>pte 40000000
1:000:000 at 000003100 Present
Page base=000006000 Executable Writable Readable
Not modified Accessed User=0 Not locked
The display shows the page base address is 00006000H. The addition
of this base address and the offset of virtual address "000H" is
00006000H. The address is the real address corresponding with the
virtual address 40000000H
You could also use section, area and page number with -i option
instead of address.
To display the ATE of Section 1, Area 0, enter:
M>ate -i 1:0
3-18 Virtual Mode Emulation Topics
To display the PTE of Section 1, Area 0, Page 0, enter:
M>pte -i 1:0:0
Continuing the
Execution
To continue the execution, enter:
M>r
!ASYNC_STAT
615! Software breakpoint: 040000000@v
The breakpoint hits at the virtual address 40000000H again. The real
address should be 00007000H. To show the breakpoint status, type:
M>bp
You can find the breakpoint of the real address 00007000H is disabled.
The address is the entry of program Task B.
To display the on-chip MMU registers, the ATE and PTE
corresponding with address 40000000H, enter:
M>reg mmu
reg
reg
atbr0=00002001
atbr2=00000000
atlr0=00000000
atlr2=00000000
atbr1=00002011
atbr3=00000000
atlr1=00000000
atlr3=00000000
M>ate 40000000
1:000 at 000002010 Present
PTB=000003200 Limit=003 Growth=positive
Execute level=0 Write level=0 Read level=0
M>pte 40000000
1:000:000 at 000003200 Present
Page base=000007000 Executable Writable Readable
Not modified Accessed User=0 Not locked
A few differences can be found from the results of the commands in
Task A virtual space which you entered. This is the another virtual
space for Task B.
Let’s look at the execution of Task B.
The Program Counter (PC) points to the entry of Task B. Task B will
transfer its message to the destination area.
To display the destination area, enter:
M>m -db 40003000..4000301f
040003000@v
040003010@v
54 48 49 53 20 49 53 20 54 41 53 4b 20 41 20 4d
45 53 53 41 47 45 2e 20 20 20 20 20 20 20 20 20
The message of Task A remains here.
Virtual Mode Emulation Topics 3-19
Step the three instructions by typing:
M>s 3
040000000@v 040000007@v 04000000e@v PC = 04000001c@v
MOV.W
MOV.W
MOVCFU.B
#00000020H,R26
#00000013H,R24
/40002000H,R24,/40003000H,#
To display the destination area once again. Type:
M>m -db 40003000..4000301f
040003000@v
040003010@v
54 61 73 6b 20 42 20 3a 20 52 75 6e 6e 69 6e 67
2e 2e 2e 20 20 20 20 20 20 20 20 20 20 20 20 20
You will find the message of Task B is transferred.
Enabling Breakpoints
in Virtual Address
You can enable or disable the software breakpoints, which was set with
real addresses, by using virtual addresses. Enter the following
command.
M>bp -e 40000000
To display the breakpoint enabled, enter:
M>bp
### BREAKPOINT FEATURE IS ENABLED ###
bp 000006000@r #disabled
bp 000007000@r #enabled
As the virtual address 40000000H in the current virtual space
corresponds to the real address 00007000H, the 7000@r is enabled.
To enable or disable the breakpoint with real address, add the suffix
"@r". Enter:
M>bp -e 6000@r
M>bp
### BREAKPOINT FEATURE IS ENABLED ###
bp 000006000@r #enabled
bp 000007000@r #enabled
Setting Breakpoints
in Virtual Address
Remove the all breakpoints, enter:
M>bp -r *
3-20 Virtual Mode Emulation Topics
Verify that the all breakpoints are removed by typing:
M>bp
### BREAKPOINT FEATURE IS ENABLED ###
Set the breakpoint at the address 40000000@v, and verify it.
Enter:
M>bp 40000000
M>bp
### BREAKPOINT FEATURE IS ENABLED ###
bp 040000000@v #enabled
Run the program from current PC, enter:
M>r
!ASYNC_STAT
615! Software breakpoint: 040000000@v
The emulator displays that the breakpoint hit.
To display the MMU registers to examine the address space.
M>reg mmu
reg
reg
atbr0=00002001
atbr2=00000000
atlr0=00000000
atlr2=00000000
atbr1=00002011
atbr3=00000000
atlr1=00000000
atlr3=00000000
The address space is for Task B. No break occurs at the address
40000000@v at Task A. You should note this when dealing
breakpoints with virtual address.
Display Privilege
registers
The 70632 microprocessor has several privilege registers which can be
accessed only if the execution level is "0". The level is known as the
privilege level. You can display the privilege registers by typing:
M>reg priv
reg isp=00005000 l0sp=40002000 l1sp=00000000 l2sp=00000000 l3sp=00000000
reg sbr=00000000
tr=00001064 sycw=00002171 tkcw=0000e000 pir=00007006
reg psw2=0000f002
The current values of the privilege registers are displayed.
Displaying TCB
You can display the register SYCW and stack pointers of each level in
current TCB. Type:
M>tcb
tkcw ATT=7 OTM=0 FIT=0 FZT=0 FVT=0 FUT=0 FPT=0 RDI=0 RD=0
l0sp=40001ff4
Virtual Mode Emulation Topics 3-21
You must designate the register list to display the complete TCB
contents of current task with -l option. The register list specifies
registers to be stored to or loaded from TCB when the task is switched.
The format of the register list is same as the 70632 processor’s
LDTASK or STTASK instruction operand. Since the register list of
current task is 7f000000H, enter:
M>tcb -l 7f000000
tkcw ATT=7 OTM=0 FIT=0 FZT=0 FVT=0 FUT=0 FPT=0 RDI=0 RD=0
l0sp=40001ff4
r24=00000013 r25=00000000 r26=00000020 r27=40003020 r28=40002013
r29=00000000 r30=00000000
atrp1 ATB=000002010 Limit=000 Growth=positive Valid
To display the TCB which is not current, specify the base address of
the TCB. Enter:
M>tcb -l 7f000000 1038
tkcw ATT=7 OTM=0 FIT=0 FZT=0 FVT=0 FUT=0 FPT=0 RDI=0 RD=0
l0sp=40001ff4
r24=00000017 r25=00000000 r26=00000020 r27=40003020 r28=40002017
r29=00000000 r30=00000000
atrp1 ATB=000002008 Limit=000 Growth=positive Valid
Using the XMMU
Function
As described in the previous section, the emulator uses the current
value of the 70632 address table register pairs by default when you
specify an address in virtual address in a command.
Suppose that you would like to debug a certain task executed in
multiple virtual space without stopping the execution. You will be
unable to specify the virtual address in desired virtual space, because
the address space is dynamically changed.
The XMMU function provides you to specify a desired virtual address
space. Regardless of the current virtual space, you can specify the
address space you want to note to. The emulator has the optional
XMMU class registers. These registers consist of eight XMMU register
pairs and one XMMU mode register. The XMMU register pairs
correspond to the actual 70632 area table register pairs. You can
specify a virtual address space by modifying the XMMU class
registers. These registers are not actual registers of the 70632 processor.
3-22 Virtual Mode Emulation Topics
When you set the contents of the XMMU class registers and activate
the XMMU function, the XMMU class registers are used for the
address translation of the virtual address you specify in a command,
instead of the actual area table register pairs of the 70632
microprocessor.
The XMMU class registers consist of the following registers.
XMMU class registers
xatbr0
xatlr0
xatbr1
xatlr1
xatbr2
xatlr2
xatbr3
xatlr3
corresponded actual registers
atbr0
atlr0
atbr1
atlr1
atbr2
atlr2
atbr3
atlr3
mmumod
--None--
If you set the value of the mmumod register in the above table to "1",
the emulator translates the virtual address in a command line with the
contents of the XMMU class registers instead of the actual area table
register pairs. Oppositely, if you want to make the emulator to translate
the virtual address in a command line with the actual table register
pairs, in other words the virtual address in the current address space,
reset the value of the mmumod register to "0".
Displaying the XMMU
Class Registers
Assuming that you want to note to the current task, Task B. Display the
XMMU class registers by typing:
M>reg xmmu
reg
reg
reg
mmumod=00000000
xatbr0=00000000
xatbr2=00000000
xatlr0=00000000
xatlr2=00000000
xatbr1=00000000
xatbr3=00000000
xatlr1=00000000
xatlr3=00000000
Also display the MMU registers to refer the value of area table register
pairs for the current task.
M>reg mmu
reg
reg
atbr0=00002001
atbr2=00000000
atlr0=00000000
atlr2=00000000
Modifying the XMMU
Class Registers
atbr1=00002011
atbr3=00000000
atlr1=00000000
atlr3=00000000
Modify the XMMU class registers to the current area table register
pairs by typing:
Virtual Mode Emulation Topics 3-23
M>reg xatbr0=2001
M>reg xatbr1=2011
There is another way to modify the XMMU class registers, as far as
you want to modify the registers to the value of the current area table
register pairs by using the "cpmmu" command.
In the above case, you didn’t have to type the reg command two times
because of modifying the registers for the current task. You could type
the only one command as follows.
M>cpmmu
To confirm the XMMU class registers modified, enter:
M>reg xmmu
reg
reg
reg
mmumod=00000000
xatbr0=00002001
xatbr2=00000000
xatlr0=00000000
xatlr2=00000000
xatbr1=00002011
xatbr3=00000000
xatlr1=00000000
xatlr3=00000000
To make the emulator use the configured address space when you enter
a virtual address, enter:
M>reg mmumod=1
Restart the program from the current PC which is the address the
emulator has been broken.
M>r
U>
Display the memory at the Message_B with the virtual address
40002000H.
U>m -db 40002000..4000201f
You should see:
040002000@v
040002010@v
54 61 73 6b 20 42 20 3a 20 52 75 6e 6e 69 6e 67
2e 2e 2e 00 9f eb b5 5f 54 5c 60 41 55 55 15 5c
Display the translation tables at the virtual address 40000000H by
typing:
U>ate 40000000
1:000 at 000002010 Present
PTB=000003200 Limit=003 Growth=positive
Execute level=0 Write level=0 Read level=0
U>pte 40000000
1:000:000 at 000003200 Present
Page base=000007000 Executable Writable Readable
Not modified Accessed User=0 Not locked
The contents of the tables displayed should be the execution
environment of Task B.
3-24 Virtual Mode Emulation Topics
The XMMU function also allows you to specify breakpoints with
virtual addresses in a desired address space by using the XMMU
function, even though the processor is executed in the other virtual
address space.
Besides by using the reg command, the mmumod register is reset
when the emulator breaks into monitor in the following causes.
Break by software breakpoint
Break by single-stepping
Break by writing to ROM
Break by access to guarded memory
In these case, the mmumod register is reset to "0". As the result, the
address translation of the virtual address in a command uses the actual
area table register pairs.
Using the Analyzer
Regardless of address mode, addresses which the analyzer captures are
real addresses by default. You can select which address the analyzer
should capture by changing the configuration item "cf tra". If you want
to make the analyzer capture the virtual address, enter:
U>cf tra=vir
Or, if you want to make the analyzer capture the real address, enter:
U>cf tra=real
Before setting a trace specifications, initialize the any trace
specifications you had changed.
U>tinit
To trace from the real address 00006000H which is the entry of Task A,
enter:
U>cf tra=real
U>tg addr=6000
U>t
Emulation trace started
Virtual Mode Emulation Topics 3-25
To display the trace list, type:
U>tl 0..24
Line
----0
1
2
3
4
5
6
7
8
9
10
11
12
13
14
15
16
17
18
19
20
21
22
23
24
addr,H
-------00006000
0000601f
00006004
00006008
0000600c
00006000
00006010
00006014
00006007
00006018
0000601c
00006020
00006024
00006028
00002008
0000200c
00003108
00002008
0000200c
0000310c
0000600e
0000a000
0000a001
0000c000
0000a002
data,H
-------20f43a2d
2d000000
2d000000
0017f438
8a580000
8a580000
002000f3
00f39840
20400030
20400030
d6a0f4f8
ffffe1f2
000000ff
777e5558
00003103
00000300
0000ae85
00003103
00000300
0000cf85
0000cf85
ffffff54
ffff48ff
00000054
ff49ffff
uPD70632 Mnemonic,H
-------------------------------------fetch aft br
No fetch cycle found
fetch
fetch
fetch
MOV.W
#00000020H,R26
fetch
fetch
MOV.W
#00000017H,R24
fetch
fetch
fetch
fetch
fetch
00003103H trans table read
00000300H trans table read
0000ae85H trans table read
00003103H trans table read
00000300H trans table read
0000cf85H trans table read
MOVCFU.B /40002000H,R24,/40003000H,
#20H
......54H data read
....48..H data read
......54H data write
..49....H data read
count,R
--------*********
*********
*********
*********
*********
*********
*********
*********
*********
*********
*********
*********
*********
*********
*********
*********
*********
*********
*********
*********
*********
*********
*********
*********
*********
The trace list shows the execution from the read address 00006000H.
To trace from the virtual address 40000000H which is the entry of both
Task A and Task B, enter:
U>cf tra=vir
U>tg addr=40000000
U>t
The trace list will be stored from whether the entry of Task A or Task B.
View the trace list by typing:
U>tl 0..24
3-26 Virtual Mode Emulation Topics
You will see:
Line
----0
1
2
3
4
5
6
7
8
9
10
11
12
13
14
15
16
17
18
19
20
21
22
23
24
addr,H
-------40000000
4000001f
40000004
40000008
4000000c
40000000
40000010
40000014
40000007
40000018
4000001c
40000020
40000024
40000028
00002010
00002014
00003208
00002010
00002014
0000320c
4000000e
40002000
40002001
40003000
40002002
data,H
-------20f43a2d
2d000000
2d000000
0013f438
8a580000
8a580000
002000f3
00f39840
20400030
20400030
d6a0f4f8
ffffe1f2
000000ff
5750875d
00003203
00000300
0000be85
00003203
00000300
0000cf85
0000cf85
ffffff54
ffff61ff
00000054
ff73ffff
uPD70632 Mnemonic,H
-------------------------------------fetch aft br
No fetch cycle found
fetch
fetch
fetch
MOV.W
#00000020H,R26
fetch
fetch
MOV.W
#00000013H,R24
fetch
fetch
fetch
fetch
fetch
00003203H trans table read
00000300H trans table read
0000be85H trans table read
00003203H trans table read
00000300H trans table read
0000cf85H trans table read
MOVCFU.B /40002000H,R24,/40003000H,
#20H
......54H data read
....61..H data read
......54H data write
..73....H data read
count,R
--------*********
*********
*********
*********
*********
*********
*********
*********
*********
*********
*********
*********
*********
*********
*********
*********
*********
*********
*********
*********
*********
*********
*********
*********
*********
Or:
Line
----0
1
2
3
4
5
6
7
8
9
10
11
12
13
14
15
16
17
18
19
20
21
22
23
24
addr,H
-------40000000
4000001f
40000004
40000008
4000000c
40000000
40000010
40000014
40000007
40000018
4000001c
40000020
40000024
40000028
00002008
0000200c
00003108
00002008
0000200c
0000310c
4000000e
40002000
40002001
40003000
40002002
data,H
-------20f43a2d
2d000000
2d000000
0017f438
8a580000
8a580000
002000f3
00f39840
20400030
20400030
d6a0f4f8
ffffe1f2
000000ff
777e5558
00003103
00000300
0000ae85
00003103
00000300
0000cf85
0000cf85
ffffff54
ffff48ff
00000054
ff49ffff
uPD70632 Mnemonic,H
-------------------------------------fetch aft br
No fetch cycle found
fetch
fetch
fetch
MOV.W
#00000020H,R26
fetch
fetch
MOV.W
#00000017H,R24
fetch
fetch
fetch
fetch
fetch
00003103H trans table read
00000300H trans table read
0000ae85H trans table read
00003103H trans table read
00000300H trans table read
0000cf85H trans table read
MOVCFU.B /40002000H,R24,/40003000H,
#20H
......54H data read
....48..H data read
......54H data write
..49....H data read
count,R
--------*********
*********
*********
*********
*********
*********
*********
*********
*********
*********
*********
*********
*********
*********
*********
*********
*********
*********
*********
*********
*********
*********
*********
*********
*********
Virtual Mode Emulation Topics 3-27
Note
In a analyzer command, you can not specify a address with a address
mode suffix such as "@r" or "@v". Additionally, the XMMU class
registers do not effect. You should configure which address mode the
analyzer should capture and you will specify in with "cf tra"
command, before starting trace.
The sample program transfers the character string data. Suppose that
you would like to trace the character translation by Task A.
Change the data format of the trace display so that you will see the
output message writes displayed in ASCII format:
U>tf addr,h data,A count,R seq
To specify the analyzer trace address mode to real.
U>cf tra=real
To set the trigger point at the entry address of Task A, 00006000H.
U>tg addr=6000
To store only the accesses to the addresses which are stored message of
Task A, range 0000a000H through 0000a01fH.
U>tsto addr=0a000..0a01f
Start the trace by typing:
U>t
You will see:
Emulation trace started
To view the trace listing, enter:
U>tl 0..24
3-28 Virtual Mode Emulation Topics
Line
----0
1
2
3
4
5
6
7
8
9
10
11
12
13
14
15
16
17
18
19
20
21
22
23
24
addr,H
-------00006000
0000a000
0000a001
0000a002
0000a003
0000a004
0000a005
0000a006
0000a007
0000a008
0000a009
0000a00a
0000a00b
0000a00c
0000a00d
0000a00e
0000a00f
0000a010
0000a011
0000a012
0000a013
0000a014
0000a015
0000a016
0000a017
data,A
-----..:...T
..H.
.I..
S...
....
..I.
.S..
....
...T
..A.
.S..
K...
....
..A.
....
M...
...E
..S.
.S..
A...
...G
..E.
....
....
count,R
--------*********
*********
*********
*********
*********
*********
*********
*********
*********
*********
*********
*********
*********
*********
*********
*********
*********
*********
*********
*********
*********
*********
*********
*********
*********
seq
--+
.
.
.
.
.
.
.
.
.
.
.
.
.
.
.
.
.
.
.
.
.
.
.
.
The trace listing shows that the processor reads characters to transfer
the message of Task A.
To view the continuation of the trace listing, type:
U>tl
Line
----25
26
27
28
29
30
31
32
33
34
35
36
37
38
39
40
41
42
43
44
45
46
47
48
49
addr,H
-------0000a000
0000a001
0000a002
0000a003
0000a004
0000a005
0000a006
0000a007
0000a008
0000a009
0000a00a
0000a00b
0000a00c
0000a00d
0000a00e
0000a00f
0000a010
0000a011
0000a012
0000a013
0000a014
0000a015
0000a016
0000a017
0000a000
data,A
-----...T
..H.
.I..
S...
....
..I.
.S..
....
...T
..A.
.S..
K...
....
..A.
....
M...
...E
..S.
.S..
A...
...G
..E.
....
....
...T
count,R
--------*********
*********
*********
*********
*********
*********
*********
*********
*********
*********
*********
*********
*********
*********
*********
*********
*********
*********
*********
*********
*********
*********
*********
*********
*********
seq
--.
.
.
.
.
.
.
.
.
.
.
.
.
.
.
.
.
.
.
.
.
.
.
.
.
Virtual Mode Emulation Topics 3-29
You will find the transfer of the Task A message is done continuously.
Contrary, specify the address in virtual address.
U>cf tra=vir
To set the trigger point at 40000000H
U>tg addr=40000000
To store only the accesses to the address range 40002000H through
4000201fH.
U>tsto addr=40002000..4000201f
Start the trace by typing:
U>t
You will see:
Emulation trace started
To view the trace listing, enter:
U>tl
Line
----0
1
2
3
4
5
6
7
8
9
10
11
12
13
14
15
16
17
18
19
20
21
22
23
24
addr,H
-------40000000
40002000
40002001
40002002
40002003
40002004
40002005
40002006
40002007
40002008
40002009
4000200a
4000200b
4000200c
4000200d
4000200e
4000200f
40002010
40002011
40002012
40002013
40002014
40002015
40002016
40002017
data,A
-----..:...T
..H.
.I..
S...
....
..I.
.S..
....
...T
..A.
.S..
K...
....
..A.
....
M...
...E
..S.
.S..
A...
...G
..E.
....
....
count,R
--------*********
*********
*********
*********
*********
*********
*********
*********
*********
*********
*********
*********
*********
*********
*********
*********
*********
*********
*********
*********
*********
*********
*********
*********
*********
3-30 Virtual Mode Emulation Topics
seq
--+
.
.
.
.
.
.
.
.
.
.
.
.
.
.
.
.
.
.
.
.
.
.
.
.
To view the continuation of the trace listing, type:
U>tl
Line
----25
26
27
28
29
30
31
32
33
34
35
36
37
38
39
40
41
42
43
44
45
46
47
48
49
addr,H
-------40002000
40002001
40002002
40002003
40002004
40002005
40002006
40002007
40002008
40002009
4000200a
4000200b
4000200c
4000200d
4000200e
4000200f
40002010
40002011
40002012
40002013
40002000
40002001
40002002
40002003
40002004
data,A
-----...T
..a.
.s..
k...
....
..B.
....
:...
....
..R.
.u..
n...
...n
..i.
.n..
g...
....
....
....
....
...T
..H.
.I..
S...
....
count,R
--------*********
*********
*********
*********
*********
*********
*********
*********
*********
*********
*********
*********
*********
*********
*********
*********
*********
*********
*********
*********
*********
*********
*********
*********
*********
seq
--.
.
.
.
.
.
.
.
.
.
.
.
.
.
.
.
.
.
.
.
.
.
.
.
.
Because the locations of both Task A and Task B messages are the
same address in virtual, the message which is stored in the beginning of
the trace listing may be of Task B.
Anyway, you will find the messages of Task A and Task B are
alternately read from the same address range 40002000H through
4000201fH.
Virtual Mode Emulation Topics 3-31
Notes
3-32 Virtual Mode Emulation Topics
4
Using The Emulator
Introduction
Many of the important topics described in this chapter involve the
commands or features which relate to using the emulator. The "Getting
Started" and "Virtual Mode Emulation Topics" chapters shows you
how to use the basic features of the 70632 emulator. This chapter
describes more information or notices of the 70632 emulator.
This chapter contains the following topics.
Register Manipulation
– Stack Pointer and Program Status Word Modification.
– Floating-Point Format Display or Modification
Analyzer Topics
– Analyzer Status Labels
– Analyzer Trigger Condition
– Trace Listing Disassembler
– Execution States
– Analyzer Data Bus Condition
– Analyzer Clock Speed
– Cause of Monitor Break
Hardware Breakpoints
Software Breakpoints
Target Memory Access
FPU Support
MMU Support
Coordinated Measurement
Unfamiliar Prompts
70118/70116 Emulation Mode
FRM Support
Real-time Emulation Memory Access
Virtual Address Translation
Restrictions and Considerations
Using the Emulator 4-1
Prerequisites
Before performing the tasks described in this chapter, you should be
familiar with how the emulator operates in general. Refer to the
Concepts of Emulation and Analysis manual and the "Getting Started"
and "Virtual Mode Emulation Topics" chapters of this manual.
Register
Manipulation
Stack Pointer
Modification
In the 70632 microprocessor, one of the five privileged registers
(L0SP, L1SP, L2SP, L3SP, ISP) is selected as stack pointer according
to the EL and IS flags of the PSW, and the stack pointer is cached by
SP. The contents of the stack pointer corresponding to the execution
level are not always the same as the stack pointer (SP). The stack
pointer corresponding to the execution level is updated only when the
execution level is changed.
The emulation monitor is executed in execution level 0. When the
emulator returns from emulation monitor to user program, for example
when you issue r (run) command, the emulator changes execution level
from 0 to user program’s execution level which is determined by the IS
flag and EL field in the program status word (PSW).
For this reason, in emulation monitor, the stack pointer (SP) and the
stack pointer corresponding to the execution level need to have the
same value. The monitor intends to keep the stack pointer (SP) and the
current level stack pointer to have the same value.
When breaking into monitor, the current level stack pointer is modified
to the value of SP.
4-2 Using the Emulator
If you modify registers PSW, L0SP, L1SP, L2SP, L3SP or SP in
monitor, note the following.
When you modify the EL or IS flag of the PSW, the SP is
modified to the value of the stack pointer corresponding to the
execution level which is determined by the EL or IS flag of
the PSW you have modified.
When you modify the stack pointer corresponding to the
current execution level (L0SP, L1SP, L2SP, L3SP, ISP), the
stack pointer SP is modified to the same value.
When you modify the stack pointer SP, the stack pointer
corresponding to the execution level (L0SP, L1SP, L2SP,
L3SP or ISP; the one selected depending on the contents of
the PSW) is modified with the same value.
Displaying/Modifying
Registers In
Floating-Format
You can display/modify general purpose registers (R0 through R31) in
floating-point format with freg command. The IEEE-754 standard data
type is supported.
To display all general purpose registers in short real format, enter:
freg
You can specify register(s) to be displayed.
freg r0 r1
To display two consecutive registers R0 and R1 in long real format,
enter:
freg -l r0
Modify register R0 to the value 12345.678, by typing:
freg r0=12345.678
Verify the value of the R0 you have modified.
freg r0
For more informations, refer to the "freg" syntax pages in this chapter.
Using the Emulator 4-3
Analyzer Topics
Analyzer Status
Qualifiers
base
coprd
coproc
copwr
data
datard
datawr
exe
fault
fetch
fetchbr
grd
halt
hold
int
io
iord
iowr
lock
mon
retry
short
shortrd
shortwr
trans
transrd
transwd
wrrom
The following are the analyzer status labels which may be used in the
"tg" and "tsto" analyzer commands.
0xxxxxxxxxxxx0100
0x1xxxxxxxxxx1000
0xxxxxxxxxxxx1000
0x0xxxxxxxxxx1000
0xxxxxxxxxxxx0011
0x1xxxxxxxxxx0011
0x0xxxxxxxxxx0011
0xxxxxxxxxxxx0000
0xxxxxxxxxxxx1100
0x1xxxxxxxxxx011x
0x1xxxxxxxxxx0111
0xxxxxxxxxx0x0xxx
0xxxxxxxxxxxx1101
0xxxxxxxxxxxx0001
0xxxxxxxxxxxx1110
0xxxxxxxxxxxx1011
0x1xxxxxxxxxx1011
0x0xxxxxxxxxx1011
0xxxxxxxx0xxxxxxx
0xxxxxxxxxxx0xxxx
00xxxxxxxxxxxxxxx
0xxxxxxxxxxxx0010
0x1xxxxxxxxxx0010
0x0xxxxxxxxxx0010
0xxxxxxxxxxxx0101
0x1xxxxxxxxxx0101
0x0xxxxxxxxxx0101
0x0xxxxxxx0xx0xxx
Specifying Trigger
Condition at Desired
Instruction Execution
system base table access
co-processor access read
co-processor access(read/write)
co-processor access write
data access (read/write)
data access read
data access write
execution state
machine fault acknowledge
code fetch
code fetch after branch
guarded memory access
halt acknowledge
bus hold
interrupt acknowledge
i/o access (read/write)
i/o access read
i/o access write
bus lock
background monitor cycle
retry
data access (read/write) with short path
data access read with short path
data access write with short path
translation table access (read/write)
translation table access read
translation table access write
write to ROM
In the "Using the Analyzer" section of the "Getting Started" chapter,
you used the analyzer to trace the states of the program after that the
instruction located at address 10033H was executed. Then the
following command was issued to specify trigger condition.
tg addr=10033 and stat=exe
As you know, the 70632 processor has the prefetch unit (PFU) to
prefetch the instruction string to be executed.
If you had issued the following command instead, unexpected trigger
would have occurred at the prefetch state of the address 10033H.
tg addr=10033
This discussion is significant when you specify the trigger condition at
the execution of the instruction which follows a branch instruction like:
4-4 Using the Emulator
000020012@r
000020016@r
000020018@r
-
CMP.B
BZ
MOV.W
#00H,R2
00020000H
#0000000fH,R0
Assume that the processor executes instructions at address range
20000H through 20016H normally, and the instruction at address
20018H is executed at long intervals.
If you wish to trigger the analyzer at the execution of the address
20018H, you should specify trigger condition as follows.
tg addr=20018 and stat=exe
If you would type the following, the trigger will always occur at the
prefetch of the address 20018H whether or not the branch condition at
address 20016H is satisfied.
tg addr=20018
Disassembles In
Trace Listing
As you can see disassembles in analyzer trace listing, the emulator has
disassemble capability in trace listing. When the emulator disassembles
instructions in stored trace information, the prefetch cycles of each
instruction are required.
In the "Using the Analyzer" section of the "Getting Started" chapter,
you configured the analyzer to trace the states of the program after the
read states of address 30000H and data=0xxxxxx42H by typing:
U>tp s
U>tg addr=30000 and data=0xxxxxx42
U>t
When you displayed the results of analyzer trace, some lines which
include "No fetch cycle found" messages were displayed. Each line
was instruction execution cycle at the address in the left side of the
line. However, the disassembles of these instructions were not
displayed because the prefetch states for the instructions were not
stored by the analyzer.
To display complete disassembles in trace listing, you should modify
location of trigger state in trace list, referred to as the "trigger position",
with "tp" command. (See the "tp" command syntax in the HP 64700
Emulators Terminal Interface Reference manual.)
The trigger position was at the start of the trace listing, because you
wished to trace the states of the program after the triggered state. ("tp
s" command)
Using the Emulator 4-5
For complete disassembles, specify the trigger point that ten states will
be stored before the trigger point by typing the following command
instead of "tp s".
tp -b 10
To display the trace listing from the triggered state, enter.
tl 0
You will see complete disassembles in trace listing.
In this example, the trigger position was specified to store the 10 states
before the trigger. According to your program, more states may be
required for complete disassembles.
Execution States
Location in Trace
Listing
The emulation analyzer stores execution states of the program in
addition to actual bus cycles, if configuration item "cf tre" is enabled.
When the processor executes an instruction, the execution state of the
instruction is generated before its bus state(s) by the execution of the
instruction.
However, it is possible that the execution states are inserted after or
between the actual bus states of these activities, since the clock rate of
bus sampling is high-speed.
The following trace listing shows the example that the execution state,
numbered 64, falls behind its bus activity.
61
62
63
64
65
66
00003004
00003004
00001004
00005043
0000504a
00005060
00001e05
00001e85
00000002
00000002
00000002
2da20801
Specifying Data For
Trigger Condition or
Store Condition
00001e05H trans table
00001e85H trans table
00000002H data read
MOV.W
00001004H,R0
MOV.W
#00001008H,R1
fetch
read
write
The analyzer captures the data bus of the 70632 microprocessor. When
you specify a data in the analyzer trigger condition or store condition,
the ways of the analyzer data specifications differ according to the data
size and the address. Suppose that you wish to trigger the analyzer
when the processor accesses to the byte data 41H in the address 1000H.
You should not specify the trigger condition like this.
tg addr=1000 and data=41
4-6 Using the Emulator
*********
*********
*********
*********
*********
*********
The data condition will be considered as 00000041H. The bit 31
through bit 8 of data bus is unpredictable because of the byte data. You
will unable to trigger as you desire. You should have entered as follows.
tg addr=1000 and data=0xxxxxx41
Where x’s are "don’t care" bits.
When the address that you want to trigger is not a multiple of 4, the
data bus specification is different from the above. If you trigger the
analyzer at the address 1001H instead of the address 1000H, the data
41H will be output to the bit 7 through bit 4 of the data bus. You
should enter:
tg addr=1001 and data=0xxxx41xx
In case of halfword or word access to the data bus, it will be more
complex, if two bus states are required to access the data because the
data is across 4 byte boundary.
In this case, you need to use the analyzer sequential trigger capabilities.
We do not describe the detail about the sequential trigger feature. Only
how to trigger the analyzer at some example cases is described in this
section.
To trigger the analyzer when the processor accesses the word data
12345678H at the address 1003H. The data bus activity of this cycles
will be as follows.
Sequencer level
1
2
Address bus
00001003
00001004
Data bus
78xxxxxx
xx123456
To specify the condition of sequencer level 1, enter:
tif 1 addr=1003 and data=78xxxxxx
To specify the condition of sequencer level 2, enter:
tif 2 addr=1004 and data=xx123456
To restart sequencer when any states except for exe state are generated
between sequencer term 1 and 2.
telif stat!=exe
Start trace by typing:
t
Analyzer Clock
Speed
The emulation analyzer can capture both the exe states and bus states.
Using the Emulator 4-7
Bus states show actual processor’s bus activity.
Exe states indicate the address of the first byte of an executed opcode.
Only the address and processor status fields are valid during these
states.
The analyzer has a counter which allows to count either time or
occurrence of bus states.
Tracing both bus cycles and exe states, effectively doubles the clock
rate to the analyzer. If the system clock speed is 20 MHz, the analyzer
will be collecting states at a rate in maximum 20 MHz.
By default, the analyzer time counter is turned off. This is because the
analyzer time counter cannot be used at clock speeds greater than 16
MHz. The internal emulator clock is 20 MHz when clocking both bus
cycles and execution states. In addition, the analyzer state counter
cannot be used at speeds greater than 20 MHz. If it is desired to use the
analyzer counter, one of the following ways can be done.
The clock speed can be effectively halved if execution states
are NOT traced. This is accomplished using the configuration
item "cf tre=dis".
The other method is to slow the bus clock using an external
clock. The internal clock is fixed and is NOT easily changed.
To trace both bus cycles and exe states, the configuration item "cf tre"
should be enabled. Issue the following command.
cf tre=en
By default, the analyzer time tagging or # of states counter field in
trace listing will be displayed as "*********".
If you wish to trace both bus cycles and exe states and also wish to use
the analyzer tag counter. you have the following two alternatives
according to the system clock speed.
1. If you use the internal system clock or if your target system
clock rate is greater than 16 MHz, you can use the analyzer
state counter. Change the mode of the analyzer clock speed to
First, by entering:
tck -s F
4-8 Using the Emulator
The First mode allows you to use the analyzer tag counter as
the state counter. The analyzer state counter counts
occurrences of the states which you specify. Assume that you
would like to count occurrences of the states which the
processor read a data from the address 123456H.
tcq addr=123456 and stat=read
Now, specify the trigger condition and start the trace.
2. If your target system clock rate is equal to 16 MHz or less
than 16 MHz, you can use the state counter or the time counter
of the analyzer. Change the mode of the analyzer clock speed
to Slow, by entering:
tck -s S
The Slow mode allows you to use the analyzer tag counter as
either the state counter or the time counter. The analyzer tag
counter counts occurrences of the states which you specify or
the amount of time between stored states. The following is
example of the usage of the analyzer tag counter as the time
counter. Assume that you would like to count time between
states.
tcq time
Now, specify the trigger condition and start the trace.
Finding Out the
Cause of a Monitor
Break
If the emulator breaks into monitor unwillingly, you can examine the
cause of the break by using the analyzer. When you issue the following
commands, you can capture the behavior of the program just before the
monitor break.
Specify the trigger condition that the analyzer is never triggered.
tg never
Specify the store condition that the analyzer captures any states.
tsto any
Start the trace.
t
After starting your program, the unexpected break will occur. To show
the cause of the break, stop the trace and display the trace listing.
Using the Emulator 4-9
th
tl -19..0
The trace listing displays will show the cause of the break. If you
cannot find the cause of the break, display the previous states. If the
trace listing does not include the fundamental problem, you need to
change the trigger condition to capture the problem, and then restart the
trace and the program.
This is also useful to detect the causes other than monitor breaks like a
processor halt.
4-10 Using the Emulator
Hardware
Breakpoints
The analyzer may generate a break request to the emulation processor.
To set up a break condition upon an analyzer trigger, follow the steps
below.
Specify the Signal Driven when Trigger is Found
Use the tgout (trigger output) command to specify which signal is
driven when the analyzer triggers. Either the "trig1" or the "trig2"
signal can be driven on the trigger.
tgout trig1
Enable the Break Condition
Enable the "trig1" break condition.
bc -e trig1
Additionally, you can see the program states before the breakpoint in
trace listing. Specify the trigger position at the end of trace listing by
typing:
tp e
After you specify the trigger to drive "trig1" and enable the "trig1"
break condition, set up the trace, issue the t (trace) command, and run
the program. When the trigger condition is found, emulator execution
will break into the emulation monitor. Then you can also see the trace
listing mentioned above, enter the following commands.
Stop the trace by typing:
th
Display the twenty states at the end of the trace listing by typing:
tl -19..0
The trace listing will show the cause of the break.
Without the trigger condition, the trigger will never occur and will
never break.
The break condition on trig1 that you have enabled should be disabled
when you use the analyzer in order to only trace states of your
program. If you neglect and issue t (trace) command, the execution of
the program will break at the trigger you have specified unexpectedly.
Using the Emulator 4-11
Example
Configuration for
Hardware
Breakpoints Features.
The following are example configurations for typical break conditions
you will use.
Breaks on Executing an Instruction
If you wish to break the execution when an instruction is executed. To
specify the breakpoint when the instruction at address 12345678H is
executed.
tg addr=12345678 and stat=exe
Start the trace by typing:
t
Breaks on Accessing an Address
If you wish to break the execution when a certain data is written to a
certain memory location. To specify the breakpoint when the halfword
data 0abcdH is written to the address 87654321H.
tg addr=87654321 and data=0xxabcdxxH
and stat=write
Start the trace by typing:
t
The detail of analyzer data specification in the trigger condition is
described in "Specifying Data For Trigger Condition or Store
Condition" part of this section.
4-12 Using the Emulator
Breaks on 70632 Exceptions
In case that you test a simple program which does not have exception
handler, you want to break the emulator on a 70632 exception. It is
useful to specify the breakpoint when a 70632 exception is occurred.
There are two way to detect the 70632 exceptions as follows.
Detect the states of the System Base Table Access at Events.
To specify the breakpoint when the system base table access
occurs by an event (exception or interrupt), enter:
tg stat=base
Detect the states of the Address Range of System Base Table.
To specify the breakpoint when the address range of the
system base table access occurs (except for Software Trap and
Maskable Interrupt), enter:
tg addr=0..0bf
If the program to be tested uses the 70632 Software Trap or Maskable
Interrupt or any other trap or exceptions on purpose, use the method of
"Detect the System Base Table Access".
If the program to be tested accesses the 70632 system base tables
which pointed at the SBR register on purpose, use the method of
"Detect the Address Range of System Base Table".
Now start the trace by typing:
t
Using the Emulator 4-13
Software
Breakpoints
Software breakpoints are realized by the 70632 BRK instruction. When
you define or enable a software breakpoint (with the bp command), the
emulator will replace the opcode at the software breakpoint address
with a breakpoint interrupt instruction (BRK). When the BRK
instruction is executed, the emulator breaks into monitor and compares
the address that the break occurred.
If the address is defined as software breakpoint, the emulator displays
that the breakpoint hit. The emulator disable the breakpoint and replace
the BRK instruction with the original opcode.
If the BRK interrupt was generated by a BRK interrupt instruction in
the target system, execution still breaks to the monitor, and an
"undefined breakpoint" status message is displayed. To continue with
program execution, you must run or step from the target program’s
breakpoint interrupt vector address.
There are some attentions when you use the software breakpoint
features.
Software breakpoints should be set at only locations which
contain instruction opcodes.
You must only set software breakpoints at memory locations which
contain instruction opcodes (not operands or data). If a software
breakpoint is set at a memory location which is not an instruction
opcode, the software breakpoint instruction will never be executed and
the break will never occur.
Software breakpoints should be set when the emulator is
running in monitor.
Software breakpoints should not be set, enabled, disabled, or removed
while the emulator is running user code. If any of these commands are
entered while the emulator is running user code, and the emulator is
executing code in the area where the breakpoint is being modified,
program execution may be unreliable.
4-14 Using the Emulator
Software breakpoints cannot be set in target ROM.
Because software breakpoints are implemented by replacing opcodes
with the BRK instructions, you cannot define software breakpoints in
target ROM.
You can, however, copy target ROM into emulation memory (see the
"Target ROM Debug Topics" section of the
"In-Circuit Emulation" chapter).
BRK instruction vector must be set up
You must define the 70632 break-point instruction trap vector to point
to an address which is allowed instruction fetch; typically in the
program code area.
When a software breakpoint occurred, the emulator breaks into the
monitor after the BRK instruction has been executed. However the
instruction which is pointed by the BRK instruction vector is never
executed.
If you didn’t set up the vector and a software break has occurred, an
access to the address pointed by the vector may drive the emulator into
unpredictable state. The 70632 break-point instruction vector is defined
in the 70632 system base table. The vector is located at
0XXXXXX34H; where "XXXXXX" is determined by the contents of
the privilege register SBR (defaults is "000000").
This table location depends on the content of 70632 SBR register.
More three words of the stack area must be prepared.
When the BRK instruction is executed, the emulator stores the
exception information to stack as the same as the 70632
microprocessor does.
So, you should prepare more three words (12 bytes) for stack in
addition. The stack, which is used when the breakpoint occurs, is
normally the level 0 stack which is pointed by L0SP. When the
software breakpoint occurs, if the program uses interrupt stack, the
three words of the interrupt stack pointed by ISP is modified by the
emulator instead of level 0 stack.
Using the Emulator 4-15
Software Breakpoint Manipulation In Virtual Mode
When you enable, disable or remove a software breakpoint which you
have set by using virtual address, you must issue its command in same
virtual space when you have set.
The notices related to software breakpoint manipulation in virtual
mode are described in chapter 3.
Target Memory
Access
Commands Not
Allowed when
Real-Time Mode is
Enabled
When emulator execution is restricted to real-time and the emulator is
running in user code, the system refuses all commands that require
access to processor registers or target system memory or I/O. The
following commands are not allowed when runs are restricted to
real-time:
Register display/modification (except for XMMU class
registers).
Target system memory display/modification. Because the
emulator contains dual-port emulation memory, commands
which access emulation memory do not require breaks and are
allowed while runs are restricted to real-time.
I/O display/modification.
Step.
Area Table Entry display (which is in target system memory).
Page Table Entry display (when the PTE or the dependent
ATE is/are in target system memory).
Any other commands with virtual address designation (which
cause target system memory accesses for address translation).
4-16 Using the Emulator
When you specifies virtual addresses in commands, the
emulator will refer to the address translation tables to translate
the virtual addresses to the corresponded real addresses. If the
address translation tables which are required to translate the
specified virtual addresses is in target system memory, the
address translation will be failed.
If the real-time mode is enabled, these resources can only be displayed
or modified while running in the monitor.
Breaking out of
Real-Time Execution
The only commands which are allowed to break real-time execution
are:
rst (reset), r (run), b (break)
FPU Support
The emulation analyzer can capture co-processor cycles. FPU register
display and modification are not supported.
There are following considerations to display co-processor mnemonics
in trace or memory display.
FMOVCR instruction
FMOVCR instruction will be displayed as follows:
FMOVCTW
FCTW
FMOVPTW
FPTW
FMOVSTW
FSTW
instead of FMOVCR
OP1,
instead of FMOVCR
OP1,
instead of FMOVCR
OP1,
Instructions with no operand
Dummy operands are displayed when dis-assembling instructions
without any operand. As a sign, "#" is displayed just after Opcode
mnemonics as follows.
0000fe86a@r -
FRPUSH #
FR0,FR0
Using the Emulator 4-17
Two "FR0"s are dummy operands. The following instructions relate
this.
FADD3M.S
FSUB3M.S
FMUL3M.S
FRPUSH
FADD3M.L
FSUB3M.L
FMUL3M.L
FRPOP
FADD4M.S FADD4M.L
FSUB4M.S FSUB4M.L
FMUL4M.S FMUL4M.L
FAFFECT
Instructions with one operand
Dummy operand is displayed when dis-assembling instructions with
only one operand. As a sign, "*" is displayed just after Opcode
mnemonics as follows.
0000fe87a@r -
FRREL *
/00000100H,FR0
The "FR0" is a dummy operand. The following instructions relate this.
FIPV.S
MMU Support
4-18 Using the Emulator
FIPV.L
FRPINC
FRREL
The ate and pte commands allow you to display Area Table Entry and
Page Table Entry for an address you specified in the commands. These
commands are useful to examine in which address space the program
are executed, and detect the address translation error of the program.
Examples of these command usages are described in "Virtual Mode
Emulation Topics" chapter. These command syntax are shown in
"70632 Emulator Specific Command Syntax" appendixa.
Making
Coordinated
Measurements
Coordinated measurements are measurements made between multiple
HP 64700 Series emulators which communicate via the Coordinated
Measurement Bus (CMB). Coordinated measurements can also include
other instruments which communicate via the BNC connector. A
trigger signal from the CMB or BNC can break emulator execution into
the monitor, or it can arm the analyzer. An analyzer can send a signal
out on the CMB or BNC when it is triggered. The emulator can send an
EXECUTE signal out on the CMB when you enter the x (execute)
command.
Coordinated measurements can be used to start or stop multiple
emulators, start multiple trace measurements, or to arm multiple
analyzers.
As with the analyzer generated break, breaks to the monitor on CMB or
BNC trigger signals are interpreted as a "request to break". The
emulator looks at the state of the CMB READY (active high) line to
determine if it should break. It does not interact with the EXECUTE
(active low) or TRIGGER (active low) signals.
For information on how to make coordinated measurements, refer to
the HP 64700 Emulators Terminal Interface: Coordinated
Measurement Bus User’s Guide manual.
Unfamiliar
Prompts
When you are using the emulator, one of the following prompts is
displayed normally.
R>
The emulator is in reset
state
U>
The emulator is running user
program
M>
The emulator is running in
monitor
Using the Emulator 4-19
If your target system has a defect or you does not configure the
emulator appropriately, the following prompts may be displayed.
w> waiting for target ready
h> halt or machine fault
Waiting for Target
Ready
The prompt "w>" indicates that the emulator is waiting for target ready
signal.
If you map the unused memory locations as target memory and your
program accesses to these locations by a defect (in case of in-circuit,
also if a target memory is accessed by an emulation command), the
emulator is waiting for an impossible ready signal infinitely because
the /READY signal is internally pulled up. When you encounter the
prompt "w>", the emulator cannot break into monitor. All you can do
is to reset the processor.
If you are using the emulator in in-circuit mode, the reason is that the
emulator intends to access to a memory location for which your target
system does not generate ready signal.
If you are using the emulator in out-of-circuit mode, the reason is that
the emulator intends to access to a target memory location by your
program. To prevent this, all of memory locations, which are not used,
should be mapped as guarded memory. When you direct the emulator
to access a target memory location, the emulator will return an error
message.
Halt or Machine Fault
The prompt "h>" indicates that the emulator is halted or in machine
fault.
In case of machine fault, all you can do will be to reset the processor
because the emulator cannot break into monitor.
One of the causes is the exception by a address translation failure. In
this case, one of the solution is to use the analyzer. The analyzer will
capture states which causes the emulator to halt. Refer to the "Finding
out the Cause of a Monitor Break" description of the "Analyzer
Topics" section in this chapter, for the analyzer configuration.
4-20 Using the Emulator
70108/70116
Emulation Mode
The 70632 microprocessor has the 70108/70116 emulation mode. In
this mode, the 70632 executes instructions as 70108/70116
microprocessor’s ones.
The emulator provides the following functions for both 70108/70116
and 70632.
Display memory contents in processor mnemonic format.
Single-stepping
Analyzer trace
Displaying Memory
In 70108/70116
Mnemonic Format
The emulator can display contents of memory in mnemonic format for
both 70108/70116 and 70632. The emulator provides both inverse
assemblers for 70108/70116 and 70632. You can select one of the
inverse assemblers to display memory contents by using configuration
item "cf mil".
To display memory contents in 70108/70116 mnemonic, change the
disassembler by typing:
cf mil=v20_30
Issue the m (memory) command.
To display memory contents in 70632 mnemonic (default), enter:
cf mil=v70
Issue the m (memory) command.
Single-stepping
You can also single-step the instructions in the 70108/70116 emulation
mode. When you single-step the instructions, mnemonics of the
executed instruction is displayed in corresponded processor’s ones.
However, when you modify the contents of PSW to change the mode
with the reg command, a mnemonic of next one instruction is
displayed in wrong processor mnemonic.
Tracing States In
Both Mode
You can also trace the bus states and exe states in the 70108/70116
emulation mode. When tracing the execution of the program,
Using the Emulator 4-21
mnemonics of the executed instructions are included in trace listing.
The corresponded processor mnemonics are displayed automatically.
Real-time
Emulation
Memory Access
The dual-port memory for the emulation memory allows emulation
displays and modifications of emulation memory without breaking the
processor into the monitor during emulation.
This is referred to as the Real-time Emulation Memory Access
capability.
If you issue emulation memory display/modification command while
the emulation program is running, HP 64700 emulation controller, not
the emulation processor, intends to access the dual-port emulation
memory with the cycle-stealing method. The emulation memory
accesses without breaking the processor into the monitor are
accomplished for this reason.
When cycle-stealing to access to the emulation memory, the emulation
controller watches for idle cycles in the 70632 bus cycles. When the
idle cycles are found, the emulation controller can access to the
emulation memory at the interval of the 70632 bus cycles with
cycle-stealing.
However, in case that the emulation controller cannot find any idle
cycles, the emulation controller holds the 70632 bus cycles (not but
breaking into the monitor) in order to access to the emulation memory.
If your target system inserts some wait states to access to memory, no
idle cycle may be generated. It is depended on WHAT instructions are
executed when the emulation memory access command is issued, or
HOW much wait states are inserted.
When there is no idle cycle within 160 mS, the hold request will be
generated to the emulation processor except that the emulator is held,
bus-frozen or reset.
4-22 Using the Emulator
Virtual Address
Translation
When you specify virtual addresses in emulation commands, the
emulator intends to translate these virtual addresses to actual memory
addresses in order to manipulate contents of these memory locations.
For the address translation, the 70632 microprocessor uses its area
table register pairs, which define a virtual address space. Similarly, the
emulator requires values which corresponds to the 70632 area table
register pairs.
Using the Caches of
Area Table Register
Pairs
The emulator has the caches of the area table register pairs, which
allow the emulator to refer the corresponded area table for the address
translations even if the emulator cannot to or is not allowed to break
into the monitor.
Each time the emulator breaks into monitor, the caches are updated by
the contents of the 70632 area table register pairs.
By default, the emulator uses the caches to translate the addresses
which you specify in emulation commands. The caches contain the
base addresses and the lengths of the area tables as the same as the
70632 area table register pairs. The emulator refers to the corresponded
area table and page table by using the caches.
If the emulator is restricted to real-time runs by the "cf rrt=en"
configuration command, the caches will keep the values while you do
not break the emulator into the monitor intentionally. Only when you
issue "b", "s" or "rst" command or a break condition (such as software
breakpoint) is satisfied, the caches are updated.
If the emulator is not restricted to real-time runs (default), the caches
are updated by the contents of the area table register pairs every time
the emulator breaks into monitor whether with or without your
intention. When you issue commands with virtual addresses, the
emulator breaks into the monitor to access the area table register if
possible. As the result, the emulator will use the current virtual address
space for address translations.
In the both cases, when the emulator cannot break into monitor, for
example the processor is reset, the emulator uses the caches for the
address translation.
Using the Emulator 4-23
Specifying Virtual
Address Space
When you specify virtual addresses in emulation commands, the
emulator translates the virtual address to corresponded real addresses.
The translated real addresses depends on a virtual address space. The
virtual address space can be defined by the values of area table base
and length for each section. In 70632 microprocessor, these
informations are stored in its area table register pairs.
In case that the caches mentioned above are used for the address
translation, it is difficult to specify an virtual address in your desirable
virtual address space during running user program. If your program
performs in multiple virtual space, you may want to specify a virtual
address space for address translations in order to watch for the
execution of a certain task.
This is accomplished by using the XMMU function. The XMMU
function allows you to fix a virtual address space for address
translations. The emulator has the optional XMMU class registers.
These registers consist of eight XMMU register pairs and one XMMU
mode register. The XMMU register pairs correspond to the actual
70632 area table register pairs. You can specify a virtual address space
by modifying the XMMU class registers. The format of the XMMU
class registers is the same as the 70632 actual area table register pairs.
The XMMU class registers also include the XMMU mode register
(mmumod), which determines whether the caches or the contents of the
XMMU register pairs are used for address translations. By default, the
caches are selected.
If you activate the XMMU function, the emulator uses the contents of
the XMMU register pairs for address translations whether or not the
emulator is restricted to real-time runs.
The XMMU class registers consist of the following registers.
XMMU class registers
xatbr0
xatlr0
xatbr1
xatlr1
xatbr2
xatlr2
xatbr3
xatlr3
corresponded actual registers
atbr0
atlr0
atbr1
atlr1
atbr2
atlr2
atbr3
atlr3
mmumod
--None--
4-24 Using the Emulator
To specify a virtual address space which is used for address
translations, modify the contents of the XMMU register pairs
corresponded to the area table registers by using the reg (register)
command or the cpmmu (copy current virtual address space to XMMU
registers) command. See also the "Using the XMMU function" section
of chapter 3 and the "cpmmu" command syntax of chapter 4.
After you have modify the contents of the XMMU register pairs,
activate the XMMU function by changing the contents of XMMU
mode register (mmumod) to the value 1.
reg mmumod=1
To use the caches of the area table register pairs for address
translations, modify mmumod register to 0 (default).
reg mmumod=0
Besides by using the reg command, the mmumod register is reset
when the emulator breaks into monitor in the following causes.
Break by software breakpoint
Break by single-stepping
Break by writing to ROM
Break by access to guarded memory
In these case, the mmumod register is reset to "0". As the result, the
address translation of the virtual address in a command uses the actual
area table register pairs.
Using the Emulator 4-25
Restrictionas and
Considerations
When the microprocessor accesses data which are not aligned, the
microprocessor generates more than twice memory access cycles.
If the microprocessor accepts interrupt while microprocessor reads the
data which are not aligned, the microprocessor stop accessing the data
and generates invalid memory write cycle.
But, memory is not changed because bus enable signals(BS0-BS3) are
inactive, and stopped memory read cycles are reexecuted after interrupt
routine.
If you specify that bc -e rom and if microproccessor generates invalid
memory write cycle described above in user’s program, the emulator
break into the monitor.
4-26 Using the Emulator
5
In-Circuit Emulation Topics
Introduction
Many of the topics described in this chapter involve the commands
which relate to using the emulator in-circuit, that is, connected to a
target system.
This chapter will:
Describe the issues concerning the installation of the emulator
probe into target systems.
Show you how to install the emulator probe.
Describe how to set up the emulator to use a target system
clock.
Describe how to use software breakpoints with ROMed code,
how to perform coverage testing on ROMed code, and how to
test patches to ROMed code. These topics relate to the
debugging of target system ROM.
Describe target interrupts.
Describe DMA operation.
Describe how to access to target I/O resource.
Describe FRM function.
Describe Target Interface.
In-Circuit Emulation Topics 5-1
Prerequisites
Before performing the tasks described in this chapter, you should be
familiar with how the emulator operates in general. Refer to the
Concepts of Emulation and Analysis manual and the "Getting Started"
chapter of this manual.
Installing the
Emulator Probe
into a Target
System
The emulator probe has a PGA connector. The emulator probe is also
provided with a conductive pin protector to protect the delicate
gold-plated pins of the probe connector from damage due to impact.
Since the protector is non-conductive, you may run performance
verification with no adverse effects when the emulator is out-of-circuit.
Caution
Protect against static discharge. The emulation probe contains
devices that are susceptible to damage by static discharge. Therefore,
precautionary measures should be taken before handling the
microprocessor connector attached to the end of the probe cable to
avoid damaging the internal components of the probe by static
electricity.
Caution
Make sure target system power is OFF. Do not install the emulator
probe into the target system microprocessor socket with power applied
to the target system. The emulator may be damaged if target system
power is not removed before probe installation.
5-2 In-Circuit Emulation Topics
Caution
Make sure pin 1 of probe connector is aligned with pin 1 of the
socket. When installing the emulation probe, be sure that the probe is
inserted into the processor socket so that pin 1 of the connector aligns
with pin 1 of the socket. Damage to the emulator probe will result if the
probe is incorrectly installed.
Caution
Protect your target system CMOS components. If you target system
contains any CMOS components, turn ON the target system first, then
turn ON the emulator. Likewise, turn OFF your emulator first, then
turn OFF the target system.
Pin Protector
The target system probe has a pin protector that prevents damage to the
prove when inserting and removing the probe from the target system
microprocessor socket. Do not use the probe without a pin protector
installed. If the target system probe is installed on a densely populated
circuit board, there may not be enough room to accommodate the
plastic shoulders of the probe socket. If this occurs, another pin
protector may be stacked onto the existing pin protector.
Conductive Pin Guard
HP emulators are shipped with a conductive plastic or conductive foam
pin guard over the target system probe pins. This guard is designed to
prevent impact damage to the pins and should be left in place while
you are not using the emulator. However, when you do use the
emulator, either for normal emulation tasks, or to run performance
verification on the emulator, you must remove this conductive pin
guard to avoid intermittent failures due to the target system probe lines
being shorted together.
In-Circuit Emulation Topics 5-3
Caution
Always use the pin protectors and guards as described above.
Failure to use these devices may result in damage to the target system
probe pins. Replacing the target system probe is expensive; the entire
probe and cable assembly must be replaced because of the wiring
technology employed.
Figure 5-1. Installing Emulation Probe Into PGA Socket
5-4 In-Circuit Emulation Topics
Installing the Target
System Probe
1. Remove the 70632 microprocessor from the target system
socket. Note the location of pin 1 on the processor and on the
target system socket.
2. Store the microprocessor in a protected environment (such as
antistatic foam).
3. Install the target system probe into the target system
microprocessor socket. Remember to use the pin protector!
In-Circuit
Configuration
Options
The 70632 emulator provides configuration options for the following
in-circuit emulation issues. Refer to the "CONFIG_ITEM" section in
the "70632 Emulator Specific Command Syntax" appendix.
Selecting the Emulator Clock Source
The default emulator configuration selects the internal 20 MHz clock
as the emulator clock source. You can configure the emulator to select
an external target system clock source in the range of 8-20 MHz.
The configuration item is "clk".
Driving Background Cycles to the Target System
You can choose whether emulator bus cycles are driven to your target
system bus when the emulator is in background cycle. If your target
system requires bus cycle activities constantly, such as /BCYST, will
need to drive the emulation bus cycles to your target system bus. By
default, no bus cycles are driven to the target system in background
operation.
The configuration item is "dbc".
Selecting Memory Block during Background Cycles
You can select the value of the 70632 address bus which should be
driven to your target system. Pin A31 through A8 of the address bus is
configurable. This configuration is meaningful when the "Driving
In-Circuit Emulation Topics 5-5
Background Cycles to Target System" configuration mentioned above
is activated.
The configuration item is "bbk".
Allowing /HLDRQ Signal from Target System
You can specify whether the emulator accepts or ignores the /HLDRQ
signal from your target system. By default, the emulator accepts the
/HLDRQ signal from the target system.
The configuration item is "th".
Allowing BFREZ Signal from Target System
You can specify whether the emulator accepts or ignores the BFREZ
signal from your target system. By default, the emulator accepts the
BFREZ signal from the target system.
The configuration item is "tbf".
Allowing INT Signal from Target System
You can specify whether the emulator accepts or ignores the INT
signal from your target system. By default, the emulator accepts the
INT signal from the target system.
The configuration item is "ti".
Allowing /NMI Signal from Target System
You can specify whether the emulator accepts or ignores the /NMI
signal from your target system. By default, the emulator accepts the
/NMI signal from the target system.
The configuration item is "tn".
5-6 In-Circuit Emulation Topics
Allowing the Target
System to Insert Wait
States
High-speed emulation memory provides no-wait-state operation.
However, the emulator may optionally respond to the target system
/READY, /BERR, RT/EP lines while emulation memory is being
accessed.
You can specify whether the emulation memory accesses are honored
by these target system signals or not, in a memory mapping term.
When you map emulation memory with "map" command, if you
would like to cause the emulation memory to honor these target system
signals, add "lock" attribute after an emulation memory type.
For example, to map the address range 00000000H through 0000ffffH
as emulation rom, which accepts these signals from your target system,
enter:
R>map 0..0ffff erom lock
When the ready relationship is locked to the target system by adding
"lock" attribute in a map command, the emulation memory accesses
honor /READY, /BERR, RT/EP signals from the target system (wait
states or retry cycles are inserted if requested).
If you do not specify the "lock" attribute in a map command, the ready
relationship is not locked to the target system, and the emulation
memory accesses ignore these signals from the target system (no wait
states are inserted).
Target ROM
Debug Topics
The descriptions in this section are of emulation tasks which involve
debugging target ROM. The tasks described below are made possible
by the cim (copy target system memory image) command. The cim
command allows you to read the contents of target memory into the
corresponding emulation memory locations. Moving target ROM
contents into emulation memory is the key which allows you to
perform the tasks described below. For example, if target ROM exists
at locations 00020000H through 0002ffffH, you can copy target ROM
into emulation memory with the following commands.
R>map 20000..2ffff erom lock
R>cim 20000..2ffff
In-Circuit Emulation Topics 5-7
The "lock" attribute mentioned in the "Allowing the Target System to
Insert Wait States" section above is used so that the emulation ROM
accesses honor ready signals from your target system.
Using Software
Breakpoints with
ROMed Code
You cannot define software breakpoints in target ROM memory.
However, you can copy target ROM into emulation memory which
does allow you to use software breakpoints.
Once target ROM is copied into emulation memory, software
breakpoints may be used normally at addresses in these emulation
memory locations.
R>bc -e bp
R>bp 20000
Coverage Testing
ROMed Code
Coverage testing (as described in the "Getting Started" chapter) can
only be performed on emulation memory. However, if you wish to
perform coverage tests on code in target system ROM, you can copy
target ROM into emulation memory and perform the coverage tests on
your ROMed code. Once target ROM is copied into emulation
memory, coverage testing may be done normally at addresses in these
emulation memory locations.
U>cov -a 20000..2ffff
Even if your application is executed in virtual address space, a "@r"
suffix is not needed because the "cov" command accepts only real
addresses. Address expressions with no suffixes are recognized as real
address always.
Modifying ROMed
Code
Suppose that, while debugging your target system, you begin to suspect
a bug in some target ROM code. You might want to fix or "patch" this
code before programming new ROMs. This can also be done by
copying target system ROM into emulation memory with the cim
(copy target memory image) command. Once the contents of target
ROM are copied into emulation memory, you can modify emulation
memory to "patch" your suspected code.
5-8 In-Circuit Emulation Topics
User Interrupts
Background Monitor
If you use the background monitor, interrupts may be suspended or
ignored during background operation. /NMI and INT signal is not
passed to the emulator during the background monitor, even if the
configuration items "cf tn" and/or "cf ti" are enabled.
In case that /NMI is generated by target system during background
operation, the /NMI is accepted if the /NMI signal status is kept
asserting (low) until the transition from background monitor to user
program execution.
In case that INT is generated by target system during background
operation, the INT is accepted if the INT signal status is kept asserting
(high) until the transition from background monitor to user program
execution.
When an interrupt is generated during single-stepping, next instruction
which will be stepped is the entry of the interrupt handler.
Foreground Monitor
If you use the foreground monitor, interrupts are accepted during
foreground monitor cycles as same as user program execution.
However, when the emulator breaks into foreground monitor, some
instructions for monitor are executed in background to transit from user
program execution to foreground monitor. Interrupts status should be
held for these instruction execution. The period of transition from user
program to monitor is 60 uS.
When an interrupt is generated during single-stepping, the instruction
will be executed after the execution of the interrupt handler.
In-Circuit Emulation Topics 5-9
DMA Operation
Direct memory access to 70632 emulation memory is not permitted.
The Usage of I/O
Command
The emulator has "io" command, you can manipulate an I/O address by
using the "io" command. You can specify an I/O address in either
virtual or real address space as well as the "m" command.
There are two I/O spaces according to methods for accessing to I/O in
the 70632 microprocessor.
The first I/O space can be accessed by using an IN/OUT instruction. In
this section, this I/O space is referred as "Isolated I/O space"
distinguish from Memory Mapped I/O described below.
The second I/O space can be accessed by simply reading from or
writing to the memory. The I/O space can be mapped to the virtual
address space and known as Memory Mapped I/O.
How to Access an Isolated I/O space
If you would like to manipulate an Isolated I/O space which is accessed
by using an IN/OUT instruction of the microprocessor, designate the
I/O address in real address.
How to Access a Memory Mapped I/O space
If you would like to manipulate a Memory Mapped I/O space which is
accessed by reading from or writing to a memory. designate the I/O
address in virtual address. The I/O mapped bit of the page table entry
which includes the I/O address must be set to 1, in other word, the
address is mapped as I/O.
5-10 In-Circuit Emulation Topics
FRM Function
When using the emulator for an FRM system, there are some
restrictions.
To use the emulator in master mode, the checker CPU in your target
system should be inactivated (so that the checker CPU never generates
the MSMAT signals). The following are the reasons.
Some of input signals are not connected to the emulation CPU
directly. The signals are INT, /HLDRQ, /NMI and BFREZ.
Some bus signals in the monitor operation differ from the
actual CPU.
As far as your FRM system never introduces the INT, /HLDRQ, /NMI
and BFREZ, you may activate the checker CPU. In this case, note the
following.
All the memory should be mapped as target ram.
External system clock should be selected (cf clk=ext).
Any operations which cause break is never allowed (cf
rrt=en).
All you can do is to use the analyzer.
Besides the transition from master mode to checker mode of the
emulator is permitted. The 70632 emulator can accept the
FMST/FCHK signal. However, the emulator does not work as checker.
The emulator bus is frozen instead. So the MSMAT signal will be not
generated, even if the master CPU should malfunction. The emulator
can not be changed the mode to master mode by changing external
FMST/FCHK signal. You can not use the any analyzer features in
addition to the commands which cause break into the emulation
monitor. The emulator prompt "g>" shows that the emulator is in
checker mode.
In-Circuit Emulation Topics 5-11
The use of the "b" (break) command causes the emulator to break into
the emulation monitor, even though the "Restriction to real time runs"
configuration is enabled (cf rrt=en). If you should do the "b"
command, you would be unable to continue the execution of the
program.
Note
Pin State on
Emulation Probe
The probe pins of the emulator are in the following state. While the
emulator is running in background, the pin states are different
according to the configuration item "cf dbc".
Address Bus
Foreground
Same as 70632 microprocessor
Background
(cf dbc=en)
Upper 24 bits of the address bus depend on the
configuration item "cf bbk" otherwise you direct
the emulator to access target memory. When
accessing target memory by background monitor,
same as 70632 microprocessor.
Background
(cf dbc=dis)
Always high impedance otherwise you direct the
emulator to access target memory. When accessing
target memory by background monitor, same as
70632 microprocessor.
Foreground
Same as 70632 microprocessor except for
emulation memory access. When accessing
emulation memory, high impedance.
Background
Always high impedance otherwise you direct the
emulator to access target memory. When accessing
Data Bus
5-12 In-Circuit Emulation Topics
target memory by background monitor, same as
70632 microprocessor.
/HLDAK
Foreground
Same as 70632 microprocessor
Background
Always high.
R/W
Same as 70632 microprocessor except for
emulation memory write. When accessing
emulation memory, high.
Others
Foreground
Same as 70632 microprocessor
Background
(cf dbc=en)
Same as 70632 microprocessor.
Background
(cf dbc=dis)
Always high impedance otherwise you direct the
emulator to access target memory. When accessing
target memory by background monitor, same as
70632 microprocessor.
In-Circuit Emulation Topics 5-13
Target system
Interface
A0 thru A7
These signals are connected to 74FCT373A and 10
Kohm pull-up resistor.
A8 thru A31
These signals are connected to both of 74FCT373A
and 74FCT374A, and 10 Kohm pull-up resistor. If
you enable the emulator to drive the background
cycles to target system (cf dbc=en), the signals are
driven by 74FCT374A while background cycles
except that you direct the emulator to access target
memory. Otherwise, driven by 74FCT373A.
D0 thru D31
These signals are connected to 74FCT244A and 10
Kohm pull-up resistor.
5-14 In-Circuit Emulation Topics
ST2 thru ST0
/MRQ
R/W /FAS
/B3E thru /B0E
DL0 DL1
These signals are connected to 74FCT373A and 1
Kohm pull-up resistor.
These signals are connected to 74FCT244A and 1
/BLOCK
Kohm pull-up resistor.
/MSMAT
/BCYST/BCYEND
/IOBCY
/HLDAK
This signal is connected PAL20R8-7 and 10 Kohm
pull-up resistor.
RESET /NMI
INT /HLDRQ
BFREZ
FMST/FCHK
These signals are connected to PAL20R8-7 through
47 ohm series resistor and 10 Kohm pull-up resistor.
In-Circuit Emulation Topics 5-15
CLK /BERR
These signals are connected to 74FCT244A
/READY RT/EP mounted on probe directly.
/IOSZEN
IO8/IO16
These signals are connected to 74FCT244A and 10
Kohm pull-up resistor.
/CPBUSY
CPERR
CPEND
These signals are connected to both of 74FCT373A
and 74FCT374A, and 10 Kohm pull-up resistor.
5-16 In-Circuit Emulation Topics
A
70632 Emulator Specific Command Syntax
The following pages contain descriptions of command syntax specific
to the 70632 emulator. The following syntax items are included
(several items are part of other command syntax):
<ACCESS_MODE>. May be specified in the mo(display and
access mode), m(memory display/modify), and io(I/O
display/modify) commands. The access mode is used when
the m or io commands modify rarget memory or I/O locations.
<ADDRESS>. May be specified in emulation commands
which allow addresses to be entered.
<CONFIG_ITEMS>. May be specified in the cf(emulator
configuration) and help cf commands.
<DISPLAY_MODE>. May be specified in the mo(display
and access mode), m(memory display/modify),io(I/O
display/modify), and ser(search memory for data) commands.
The display mode is used when memory locations are
displayed or modified.
<REGSTER_NAME> and <REGISTER_CLASS>. May be
specified in the reg (register display/modify) command.
<ate>. May be specified in the ate(area table entry display)
command.
<pte>. May be specified in pte(page table entry display)
command.
Emulator Specific Command Syntax A-1
<freg>. May be specified in the freg(floating point format
register display/modify) command.
<tcb>. May be specified in the tcb(TCB diaplay) command.
<cpmmu>. May be specified in the cpmmu(XMMU copy)
command.
Error and Status Messages
A-2 Emulator Specific Command Syntax
ACCESS_MODE
Summary Specify cycles used by monitor when accessing target system memory
or I/O.
Syntax
Function The <ACCESS_MODE> specifies the type of microprocessor cycles
that are used by the monitor program to access target memory. When a
command requests the monitor to read or write target system memory
or I/O, the monitor program will look at the access mode setting to
determine whether byte, halfword, or word instructions should be used.
Parameters
b
Byte. Selecting the byte access mode specifies that
the emulator will access target memory using byte
cycles (one byte at a time).
h
Halfword. Selecting the word access mode
specifies that the emulator will access target
memory using halfword cycles (one word at a time).
w
Word. Selecting the word access mode specifies
that the emulator will access target memory using
word cycles (one word at a time).
Example:
mo -ab
mo -aw
Defaults The <ACCESS_MODE> is b at power up initialization. Access mode
specifications are saved; that is, when a command changes the access
mode, the new access mode becomes the current default.
Emulator Specific Command Syntax A-3
Related Commands mo (specify display and access modes) m (memory) io (I/O)
A-4 Emulator Specific Command Syntax
ADDRESS
Summary Address specifications used in emulation commands.
Syntax
Function The <ADDRESS> parameter used in emulation commands may be
specified as a virtual address or as a real address. You can specify the
address as real or virtual by adding a suffix "@r" or "@v". If neither
suffix is specified, the address is interpreted in the manner described in
"" below.
<REAL_ADDR> This expression with "@r" suffix is a real (actual) address in the 70632
address range 0 through 0ffffffffH.
The following emulation commands never accept real addresses
completely.
ate, pte
The following emulation commands never accept real addresses when
the emulator is in virtual mode.
r ,rx ,s
<VIR_ADDR> This expression with "@v" suffix is a virtual address in the 70632
address range 0 through 0ffffffffH. When you specify the address in
virtual address, the emulator refers to corresponded address translation
tables in order to translate virtual address to real (actual) address. In
multiple virtual space, may be there are plural real addresses equivalent
to specified virtual address. The emulator uses one of the virtual space
to determine a real address which corresponds to the specified virtual
address. By default, the emulator uses the current address space, which
is specified by the contents of the area table register pairs of the 70632
Emulator Specific Command Syntax A-5
microprocessor, to translate virtual address to real address. The details
of the address translation are shown in chapter 4.
The following emulation commands never accept virtual addresses
completely.
cim, cov, map
The following emulation commands never accept virtual addresses
when the emulator is in real mode.
r, rx, s
<ADDR> This expression with no suffix is interpreted as either real or virtual by
the emulator. The address mode, which is required to interpret the
address expression with no suffix, is determined as follows with a few
exceptions.
1. When the processor is reset, the expression is evaluated as the
real address.
2. When the processor never runs in virtual mode after reset, the
expression is evaluated as the real address.
3. Once the processor has run in virtual mode after reset, the
expression is evaluated as the virtual address.
Note
Although the processor is running in real mode, the address expression
which has no suffix is recognized as the virtual address, if the
processor has ever run in virtual mode since the processor was reset.
For each address mode, see the description of <REAL_ADDR> or
<VIR_ADDR> mentioned above.
There are exceptions to this rule, when the address expression with no
suffix is specified in the following commands.
ate, pte
When addresses are specified with no suffix in the above command,
the addresses are interpreted as virtual, whether or not the current
address mode is virtual or real.
A-6 Emulator Specific Command Syntax
cim, cov, map
When addresses are specified with no suffix in the above command,
the addresses are interpreted as real, whether or not the current address
mode is virtual or real.
r, rx, s
When addresses are specified with no suffix in the above command,
the addresses are interpreted with the current address mode.
Emulator Specific Command Syntax A-7
CONFIG_ITEMS
Summary 70632 emulator configuration items.
Syntax
A-8 Emulator Specific Command Syntax
Function The <CONFIG_ITEMS> are the 70632 specific configuration items
which can be displayed/modified using the cf (emulator configuration)
command. If the "=" portion of the syntax is not used, the current
value of the configuration item is displayed.
Parameters
clk
Clock Source. This configuration item allows you
to specify whether the emulator clock source is to
be internal (int, provided by the emulator) or
external (ext, provided by the target system). The
internal clock speed is 20 MHz (system clock). The
emulator will operate at external clock speed from
8-20 MHz (entered clock or crystal frequency
connected).
rrt
Restrict to Real-Time Runs. This configuration
item allows you to specify whether program
execution should take place in real-time or whether
commands should be allowed to cause breaks to the
monitor during program execution. If en is
selected, the emulator is restricted execution to
real-time. If dis is selected, the emulator is allowed
breaks to the monitor during program execution.
When runs are restricted to real-time, commands
which access target system resources are not
allowed.
For the commands which is refused when runs are
restricted to real-time, refer to the "Target Memory
Access" section of chapter 4.
mil
Select Memory Inverse Assembler. This
configuration item allows you to specify inverse
assembler for either 70108/70116 or 70632
microprocessor. The 70632 microprocessor has the
70108/70116 emulation mode. In this mode, the
70632 executes the instruction as 70108/70116
microprocessor’s one.
Emulator Specific Command Syntax A-9
The emulator provides both inverse assemblers for
70108/70116 and 70632. If v70 is selected, the
70632 inverse assembler is used when you display
memory in mnemonic format. If v20_30 is selected,
the 70108/70116 inverse assembler is used when
you display memory in mnemonic format.
mon
Monitor Options. This configuration item is used to
select the type of monitor to be used by the
emulator. If bg (background monitor) is selected,
all monitor functions are performed in background.
If fg (foreground monitor) is selected, all monitor
functions are performed in foreground. (Breaks to
the monitor still put the emulator into the
background mode, but the monitor program returns
to foreground before performing any functions.)
Specify the real memory location of foreground
monitor at the first <ADDRESS> term (which
follows two periods; ".."). When the foreground
monitor is executed in virtual mode, specify the
virtual location at the second <ADDRESS> term.
The first <ADDRESS> term and the second
<ADDRESS> term must be separated by comma
(,). Refer to the "Using the foreground monitor"
appendix.
dbc
A-10 Emulator Specific Command Syntax
Bus Drives During Background Operation. You
can choose whether emulator bus cycles are driven
to your target system bus when the emulator is in
background cycle. If your target system requires
bus cycle activities constantly, you will need to
drive the emulation bus cycles to your target system
bus. If en is selected, the emulator drives its bus
cycles to target system bus whether or not the
emulator executed in the background cycles. If dis
is selected, the emulator does not drive any bus
cycles to target system bus in background operation.
By default, no bus cycles are driven to the target
system in background operation. If your target
system have some circuitry which monitors bus
activities, you may need to enable this
configuration. related configuration .
bbk
Note
Memory Location In Background Operation.
This configuration item allows you to specify the
location of the background monitor program. The
monitor may be located on any 4K byte boundary.
If the <ADDRESS> specified is not on a 4K
boundary, the 4K boundary below the address is
used. The location of background monitors may be
important because background cycles of the 70632
emulator are always visible to the target system. In
default, the monitor is located on 00000H through
00FFFH (physical address). The <ADDRESS>
should be specified with no suffix. This
configuration does not make sense when the "Bus
Drives During Background Operation"
configuration is disabled (cf dbc=dis).
If your target system have some circuitry which monitors bus activities
to detect illegal access to resources, You may need to relocate monitor
address.
th
Allow Target Hold Request Signal. This
configuration item allows you to specify whether
/HLDRQ signal from target system is accepted or
ignored by the emulator. If en is selected, the
emulator accepts Hold Request from target system.
If dis is selected, the emulator ignores Hold
Request. When th is set to dis, the emulator ignores
/HLDRQ signal input from target system.
Emulator Specific Command Syntax A-11
tbf
Allow Target Bus Freeze Signal. This
configuration item allows you to specify whether
BFREZ from target system is accepted or ignored
by the emulator. If en is selected, the emulator
accepts BFREZ signal from target system. If dis is
selected, the emulator ignores BFREZ signal.
When tbf is set to dis, the emulator ignores BFREZ
signal input from target system.
ti
Enable/disable user INT. This configuration item
allows you to specify whether user INT is accepted
or ignored by the emulator. If en is selected, the
emulator accepts user INT. If dis is selected, the
emulator ignores user INT. When ti is set to dis,
the emulator ignores user INT input.
tn
Enable/disable user NMI. This configuration item
allows you to specify whether user NMI is accepted
or ignored by the emulator. If en is selected, the
emulator accepts user NMI. if dis is selected,
ignores user NMI. When ti is set to dis, the
emulator ignores user NMI input.
trh
Allow analyzer to trace bus hold sequence. This
configuration item allows you to specify whether
analyzer traces microprocessor generated bus hold
sequence. If you configure to trace bus hold cycles,
the analyzer capture , a "hold" status state when bus
hold request (/HLDRQ) is acknowledged by the
CPU.
If en is selected, the analyzer traces bus hold
cycles. If dis is selected, the analyzer traces no bus
hold cycles. If you wish to exclude bus hold cycles
from trace listings, you can set trh to dis and
execute the t command.
tre
Executed Instruction Address Trace Selection
Bus states show actual processor bus activity.
A-12 Emulator Specific Command Syntax
Exe states indicate the address of the first byte of an
executed opcode. Only the address and processor
status channels are valid during these states.
If en is selected, both exe states and bus states are
captured by the emulation analyzer. You will see
the disassembles of executed instructions in trace
listing. Lines with disassembles indicate exe states
of the instructions.
If dis is selected, only bus states are captured by the
emulation analyzer. When you display trace listing,
the emulator disassembles with "fetch" states, and
their disassembled processor mnemonics is
displayed at the "fetch" states which are the first
byte of the instructions. In this mode, the analyzer
can trace with time tagging or # of states counter.
Refer to the "Using the Emulator" chapter for more
details of the analyzer features.
tra
Selection of Virtual or Real Address Trace. This
configuration item allows you to specify whether
analyzer should trace virtual address or real
address. If real is selected, the analyzer captures
real address bus which is the same that the actual
microprocessor outputs to. If vir is selected, the
analyzer captures virtual address.
loa
Selection of Virtual or Real Address for Loading
Absolute File. This configuration item allows you
to specify whether the emulator should load
absolute files into virtual address or real address
when you use the load command. In other words,
you can specify that in which address space the
address location information are recorded in the
absolute files. If real is selected, the emulator
interprets the location address information in the
absolute files as real address.
Emulator Specific Command Syntax A-13
If vir is selected, the emulator interprets the
location address information in the absolute files as
virtual address. The default virtual address are used
to translate the location address to actual memory
address.
Defaults The default values of the configuration items are listed below.
cf
cf
cf
cf
cf
cf
cf
cf
cf
cf
cf
cf
cf
cf
clk=int
rrt=dis
mil=v70
mon=bg
dbc=dis
bbk=0
th=en
tbf=en
ti=en
tn=en
trh=en
tre=en
tra=real
loa=real
Related Commands help
You can get an on line help information for particular configuration
items by typing:
R>help cf <CONFIG_ITEM>
A-14 Emulator Specific Command Syntax
DISPLAY_MODE
Summary Specify the memory display format or the size of memory locations to
be modified.
Syntax
Function The <DISPLAY_MODE>n specifies the format of the memory
display or the size of the memory which gets changed when memory is
modified.
Parameters
b
Byte. Memory is displayed in a byte format, and
when memory locations are modified, bytes are
changed.
h
Halfword. Memory is displayed in a halfword
format, and when memory locations are modified,
halfwords are changed.
w
Word. Memory is displayed in a word format, and
when memory locations are modified, words are
changed.
s
Short-Float. Memory is displayed in a short-float
format, and when memory locations are modified,
short-floats are changed. When this display mode
used, the current default display mode is not
changed.
Emulator Specific Command Syntax A-15
l
Long-Float. Memory is displayed in a long-float
format, and when memory locations are modified,
long-floats are changed. When this display mode
used, the current default display mode is not
changed.
m
Mnemonic. Memory is displayed in mnemonic
format; that is, the contents of memory locations
are inverse-assembled into mnemonics and
operands. When memory locations are modified,
the last non-mnemonic display mode specification
except for s and l is used. You cannot specify this
display mode in the ser (search memory for data)
command.
Defaults The <DISPLAY_MODE> is b at power up initialization. Display
mode specifications are saved; that is, when a command changes the
display mode, the new display mode becomes the current default.
Related Commands mo (specify access and display modes) m (memory display/modify) io
(I/O display/modify) ser (search memory for data)
A-16 Emulator Specific Command Syntax
REGISTER CLASS
and NAME
Summary 70632 register designators. All available register class names and
register names are listed below.
<REG_CLASS>
<REG_NAME>
Description
* (All basic registers)
pc psw sycw
r0 r1 r2 r3 r4
r5 r6 r7 r8 r9
r10 r11 r12 r13
r14 r15 r16 r17
r18 r19 r20 r21
r22 r23 r24 r25
r26 r27 r28 r29
r30 r31 ap fp sp
All basic registers.
The ap and r29, fp and r30, sp and r31 have same
values because of only difference of their register
mnemonics.
priv (Privilege registers)
isp l0sp l1sp l2sp
l3sp sbr tr sycw
tkcw pir psw2
mmu (MMU registers)
atbr0 atlr0 atbr1 Area Table Register Pairs
atlr1 atbr2 atlr2
atbr3 atlr3
debg (Debug registers)
trmod adtr0 adtr1
adtmr0 adtmr1
Emulator Specific Command Syntax A-17
all (All of the 70632 registers)
all of the 70632
registers
xmmu (XMMU function registers)
mmumod
xatbr0 xatlr0
xatbr1 xatlr1
xatbr2 xatlr2
xatbr3 xatlr3
XMMU function registers. These registers are not
actual 70632 registers. Refer to the XMMU
function section of the "Using the Emulator"
chapter for the detail.
Function The <REG_CLASS> names may be used in the reg (register)
command to display a class of 70632 registers. The <REG_NAME>
names may be used with the reg command to either display or modify
the contents of an 70632 register. Refer to your 70632 user’s manual
for complete details on the use of the 70632 registers.
Related Commands reg (register display/modify)
A-18 Emulator Specific Command Syntax
ate
Summary Display processor’s area table entry for specified address in default
virtual address space.
Syntax
Function The ate command allows you to display a 70632 area table entry for
the address which you specify. The virtual address space which is used
for displaying area table entry depend on the contents of register
mmumod and whether the emulator is restricted real-time runs.
When the values which are equivalent to the area table register pairs
are invalid, or the corresponded area table entry is invalid or
out-of-bounds, error messages will be displayed. The values mentioned
above are defined by the contents of either caches or XMMU class
registers. Refer to the "Virtual Address Translation" section of chapter
4.
Parameters
-i
The -i option allows you to specify the area table
entry by using section ID and area ID
<ADDRESS>
Specifies the virtual address which belongs to the
area based on the area table entry. You cannot
specify the address with real address by adding
suffix "@r". If you specify the address with no
suffix, the address is interpreted as virtual. The only
bits 20 to 31 of the <ADDRESS> are effective.
Emulator Specific Command Syntax A-19
Refer to the <ADDRESS> syntax pages in this
chapter.
<SECT_ID>
Specifies the ID number of the section which
includes the area pointed by the area table entry.
<SECT_ID> is a hexadecimal value from 0 to 3.
<AREA_ID>
Specifies the ID number of the area pointed by the
area table entry. <AREA_ID> is a hexadecimal
value from 0 to 3ff.
As noted in the syntax, an address/IDs followed by two periods (..) and
another address/IDs specifies a range of addresses/IDs to display. If
you specify only the first address/IDs of a range followed by two
periods and omit the second address/IDs of the range, four are table
entries of the range starting at the first address/IDs specified are
selected for display.
Note
Defaults One address or one pair of IDs must be specified.
Examples
ate 12345678
ate -i 2:2de
Related Commands pte
A-20 Emulator Specific Command Syntax
pte
Summary Display processor’s page table entry for specified address in default
virtual address space.
Syntax
Function The pte command allows you to display a 70632 page table entry for
the address which you specify. The virtual address space which is used
for displaying page table entry depend on the contents of register
mmumod and whether the emulator is restricted real-time runs.
When the values which are equivalent to the area table register pairs
are invalid, or the corresponded area table entry or the corresponded
page table entry is invalid or out-of-bounds, error messages will be
displayed. The values mentioned above are defined by the contents of
either caches or XMMU class registers. Refer to the "Virtual Address
Translation" section of chapter 4.
Parameters
-i
The -i option allows you to specify the page table
entry by using section ID, area ID and page ID.
<ADDRESS>
Specifies the virtual address which belongs to the
page based on the page table entry. You cannot
specify the address with real address by adding
suffix "@r". If you specify the address with no
suffix, the address is interpreted as virtual. The only
bits 20 to 31 of the <ADDRESS> are effective.
Emulator Specific Command Syntax A-21
Refer to the <ADDRESS> syntax pages in this
chapter.
<SECT_ID>
Specifies the ID number of the section which
includes the page pointed by the page table entry.
<SECT_ID> is a hexadecimal value from 0 to 3.
<AREA_ID>
Specifies the ID number of the area which includes
the page pointed by the page table entry.
<AREA_ID> is a hexadecimal value from 0 to 3ff.
<PAGE_ID>
Specifies the ID number of the page pointed by the
page table entry. <PAGE_ID> is a hexadecimal
value from 0 to 0ff.
As noted in the syntax, an address/IDs followed by two periods (..) and
another address/IDs specifies a range of addresses/IDs to display. If
you specify only the first address/IDs of a range followed by two
periods and omit the second address/IDs of the range, four are table
entries of the range starting at the first address/IDs specified are
selected for display.
Note
Defaults One address or one pair of IDs must be specified.
Examples
pte 12345678
pte -i 2:2de
Related Commands ate
A-22 Emulator Specific Command Syntax
freg
Summary Display and modify the 70632 general purpose registers using floating
point format.
Syntax
Function The freg command allows you to display and modify the 70632
general purpose register contents. The general purpose registers (R0
through R31) may be displayed or modified in short or long format;
combinations of display and modify or short and long formats are
permitted on the same command line.
Parameters
<GR_NAME>
The <GR_NAME> parameter allows you to
specify a specific register to display or modify. The
valid register names are the following registers.
r0 r1 r2 r3 r4 r5 r6 r7 r8 r9 r10 r11 r12 r13 r14
r15 r16 r17 r18 r19 r20 r21 r22 r23 r24 r25 r26
r27 r28 r29 r30 r31
<F_VALUE>
To modify a register’s contents, supply the new
contents in the <F_VALUE> variable. This is a
floating-point value.
-s
Specifies the display or modification format as
short floating-point format.
Emulator Specific Command Syntax A-23
-l
Specifies the display or modification format as
short floating-point format. If -l option is specified,
you can not specify register r31 in the
<GR_NAME>.
Defaults If no <GR_NAME> is specified, all of the general purpose registers
are displayed in short float format. The -s option is in effect, if no
option is specified. If one of the options is specified, you cannot omit
the <GR_NAME>.
Examples
freg
freg
freg
freg
freg
freg
Related Commands reg
A-24 Emulator Specific Command Syntax
-s
-l
-s
-s
-l
r0 r1 r2
r30
r0=123.456
r0=1.23456e+10
r0=5678.123 -s r3=987.543
tcb
Summary Display processor’s TCB of specified address in default virtual address
space.
Syntax
Function The tcb command allows you to display the task control block.
Parameters
-l
The -l option allows you to specify the register list
to display the complete TCB contents.
<REG_LIST>
Specifies the register list to display the complete
TCB contents with -l option. The register list
specifies registers to be stored to or loaded from
TCB when the task is switched. The format of the
register list is same as the 70632 processor’s
LDTASK or STTASK instruction operand.
<REG_LIST> is a value from 0 to 07fffffff (hex).
<ADDRESS>
Specifies the address which is the base address of
the TCB to be displayed. Refer to the
<ADDRESS> syntax pages in this chapter.
Defaults If no option is specified, only the contents of register SYCW and stack
pointers for each level in the current TCB are displayed. If
<ADDRESS> is not specified, the TCB contents of the current task
which is specified by register TR contents are displayed.
Emulator Specific Command Syntax A-25
Examples
tcb
tcb -l 07fff0000
tcb 12345678
tcb -l 07fffffff 12345678
A-26 Emulator Specific Command Syntax
cpmmu
Summary Copy the contents of the current area table register pairs to XMMU
class registers.
Syntax
Function The cpmmu command allows you to copy the contents of the current
area table register pairs to XMMU function registers. You can specify
the IDs of the sections which correspond to the area table register pairs.
After you set up the XMMU function registers, activate the XMMU
function by modifying the mmumod register to the value 1. The
XMMU function allows you to specify a virtual address space where
the virtual address which you specify in a certain command is
interpreted by the emulator. The virtual address is defined by the
contents of XMMU function registers, if activated. Refer to the "Using
the XMMU Function" section of chapter 4.
Parameters
<SECT_ID>
Specifies the ID number of the section which
correspond to the area table register pair to be
copied to XMMU function registers. <SECT_ID>
is a value from 0 to 3.
Defaults If no <SECT_ID> is specified, all of the area table register pairs are
copied to the XMMU function registers.
Examples
cpmmu
cpmmu 0
cpmmu 0 1
Emulator Specific Command Syntax A-27
Error and Status
Message
The following are error and status messages which are unique to the
70632 emulator.
The following are ERROR messages which are of the form
!ERROR XXX! error message
where XXX is the error number
140
"Cannot access target memory; Not in-circuit"
146
"Unable to load user supplied foreground monitor"
147
"Area table register pair not valid (atbr%d)"
148
"Area out of bounds: (sect%x area=%03x..%03x)"
149
"Area table entry not valid (ate%x:%x=%08x,%08x)"
150
"Page table not exist (ate%x:%x)"
151
"Page out of bounds: (ate%x:%x page=%02x..%02x)"
152
"Page table entry not valid (pte%x:%x:%x=%08x)"
153
"Page not exist: %s"
154
"Address translation failed"
155
"Page mapped as I/O port: %s"
156
"Page not mapped as I/O port: %s"
157
"Page locked: %s"
A-28 Emulator Specific Command Syntax
The following are STATUS messages which are of the form
!STATUS XXX! status message
where XXX is the status number
152
"Target system has been switched off"
153
"Target system has been switched on"
Emulator Specific Command Syntax A-29
Notes
A-30 Emulator Specific Command Syntax
B
Using the Foreground Monitor
By using and modifying the optional Foreground Monitor, you can
provide an emulation environment which is customized to the needs of
a particular target system.
Comparison of
Foreground and
Background
Monitors
Background Monitors
An emulation monitor is required to service certain requests for
information about the target system and the emulation processor. For
example, when you request a register display, the emulation processor
is forced into the monitor. The monitor code has the processor dump
its registers into certain emulation memory locations, which can then
be read by the emulator system controller without further interference.
A background monitor is an emulation monitor which overlays the
processor’s memory space with a separate memory region. Usually, a
background monitor will be easier to work with in starting a new
design. The monitor is immediately available upon powerup, and you
don’t have to worry about linking in the monitor code or allocating
space for the monitor to use the emulator. No assumptions are made
about the target system environment; therefore, you can test and debug
hardware before any target system code has been written. All of the
processor’s address space is available for target system use, since the
monitor memory is overlaid on processor memory, rather than
subtracted from processor memory. Processor resources such as
interrupts are not taken by the background monitor.
However, all background monitors sacrifice some level of support for
the target system. For example, when the emulation processor enters
the monitor code to display registers, it will not respond to target
system interrupt requests. This may pose serious problems for
complex applications that rely on the microprocessor for real-time,
Using the Foreground Monitor B-1
non-intrusive support. Also, the background monitor code resides in
emulator firmware and can’t be modified to handle special conditions.
Foreground Monitors
A foreground monitor may be required for more complex debugging
and integration applications. A foreground monitor is a block of code
that runs in the same memory space as your program. You link this
monitor with your code so that when control is passed to your program,
the emulator can still service real-time events, such as interrupts or
watchdog timers. For most multitasking, interrupt intensive
applications, you will need to use a foreground monitor.
You can tailor the foreground monitor to meet your needs, such as
servicing target system interrupts. However, the foreground monitor
does use part of the processor’s address space, which may cause
problems in some target systems. You must also properly configure
the emulator to use a foreground monitor.
Foreground
Monitor Selection
The HP 64758 emulator provides two kinds of foreground monitor.
One is included in the emulator, the other is provided with assembler
source file.
The foreground monitor included in the emulator allows you to use the
foreground monitor quickly. When you use this built-in foreground
monitor, you do not have to assemble, link and load the monitor
program.
The foreground monitor provided with assembler source file allows
you to customize the foreground monitor as you desire. When you use
this custom foreground monitor, you need to assemble, link and load
the monitor program.
Using Built-in
Foreground
monitor
The 70632 emulator includes foreground monitor. The built-in
foreground monitor saves your tasks for assembling, linking and
loading the monitor. To use the built-in foreground monitor, all you
have to do is to specify the location of the monitor. The location is
B-2 Using the Foreground Monitor
specified by the configuration item "cf mon=fg". Specify the monitor
location (real address) as follows.
R>cf mon=fg..<real_address>
When your application is executed in virtual mode, you should also
specify the virtual memory location for the monitor. The address
translation tables for the monitor must be set up.
R>cf
mon=fg..<real_address>,<virtual_addres
s>
After you issued the configuration command, the built-in foreground
monitor is set up automatically.
Interrupt/Exception
Handler
The foreground monitor supports interrupt/exception handler. The
interrupt/exception handler allows you to break the emulator into
monitor when a certain interrupt or exception is generated.
When you issue the "cf mon=fg" command, six equation label pairs are
defined. These equation label pairs contain the entry addresses of the
handlers, which are included in the foreground monitor. One of each
equation label pair contains real address of the entry, the other (which
has "V" prefix) contains virtual address of the entry. The description of
these equation label pairs are as follows.
real address entry,
virtual address entry,
description
NMI_ENTRY
INT_ENTRY
EXC1_ENTRY
EXC2_ENTRY
STEP_ENTRY
BRK_ENTRY
VNMI_ENTRY
VINT_ENTRY
VEXC1_ENTRY
VEXC2_ENTRY
VSTEP_ENTRY
VBRK_ENTRY
NMI handler entry
INT handler entry
3 words stacking Exception handler entry
4 words stacking Exception handler entry
Single-Step Trap handler entry
Breakpoint Instruction Trap handler entry
Either of each equation label pair can be used so that vectors in system
base table point to the corresponded handlers, if desired. The system
base table must be defined in your program. For using single-step and
software breakpoint features the single-step trap and breakpoint
instruction trap handler entries must be set up.
For example, if you wish to use the emulator’s single-step feature, you
must define the single-step trap handler entry in the corresponded
vector table.
M>m -dd 30=STEP_ENTRY
If you use the single-step feature in virtual mode, you should have
entered the following command instead.
Using the Foreground Monitor B-3
M>m -dd 30=VSTEP_ENTRY
According to the system base table location, you may have to change
the address (in this case, 30H) to be modified.
Using Custom
Foreground
monitor
The custom foreground monitor allows you to customize the monitor
for your target system. To use the monitor, you need to assemble, link
and load the monitor program into emulator.
The monitor program is provided with HP 64758 emulator. You should
modify the following statement of the monitor program to specify the
monitor location.
.text
"FG_MON" > 0x000000000
The default monitor location is defined at address 000000000 (hex).
To tell the monitor location to the emulator, you should specify the
monitor location (real address) as follows.
cf mon=fg..<real_address>
When your application is executed in virtual mode, you should also
specify the virtual memory location for the monitor. The address
translation tables for the monitor must be set up.
cf
mon=fg..<real_address>,<virtual_addres
s>
After you issued the configuration command, you must load the
monitor program into the emulator. The memory for the foreground
monitor is already mapped when configuring the monitor location.
Interrupt/Exception
Handler
The foreground monitor supports interrupt/exception handler. The
interrupt/exception handler allows you to break the emulator into
monitor when a certain interrupt or exception is generated.
In the foreground monitor program, some entry labels of the handlers
are defined. See the monitor program for these entry labels. Write these
labels in your program’s system base table description. When you link
the foreground monitor with your program, these labels will be referred
B-4 Using the Foreground Monitor
by your program. The system base table must be defined in your
program.
To use the single-stepping and/or software breakpoints feature(s), you
must define the single step trap vector and/or the breakpoint instruction
trap vector into the system base table. When you use these features in
virtual mode, you must set up these vectors to point to their handler’s
entry in the foreground monitor in virtual address.
Even if you link the monitor with your program, you should also
prepare the absolute file separated from user program to load the
monitor program.
Loading Foreground
Monitor
To load the monitor program, enter the following command; whether
or not the monitor program is linked with your program.
R>load -fios "cat
<foreground_monitor>"
The "-f" option was used to load the foreground monitor program.
According to file format and terminal configuration, the rest options
(ios) may be different. You should specify the file name of the
foreground monitor absolute separated from your program. After
loading the monitor, map the memory for your program and load your
program into the emulator.
Using the Foreground Monitor B-5
Loading User
Program
Loading into Target
Memory
To load your program into target memory and emulation memory, do
the following.
To load the program into target memory, enter the following
commands.
R>b
M>load -uios "cat <user_program>"
The first command (b) cause the emulator to break into the monitor.
For loading into target memory, the emulator must be running in
monitor.
The "-u" option specify to load only target memory portion of the
program.
Loading into
Emulation Memory
To load the program into emulation memory, enter the following
commands.
M>rst
R>load -eios "cat <user_program>"
The first command (rst) causes the emulator to reset. For loading into
emulation memory (which includes monitor program portion), the
emulator must be reset.
The "-e" option specifies to load only emulation memory portion of the
program.
B-6 Using the Foreground Monitor
Restrictions and
Considerations
When using the foreground monitor, there are some restrictions and
considerations.
Cannot Single-step the Instruction RETIS and RETIU
The foreground monitor cannot step the RETIS and RETIU instruction.
If you step either the RETIS or RETIU instruction, the emulator cannot
break into monitor. As a result, the emulator runs your program
without stepping.
Two Pages for the Monitor Program Must be Set Up
When you use the foreground monitor in virtual mode, the address
translation tables for the foreground monitor must be set up. The
monitor occupies one page (4 Kbytes memory), and further, one more
page is required for accessing to target memory. In virtual mode, when
accessing to target memory, the monitor modifies the page table to
point to the target memory to be accessed to. The page must follows
the foreground monitor page. For this reason, you must set up the
address translation tables of two pages for the foreground monitor.
Monitor Must be Located at the Same Virtual Address
Always.
The foreground monitor must be located at the same virtual address
whenever virtual space is changed. This allows the emulator to break
into monitor in any virtual space.
Using the Foreground Monitor B-7
An Example
Configuration of
the Foreground
Monitor
In the following example, we will illustrate how to set up the emulator
to use the custom foreground monitor in virtual mode.
For this example, we will locate the monitor at 400000000h (virtual)
and 1000h (real).
Modify Monitor
Source Program
.text
To use the monitor, you must modify the following statement near the
top of the monitor program. In this example, the monitor will be
located at 40000000h in virtual.
"FG_MON" > 0x40000000
Defining System
Base Table in Your
Program
.data "sys_base"
.word .....
.word .....
.word NMI_ENTRY
.word .....
:
:
.word STEP_ENTRY
.word BRK_ENTRY
:
:
To use the single-step and software breakpoint feature of the emulator,
you must define the single-step trap and breakpoint instruction trap
vector into the system base table. Assuming that the system table
description in your program as follows.
-----
+
+
+
+
00
04
08
0C
-- + 30
-- + 34
The NMI_ENTRY label is also defined to break the emulator into
monitor when NMI signal is generated.
Defining Address
Translation Tables
for Monitor Program
PTE_FGMON:
.word
.word
The following statements define two page tables for monitor program.
The real address location of label PTE_FGMON must be pointed by
the Area Table Entry of Section 1, Area 0 because the monitor location
is 40000000h (virtual).
0x00001e05
0x00001e05
-- for foreground monitor location
-- for accessing to target memory by monitor
The PTE in the second line must be defined to access to target memory
B-8 Using the Foreground Monitor
by monitor program. The monitor modifies the PTE to point to target
memory location to be accessed. Initially, the PTE had better point to
the foreground monitor location.
Note that the foreground monitor must be reside in the fixed virtual
address, even if virtual space is changed. This allows the emulator to
break into monitor in any virtual space.
Assembling and
Linking the
Foreground Monitor
To refer to these labels (in this example, NMI_ENTRY,
STEP_ENTRY and BRK_ENTRY), the foreground monitor program
and your program should be linked together. Suppose that the
generated absolute file name is "usr_prog.x".
You must prepare another absolute file which contains only foreground
monitor program. The absolute file will be used to load the monitor
program into the emulator. Suppose that the generated absolute file
name is "monitor.x".
Setting Up the
Monitor
Configuration Item
The following command should be issued to tell the use of foreground
monitor and the location of the monitor to the emulator.
R>cf mon=fg..1000,40000000
Mapping Memory for
Your Program
Map memory for your program by using map command. The monitor
location is already mapped as emulation RAM (eram).
Loading Foreground
Monitor
Load the foreground monitor program.
R>load -fios "cat monitor.x"
The linked monitor program (monitor.x) is separated from user
program. In this example, the Intel hexadecimal format and transparent
configuration are assumed.
Using the Foreground Monitor B-9
Loading User
Program
Load the target memory portion of your program. To load the program
into target memory, the emulator must be running in monitor.
R>b
M>load -uios "cat usr_prog.x"
Next, load the emulation portion of your program. Since the portion
includes the foreground monitor program, which is linked to refer to
the symbols (in this example, STEP_ENTRY, BRK_ENTRY and
NMI_ENTRY), the monitor program should not be running. Therefore,
reset the emulator.
M>rst
R>load -eios "cat usr_prog.x"
B-10 Using the Foreground Monitor
Index
A
absolute files, downloading, 2-14
access
emulation memory, 4-22
target memory, 4-16
access mode, specifying, 2-21
ACCESS_MODE syntax, A-3
address bus
background cycles, A-11
address mode suffix, 3-15, A-5
trace, 3-28
ADDRESS syntax, A-5
address translation, 4-23
address translation tables
displaying, 3-18
analyzer, 1-4
cause of break, 4-10
clock speed, 4-8
data trigger, 4-7
disassemble, 4-5
emulation mode, 4-21
execution state, 4-4, 4-6
hardware break, 4-11
qualifiers, 4-4
state count, 4-8
status label, 4-4
time tagging, 4-8
tracing virtual address, 3-25
analyzer status
predefined equates, 2-26
area table entry
displaying, 3-18
assembling and linking foreground monitor, B-9
ate command, 3-18
syntax, A-19
Index-1
2-Index
B
b (break) command, 2-23
background, 1-6
background cycle
address bus, A-11
signals to target system, A-10
background monitor, A-10, B-1
interrupts, 5-9
pin state, 5-12
bbk, emulator configuration, A-11
bc (break conditions) command, 2-24
BERR
from target system, 5-7
BFREZ signal
responding, A-12
BNC connector, 4-19
bp (breakpoints) command, 2-23
break
monitor, 4-10
target memory access, 4-16
break conditions, 2-24
after initialization, 2-8
breaking into the monitor on trigger, 4-11
breakpoints, 1-5, 2-8, 3-17, 3-20
hardware, 4-11
software, 4-14
BRK instruction, 2-23
built-in foreground monitor, B-3
bus masters
target system accesses of emulation memory, 2-11
C
cautions
installing the probe into socket, 5-3
protect against static discharge, 5-2
protect your target system CMOS components, 5-3
target system power must be off when installing the probe, 5-2
use the pin protectors, 5-4
characterization of memory, 2-11
checksum error count, 2-15
cim (copy target system memory image) command, 5-7
clk, emulator configuration, A-9
clock source, A-9
clock speed, 1-3
CMB (coordinated measurement bus), 4-19
CMOS target system components, protecting, 5-3
cold start initialization, 2-9
combining commands on a single command line, 2-18
command groups, viewing help for, 2-6
command recall, 2-19
commands
combining on a single command line, 2-18
Comparison of foreground/background monitors, B-1
CONFIG_ITEMS syntax, A-8
configuration
bbk, A-11
clk, A-9
dbc, A-10
loa, A-13
mil, A-9
mon, A-10
rrt, A-9
tbf, A-12
th, A-11
ti, A-12
tn, A-12
tra, A-13
tre, A-13
trh, A-12
configuration (hardware)
remote, 2-14
standalone, 2-14
transparent, 2-14
coordinated measurements, 4-19
coprocessors
target system access of emulation memory, 2-11
cov (reset/display coverage) command, 2-32
coverage testing, 2-31
on ROMed code, 5-8
cp (copy memory) command, 2-31
cpmmu command, 3-24
syntax, A-27
custom foreground monitor, B-4
D
data bus
trace, 4-7
Index-3
dbc, emulator configuration, A-10
demo command, 2-10, 3-15
disassemble
FPU, 4-17
trace listing, 4-5
disassembler
selecting, A-9
display mode, 2-16
display mode, specifying, 2-21
DISPLAY_MODE syntax, A-15
displaying
address translation tables, 3-18
I/O, 5-10
memory emulation mode, 4-21
mmu register, 3-18
privilege register, 3-21
TCB, 3-21
DMA, 5-10
downloading absolute files, 2-14
driving
background cycles to the target system, A-10
E
4-Index
emulation configuration, modifying the default, 2-9
emulation feature
foreground or background monitor, 1-6
out-of-circuit or in-circuit emulation, 1-6
emulation memory, 1-3
access by target system, 2-11
after initialization, 2-8
real time access, 4-22
size of, 2-10
emulation mode, 4-21
memory inverse assembler, A-9
emulation monitor
foreground or background, 1-6
monitor, 1-6
emulation RAM and ROM, 2-11
emulator
feature, 1-3
purpose, 1-1
usage, 4-1
emulator configuration
after initialization, 2-8
drive background cycles to the target system, A-10
emulator clock source, A-9
enable execution cycles trace, A-13
enable NMI input from target system, A-12
enable responding to HLDRQ signal, A-11
memory inverse assemble type, A-9
memory location in background operation, A-11
monitor type, A-10
on-line help for, 2-6
real-time mode, A-9
respond to target bus freeze, A-12
respond to target system interrupt, A-12
selection of virtual or read address for loading absolute file, A-13
trace hold tag, A-12
trace virtual or read address, A-13
emulator feature
analyzer, 1-4
breakpoints, 1-5
clock speed, 1-3
emulation memory, 1-3
FPU, 1-4
FRM, 1-4
MMU, 1-4
processor reset control, 1-5
register display/modify, 1-4
restrict to real-time runs, 1-5
single-step processor, 1-4
software debugging, 1-5
target interface, 1-5
emulator probe
installing, 5-2
enabling
NMI input from target system, A-12
responding to HLDRQ signal, A-11
tracing execution cycles, A-13
equates predefined for analyzer status, 2-26
eram, memory characterization, 2-12
erom, memory characterization, 2-12
error messages, A-28
es (emulator status) command, 2-8
Index-5
escape character (default) for the transparent mode, 2-15
exception handler
foreground monitor, B-3, B-4
EXECUTE (CMB signal), 4-19
execution cycles
tracing, A-13
execution state
analyzer, 4-4
trace, 4-6
6-Index
F
feature of the emulator, 1-3
file formats, absolute, 2-14
floating point
register, 4-3
floating point format, A-23
foreground, 1-6
foreground monitor, A-10, B-2
assembling and linking, B-9
built-in monitor, B-3
configuration, B-9
custom monitor, B-4
interrupt/exception handler, B-3, B-4
interrupts, 5-9
loading the, B-9
location, A-10, B-3, B-8
pin state, 5-12
selecting, B-2
FPU, 1-4
disassemble, 4-17
freg command
syntax, A-23
FRM, 1-4
FRM function, 5-11
G
getting started, prerequisites, 2-2
grd, memory characterization, 2-11
guarded memory accesses, 2-11
H
halted, 4-19
hardware breakpoints, 4-11
help facility, using the, 2-6
help information on system prompts, 2-7
HLDRQ signal
responding, A-11
hold
tracing, A-12
HP absolute files, downloading, 2-15
I
I/O
display/modify, 5-10
in-circuit
READY, BERR, RT/EP, 5-7
in-circuit emulation, 5-1
init (emulator initialization) command, 2-8
initialization, emulator, 2-8
cold start, 2-9
warm start, 2-8
inserting wait state, 5-7
instruction execution
triggering analyzer, 4-4
INT signal
during monitor cycles, 5-9
from target system, A-12
Intel hexadecimal files, downloading, 2-15
interface
probe, 5-14
interrupt
during monitor cycles, 5-9
INT, 5-9
NMI, 5-9
interrupt (INT)
from target system, A-12
interrupt (NMI)
from target system, A-12
interrupt handler
foreground monitor, B-3, B-4
inverse assembler
selecting, A-9
L
labels (trace), predefined, 2-26
linking foreground monitor, B-9
loa, emulator configuration, A-13
load (load absolute file) command, 2-14
load address mode, A-13
loading firmware sample program, 2-10
Index-7
loading foreground monitor, B-9
local bus masters
target system accesses of emulation memory, 2-11
locating the foreground monitor, A-10
location of foreground monitor, B-3, B-8
lower byte accesses, 2-27
M
8-Index
m (memory display/modification) command, 2-16, 2-21
macros
after initialization, 2-8
using, 2-19
map (memory mapper) command, 2-12
mapping memory, 2-10
memory
displaying in mnemonic format, 2-16
emulation mode, 4-21
memory characterization, 2-11
memory inverse assembler
selecting, A-9
memory map
after initialization, 2-8
memory, emulation
access by target system, 2-11
memory, mapping, 2-10
mil, emulator configuration, A-9
MMU, 1-4, 4-18
mmu register
displaying, 3-18
mnemonic
trace listing, 4-5
mo (mode) command, 2-17, 2-22
modifying
I/O, 5-10
stack pointer, 4-2
modifying ROMed code, 5-8
mon, emulator configuration, A-10
monitor
background, A-10, B-1
comparison of foreground/background, B-1
foreground, A-10
monitor break
cause, 4-10
monitor program memory, size of, 2-10
Motorola S-record files,downloading, 2-15
N
NMI signal
during monitor cycles, 5-9
from target system, A-12
notes
address evaluation without suffix in real mode, A-6
break command on FRM system, 5-12
default address evaluation in real mode, 3-16
emulation memory access from target system, 2-11
escape character for the transparent mode, 2-15
monitoring bus activity, A-11
remove software breakpoints before altering memory map, 2-13
software breakpoints, 2-23
trace, address mode suffix, xmmu function, 3-28
O
object file address attribute, A-13
on-line help, using the, 2-6
P
page table entry
displaying, 3-18
pin state, 5-12
predefined equates, 2-26
predefined trace labels, 2-26
prerequisites for getting started, 2-2
privilege register
displaying, 3-21
prompts, 2-7
halted, 4-19
help information on, 2-7
machine fault, 4-19
using "es" command to describe, 2-8
waiting for ready, 4-19
pte command, 3-18
syntax, A-21
purpose of the emulator, 1-1
Q
qualifiers
analyzer, 4-4
R
RAM
mapping emulation or target, 2-11
Index-9
READY
from target system, 5-7
READY (CMB signal), 4-19
real address
tracing, A-13
real time access
emulation memory, 4-22
real-time execution, A-9
real-time runs, 1-5, 4-16
recalling commands, 2-19
reg (register) command, 2-18, 3-18, 3-21
register
displaying (mmu), 3-18
displaying (privilege), 3-21
floating-point, 4-3
modification, 4-2
register class
mmu, 3-18
priv, 3-21
xmmu, 3-22
register display/modify, 1-4
registers
XMMU, 4-23
REGISTERS syntax, A-17
relocatable files, 2-12
remote configuration, 2-14
rep (repeat) command, 2-19
reset
commands which cause exit from, 2-33
reset control, 1-5
resetting the trace specifications, 3-25
respond to target bus freeze (BFREZ), A-12
respond to target system interrupt, A-12
restrict real-time runs, 4-16
restrict to real-time runs, 1-5
ROM
debug of target, 5-7
mapping emulation or target, 2-11
writes to, 2-11
rrt, emulator configuration, A-9
rst (reset emulator) command, 2-33
10-Index
RT/EP
from target system, 5-7
S
s (step) command, 2-17
sample program
description, 2-2
flow of the, 3-13
loading the, 2-14
multiple virtual space, 3-9
virtual mode, 3-1
selecting memory inverse assembler, A-9
ser (search memory) command, 2-22
signals
background cycle, A-10
simple trigger, specifying, 2-27
single-step
emulation mode, 4-21
single-step processor, 1-4
software breakpoints, 1-5, 2-23, 3-17, 3-20, 4-14
after initialization, 2-8
defining, 2-24
note on BRK instruction vector, 2-23
using with ROMed code, 5-8
software debugging, 1-5
specifying virtual space, 3-22, 4-24
stack pointer
modification, 4-2
standalone configuration, 2-14
stat (emulation analyzer status) trace label, 2-26
state count, 4-8
state on emulation probe, 5-12
static discharge, protecting the emulator probe against, 5-2
status label
analyzer, 4-4
status messages, A-28
step
emulation mode, 4-21
suffix, A-5
address mode, 3-15
T
target interface, 1-5
target memory access, 4-16
Index-11
target system
signals during background cycles, A-10
target system interface, 5-14
target system RAM and ROM, 2-12
tbf, emulator configuration, A-12
TCB
displaying, 3-21
tcb command, 3-21
syntax, A-25
Tektronix hexadecimal files, downloading, 2-15
tg (specify simple trigger) command, 2-27
th, emulator configuration, A-11
ti, emulator configuration, A-12
time tagging, 4-8
tinit command, 3-25
tl (trace list) command, 2-27
tlb (display/modify trace labels) command, 2-26
tn, emulator configuration, A-12
tp (specify trigger position) command, 2-29
tra, emulator configuration, A-13
trace
cause of break, 4-10
clock speed, 4-8
data trigger, 4-7
disassemble, 4-5
emulation mode, 4-21
even address, 2-27
execution cycles, A-13
execution state, 4-6
hold tag, A-12
resetting the trace specification, 3-25
state count, 4-8
time tagging, 4-8
virtual address, 3-25
virtual or real address, A-13
trace labels, predefined, 2-26
tram, memory characterization, 2-12
transfer utility, 2-15
translation table
displaying, 3-18
transparent configuration, 2-14
12-Index
transparent mode, 2-15
tre, emulator configuration, A-13
trh, emulator configuration, A-12
trigger
breaking into monitor on, 4-11
specifying a simple, 2-27
TRIGGER (CMB signal), 4-19
trigger condition
instruction execution, 4-4
trigger position, 2-29
trom, memory characterization, 2-12
ts (trace status) command, 2-27
tsto command, 3-30
U
using the default emulation configuration, 2-9
using the emulator, 4-1
V
ver command, 2-10
virtual address
tracing, 3-25, A-13
virtual address translation, 4-23
virtual mode
emulation, 3-1
virtual space
specifying, 3-22, 4-24
W
wait state
target ready signal, 5-7
waiting for ready, 4-19
warm start initialization, 2-8
X
x (execute) command, 4-19
xmmu function, 3-22, 4-23
trace, 3-28
xmmu registers, 3-22
Index-13
Notes
14-Index