1
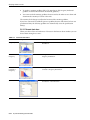
Oracle® Crystal Ball, Fusion Edition
Getting Started Guide
Release 11.1.1.1.00
September 2008
Getting Started Guide, Release 11.1.1.1.00
Copyright © 1988, 2008, Oracle. All rights reserved.
Primary Author:
Contributor:
Barbara Gentry
David Blankinship, Eric Wainwright
The Programs (which include both the software and documentation) contain proprietary information; they
are provided under a license agreement containing restrictions on use and disclosure and are also protected
by copyright, patent, and other intellectual and industrial property laws. Reverse engineering, disassembly,
or decompilation of the Programs, except to the extent required to obtain interoperability with other
independently created software or as specified by law, is prohibited.
The information contained in this document is subject to change without notice. If you find any problems in
the documentation, please report them to us in writing. This document is not warranted to be error-free.
Except as may be expressly permitted in your license agreement for these Programs, no part of these
Programs may be reproduced or transmitted in any form or by any means, electronic or mechanical, for any
purpose.
If the Programs are delivered to the United States Government or anyone licensing or using the Programs on
behalf of the United States Government, the following notice is applicable:
U.S. GOVERNMENT RIGHTS Programs, software, databases, and related documentation and technical data
delivered to U.S. Government customers are "commercial computer software" or "commercial technical data"
pursuant to the applicable Federal Acquisition Regulation and agency-specific supplemental regulations. As
such, use, duplication, disclosure, modification, and adaptation of the Programs, including documentation
and technical data, shall be subject to the licensing restrictions set forth in the applicable Oracle license
agreement, and, to the extent applicable, the additional rights set forth in FAR 52.227-19, Commercial
Computer Software--Restricted Rights (June 1987). Oracle USA, Inc., 500 Oracle Parkway, Redwood City, CA
94065.
The Programs are not intended for use in any nuclear, aviation, mass transit, medical, or other inherently
dangerous applications. It shall be the licensee's responsibility to take all appropriate fail-safe, backup,
redundancy and other measures to ensure the safe use of such applications if the Programs are used for such
purposes, and we disclaim liability for any damages caused by such use of the Programs.
Oracle, JD Edwards, PeopleSoft, and Siebel are registered trademarks of Oracle Corporation and/or its
affiliates. Other names may be trademarks of their respective owners.
The Programs may provide links to Web sites and access to content, products, and services from third
parties. Oracle is not responsible for the availability of, or any content provided on, third-party Web sites.
You bear all risks associated with the use of such content. If you choose to purchase any products or services
from a third party, the relationship is directly between you and the third party. Oracle is not responsible for:
(a) the quality of third-party products or services; or (b) fulfilling any of the terms of the agreement with the
third party, including delivery of products or services and warranty obligations related to purchased
products or services. Oracle is not responsible for any loss or damage of any sort that you may incur from
dealing with any third party.
Contents
1 Welcome to Crystal Ball
1.1
1.2
1.3
1.4
1.5
1.6
Who should use Crystal Ball? ...................................................................................................
What you will need.....................................................................................................................
How this guide is organized .....................................................................................................
Conventions used in this manual .............................................................................................
Getting help .................................................................................................................................
Technical support and more......................................................................................................
1-1
1-1
1-1
1-2
1-3
1-3
2 A Quick Look — Tutorial 1
2.1
What Crystal Ball does ...............................................................................................................
2.2
Tutorial 1 — Futura Apartments ..............................................................................................
2.2.1
Start Crystal Ball ..................................................................................................................
2.2.1.1
Crystal Ball Welcome screen.......................................................................................
2.2.1.2
Crystal Ball menus........................................................................................................
2.2.1.3
Crystal Ball toolbar.......................................................................................................
2.2.2
Open the example model....................................................................................................
2.2.2.1
About the model ...........................................................................................................
2.2.2.2
The Futura Apartments model scenario ...................................................................
2.2.3
Run the simulation ..............................................................................................................
2.2.4
Determine profit...................................................................................................................
2.2.5
Take a look behind the scenes............................................................................................
2.2.5.1
Crystal Ball cells in the example model ....................................................................
2.2.6
Reset and single-step...........................................................................................................
2.2.7
Close Crystal Ball .................................................................................................................
2.2.8
Tutorial review.....................................................................................................................
2.3
Learning more .............................................................................................................................
2-1
2-2
2-2
2-2
2-3
2-3
2-4
2-4
2-5
2-5
2-6
2-7
2-7
2-8
2-8
2-9
2-9
3 Looking Deeper — Tutorial 2
3.1
Tutorial 2 — Vision Research ....................................................................................................
3.1.1
Start Crystal Ball ..................................................................................................................
3.1.2
Open the example model....................................................................................................
3.1.3
Review the Vision Research scenario ...............................................................................
3.1.4
Define assumptions .............................................................................................................
3.1.4.1
Testing Costs assumption: uniform distribution .....................................................
3.1.4.2
Marketing Costs assumption: triangular distribution ............................................
3-1
3-1
3-2
3-2
3-2
3-3
3-6
iii
3.1.4.3
Patients Cured assumption: binomial distribution ................................................. 3-7
3.1.4.4
Growth Rate assumption: custom distribution........................................................ 3-8
3.1.4.5
Market Penetration assumption: normal distribution ......................................... 3-12
3.1.5
Define forecasts ................................................................................................................. 3-15
3.1.5.1
Gross Profit forecast .................................................................................................. 3-15
3.1.5.2
Net profit forecast...................................................................................................... 3-16
3.1.6
Run the simulation ........................................................................................................... 3-17
3.1.6.1
Set Run preferences ................................................................................................... 3-17
3.1.6.2
Click the Run button ................................................................................................. 3-17
3.1.7
Interpret the results .......................................................................................................... 3-17
3.1.7.1
Review the net profit forecast chart ........................................................................ 3-18
3.1.7.2
Determine the net profit certainty level ................................................................. 3-19
3.1.7.3
Customize the forecast charts .................................................................................. 3-21
3.1.8
Close Crystal Ball .............................................................................................................. 3-22
3.1.9
Summary ............................................................................................................................ 3-22
3.2
Learning more .......................................................................................................................... 3-22
4 Looking Beyond
4.1
4.1.1
4.1.2
4.1.3
4.1.4
4.1.5
4.1.6
4.1.7
4.2
4.2.1
4.2.2
4.2.3
4.2.4
4.2.5
4.2.6
4.2.7
4.2.8
4.2.9
4.2.10
4.3
4.4
4.5
Other charts and analysis tools .................................................................................................
Overlay charts ......................................................................................................................
Trend charts..........................................................................................................................
Sensitivity charts ..................................................................................................................
Scatter charts.........................................................................................................................
OptQuest charts ...................................................................................................................
Reports...................................................................................................................................
Extracting and pasting data ...............................................................................................
Other Crystal Ball tools ..............................................................................................................
Batch Fit.................................................................................................................................
Bootstrap ...............................................................................................................................
Correlation Matrix ...............................................................................................................
Data Analysis .......................................................................................................................
Decision Table ......................................................................................................................
Scenario Analysis.................................................................................................................
Tornado Chart ......................................................................................................................
2D Simulation.......................................................................................................................
Strategic Finance Setup .......................................................................................................
Compare Run Modes ..........................................................................................................
Process capability features.........................................................................................................
Trend analysis with CB Predictor.............................................................................................
Optimizing decision variable values with OptQuest ............................................................
4-1
4-1
4-2
4-3
4-3
4-4
4-5
4-5
4-6
4-6
4-6
4-6
4-6
4-7
4-7
4-7
4-7
4-7
4-7
4-7
4-8
4-8
A Toolbar and Menu Commands: Excel 2003 or earlier
A.1
A.2
A.2.1
A.3
A.4
iv
The Crystal Ball toolbar.............................................................................................................
Crystal Ball menus .....................................................................................................................
Distribution Gallery menus...............................................................................................
Shortcut key combinations in Excel 2003 or earlier ..............................................................
Distribution gallery hot keys....................................................................................................
A-1
A-1
A-2
A-2
A-8
A.5
Chart preference hot keys......................................................................................................... A-8
B Using Crystal Ball in Excel 2007
B.1
B.1.1
B.1.2
B.1.3
B.1.4
B.2
B.3
B.4
B.5
The Crystal Ball ribbon in Excel 2007......................................................................................
Define....................................................................................................................................
Run........................................................................................................................................
Analyze.................................................................................................................................
Help ......................................................................................................................................
Shortcut key combinations in Excel 2007 ...............................................................................
Distribution gallery hot keys....................................................................................................
Chart preference hot keys.........................................................................................................
Compatibility and file conversion issues ...............................................................................
B-1
B-2
B-2
B-2
B-2
B-3
B-7
B-7
B-7
C How Do I...
C.1
C.2
C.2.1
C.2.1.1
C.2.1.2
C.2.1.3
C.2.1.4
C.2.1.5
C.2.2
C.2.3
C.2.4
C.2.5
C.2.6
C.3
C.3.1
C.3.2
C.3.3
C.3.3.1
C.3.3.2
C.3.3.3
C.3.3.4
C.3.4
C.3.4.1
C.3.4.2
C.3.4.3
C.4
C.4.1
C.4.1.1
C.4.1.2
C.4.1.3
C.4.2
C.4.2.1
Crystal Ball tasks ........................................................................................................................ C-1
Defining Crystal Ball models ................................................................................................... C-3
Defining assumption cells ................................................................................................. C-3
Entering cell references............................................................................................... C-3
Alternate parameters for distributions..................................................................... C-4
Fitting distributions to data ....................................................................................... C-4
Correlating assumptions ............................................................................................ C-4
Using the Distribution Gallery .................................................................................. C-5
Defining decision variable cells ........................................................................................ C-5
Defining forecast cells ........................................................................................................ C-5
Setting cell preferences....................................................................................................... C-6
Selecting Crystal Ball data ................................................................................................. C-6
Copying, pasting, and clearing Crystal Ball data........................................................... C-7
Running simulations ................................................................................................................. C-7
Setting run preferences ...................................................................................................... C-7
Freezing cells during simulation runs ............................................................................. C-8
Running a simulation......................................................................................................... C-8
Starting a simulation ................................................................................................... C-8
Stopping, resetting, and rerunning a simulation .................................................... C-9
Using the Crystal Ball Control Panel ........................................................................ C-9
Using single step.......................................................................................................... C-9
Saving and restoring Crystal Ball results ........................................................................ C-9
Saving results ............................................................................................................... C-9
Restoring results .......................................................................................................... C-9
Saving Crystal Ball models (not results) ................................................................ C-10
Analyzing simulation results ................................................................................................. C-10
Using forecast charts ........................................................................................................ C-11
Using the certainty grabbers .................................................................................... C-11
Forecast chart views .................................................................................................. C-12
Customizing forecast charts..................................................................................... C-13
Using overlay charts......................................................................................................... C-14
Creating overlay charts............................................................................................. C-14
v
C.4.2.2
Customizing overlay charts .....................................................................................
C.4.3
Using sensitivity charts....................................................................................................
C.4.3.1
Benefits ........................................................................................................................
C.4.3.2
A related tool..............................................................................................................
C.4.3.3
Sensitivity chart views ..............................................................................................
C.4.3.4
Sensitivity chart limitations .....................................................................................
C.4.3.5
Creating sensitivity charts........................................................................................
C.4.3.6
Customizing sensitivity charts ................................................................................
C.4.3.6.1
Adding and removing assumptions................................................................
C.4.3.6.2
Changing the target forecast.............................................................................
C.4.3.6.3
Setting sensitivity preferences ..........................................................................
C.4.3.6.4
Setting sensitivity chart preferences ................................................................
C.4.4
Using trend charts ............................................................................................................
C.4.4.1
Creating trend charts ................................................................................................
C.4.4.2
Trend chart views ......................................................................................................
C.4.4.3
Customizing trend charts .........................................................................................
C.4.5
Using assumption charts .................................................................................................
C.4.5.1
Creating assumption charts .....................................................................................
C.4.5.2
Viewing assumption charts......................................................................................
C.4.5.3
Customizing assumption charts..............................................................................
C.4.6
Using scatter charts ..........................................................................................................
C.4.6.1
Creating scatter charts ..............................................................................................
C.4.6.2
Customizing scatter charts .......................................................................................
C.4.6.3
Adding and removing assumptions and forecasts...............................................
C.4.6.4
Setting scatter preferences........................................................................................
C.4.6.5
Setting scatter chart preferences..............................................................................
C.4.7
Using OptQuest charts.....................................................................................................
C.4.7.1
Creating OptQuest charts.........................................................................................
C.4.7.2
OptQuest chart views ...............................................................................................
4.5.0.1
Best Solution view .....................................................................................................
4.5.0.2
Solution Analysis view .............................................................................................
4.5.0.3
Efficient Frontier chart ..............................................................................................
C.4.8
Setting chart preferences..................................................................................................
C.4.8.1
Hot keys for chart preferences.................................................................................
C.5
Creating reports and extracting data ....................................................................................
C.5.1
Creating reports ................................................................................................................
C.5.1.1
Creating a report — the basics.................................................................................
C.5.1.1.1
Choosing a location and format for your report............................................
C.5.1.2
Creating custom reports ...........................................................................................
C.5.2
Extracting data ..................................................................................................................
C.5.3
Printing extracted reports and data ...............................................................................
C.6
Using the Crystal Ball tools ....................................................................................................
C.7
Using Crystal Ball spreadsheet functions.............................................................................
C.8
Using Crystal Ball macros.......................................................................................................
C.9
Using the process capability features....................................................................................
C.9.1
Activating the process capability features ....................................................................
C.9.2
Adding specification limits and a target .......................................................................
vi
C-15
C-16
C-16
C-16
C-17
C-17
C-17
C-18
C-18
C-18
C-18
C-18
C-19
C-19
C-20
C-20
C-21
C-21
C-22
C-22
C-22
C-24
C-25
C-26
C-26
C-27
C-28
C-28
C-29
C-29
C-29
C-30
C-31
C-31
C-31
C-31
C-32
C-32
C-33
C-33
C-34
C-34
C-34
C-34
C-34
C-35
C-35
C.9.3
Chart display views and preferences............................................................................. C-35
D Choosing a distribution
D.1
D.2
Which distributions should I use?........................................................................................... D-1
What parameters should I enter?............................................................................................. D-4
Index
vii
viii
1
Welcome to Crystal Ball
1
Oracle® Crystal Ball, Fusion Edition, is a user-friendly, graphically oriented forecasting
and risk analysis program that takes the uncertainty out of decision-making.
Through the power of simulation, you can answer questions such as, “Will we stay
under budget if we build this facility?” or, “What are the chances this project will
finish on time?” or, “How likely are we to achieve this level of profitability?” With
Crystal Ball, you will become a more confident, efficient, and accurate decision-maker.
Crystal Ball is easy to learn and easy to use. Unlike other forecasting and risk analysis
programs, you do not have to learn unfamiliar formats or special modeling languages.
To get started, all you have to do is create a spreadsheet. From there, this manual
guides you step by step, explaining Crystal Ball terms, procedures, and results.
And you do get results from Crystal Ball. Through a technique known as Monte Carlo
simulation, Crystal Ball forecasts the entire range of results possible for a given
situation. It also shows you confidence levels, so you will know the likelihood of any
specific event taking place.
1.1 Who should use Crystal Ball?
Crystal Ball is for the decision-maker, from the businessperson analyzing the potential
for new markets to the scientist evaluating experiments and hypotheses. Crystal Ball is
easy to learn and easy to use, and has been developed with a wide range of
spreadsheet uses and users in mind.
You don’t need highly advanced statistical or computer knowledge to use Crystal Ball
to its full potential. All you need is a basic working knowledge of your personal
computer and the ability to create a spreadsheet model.
1.2 What you will need
Crystal Ball runs on several versions of Microsoft Windows and Microsoft Excel. For a
complete list of required hardware and software, see the Crystal Ball Installation and
Licensing Guide in your Crystal Ball installation folder, by default, C:\Program
Files\Oracle\Crystal Ball\Docs.
1.3 How this guide is organized
The Crystal Ball Getting Started Guide includes the following:
■
Chapter 2, "A Quick Look — Tutorial 1"
Welcome to Crystal Ball 1-1
Conventions used in this manual
This chapter presents the basics you need to understand Monte Carlo simulation,
start Crystal Ball, review the menus and toolbars, run simulations, and close
Crystal Ball.
■
Chapter 3, "Looking Deeper — Tutorial 2"
This chapter demonstrates how to define more complex models and teaches more
about running simulations and interpreting the results.
■
Chapter 4, "Looking Beyond"
This chapter discusses additional charts, reports, and other Crystal Ball products
that can help you analyze and interpret simulation results.
■
Appendix A, "Toolbar and Menu Commands: Excel 2003 or earlier"
This appendix shows command equivalents and descriptions for each Crystal Ball
toolbar button.
■
Appendix B, "Using Crystal Ball in Excel 2007"
This appendix describes the Crystal Ball ribbon in Excel 2007 and provides more
information about using Crystal Ball with Excel 2007 and Windows Vista.
■
Appendix C, "How Do I..."
This appendix summarizes how to use Crystal Ball to perform and analyze Monte
Carlo simulations in Excel workbooks.
■
Appendix D, "Choosing a distribution"
This appendix illustrates and summarizes the distributions available for use in
defining Crystal Ball assumptions.
For information about how to use all features of Crystal Ball, see the Crystal Ball User
Manual and online help.
1.4 Conventions used in this manual
This manual uses the following conventions:
■
Text separated by > symbols means that you choose menu options in the sequence
shown, starting from the left. The following example means that you choose the
Exit option from the File menu:
1.
■
Steps with attached icons mean that you can click the icon instead of manually
choosing the menu options in the text. For example:
2.
■
■
Choose File > Exit.
Choose Define > Define Assumption.
Ctrl-c means that you hold down the Ctrl key and type c. Capitalization is
important; Ctrl-c and Ctrl-C are two different key sequences.
A key sequence without hyphens means you type the sequence in the order shown
but not simultaneously. For example,
Ctrl-q N means that you press the Ctrl key and type q simultaneously, and then
type N.
1-2 Crystal Ball Getting Started Guide
Technical support and more
Note: Screenshots were taken in Microsoft Excel 2003 on Windows
XP Professional. Due to round-off differences between various system
configurations, you might obtain slightly different calculated results
than those shown in the examples.
1.5 Getting help
As you work in Crystal Ball, you can display online help in a variety of ways:
■
Click the Help button in a dialog.
■
Click the Help button in the Crystal Ball toolbar in Excel.
■
In the Excel menubar, choose Help > Crystal Ball > Crystal Ball Help.
■
In the Distribution Gallery and other dialogs, press F1.
In Excel 2007, click Help at the right end of the Crystal Ball ribbon. Note that if you
press F1 in Excel 2007, Excel help appears unless you are viewing the Distribution
Gallery or another Crystal Ball dialog.
The legacy WinHlp32 viewer for online help files is not
shipped with Windows Vista, so 32-bit help files in WinHelp format
with extension .hlp (such as the CB Predictor help) cannot be opened.
For information from Microsoft about downloading a viewer, see:
Note:
http://support.microsoft.com/kb/917607
1.6 Technical support and more
Oracle offers a variety of resources to help you use Crystal Ball, such as technical
support, training, and other services. For information, see:
http://www.oracle.com/crystalball
Welcome to Crystal Ball 1-3
Technical support and more
1-4 Crystal Ball Getting Started Guide
2
A Quick Look — Tutorial 1
2
In this chapter:
■
What Crystal Ball does
■
Tutorial 1 — Futura Apartments
■
Learning more
This chapter presents the basics you need to understand Monte Carlo simulation, start
Crystal Ball, review the menus and toolbars, run simulations, and close Crystal Ball.
Tutorial 1 is ready to run so you can quickly see how Crystal Ball works. If you work
regularly with statistics and forecasting techniques, this might be all the introduction
you need before running your own spreadsheets with Crystal Ball.
The next chapter, "Looking Deeper — Tutorial 2," teaches more about defining and
running simulations and interpreting their results.
Now, spend a few moments learning how Crystal Ball can help you make better
decisions under conditions of uncertainty.
2.1 What Crystal Ball does
As a spreadsheet user, you know that spreadsheets have two major limitations:
■
■
You can change only one spreadsheet cell at a time. As a result, exploring the
entire range of possible outcomes is next to impossible; you cannot realistically
determine the amount of risk that is impacting your bottom line.
“What-if” analysis always results in single-point estimates which do not indicate
the likelihood of achieving any particular outcome. While single-point estimates
might tell you what is possible, they do not tell you what is probable.
Crystal Ball overcomes both of these limitations:
■
■
You can describe a range of possible values for each uncertain cell in your
spreadsheet. Everything you know about each assumption is expressed all at once.
For example, you can define your business phone bill for future months as any
value between $2500 and $3500, instead of using a single-point estimate of $3000.
Crystal Ball then uses the defined range in a simulation.
Using a process called Monte Carlo simulation, Crystal Ball displays results in a
forecast chart that shows the entire range of possible outcomes and the likelihood
of achieving each of them.
In addition, Crystal Ball keeps track of the results of each scenario for you.
A Quick Look — Tutorial 1 2-1
Tutorial 1 — Futura Apartments
To summarize, Crystal Ball is an analytical tool that helps executives, analysts, and
others make decisions by performing simulations on spreadsheet models. The
forecasts that result from these simulations help quantify areas of risk so
decision-makers can have as much information as possible to support wise decisions.
The basic process for using Crystal Ball, then, is to:
1.
Build a model that reflects an uncertain scenario.
2.
Run a simulation on it.
3.
Analyze the results.
The best way to quickly understand this process is to start Crystal Ball and work on
the first tutorial: the Futura Apartments spreadsheet.
2.2 Tutorial 1 — Futura Apartments
In this tutorial, you will learn how to:
■
Start Crystal Ball.
■
Open an example model within Crystal Ball.
■
Use the Crystal Ball menus, toolbar, and Control Panel to run an example model.
■
Switch to the Demo simulation mode for a closer look at how Crystal Ball works.
■
Close Crystal Ball.
2.2.1 Start Crystal Ball
With Excel closed or open:
1.
Choose Start > [All] Programs > Crystal Ball > Crystal Ball.
Crystal Ball opens and launches Excel. If Excel is already open, Crystal Ball opens in a
new Excel window.
2.2.1.1 Crystal Ball Welcome screen
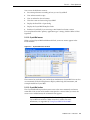
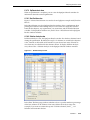
The first time you start Crystal Ball, the Welcome screen appears, similar to Figure 2–1,
following. Depending on your license features and whether you are using a purchased
or a trial version, the screen might differ somewhat from this illustration.)
Figure 2–1
The Crystal Ball Welcome screen
2-2 Crystal Ball Getting Started Guide
Tutorial 1 — Futura Apartments
You can use the Welcome screen to:
■
Set certain preferences according to how you use Crystal Ball
■
View online tutorials or tips
■
View an online list of new features
■
Close the screen and start using Crystal Ball
■
Display the Excel File > Open dialog
■
Display the Crystal Ball Examples Guide
■
Purchase Crystal Ball, if you are using a time-limited evaluation version
For an explanation of the “primary application type” settings, click the What Is This?
hyperlink.
2.2.1.2 Crystal Ball menus
When you load Crystal Ball with Microsoft Excel, some new menus appear in the
Excel menubar.
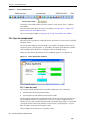
Figure 2–2
Crystal Ball menus in Excel
These menus let you define, run, and analyze simulations in Crystal Ball. You can also
use commands on Excel’s Help menu to display online help, documentation, and
example models for Crystal Ball.
2.2.1.3 Crystal Ball toolbar
The Crystal Ball toolbar provides instant access to the most commonly used menu
commands. Each section of the toolbar corresponds to a menu. When you move the
cursor over a toolbar button, the command name appears.
If you are using Crystal Ball in Excel 2007, you will see a single
Crystal Ball tab and then a ribbon instead of a toolbar. For more
information, see Appendix B, "Using Crystal Ball in Excel 2007."
Note:
A Quick Look — Tutorial 1 2-3
Tutorial 1 — Futura Apartments
Figure 2–3
The Crystal Ball toolbar
To turn the Crystal Ball toolbar off for the current session, choose View > Toolbars >
Crystal Ball.
For more information about the menus and toolbar, see Appendix A, "Toolbar and
Menu Commands: Excel 2003 or earlier".
(If you are using Excel 2007, see Appendix B, "Using Crystal Ball in Excel 2007".)
2.2.2 Open the example model
Open the Futura Apartments workbook (Futura Apartments.xls) from the Crystal Ball
Examples folder.
You can find this folder by choosing Help > Crystal Ball > Examples Guide. You can
also choose Start > [All] Programs > Crystal Ball > Examples in the Windows taskbar.
(In Excel 2007, choose Resources > Examples Guide in the Help group.)
When you open Futura Apartments.xls, the workbook appears, as in Figure 2–4.
Figure 2–4
Futura Apartments workbook
2.2.2.1 About the model
All example models included with Crystal Ball include these two worksheets:
■
A Model tab with the spreadsheet model
■
A Description tab with information about the model
The Description tab contains detailed information about the model scenario and how
the spreadsheet formulas are constructed so you can use each example model as a
tutorial. For a list of the models included with Crystal Ball, choose Help > Crystal Ball
> Examples Guide in the Excel menubar or choose Start > [All] Programs > Crystal
Ball > Examples and open the Examples Guide.
(In Excel 2007, choose Resources > Examples Guide.)
2-4 Crystal Ball Getting Started Guide
Help
Tutorial 1 — Futura Apartments
2.2.2.2 The Futura Apartments model scenario
In this example, you are a potential purchaser of the Futura Apartments complex. You
have researched the situation and created Futura Apartments.xls to help you make a
knowledgeable decision. Your work has led you to make the following assumptions:
■
■
■
$500 per month is the going rent for the area.
The number of units rented during any given month will be somewhere between
30 and 40.
Operating costs will average around $15,000 per month for the entire complex, but
might vary slightly from month to month.
Based on these assumptions, you want to know how profitable the apartment complex
will be for various combinations of rented units and operating costs. This would be
difficult to determine using a spreadsheet alone. As useful as spreadsheets are, you
cannot reduce the last two assumptions to single values as required by the spreadsheet
format. If you tried all the combinations, you would need to spend a great deal of time
working through what-if scenarios, entering single values and recording the results.
Even then, you would likely be left with a mountain of data instead of the overall
profit and loss picture.
With Crystal Ball, this kind of analysis is easy.
For this tutorial, the simulation has already been set up for you. You just need to run it
using the Crystal Ball default settings.
2.2.3 Run the simulation
To run the simulation:
1.
Choose Run > Start [Simulation].
Crystal Ball runs a simulation for the situation in the Futura Apartments workbook
and displays a forecast chart as it calculates the results.
By default, the simulation stops automatically after it has run for 1,000 trials. For larger
models, you can use the Stop button or choose Run > Stop [Simulation] if it is
necessary to stop the simulation before all trials have run.
When the simulation stops, the forecast window appears, as in Figure 2–5. The
numbers will vary slightly each time the simulation is run, but the forecast window
should look similar to this illustration.
A Quick Look — Tutorial 1 2-5
Tutorial 1 — Futura Apartments
Figure 2–5
Futura Apartments profit/loss forecast
If the forecast window disappears behind Excel’s window
during a simulation, you can bring it back to the front by clicking the
Crystal Ball icon in the Windows task bar.
Note:
In Excel 2007, you can choose Analyze > View Charts > Forecast
Charts.
The forecast chart reveals the total range of profit or loss outcomes predicted for the
Futura Apartments scenario. Each bar on the chart represents the likelihood, or
probability, of earning a given income. The cluster of columns near the center indicates
that the most likely income level is between $2000 and $4000 per month. Note that
there is also a small chance of losing almost $2000 per month (the left end of the
display range) and a small chance of making about a $7,000 gain.
Notice that the probability, or certainty, of a value falling within the range of negative
infinity and positive infinity is 100 percent. Notice too that the upper left corner of the
chart shows 1000 trials but the upper right corner of the chart shows 998 displayed.
The excluded values, if any, are called outliers. They are included in calculations but
are not included in the forecast chart.
2.2.4 Determine profit
Now you can use Crystal Ball to determine the statistical likelihood of making a profit:
1.
Select the left certainty field in the forecast window.
2.
Type 0 in the field.
3.
Press Enter.
The value in the Certainty field changes to reflect the probability of making a profit —
reaching an income level ranging from $0 to positive infinity. This information puts
2-6 Crystal Ball Getting Started Guide
Tutorial 1 — Futura Apartments
you in a much better position to decide whether to purchase the Futura Apartments.
Figure 2–6 shows the chance of making a profit is about 90%.
Figure 2–6
Chance of profit
2.2.5 Take a look behind the scenes
While powerful results appeared in this example with virtually no effort, obviously
there must be some drivers in the process. Crystal Ball can’t generate the same results
for any typical spreadsheet without some help.
The key is using Crystal Ball to define certain input cells of the spreadsheet as
assumptions and certain output cells of interest as forecasts.
Once these cells are defined, Crystal Ball uses Monte Carlo simulation to model the
complexity of a real-world scenario.
For each trial of a simulation, Crystal Ball repeats the following three steps:
1.
For every assumption cell, a random number is generated according to the range
you defined and then is placed into the spreadsheet.
2.
The spreadsheet is recalculated.
3.
A value is retrieved from every forecast cell and added to the chart in the forecast
windows.
This is an iterative process that continues until either:
■
The simulation reaches a stopping criterion
■
You stop the simulation manually
The final forecast chart reflects the combined uncertainty of the assumption cells on
the model’s output. Keep in mind that Monte Carlo simulation can only approximate
a real-world situation. When you build and simulate your own spreadsheet models,
you need to carefully examine the nature of the problem and continually refine the
models until they approximate your situation as closely as possible.
2.2.5.1 Crystal Ball cells in the example model
The Futura Apartments model has two assumption cells and a forecast cell. They were
already defined before you ran the simulation:
A Quick Look — Tutorial 1 2-7
Tutorial 1 — Futura Apartments
■
■
■
Cell C5 defines the assumption about occupancy — that units rented each month
will vary between 30 and 40.
Cell C7 defines the assumption about operating costs — that they will average
around $15,000 per month but might vary slightly.
Cell C9 defines the simulation forecast (the results). If you highlight cell C9, you
can see it contains a formula that references cells C5 and C7.
By default, assumption cells are green and forecast cells are blue. For each trial of the
simulation, the values within these cells change as the worksheet is recalculated.
To see this process close-up, reset the model and run it again in single-step mode. You
can use the Crystal Ball Control Panel for these procedures.
2.2.6 Reset and single-step
When you first run a simulation, the Crystal Ball Control Panel appears. Once it
appears, you will find it convenient to use for managing simulations and analyzing
results.
If the Control Panel or any other Crystal Ball windows
disappear behind Excel, you can click the Crystal Ball icon in the
Windows task bar to display them again.
Note:
Figure 2–7
The Crystal Ball Control Panel
For information about the Crystal Ball Control Panel menus, see “The Crystal Ball
Control Panel menubar” in Chapter 4 of the Crystal Ball User Manual.
■
■
To reset the simulation and clear all previous calculations, click the Reset button.
To single-step through the simulation one trial at a time, click the Single-step
button.
Notice that the values in the assumption and forecast cells change each time you click
the Single-step button.
2.2.7 Close Crystal Ball
This completes Tutorial 1. You can save and close Crystal Ball models the same as any
other Excel workbook.
2-8 Crystal Ball Getting Started Guide
Learning more
If you want, you can click the Reset button or choose Run > Reset [Simulation] to reset
your model before you close Crystal Ball.
To close Crystal Ball, either:
■
Right-click the Crystal Ball icon in the Windows taskbar and choose Close, or
■
Close Excel.
2.2.8 Tutorial review
In this tutorial, you have:
■
Opened Crystal Ball.
■
Used the Crystal Ball menus, toolbar, and Control Panel to run an example model.
■
■
Observed how Crystal Ball assumption and forecast cells change while a
simulation runs.
Closed Crystal Ball.
2.3 Learning more
For background information about risk, risk analysis, models, and Monte Carlo
simulation, see Chapter 1 of the Crystal Ball User Manual.
Tutorial 2, in the next chapter, shows how to define assumption and forecast cells and
gives more suggestions for analyzing the results.
A Quick Look — Tutorial 1 2-9
Learning more
2-10 Crystal Ball Getting Started Guide
3
Looking Deeper — Tutorial 2
3
In this chapter:
■
Tutorial 2 — Vision Research
■
Learning more
Tutorial 1, in the previous chapter, simulates profit/loss projections from apartment
rentals and presents the basics of starting Crystal Ball and using it to run simulations.
Tutorial 2, in this chapter, gives you a chance to enter data and set up a complete
simulation for a major corporate expenditure decision.
3.1 Tutorial 2 — Vision Research
This chapter contains a tutorial for the Vision Research spreadsheet. This tutorial
provides a more realistic situation to let you examine Crystal Ball’s features in greater
depth. However, if you feel comfortable running Crystal Ball now, you can refer to the
Crystal Ball User Manual to start analyzing your own spreadsheets.
As you work through this tutorial, don’t worry about making mistakes. Recovery is as
easy as backing up and repeating the steps. If you need additional help, see the Crystal
Ball online help.
In this tutorial, you will review or learn how to:
■
Start Crystal Ball
■
Open the example model
■
Review the Vision Research scenario
■
Define assumptions
■
Define forecasts
■
Run the simulation
■
Interpret the results
■
Close Crystal Ball
3.1.1 Start Crystal Ball
If Crystal Ball is not already started, follow the instructions in Section 2.2.1, "Start
Crystal Ball".
Looking Deeper — Tutorial 2 3-1
Tutorial 2 — Vision Research
3.1.2 Open the example model
Open the Vision Research workbook (Vision Research.xls) from the Crystal Ball
Examples folder.
You can find this folder by choosing Help > Crystal Ball > Examples Guide. You can
also choose Start > Programs > Crystal Ball > Examples in the Windows taskbar.
(In Excel 2007, choose Resources > Examples Guide.)
The Vision Research workbook for the ClearView project appears, as in Figure 3–1.
Figure 3–1
Vision Research’s ClearView project workbook
This spreadsheet models the problem that Vision Research is trying to solve.
3.1.3 Review the Vision Research scenario
The Vision Research spreadsheet models a business situation filled with uncertainty.
Vision Research has completed preliminary development of a new drug, code-named
ClearView, that corrects nearsightedness. This revolutionary new product could be
completely developed and tested in time for release next year if the FDA approves the
product. Although the drug works well for some patients, the overall success rate is
marginal, and Vision Research is uncertain whether the FDA will approve the product.
You begin your analysis by defining assumption cells to support this scenario.
3.1.4 Define assumptions
In Crystal Ball, you define an assumption for a value cell by choosing a probability
distribution that describes the uncertainty of the data in the cell. To accomplish this,
you choose among the distribution types in the Distribution Gallery (see Figure 3–2 on
page 3-4).
3-2 Crystal Ball Getting Started Guide
Tutorial 2 — Vision Research
How do you know which distribution type to choose? This portion of the tutorial will
help you understand how to choose a distribution type based on the answer you are
looking for. In the following exercises, you select the assumption cells in the Vision
Research spreadsheet and choose the probability distributions that most accurately
describe the uncertainties of the ClearView project. For more information about
choosing distributions, see Appendix D, "Choosing a distribution" in this Guide and
Appendix A of the Crystal Ball User Manual.
You need to define or review these assumptions:
■
Testing Costs assumption: uniform distribution
■
Marketing Costs assumption: triangular distribution
■
Patients Cured assumption: binomial distribution
■
Growth Rate assumption: custom distribution
■
Market Penetration assumption: normal distribution
3.1.4.1 Testing Costs assumption: uniform distribution
So far, Vision Research has spent $10,000,000 developing ClearView and expects to
spend an additional $3,000,000 to $5,000,000 to test it based on the cost of previous
tests. For this variable, “testing costs,” Vision Research thinks that any value between
$3,000,000 and $5,000,000 has an equal chance of being the actual cost of testing.
Using Crystal Ball, Vision Research chooses the uniform distribution to describe the
testing costs. The uniform distribution describes a situation where all values between
the minimum and maximum values are equally likely to occur, so this distribution best
describes the company’s best guess for the cost of testing ClearView.
Once you choose the correct distribution type, you are ready to define the assumption
cell.
To define the assumption cell for testing costs:
1.
Click cell C5.
2.
Choose Define > Define Assumption.
Because an assumption has not yet been defined in cell C5, the Distribution
Gallery dialog appears as shown in Figure 3–2.
Looking Deeper — Tutorial 2 3-3
Tutorial 2 — Vision Research
Figure 3–2
Distribution Gallery dialog
By default, the Basic distributions appear. These are six of the most frequently
used continuous and discrete distributions. When you click a distribution to
choose it, information about that distribution appears at the bottom of the
Distribution Gallery.
In Excel 2007, if you click the upper half of the Define
Assumption icon or if the assumption has already been defined, the
Distribution Gallery appears.
Note:
If you click the lower half of the Define Assumption icon, a list of All,
Basic, or Favorite distributions appears, depending on the active
category in the Distribution Gallery.
3.
Click the Uniform distribution.
4.
Click OK.
The Uniform Distribution dialog appears.
3-4 Crystal Ball Getting Started Guide
Tutorial 2 — Vision Research
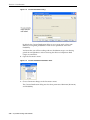
Figure 3–3
Uniform distribution for C5
Since cell C5 already has text to the left of it on the worksheet, that text appears in the
Assumption Name field. Use this name, rather than typing a new one. Also, notice
that Crystal Ball assigns default values to the distribution parameters, Minimum and
Maximum.
Vision Research expects to spend a minimum of $3,000,000 and a maximum of
$5,000,000 on testing. Use these values in place of the defaults to specify the
parameters of the uniform distribution in Crystal Ball, as described in the following
steps:
5.
Type 3 in the Minimum field (remember that the numbers on the worksheet
represent millions of dollars).
This represents $3,000,000, the minimum amount Vision Research estimates for
testing costs.
6.
Press Tab.
7.
Type 5 in the Maximum field.
This represents $5,000,000, the maximum estimate for testing costs.
8.
Click Enter.
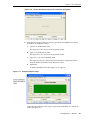
The distribution changes to reflect the values you entered, as shown in Figure 3–4.
Looking Deeper — Tutorial 2 3-5
Tutorial 2 — Vision Research
Figure 3–4
Changed distribution values
With the values from Steps 5 and 7 entered correctly, your distribution looks like
Figure 3–4. Later, when you run the simulation, Crystal Ball generates random
values for cell C5 that are evenly spread between 3 and 5 million dollars.
9.
Click OK to return to the worksheet.
The assumption cell is now green.
3.1.4.2 Marketing Costs assumption: triangular distribution
Vision Research plans to spend a sizeable amount marketing ClearView if the FDA
approves it. They expect to hire a large sales force and kick off an extensive advertising
campaign to educate the public about this exciting new product. Including sales
commissions and advertising costs, Vision Research expects to spend between
$12,000,000 and $18,000,000, with a most likely amount of $16,000,000.
Vision Research chooses the triangular distribution to describe marketing costs
because the triangular distribution describes a situation where you can estimate the
minimum, maximum, and most likely values to occur. This assumption is already
defined for you.
To examine the assumption cell for marketing costs:
1.
Click cell C6.
2.
Choose Define > Define Assumption.
The Triangular Distribution dialog appears for cell C6.
3-6 Crystal Ball Getting Started Guide
Tutorial 2 — Vision Research
Figure 3–5
Triangular distribution for cell C6
The triangular distribution has three parameters — Minimum, Likeliest, and
Maximum:
■
Minimum is set to $12,000,000, the minimum amount Vision Research
estimates for marketing costs.
■
Likeliest is set to $16,000,000, the most likely amount for marketing costs.
■
Maximum is set $18,000,000, the maximum estimate for marketing costs.
When you run the simulation, Crystal Ball generates random values that fall
around 16, with fewer values near 12 and 18.
3.
Click OK to return to the worksheet.
3.1.4.3 Patients Cured assumption: binomial distribution
Before the FDA will approve ClearView, Vision Research must conduct a controlled
test on a sample of 100 patients for one year. Vision Research expects that the FDA will
grant an approval if ClearView completely corrects the nearsightedness of 20 or more
of these patients without any significant side-effects. In other words, 20% or more of
the patients tested must show corrected vision after taking ClearView for one year.
Vision Research is very encouraged by their preliminary testing, which shows a
success rate of around 25%.
For this variable, “patients cured,” Vision Research knows only that their preliminary
testing shows a cure rate of 25%. Will ClearView meet the FDA standards? Using
Crystal Ball, Vision Research chooses the binomial distribution to describe the
uncertainties in this situation because the binomial distribution describes the random
number of successes (25) in a fixed number of trials (100).
This assumption is already defined. To examine the assumption cell for patients cured,
use the following steps.
1.
Click cell C10.
2.
Choose Define > Define Assumption.
The Binomial Distribution dialog appears as shown in Figure 3–6.
Looking Deeper — Tutorial 2 3-7
Tutorial 2 — Vision Research
Figure 3–6
Binomial Distribution dialog
The binomial distribution has two parameters: Probability and Trials. Because Vision
Research experienced a 25% success rate during preliminary testing, the Probability
parameter is set to 0.25 to show the likelihood of success.
You can express probabilities either as decimals between 0 and
1, such as 0.03, or as whole numbers followed by the percent sign,
such as 3%.
Note:
Because the FDA expects Vision Research to test 100 people, the Trials parameter is set
to 100. When you run the simulation, Crystal Ball generates random integers between
0 and 100, simulating the number of patients that would be cured in the FDA test.
3.
Click OK to return to the worksheet.
3.1.4.4 Growth Rate assumption: custom distribution
Vision Research has determined that nearsightedness afflicts nearly 40,000,000 people
in the United States, and an additional 0% to 5% of these people will develop this
condition during the year in which ClearView is tested.
However, the marketing department has learned that a 25% chance exists that a
competing product will be released on the market soon. This product would decrease
ClearView’s potential market by 5% to 15%.
This variable, “growth rate of nearsightedness,” cannot be described by any of the
standard probability distributions. Since the uncertainties in this situation require a
unique approach, Vision Research chooses Crystal Ball’s custom distribution to define
the growth rate. For the most part, the custom distribution is used to describe
situations that other distribution types cannot.
The method for specifying parameters in the custom distribution is quite unlike the
other distribution types, so follow the directions carefully. If you make a mistake, click
Gallery to return to the distribution gallery, then start again at step 4.
Use the custom distribution to plot both the potential increase and decrease of
ClearView’s market.
3-8 Crystal Ball Getting Started Guide
Tutorial 2 — Vision Research
To define the assumption cell for the growth rate of nearsightedness:
1.
Click cell C15.
2.
Choose Define > Define Assumption.
(In Excel 2007, click the upper half of the Define Assumption icon.)
The Distribution Gallery dialog appears.
3.
Click All at the left of the Distribution Gallery to show all distributions shipped
with Crystal Ball.
Figure 3–7
The All category of the Distribution Gallery
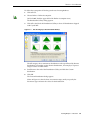
The All category shows continuous distributions at the top followed by discrete
distributions. You might use the discrete distributions, for example, to express a
range of values in whole dollars.
4.
Scroll down to the end of the Distribution Gallery and click the Custom
distribution.
5.
Click OK.
The Custom Distribution dialog appears.
Notice in Figure 3–8 that the chart area remains empty until you specify the
Parameters type and enter the values for the distribution.
Looking Deeper — Tutorial 2 3-9
Tutorial 2 — Vision Research
Figure 3–8
Custom Distribution dialog
By default, the Custom Distribution dialog is set to accept single values with
different, or weighted, probabilities. There are two parameters: Value and
Probability.
You know that you will be working with two distribution ranges: one showing
growth in nearsightedness and one showing the effects of competition. Both
ranges are continuous.
6.
Open the Parameters menu.
Figure 3–9
7.
Custom distribution Parameters menu
Choose Continuous Ranges in the Parameters menu.
The Custom Distribution dialog now has three parameters: Minimum, Maximum,
and Probability.
3-10 Crystal Ball Getting Started Guide
Tutorial 2 — Vision Research
Figure 3–10
8.
Custom distribution dialog set for continuous distributions
Enter the first range of values to show the growth of nearsightedness with low
probability of competitive effects:
a.
Type 0% in the Minimum field.
This represents a 0% increase in the potential market.
b.
Type 5% in the Maximum field.
This represents a 5% increase in the potential market.
c.
Type 75% or .75 in the Probability field.
This represents the 75% chance that Vision Research’s competitor will not
enter the market and reduce Vision Research’s share.
d.
Click Enter.
A uniform distribution for the range 0% to 5% appears.
Figure 3–11
Uniform distribution range
Notice that the total area of the range is equal to the probability: 5% wide by 15
units high equals 75%.
Looking Deeper — Tutorial 2 3-11
Tutorial 2 — Vision Research
9.
Now, enter a second range of values to show the effect of competition:
a.
Type -15% in the Minimum field.
This represents a 15% decrease in the potential market.
b.
Type -5% in the Maximum field.
This represents a 5% decrease in the potential market.
c.
Type 25% in the Probability field.
This represents the 25% chance that Vision Research’s competitor will enter
the market place and decrease Vision Research’s share by 5% to 15%.
d.
Click Enter.
A uniform distribution for the range -15% to -5% appears. Both ranges now
appear in the Custom Distribution dialog.
Figure 3–12
Customized uniform distribution
Notice that the area of the second range is also equal to its probability: 2.5 x 10% =
25%.
10. Click OK to return to the worksheet.
When you run the simulation, Crystal Ball generates random values within the
two ranges according to the probabilities you specified.
3.1.4.5 Market Penetration assumption: normal distribution
The marketing department estimates that Vision Research’s eventual share of the total
market for the product will be normally distributed around a mean value of 8% with a
standard deviation of 2%. “Normally distributed” means that Vision Research expects
to see the familiar bell-shaped curve with about 68% of all possible values for market
penetration falling between one standard deviation below the mean value and one
standard deviation above the mean value, or between 6% and 10%.
The low mean value of 8% is a conservative estimate that takes into account the side
effects of the drug that were noted during preliminary testing. In addition, the
marketing department estimates a minimum market of 5%, given the interest shown in
the product during preliminary testing.
3-12 Crystal Ball Getting Started Guide
Tutorial 2 — Vision Research
Vision Research chooses the normal distribution to describe the variable “market
penetration.”
To define the assumption cell for market penetration:
1.
Click cell C19.
2.
Choose Define > Define Assumption.
(In Excel 2007, click the upper half of the Define Assumption icon.)
The Distribution Gallery dialog appears.
3.
Click the normal distribution.
To find the normal distribution, you can either scroll up to the top of the All
category or click Basic to immediately display the normal distribution
4.
Click OK.
The Normal Distribution dialog appears.
Figure 3–13
5.
Normal distribution for cell C19
Now specify the parameters for the normal distribution: the mean and the
standard deviation.
a.
If the Mean field doesn’t contain 8.00%, type 8% in the Mean field.
This represents an estimated average for market penetration of 8%.
b.
Type 2% in the Std. Dev. field.
This represents an estimated 2% standard deviation from the mean.
6.
Click Enter.
The normal distribution scales to fit the chart area, so the shape of the distribution
does not change. However, the scale of percentages on the chart axis does change
as shown in Figure 3–14.
Looking Deeper — Tutorial 2 3-13
Tutorial 2 — Vision Research
Figure 3–14
7.
The Normal Distribution dialog with updated parameters
Click the More button to display additional fields above the parameters.
Figure 3–15
Assumption truncation fields
These fields, marked by gray arrows, display the minimum and maximum values
of the assumption range. If values are entered into them, they cut or truncate the
range. These fields are then called the truncation minimum and maximum.
8.
Type 5% in the left, minimum truncation field.
This represents 5%, the minimum market for the product.
9.
Click Enter.
The distribution changes to reflect the values you entered.
3-14 Crystal Ball Getting Started Guide
Tutorial 2 — Vision Research
Figure 3–16
Changed distribution for the truncated values
When you run the simulation, Crystal Ball generates random values that follow a
normal distribution around the mean value of 8%, and with no values generated
below the 5% minimum limit.
10. Click OK to return to the worksheet.
3.1.5 Define forecasts
Now that you have defined the assumption cells in your model, you are ready to
define the forecast cells. Forecast cells contain formulas that refer to one or more
assumption cells.
The president of Vision Research would like to know both the likelihood of achieving a
profit on the product and the most likely profit, regardless of cost. These forecasts
appear in the gross profit (cell C21) and net profit (cell C23) for the ClearView project.
Crystal Ball can generate more than one forecast during a simulation. In this case, you
can define both the gross profit and net profit formulas as forecast cells.
3.1.5.1 Gross Profit forecast
First, look at the contents of the cell for gross profit.
1.
Click cell C21.
The cell contents appear in the formula bar near the top of your worksheet. The
contents are C16*C19*C20. Crystal Ball uses this formula to calculate gross profit
by multiplying Persons With Nearsightedness After One Year (C16) by Market
Penetration (C19) by Profit Per Customer (C20).
Now that you understand the gross profit formula, you are ready to define the forecast
cell for gross profit.
To define this forecast cell:
2.
Choose Define > Define Forecast.
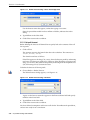
The Define Forecast dialog appears as shown in Figure 3–17. You can enter a name
for the forecast. Since the forecast cell has text to the left of it on the worksheet,
that text appears as a name in the dialog by default.
Looking Deeper — Tutorial 2 3-15
Tutorial 2 — Vision Research
Figure 3–17
Define Forecast dialog—Gross Profit If Approved
Use the forecast name that appears, rather than typing a new name.
Since the spreadsheet model involves millions of dollars, indicate that in this
dialog.
3.
Type Millions in the Units field.
4.
Click OK to return to the worksheet.
3.1.5.2 Net profit forecast
Before defining the forecast cell formula for net profit, look at the contents of the cell
for net profit:
1.
Click cell C23.
The contents appear in the formula bar above the worksheet. The contents are
IF(C11,C21-C7,-C4-C5).
The formula translates as follows:
If the FDA approves the drug (C11 is true), then calculate net profit by subtracting
total costs (C7) from gross profit (C21). However, if the FDA does not approve the
drug, (C11 is false), then calculate net profit by deducting both development costs
(C4) and testing costs (C5) incurred to date.
To define the forecast cell for net profit:
2.
Choose Define > Define Forecast.
The Define Forecast dialog appears, as in Figure 3–18.
Figure 3–18
Define Forecast dialog—Net Profit
Again, use the forecast name that appears in the Forecast Name field and specify
millions in the Units field.
3.
Type Millions in the Units field.
4.
Click OK to return to the worksheet.
You have defined assumptions and forecast cells for the Vision Research spreadsheet,
and are now ready to run a simulation.
3-16 Crystal Ball Getting Started Guide
Tutorial 2 — Vision Research
3.1.6 Run the simulation
When you run a simulation in Crystal Ball, you have the freedom to stop and then
continue the simulation at any time. The Run, Stop, and Continue commands appear
on the Run menu or ribbon group in Excel or the Crystal Ball Control Panel as you
need them. For example, when you are running a simulation, the Stop [Simulation]
command or button appears. If you stop the simulation, the Continue Simulation
command or button takes its place (in Excel 2003 or earlier).
Buttons for these commands appear on the Crystal Ball toolbar and, once you have
started to run a simulation, they appear on the Crystal Ball Control Panel, described in
Section 2.2.6, "Reset and single-step".
Before you begin the simulation, specify the number of trials and initial seed value so
your simulation will look like the forecast charts in this tutorial. See the Crystal Ball
User Manual for more information on trials and seed values.
3.1.6.1 Set Run preferences
To specify the number of trials and initial seed value:
1.
Choose Run > Run Preferences > Trials.
The Run Preferences Trials dialog appears. For this example, we will run more
trials to get more accurate forecast results.
2.
In the Number Of Trials To Run field, type 5000.
3.
Click Sampling.
4.
Choose Use Same Sequence Of Random Numbers.
5.
In the Initial Seed Value field, type 999.
6.
Notice there are two choices in the Sampling Methods group: Monte Carlo and
Latin Hypercube. Latin Hypercube is less random and produces a smoother, more
even results chart. For now, though, choose the default — Monte Carlo.
7.
Click OK.
3.1.6.2 Click the Run button
To run the simulation, click Run.
3.1.7 Interpret the results
Now that you have run the simulation, you are ready to interpret the forecast results.
The president of Vision Research faces a difficult decision: should the company scrap
the ClearView project or proceed to develop and market this revolutionary new drug?
To examine this question, you need to look at the forecast charts.
Looking Deeper — Tutorial 2 3-17
Tutorial 2 — Vision Research
Crystal Ball windows are separate from Excel windows. If
Crystal Ball’s windows or charts disappear from your screen, they are
usually simply behind the main Excel window. To bring them to the
front, click the Crystal Ball icon in the Windows taskbar or press
Alt-Tab and choose Crystal Ball.
Note:
To display forecast charts in Excel 2007, choose Analyze > View Charts
> Forecast Charts.
3.1.7.1 Review the net profit forecast chart
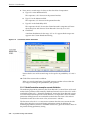
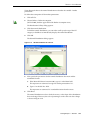
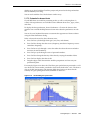
Forecast charts are frequency distributions. They show the number or frequency of
values occurring in a given bin or group interval and show how the frequencies are
distributed. In Figure 3–19, the bin that contains the most values has a frequency of
about 280.
Figure 3–19
The Net Profit forecast
Crystal Ball forecasts the entire range of results for the Vision Research project.
However, the forecast charts don’t display the most extreme values (outliers). Here,
the display range includes values from approximately –$15 million to $38 million.
The forecast chart also shows the certainty range for the forecast. By default, the
certainty range includes all values from negative infinity to positive infinity.
Crystal Ball compares the number of values in the certainty range with the number of
values in the entire range to calculate the certainty level.
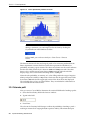
The example above shows a certainty level of 100%, since the initial certainty range
includes all possible values. Remember that the certainty level is an approximation,
since a simulation can only approximate the elements of the real world.
3-18 Crystal Ball Getting Started Guide
Tutorial 2 — Vision Research
3.1.7.2 Determine the net profit certainty level
The Vision Research president wants to know how certain Vision Research can be of
achieving a profit and what are the chances of a loss.
To determine the certainty level of a specific value range:
1.
In the Net Profit forecast chart, type 0 in the certainty range minimum field.
2.
Press Enter.
Crystal Ball moves the left certainty grabber to the break-even value of $0.0 and
recalculates the certainty level.
Figure 3–20
Net Profit forecast—$0 minimum
Analyzing the Net Profit forecast chart again, you can see that the value range between
the certainty grabbers shows a certainty level of about 79%. That means that Vision
Research can be 79% certain of achieving a net profit. You can therefore calculate a 21%
chance of suffering a net loss (100% minus 79%).
Now, the president of Vision Research would like to know the certainty of achieving a
minimum profit of $2,000,000. With Crystal Ball, you can easily answer this question.
1.
Type 2 in the certainty range minimum field.
2.
Press Enter.
As Figure 3–21 shows, Crystal Ball moves the left certainty grabber to $2.0 and
recalculates the certainty level.
Looking Deeper — Tutorial 2 3-19
Tutorial 2 — Vision Research
Figure 3–21
Recalculated certainty level
Vision Research can be about 72% certain of achieving a minimum net profit of
$2,000,000.
Vision Research is very encouraged by the forecast result. The president now wants to
know how certain Vision Research can be of achieving a minimum net profit of
$4,000,000. If Crystal Ball shows that Vision Research can be at least two-thirds certain
of a $4,000,000 net profit, the president is ready to go ahead with the ClearView
project.
Again, Crystal Ball can easily answer this question:
1.
Type 4 in the range minimum field.
2.
Press Enter.
Crystal Ball moves the left certainty grabber to $4.0 and recalculates the certainty
level.
Figure 3–22
Net Profit forecast—$4.0 million minimum
The Net Profit forecast chart in Figure 3–22 shows a certainty level of almost 66%. With
virtually two-thirds certainty of a minimum net profit of $4,000,000, Vision Research
3-20 Crystal Ball Getting Started Guide
Tutorial 2 — Vision Research
decides to go ahead with the ClearView project and proceed to develop and market
this revolutionary new drug.
You can work with the Gross Profit chart in similar ways.
3.1.7.3 Customize the forecast charts
Crystal Ball charts are useful for presenting results as well as analyzing them. A
variety of chart preferences are available to show different chart views, types, colors,
and more.
To display the chart preferences, choose Preferences > Chart in the forecast chart
window. You can click the Help button to learn more about the preferences on each
tab.
You can also use keyboard shortcuts to customize the appearance of charts without
using the Chart Preferences dialog.
Select a forecast chart and try these shortcuts now:
■
■
■
Press Ctrl-t to cycle through chart types (area, line, and column).
Press Ctrl-d to change the chart views (frequency, cumulative frequency, reverse
cumulative frequency).
Press Ctrl-m to cycle through a series of markers that show the mean and other
measures of central tendency.
■
Press Ctrl-p to cycle through a series of percentile markers.
■
Press Ctrl-b to change the density of the chart by varying the number of bins.
■
Press Ctrl-3 to display the chart in 3D.
■
Drag the edges of the chart window until the proportions and size suit your
presentation plans.
For example, Figure 3–23 shows the ClearView gross profit forecast presented as a 3-D
area chart with a mean marker, stretched to show more detail in the x-axis. The chart is
also set for 50% transparency. The certainty fields have been set to show that the
certainty of a gross profit greater than $32 million is about 78%.
Figure 3–23
Customized gross profit chart
Looking Deeper — Tutorial 2 3-21
Learning more
You can choose Edit > Copy Chart in the chart menubar to copy a chart to the
clipboard for pasting into Excel or another application. Figure 3–24 shows the
ClearView gross profit chart pasted into a Microsoft PowerPoint slide.
Figure 3–24
Gross profit chart pasted into PowerPoint
3.1.8 Close Crystal Ball
To close Crystal Ball, exit Excel.
3.1.9 Summary
In this tutorial, you started Crystal Ball, opened the tutorial example model, defined
assumptions and forecasts, ran the simulation, and reviewed and customized forecast
charts. By experimenting with certainty values, you explored a few questions that
Vision Research executives might ask as they analyzed the results of the simulation.
3.2 Learning more
As you read through the Crystal Ball User Manual, you will learn more about
customizing forecast charts, creating other kinds of charts, interpreting the descriptive
statistics, and printing comprehensive reports for any simulation. Crystal Ball provides
these features so that you can quantify the risk inherent in your assumptions.
Crystal Ball keeps your assumption and forecast definitions (but not the forecast
values) with the spreadsheet. When you save your spreadsheet, the definitions are
saved with it. To learn about saving and restoring forecast results, see the Crystal Ball
User Manual.
3-22 Crystal Ball Getting Started Guide
4
Looking Beyond
4
In this chapter:
■
Other charts and analysis tools
■
Process capability features
■
Other Crystal Ball tools
■
Trend analysis with CB Predictor
■
Optimizing decision variable values with OptQuest
Chapters 1 and 2 show how you can define and run models within Crystal Ball to
forecast results with varying degrees of certainty. While these basic simulations are
powerful, you can use Crystal Ball’s other charts and tools to greatly enhance the
depth, breadth, and accuracy of your forecasts.
4.1 Other charts and analysis tools
The tutorials earlier in this Guide illustrate the use of assumption charts for input cell
definition and forecast charts for output (results) interpretation.
While these basic charts provide much information, Crystal Ball offers several other
types of charts and reports. These graphical analysis tools are all accessed through the
Analyze menu. They are discussed in Chapters 5 and 6 of the Crystal Ball User Manual.
4.1.1 Overlay charts
After completing a simulation with multiple related forecasts, you can create an
overlay chart to view the frequency data from selected forecasts in one location. Then,
you can compare differences or similarities that otherwise might not be apparent. You
can customize the overlay chart to accentuate these characteristics. You can also use
the overlay chart to fit standard distributions to forecasts.
The chart in Figure 4–1 shows reliabilities of three kinds of manufacturing material
with lines of best fit for each type of distribution.
Looking Beyond 4-1
Other charts and analysis tools
Figure 4–1
Overlay chart with forecasts and lines of best fit
4.1.2 Trend charts
After completing a simulation with multiple related forecasts, you can create a trend
chart to view the certainty ranges of all the forecasts on a single chart. The ranges
appear as a series of patterned bands. Each band represents the certainty range into
which the actual values of your forecasts fall. For example, the band which represents
the 90% certainty range shows the range of values into which your forecast has a 90%
chance of falling.
The chart in Figure 4–2 shows increases in sales over time.
Figure 4–2
Upward trending sales figures, by quarter
If you have cyclical or seasonal time-series data, you can use CB Predictor for data
trend analysis. For more information, see Section 4.4, "Trend analysis with CB
Predictor".
4-2 Crystal Ball Getting Started Guide
Other charts and analysis tools
4.1.3 Sensitivity charts
Sensitivity charts show the influence each assumption cell has on a particular forecast
cell. During a simulation, Crystal Ball ranks the assumptions according to their
correlation (or sensitivity) to each forecast cell. The sensitivity chart displays these
rankings as a bar chart, indicating which assumptions are the most or least important
in the model. You can print the sensitivity chart or copy it to the clipboard.
The chart in the following figure shows the effects of several assumptions on
forecasted net profits for the pharmaceutical company discussed in "Tutorial 2 —
Vision Research". Market penetration accounts for about 84% of variation of net profits
for a new product under consideration.
Figure 4–3
Effects of assumptions on net profit
The Tornado Chart tool provides alternate ways to measure and chart sensitivity. For
more information, see Section 4.2.7, "Tornado Chart".
4.1.4 Scatter charts
Scatter charts show correlations, dependencies, and other relationships between pairs
of forecasts and assumptions plotted against each other. You can plot scatter charts
directly through the Analyze menu, or you can create a sensitivity chart and choose
Sensitivity > Open Scatter Chart to create a chart showing how the assumptions with
the greatest impact relate to the target forecast.
In its basic form, a scatter chart contains one or more plots of a target variable mapped
against a set of secondary variables. Each plot appears as a cloud of points or symbols
aligned in a grid within the scatter chart window. Optional correlation coefficients
indicate the strength of the relationship.
Looking Beyond 4-3
Other charts and analysis tools
Figure 4–4
Scatter chart with correlations displayed
In another form of scatter chart, called the Matrix view, each selected variable is
plotted against the other selected variables to show the relationships among them, as
shown in Figure 4–5.
Figure 4–5
Scatter chart in Matrix view
4.1.5 OptQuest charts
OptQuest, an optional Crystal Ball product described in “Optimizing decision
variable values with OptQuest” on page 4-8, lets you optimize certain forecast
statistics or process capability metrics using variable inputs provided by Crystal Ball
decision variables. Optimization results are displayed in OptQuest charts. For
descriptions and illustrations, see “Using OptQuest charts” on page C-28.
4-4 Crystal Ball Getting Started Guide
Other charts and analysis tools
4.1.6 Reports
Crystal Ball has powerful reporting capabilities. You can customize reports to include
the following charts and data:
■
Assumption, forecast, overlay, trend, and sensitivity charts
■
Forecast summaries, statistics, percentiles, and frequency counts
■
Assumption parameters
■
Decision variables
Reports are created as Excel workbooks. You can modify, print, or save the report in
the same way as any other workbook.
Figure 4–6 shows part of a forecast report for the Vision Research model.
Figure 4–6
Sample forecast report
4.1.7 Extracting and pasting data
You can select Analyze > Extract Data to extract forecast information generated by a
simulation and place it in a new Excel workbook. You can extract these types of data:
statistics, percentiles, chart bins, sensitivity data, and trial values.
Figure 4–7 shows statistics data extracted from a sales spreadsheet.
Looking Beyond 4-5
Other Crystal Ball tools
Figure 4–7
Extracted statistics data
4.2 Other Crystal Ball tools
The Run menu offers a variety of special tools for analyzing your data and displaying
results in more detail. Select Run > Tools to choose from among the following: Batch
Fit, Bootstrap, Correlation Matrix, Decision Table, Scenario Analysis, Tornado Chart,
and 2D Simulation. The Strategic Finance Setup tool and Compare Run Modes tool are
optional, depending on the exact features included in your Crystal Ball license.
All of these except the Strategic Finance Setup tool are discussed in the Crystal Ball
User Manual.
(In Excel 2007, CB Predictor and OptQuest are also available through Run > Tools. See
Section 4.4, "Trend analysis with CB Predictor" and “Optimizing decision variable
values with OptQuest” on page 4-8 for a description of these tools.)
4.2.1 Batch Fit
The Batch Fit tool fits probability distributions to multiple data series. It helps you
create assumptions when you have historical data for several variables. Inputs are
rows or columns of data. Outputs include fitted assumptions (probability
distributions), tables of goodness-of-fit statistics and correlation coefficients calculated
from the data series.
4.2.2 Bootstrap
The Bootstrap tool estimates the reliability or accuracy of statistics or percentiles for
forecasts or other sample data. This tool doesn’t assume that the statistics or
percentiles are normally distributed. The main input is the forecast to be analyzed.
Outputs are a forecast chart of the distributions for each statistic or percentile.
4.2.3 Correlation Matrix
The Correlation Matrix tool defines a matrix of correlations between assumptions to
more accurately model the interdependencies between variables. Inputs are the
assumptions to correlate. The output is a correlation matrix, loaded into the model.
4.2.4 Data Analysis
The Data Analysis tool imports data directly into Crystal Ball forecasts for analysis in
Crystal Ball.
4-6 Crystal Ball Getting Started Guide
Process capability features
4.2.5 Decision Table
Decision variables are values you can control, such as such as how much to charge for
a product or how many wells to drill. The Decision Table tool runs multiple
simulations to test different values for one or two decision variables. Inputs are the
decision variables you want to test. The output is a table of results you can analyze
further using forecast, trend, or overlay charts.
If you want to optimize decision variable values to reach a specific objective and you
have OptQuest, you can use it to find solutions. For more information, see Section 4.5,
"Optimizing decision variable values with OptQuest".
4.2.6 Scenario Analysis
The Scenario Analysis tool runs a simulation and then matches all of the resulting
values of a target forecast with the corresponding assumption values. Then, you can
see which combination of assumption values gives a particular result. The input is the
forecast to be analyzed. The output is a table of all the forecast values matched with
the corresponding value of each assumption.
4.2.7 Tornado Chart
The Tornado Chart tool measures the input of each model variable one at a time,
independently, on a target forecast. The inputs are the target forecast and the
assumptions, decision variables, and precedent cells to test against. The output is a
tornado chart, which shows the sensitivity of the variables using range bars, or a
spider chart, which shows the sensitivity of the variables using sloping lines.
4.2.8 2D Simulation
The 2D Simulation tool helps determine how much of the variation within a model is
caused by uncertainty and how much by true variability. The inputs are the target
forecast and the assumptions to analyze. The output is a table which includes the
forecast means, the uncertainty assumption values, and the statistics, including
percentiles, of the forecast distribution for each simulation. Results are also graphed on
an overlay chart and a trend chart.
4.2.9 Strategic Finance Setup
The optional Strategic Finance Setup tool lets you create a workbook of Strategic
Finance information that can then be analyzed with Crystal Ball. This tool is only
available to you if you have Oracle’s Strategic Finance tool and an appropriate Crystal
Ball license. It is described in the Strategic Finance documentation and a help file that
is available once you start the tool.
4.2.10 Compare Run Modes
If Crystal Ball’s Extreme Speed feature is available to you, you can use the Compare
Run Modes tool to compares simulation run time in Normal and Extreme speed. For
more information about this tool, see the Extreme Speed appendix in the Crystal Ball
User Manual.
4.3 Process capability features
If you use Six Sigma or other quality methodologies, Crystal Ball’s process capability
features can help you improve quality in your organization. For a brief description of
Looking Beyond 4-7
Trend analysis with CB Predictor
these features and how to use them, see Section C.9. The Crystal Ball Process Capability
Guide tells more about how to use them with instructions and examples.
4.4 Trend analysis with CB Predictor
You can use CB Predictor to project trends based on time-series data, such as seasonal
trends.
For example, you can look at home heating fuel sales for previous years and estimate
sales for the current year. You can also run regression analysis on related time-series
data.
For more information about CB Predictor, see the CB Predictor User Manual.
4.5 Optimizing decision variable values with OptQuest
Decision variables are variables you can control, such as product pricing or investment
levels. If you have OptQuest, an optional Crystal Ball product, you can use it to find
the best values for the decision variables to obtain the desired outcomes.
For example, you can find the optimal investment mix that maximizes the probability
of a portfolio’s return being above a certain threshold.
For more information about OptQuest, see the OptQuest User Manual.
4-8 Crystal Ball Getting Started Guide
A
Toolbar and Menu Commands: Excel 2003 or
earlier
A
In this appendix:
■
The Crystal Ball toolbar
■
Crystal Ball menus
■
Shortcut key combinations in Excel 2003 or earlier
■
Distribution gallery hot keys
■
Chart preference hot keys
This appendix describes the Crystal Ball toolbar and associated menu commands for
Crystal Ball used with Excel 2003 or earlier supported versions.
The information in this appendix is for those using Crystal Ball
with Excel 2003 or earlier. If you are using Crystal Ball with Excel
2007, see Appendix B, "Using Crystal Ball in Excel 2007" instead.
Note:
A.1 The Crystal Ball toolbar
As you point to each of the Crystal Ball toolbar buttons, a tool tip identifies it, as
shown in Figure A–1.
Figure A–1
The Crystal Ball toolbar
A.2 Crystal Ball menus
When Crystal Ball is open in Excel, the following special menus are added to the
standard Excel menus:
■
Define menu — lets you define and select assumptions, decision variables, and
forecasts; freezes assumptions, decision variables, and forecasts so they aren’t
included in simulations; also lets you copy, paste and clear assumptions, decision
variables, and forecasts as well as set cell preferences.
Toolbar and Menu Commands: Excel 2003 or earlier A-1
Shortcut key combinations in Excel 2003 or earlier
■
■
■
Run menu — starts, stops, continues, and resets simulations; runs simulations a
step at a time; if available, starts OptQuest or CB Predictor; opens the Crystal Ball
tools: Batch Fit, Correlation Matrix, Tornado Chart, Bootstrap, Decision Table,
Scenario Analysis, 2D Simulation; saves and restores simulation results; and sets
run preferences.
Analyze menu — creates and opens charts and reports; cascades and closes
windows; and extracts data.
Help > Crystal Ball menu — Opens online help for Crystal Ball; displays the
following items: the About Box for Crystal Ball, Crystal Ball user manuals and
other documentation in Adobe Acrobat format, Crystal Ball examples, the Crystal
Ball Welcome Screen, and lets you access Crystal Ball licensing features.
For more information on each command, see the tables later in this appendix or view
Help from within Crystal Ball using the Help menu or icon.
A.2.1 Distribution Gallery menus
The Distribution Gallery has the following menus:
■
■
■
■
Edit menu — lets you copy, paste, modify, and delete, and print distributions.
View menu — determines how distributions appear in the right pane of the
Distribution Gallery and shows or hides the Description pane.
Categories menu — lets you create, modify, delete, reorder, and share distribution
categories.
Help menu — displays help for the Distribution Gallery or the active distribution.
A.3 Shortcut key combinations in Excel 2003 or earlier
Use the following Alt-key combinations in Excel 2003 or earlier supported versions of
Excel to execute Crystal Ball’s Define, Run, Analyze, and Help menu commands and
chart windows commands without using the mouse. For shortcut keys in Excel 2007,
see on page B-3.
We try to avoid keyboard shortcut conflicts; if a key
combination is the same as one on an Excel menu, you can use the
down arrow key to access the command you want.
Note:
Commands are listed in the same order they appear in menus.
Table A–1
Button
Define menu commands
Command
Command Action
Keystrokes
Define Assumption
Opens the Define Assumption dialog to define a Crystal Ball
assumption cell
Alt-n, a
Define Decision
Opens the Define Decision Variable dialog to define a Crystal
Ball decision variable cell
Alt-n, d
Define Forecast
Opens the Define Forecast dialog to define a Crystal Ball
forecast cell
Alt-n, f
Select All Assumptions Selects all assumption cells on the active worksheet
A-2 Crystal Ball Getting Started Guide
Alt-n, m
Shortcut key combinations in Excel 2003 or earlier
Table A–1
Define menu commands (Cont.)
Button
Table A–2
Command
Command Action
Keystrokes
Select All Decisions
Selects all decision variable cells on the active worksheet
Alt-n, i
Select All Forecasts
Selects all forecast cells on the active worksheet
Alt-n, r
Select
Selects specified Crystal Ball data cells
Alt-n, s
Freeze
Excludes specified Crystal Ball data cells from a simulation
Alt-n, z
Copy Data
Copies Crystal Ball cell definitions to specified cells
Alt-n, c
Paste Data
Pastes copied Crystal Ball cell definitions into specified cells
Alt-n, p
Clear Data
Removes Crystal Ball cell definitions from specified cells
Alt-n, e
Cell Preferences
Opens the Cell Preferences dialog
Alt-n, l
Run menu commands
Button
Command
Command Action
Keystrokes
Start Simulation
Begins running a Crystal Ball simulation
Alt-r, s
Continue Simulation
Resumes a stopped simulation
Alt-r, c
Reset Simulation
Clears generated simulation data (Crystal Ball data cells
remain defined)
Alt-r, r
Stop Simulation
Stops a simulation
Alt-r, s
Single Step
Steps through a simulation one trial at a time
Alt-r, i
OptQuest
Starts OptQuest for results optimization (if available)
Alt-r, o
CB Predictor
Starts CB Predictor for time series analysis
Alt-r, p
Tools
Offers the CB Tools for additional analysis and charting
Alt-r, t
Batch Fit (tool)
Automatically fits selected continuous probability
distributions to multiple data series
Alt-r, t, f
Bootstrap (tool)
Addresses the reliability and accuracy of forecast statistics
Alt-r, t, b
Correlation Matrix
(tool)
Rapidly defines and automates correlations of assumptions
Alt-r, t, c
Data Analysis (tool)
Loads data from spreadsheets directly into Crystal Ball
forecast charts
Alt-r, t, y
Decision Table (tool)
Evaluates the effects of alternate decisions in a simulation
model
Alt-r, t, d
Toolbar and Menu Commands: Excel 2003 or earlier A-3
Shortcut key combinations in Excel 2003 or earlier
Table A–2
Button
Run menu commands (Cont.)
Command
Command Action
Scenario Analysis (tool) Displays what inputs created particular outputs
Table A–3
Button
Keystrokes
Alt-r, t, s
Tornado Chart (tool)
Individually analyzes the impact of each model variable on a Alt-r, t, t
target outcome
2D Simulation (tool)
Independently addresses uncertainty and variability using a
two-dimensional simulation
Alt-r, t, 2
Strategic Finance Setup
(tool)
If available, opens the Strategic Finance Setup wizard for
setting up a workbook that allows Crystal Ball to run with
Strategic Finance data
Alt-r, t, e
Compare Run Modes
(tool)
Compares simulation run time in Normal and Extreme speed Alt-r, t, r
Save Results
Saves current simulation results for later display and
analysis
Alt-r, v
Restore Results
Restores saved results files for display and analysis
Alt-r, e
Run Preferences
Opens the Run Preferences dialog for setting trials, sampling, Alt-r, u
and other run preferences
Analyze menu commands
Command
Command Action
Keystrokes
Assumption Charts
Opens the Assumption Charts dialog so you can display or
manage assumption charts
Alt-a, a
Forecast Charts
Opens the Forecast Charts dialog so you can display or
manage forecast charts
Alt-a, f
Overlay Charts
Opens the Overlay Charts dialog so you can display existing
or create new overlay charts
Alt-a, o
Trend Charts
Opens the Trend Charts dialog so you can display existing or
create new trend charts
Alt-a, t
Sensitivity Charts
Opens the Sensitivity Charts dialog so you can display
existing or create new sensitivity charts
Alt-a, s
Scatter Charts
Opens the Scatter Charts dialog so you can display existing
or create new scatter charts
Alt-a, s
OptQuest Charts
If OptQuest is available, displays OptQuest charts following
an optimization
Alt-a, q
Open Selected Cells
Opens associated charts for selected cells
Alt-a, n
Cascade
Arranges open charts for easier viewing
Alt-a, c
Close All
Closes all open charts
Alt-a, l
Create Report
Opens the Create Report dialog so you can create a report
with data and charts for your simulation and results
Alt-a, r
Extract Data
Copies selected simulation data to a worksheet for additional Alt-a, d
analysis
A-4 Crystal Ball Getting Started Guide
Shortcut key combinations in Excel 2003 or earlier
Table A–4
Help menu commands
Button
Command
Command Action
Keystrokes
To display the Help menu, choose Alt-h, c, c and press Enter, then choose the listed key.
About Crystal Ball
Offers version and other information about the current Crystal b
Ball release including the username
Crystal Ball Help
Displays online help for Crystal Ball
c
User Manuals
Displays a list of available online documentation for Crystal
Ball
m
Examples Guide
Displays a list of available example models so you can load
your choice into Crystal Ball
e
Welcome Screen
Displays a Welcome screen that lets you automatically activate w
the process capability features for quality programs such as
Six Sigma or set percentile preferences frequently used in the
oil and gas industry
Licensing
Displays the Activate a License dialog so you can enter a serial l
number and activate a Crystal Ball license
Technical Support
Opens the Crystal Ball Web page,
www.oracle.com/crystalball
t
Send Feedback
Opens an email so you can send comments and product
feedback to the Crystal Ball team
s
Table A–5
General chart menu commands
Command
Command Action
Keystrokes
Bring Crystal Ball to front
A Microsoft Windows shortcut for switching between
applications
Alt-Tab >
Crystal Ball
Edit > Copy Chart
Copies the active Crystal Ball chart to the clipboard
Alt-e, c
Edit > Page Setup
Defines margins, paper size, orientation, and other layout
information for printing
Alt-e, u
Edit > Print Preview
Displays the active chart as it will print with the current
Page Setup settings
Alt-e, v
Edit > Print
Prints the current chart to the specified printer or file
Alt-e, p
View > Frequency
If available, sets the current chart to show the number or
frequency of values occurring in a given interval (bin)
Alt-v, f
View > Cumulative [Frequency]
If available, sets the current chart to show the number or
proportion (percentage) of values less than or equal to a
given amount
Alt-v, c
View > Reverse Cumulative
[Frequency]
If available, sets the current chart to show the number or
proportion (percentage) of values greater than or equal to a
given amount
Alt-v, r
View > Statistics
If available, sets the current chart to show a set of
descriptive statistics for charted values
Alt-v, s
View > Percentiles
If available, sets the current chart to show percentile
information, in 10% increments
Alt-v, p
View > Goodness Of Fit
If available, sets the current chart to show goodness-of-fit
statistics for all fitted distributions
Alt-v, g
Toolbar and Menu Commands: Excel 2003 or earlier A-5
Shortcut key combinations in Excel 2003 or earlier
Table A–5
General chart menu commands (Cont.)
Command
Command Action
Keystrokes
View > Capability Metrics
If available, sets the current forecast chart to show a set of
process capability metrics based on the specification limit(s)
set for that forecast
Alt-v, a
View > Split View
If available, sets the current chart to show data, such as
statistics, beside the associated chart
Alt-v, l
Preferences > Chart Preferences
Open the Chart Preferences dialog for changing chart
appearance settings
Alt-p, c
Table A–6
Assumption-specific chart menu commands
Command
Command Action
Keystrokes
Edit > Add To Gallery
Adds the active assumption to the Distribution Gallery in the
specified category
Parameters > Show Cell
References
Shows cell references instead of values when cell references are
entered into parameter fields
Preferences > Assumption
Opens the Assumption Preferences dialog for choosing a view and
controlling chart display
Alt-p, a
Help > Assumption Help
Displays online help about assumptions
Alt-h, a
Table A–7
Alt-e, a
Forecast-specific chart menu commands
Command
Command Action
Keystrokes
Forecast > Open
Sensitivity Chart
Creates or displays a sensitivity chart for the active forecast
Alt-f, s
Forecast > Fit Probability
Distribution
Uses the default or currently selected distributions and ranking
method to fit a distribution to the active forecast chart
Alt-f, f
Preferences > Forecast
Opens the Forecast Preferences dialog for controlling chart display,
distribution fitting specifications, and more
Alt-p, f
Help > Forecast Help
Displays online help about the forecast chart
Alt-h, f
Table A–8
Overlay-specific chart menu commands
Command
Command Action
Keystrokes
Overlay > Choose Forecasts
Displays the Choose Forecasts dialog to add or remove forecasts Alt-o, c
from the active overlay chart
Overlay > Remove All
Removes all forecasts from the active overlay chart
Alt-o, r
Overlay > Fit Probability
Distribution
Uses the default or currently selected distributions and ranking
method to fit a distribution to all forecasts on the active overlay
chart
Alt-o, f
Preferences > Overlay
Opens the Overlay Preferences dialog for controlling chart
display and distribution fitting specifications
Alt-p, o
Help > Overlay Help
Displays online help about the overlay chart
Alt-h, o
A-6 Crystal Ball Getting Started Guide
Shortcut key combinations in Excel 2003 or earlier
Table A–9
Sensitivity-specific chart menu commands
Command
Command Action
Keystrokes
View > Contribution To
Variance Chart
Displays the sensitivity chart in terms of percentage of variance
contributed by each assumption
Alt-v, c
View > Rank Correlation
Chart
Displays the sensitivity chart in terms of rank correlation of the
assumptions in their effect on the forecast
Alt-v, r
View > Sensitivity Data
Displays contribution to variance and rank correlation sensitivity
measures for each assumption
Alt-v, s
Sensitivity > Choose
Target Forecast
Opens the Choose Forecast dialog so you can choose a forecast for
sensitivity analysis
Alt-s, t
Sensitivity > All
Assumptions
Uses all assumptions in creating the sensitivity chart
Alt-s, a
Sensitivity > Choose
Assumptions
Displays the Choose Assumptions dialog so you can choose one or
more assumptions for the sensitivity chart
Alt-s, c
Sensitivity > Open Scatter Opens a scatter chart using the current target forecast and assumptions Alt-s, s
Chart
Preferences > Sensitivity
Opens the Sensitivity Preferences dialog for choosing a view,
controlling chart display, and more
Alt-p, s
Help > Sensitivity Help
Displays online help about the sensitivity chart
Alt-h, s
Table A–10
Trend-specific chart menu commands
Command
Command Action
Keystrokes
View > Centered On
Median
Displays certainty bands centered on the median of each forecast value Alt-v, m
View > Cumulative
Displays certainty bands anchored at the lower end of the forecast
Alt-v, c
range; shows the certainty that the forecast values will be at or below a
given value
View > Reverse
Cumulative
Displays certainty bands anchored at the higher end of the forecast
Alt-v, r
range; shows the certainty that the forecast values will be at or above a
given value
Trend > Choose Forecasts Opens the Choose Forecasts dialog so you can choose forecasts to use
in the trend chart
Alt-t, f
Trend > Remove All
Removes all forecasts from the active trend chart
Alt-t, r
Preferences > Trend
Opens the Trend Preferences dialog for choosing a view and
controlling chart display
Alt-p, t
Help > Trend Help
Displays online help about the trend chart
Alt-h, t
Table A–11
Scatter-specific chart menu commands
Command
Command Action
Keystrokes
View > Scatter View
(1xN)
Plots selected assumptions and/or forecasts against a target
assumption or forecast
Alt-v, s
View > Matrix View
(NxN)
Plots selected assumptions and/or forecasts against each other
Alt-v, m
Scatter > Choose Data
Opens the Choose Data dialog so you can choose assumptions and
forecasts to use in the scatter chart
Alt-s, d
Toolbar and Menu Commands: Excel 2003 or earlier A-7
Distribution gallery hot keys
Table A–11
Scatter-specific chart menu commands (Cont.)
Command
Command Action
Keystrokes
Scatter > Remove All
Removes all assumptions and forecasts from the active scatter chart
Alt-s, r
Preferences > Scatter
Opens the Scatter Preferences dialog for choosing a view and
controlling chart display
Alt-p, s
Help > Scatter Help
Displays online help about the scatter chart
Alt-h, t
A.4 Distribution gallery hot keys
In Excel 2007, if you click the upper half of the Define
Assumption icon, or if the assumption has already been defined, the
Distribution Gallery appears. If you click the lower half of the icon, a
list of All, Basic, or Favorite distributions appears, depending on the
active category in the Distribution Gallery.
Note:
You can use the keyboard to select distributions in the Distribution Gallery. To do this:
1.
Choose Define > Define Assumption or click the Define Assumption button to
open the Distribution Gallery.
2.
Type the first letter of the name of the target distribution, for example n for
normal.
If more than one distribution starts with that letter, keep pressing to cycle through
the distributions.
3.
When the target distribution is highlighted, type Alt-o (for OK) to open its Define
Assumption dialog.
Or, you can press Alt-f to fit a distribution to it or Alt-c to cancel the selection and
close the dialog.
To apply a shortcut key to a custom category:
1.
Open the Crystal Ball Gallery.
2.
Edit the category name:
For a new category, select Categories > New. In the Name field, enter an
ampersand (&) before a letter in your category name. That letter becomes the
shortcut key. Click on OK to save.
For an existing category, select Categories > Properties, add the ampersand to the
existing name, and click on OK to save.
Each category should use a unique shortcut key. The shortcut keys for the default
categories are: Alt-b for the Basic category, Alt-a for All, and Alt-i for Favorites.
A.5 Chart preference hot keys
Double-clicking in a chart area opens the Chart Preferences dialog.
Table A–12 lists key combinations that can be used to cycle through settings available
in the Chart Preferences dialog. Most of these commands work on the primary
distribution — the theoretical probability distribution for assumptions, and the
generated values for forecasts and overlay charts.
A-8 Crystal Ball Getting Started Guide
Chart preference hot keys
Table A–12
Hot keys for chart preferences
Hot key
Command Equivalent
Description
Ctrl-d
View menu; Preferences > chartname >
chartname Window > View
Cycles through chart views — Frequency, Cumulative
Frequency, Reverse Cumulative Frequency (for
assumption and forecast charts)
Ctrl-b; Ctrl-g
Preferences > Chart > General >
Density
Cycles through bins or group interval values to adjust the
number of data bins used to create the chart
Ctrl-l
Preferences > Chart > General >
Gridlines
Cycles through gridline settings: None, Horizontal,
Vertical, Both
Ctrl-t
Preferences > Chart > Chart Type >
Type
Cycles through chart types: Area, Line, Column; for
sensitivity charts: Bar (direction), Bar (magnitude), Pie (in
Contribution To Variance view)
Ctrl-3
Preferences > Chart > General > 3D
Chart
Cycles between two-dimensional and three-dimensional
chart display
Ctrl-m
Preferences > Chart > Chart Type >
Marker Lines
Cycles through central tendency marker lines: None,
Mean, Median, Mode (except for sensitivity and trend
charts)
Ctrl-n
Preferences > Chart > General >
Legend
Toggles the legend display on and off
Ctrl-p
Preferences > Chart > Chart Type >
Marker Lines > Percentiles
Cycles through percentile markers: None, 10%,
20%,…90%
Spacebar
View menu; Preferences > chartname >
chartname Window > View
Cycles through window views when Excel is not in Edit
mode: Chart, Statistics, Percentiles, Goodness Of Fit (if
distribution fitting is selected — except for trend charts),
and Capability Metrics (if process capability features are
activated)
Toolbar and Menu Commands: Excel 2003 or earlier A-9
Chart preference hot keys
A-10 Crystal Ball Getting Started Guide
B
Using Crystal Ball in Excel 2007
B
In this appendix:
■
The Crystal Ball ribbon in Excel 2007
■
Shortcut key combinations in Excel 2007
■
Chart preference hot keys
■
Compatibility and file conversion issues
This appendix describes the Crystal Ball ribbon for those who
are using Crystal Ball with Excel 2007. If you are using an earlier
version of Excel, see Appendix A, "Toolbar and Menu Commands:
Excel 2003 or earlier" instead.
Note:
It also contains important information about using Crystal Ball models
created in earlier versions of Excel with Excel 2007 or the Excel 2007
Compatibility Pack.
B.1 The Crystal Ball ribbon in Excel 2007
Appendix A, "Toolbar and Menu Commands: Excel 2003 or earlier" describes the
Crystal Ball toolbar and menus in Excel 2003 and earlier versions of Excel. While
Crystal Ball’s functionality is the same in Excel 2007, the command structure or
interface is different.
In earlier versions of Excel, including Excel 2003, Crystal Ball adds three menus to the
Excel menubar. Many menu commands are also accessible through icons on the
Crystal Ball toolbar. In Excel 2007, there is a single Crystal Ball ribbon that contains all
the commands. The ribbon is a combination menubar and toolbar. It contains both
menus and tool icons. Figure B–1 shows the Crystal Ball ribbon in Excel 2007.
Figure B–1
The Crystal Ball ribbon in Excel 2007
Using Crystal Ball in Excel 2007 B-1
The Crystal Ball ribbon in Excel 2007
The Crystal Ball ribbon contains these groups:
■
Define
■
Run
■
Analyze
■
Help
The following sections describe each group.
B.1.1 Define
The Define commands let you define the three types of Crystal Ball data cells:
assumptions, decision variables, and forecasts. These commands are discussed in
Section C.2, "Defining Crystal Ball models".
You can also:
■
Set cell preferences (Section C.2.4, "Setting cell preferences")
■
Select Crystal Ball data cells (Section C.2.5, "Selecting Crystal Ball data")
■
■
Copy, paste, and clear Crystal Ball data (Section C.2.6, "Copying, pasting, and
clearing Crystal Ball data")
Freeze data cells to exclude them from Crystal Ball simulations (Section C.3.2,
"Freezing cells during simulation runs")
B.1.2 Run
You can use the basic Run commands to start, stop, continue, reset, and single-step
through Crystal Ball simulations. They are described in Section C.3, "Running
simulations". Other Run commands let you:
■
■
■
Access the Crystal Ball tools, CB Predictor, and OptQuest with an appropriate
license (Section C.6, "Using the Crystal Ball tools").
Save or restore Crystal Ball simulation results (Section C.3.4, "Saving and restoring
Crystal Ball results").
Set run preferences, which control the number of trials, the sampling method, and
other simulation options (C.3.1 , "Setting run preferences").
B.1.3 Analyze
The Analyze commands let you:
■
Create and view Crystal Ball charts (Section C.4, "Analyzing simulation results").
■
Create reports (Section C.5.1, "Creating reports")
■
Extract data for external use (Section C.5.2, "Extracting data")
B.1.4 Help
The Help commands let you view online help, online documents, example models, the
Crystal Ball About Box, and more (Table B–4, "Help commands").
B-2 Crystal Ball Getting Started Guide
Shortcut key combinations in Excel 2007
B.2 Shortcut key combinations in Excel 2007
Use the following Alt-key combinations in Excel 2007 or earlier to execute the Define,
Run, Analyze, and Help commands in the Crystal Ball ribbon without using the
mouse. For shortcut keys in Excel 2003, see Section A.3, "Shortcut key combinations in
Excel 2003 or earlier".
We try to avoid keyboard shortcut conflicts; if a key
combination is the same as one on an Excel menu, you can use the
down arrow key to access the command you want.
Note:
Table B–1
Define commands
Button
Command
Command Action
Keystrokes
Define Assumption
Opens the Define Assumption dialog to define a Crystal Ball
assumption cell
Alt-c, a
Define Decision
Opens the Define Decision Variable dialog to define a Crystal Alt-c, d
Ball decision variable cell
Define Forecast
Opens the Define Forecast dialog to define a Crystal Ball
forecast cell
Alt-c, f
Copy
Copies Crystal Ball cell definitions to specified cells
Alt-c, c
Paste
Pastes copied Crystal Ball cell definitions into specified cells
Alt-c, p
Clear
Removes Crystal Ball cell definitions from specified cells
Alt-c, e
Select
Offers the Select menu, to select assumption, decision
variable, and forecast cells
Alt-c, l
Select All Assumptions Selects all assumption cells on the active worksheet
Alt-c, l, a
Select All Decisions
Selects all decision variable cells on the active worksheet
Alt-c, l, d
Select All Forecasts
Selects all forecast cells on the active worksheet
Alt-c, l, f
Select Some...
Selects specified Crystal Ball data cells
Alt-c, l, s
Freeze
Excludes specified Crystal Ball data cells from a simulation
Alt-c, g
Cell Prefs
Opens the Cell Preferences dialog to change the appearance
and other properties of Crystal Ball data cells
Alt-c, y
Using Crystal Ball in Excel 2007 B-3
Shortcut key combinations in Excel 2007
Table B–2
Run commands
Button
Command
Command Action
Keystrokes
Start
Begins running a Crystal Ball simulation and resumes a
stopped simulation.
Alt-c, s
Stop
Stops a simulation
Alt-c, o
Reset
Clears generated simulation data (Crystal Ball data cells
remain defined)
Alt-c, r
Step
Steps through a simulation one trial at a time
Alt-c, i
Tools
Offers the CB Tools for additional analysis and charting
Alt-c, t
CB Predictor
Starts CB Predictor for time series analysis
Alt-c, t, p
Batch Fit (tool)
Automatically fits selected continuous probability
distributions to multiple data series
Alt-c, t, f
Bootstrap (tool)
Addresses the reliability and accuracy of forecast statistics
Alt-c, t, b
Correlation Matrix
(tool)
Rapidly defines and automates correlations of assumptions
Alt-c, t, c
Data Analysis (tool)
Imports data directly from spreadsheets into Crystal Ball
forecasts for further analysis
Alt-c, t, a
Decision Table (tool)
Evaluates the effects of alternate decisions in a simulation
model
Alt-c, t, d
Scenario Analysis (tool) Displays what inputs created particular outputs
Alt-c, t, s
Tornado Chart (tool)
Individually analyzes the impact of each model variable on a
target outcome
Alt-c, t, t
2D Simulation (tool)
Independently addresses uncertainty and variability using a
two-dimensional simulation
Alt-c, t, 2
Strategic Finance Setup
(tool)
If available, opens the Strategic Finance Setup wizard for
setting up a workbook that allows Crystal Ball to run with
Strategic Finance data
Alt-c, t, e
Compare Run Modes
(tool)
Compares simulation run time in Normal and Extreme speed Alt-c, t, r
(if available)
Save or Restore
Lets you save or restore simulation results and charts
Save Results
Saves current simulation results for later display and analysis Alt-c, w, v
B-4 Crystal Ball Getting Started Guide
Alt-c, w
Shortcut key combinations in Excel 2007
Table B–2
Button
Run commands (Cont.)
Command
Command Action
Keystrokes
Restore Results
Restores saved results files for display and analysis
Run Preferences
Opens the Run Preferences dialog for setting trials, sampling, Alt-c, u
and other run preferences
OptQuest
Starts OptQuest for results optimization
Table B–3
Analyze commands
Button
Command
Alt-c, w, e
Alt-c, q
Command Action
Keystrokes
View Charts
Offers a gallery of charts and chart window management
commands; use the Down arrow (↓) to choose a specific chart
Alt-c, v
Assumption Charts
Opens the Assumption Charts dialog so you can display or
manage assumption charts
Alt-c, v
Forecast Charts
Opens the Forecast Charts dialog so you can display or
manage forecast charts
Alt-c, v
Sensitivity Charts
Opens the Sensitivity Charts dialog so you can display
existing or create new sensitivity charts
Alt-c, v
Overlay Charts
Opens the Overlay Charts dialog so you can display existing
or create new overlay charts
Alt-c, v
Trend Charts
Opens the Trend Charts dialog so you can display existing or
create new trend charts
Alt-c, v
Scatter Charts
Opens the Scatter Charts dialog so you can display or
manage scatter charts
Alt-c, v
OptQuest Charts
If OptQuest is available, opens OptQuest charts following an
optimization
Alt-c, v
Open Selected Cells
Opens associated charts for selected cells
Alt-c, v, n
Cascade
Arranges open charts for easier viewing
Alt-c, v, c
Close All
Closes all open charts
Alt-c, v, l
Create Report
Lets you create a report of simulation results by choosing
from a gallery of predefined and custom report types
Alt-c, m
Assumptions Report
Creates a report of only assumption results
Alt-c, m, a
Decision Variables
Report
Creates a report of only decision variable results
Alt-c, m, d
Forecasts Report
Creates a report of only forecast results
Alt-c, m, f
Using Crystal Ball in Excel 2007 B-5
Shortcut key combinations in Excel 2007
Table B–3
Analyze commands (Cont.)
Button
Table B–4
Command
Command Action
Keystrokes
Full Report
Creates a report of all simulation results
Alt-c, m, r
Index Report
Creates a report of only Crystal Ball data cell names and
locations
Alt-c, m, i
OptQuest Report
If OptQuest is available, creates a report of selected OptQuest Alt-c, m, o
results following an optimization
Custom Report
Creates a report with only selected simulation results
Alt-c, m, c
Report Preferences
Sets various report options
Alt-c, m, p
Extract Data
Copies selected simulation data to a worksheet for additional Alt-c, x
analysis
Help commands
Button
Command
Command Action
Keystrokes
Help
Displays online help for Crystal Ball
Alt-c, h
Resources
Displays documentation, examples, tutorials, feedback email,
and the technical support knowledgebase
Alt-c, n
Technical Support
Opens the Crystal Ball Technical Support web page
Alt-c, n, t
Send Feedback
Opens an email so you can send comments and product
feedback to the Crystal Ball team
Alt-c, n, s
User Manuals
Displays a list of available online documentation for Crystal
Ball
Alt-c, n, m
Examples Guide
Displays a list of available example models so you can load
your choice into Crystal Ball
Alt-c, n, e
Welcome Screen
Displays a Welcome Screen that lets you automatically
Alt-c, n, w
activate the process capability features for quality programs
such as Six Sigma or set percentile preferences frequently used
in the Oil and Gas industry.
Licensing
Displays the Activate a License dialog for entering a Crystal
Ball serial number and activating a license
About [Crystal Ball]
Offers version and other information about the current Crystal Alt-c, b
Ball release including the username
Alt-c, n, l
The following information from Appendix A, "Toolbar and Menu Commands: Excel
2003 or earlier" concerns menus and commands in the Distribution Gallery and chart
windows. This information is the same for all supported versions of Windows.
B-6 Crystal Ball Getting Started Guide
Compatibility and file conversion issues
Table B–5
Relevant information in Appendix A
Table
Title
Table A–5
General chart menu commands
Table A–6
Assumption-specific chart menu commands
Table A–7
Forecast-specific chart menu commands
Table A–8
Overlay-specific chart menu commands
Table A–9
Sensitivity-specific chart menu commands
Table A–10
Trend-specific chart menu commands
Table A–11
Scatter-specific chart menu commands
B.3 Distribution gallery hot keys
These are described in Appendix A, "Toolbar and Menu Commands: Excel 2003 or
earlier".
B.4 Chart preference hot keys
These are described in Appendix A, "Toolbar and Menu Commands: Excel 2003 or
earlier".
B.5 Compatibility and file conversion issues
Excel 2007 workbooks can be saved in several file formats that are significantly
different from those for previous versions of Excel. This version of Crystal Ball has
been carefully designed to preserve Crystal Ball data in existing workbooks as long as
you follow a few simple rules when opening and saving files created in previous
versions of Excel.
In general:
1.
Be sure Crystal Ball is loaded before opening a workbook with extension .xls that
contains Crystal Ball data or before saving a model to any format in Excel 2007.
2.
Always save files in .xls format to share with users of Crystal Ball who are using
Microsoft Office 2003, XP, or 2000.
For detailed information, see the last section about Excel 2007 in the Crystal Ball
Migration Guide (cbmigration.html). To view this document, choose Start > [All]
Programs > Crystal Ball > README. Then, click the Crystal Ball Migration Guide link
near the end of the Introduction section. If Crystal Ball is running, you can choose
Resources > User Manuals at the right end of the Crystal Ball ribbon. Then, click
Crystal Ball Migration Guide near the top of the list of documentation.
Files from earlier versions of Crystal Ball — including the Crystal Ball Example files —
are converted automatically when you save them in the current version of Crystal Ball
on Excel 2007 or earlier versions of Microsoft Excel. Files from earlier versions are
opened in compatibility mode. [Compatibility Mode] appears after the workbook
name in the title bar, as shown in Figure B–1.
Using Crystal Ball in Excel 2007 B-7
Compatibility and file conversion issues
When you open the Example files in Windows Vista,
they are read-only. If you want to edit or customize them, save them
under another name before you run a simulation.
Vista Notes:
Also, the legacy WinHlp32 viewer for online help files is not shipped
with Windows Vista, so 32-bit help files in WinHelp format with
extension .hlp (such as the CB Predictor help) cannot be opened. For
information from Microsoft about downloading a viewer, see:
http://support.microsoft.com/kb/917607
B-8 Crystal Ball Getting Started Guide
C
How Do I...
C
In this appendix:
■
Crystal Ball tasks
■
Defining Crystal Ball models
■
Running simulations
■
Analyzing simulation results
■
Creating reports and extracting data
■
Using the Crystal Ball tools
■
Using Crystal Ball spreadsheet functions
■
Using Crystal Ball macros
■
Using the process capability features
This appendix summarizes how to use Crystal Ball to perform and analyze Monte
Carlo simulations in Excel workbooks. For additional information, click the Help
button in Crystal Ball dialogs and review the current Crystal Ball User Manual and
Crystal Ball Process Capability Guide, installed with Crystal Ball in PDF format.
C.1 Crystal Ball tasks
As discussed on previously, the basic process for using Crystal Ball is to:
1.
Define a model that reflects an uncertain scenario.
2.
Run a simulation on it.
3.
Analyze the results.
This appendix summarizes the tasks involved in performing each of the main
procedures, listed below.
Table C–1
Crystal Ball tasks
Task
Section C.2, "Defining Crystal Ball models"
Section C.2.1, "Defining assumption cells"
Section C.2.2, "Defining decision variable cells"
Section C.2.3, "Defining forecast cells"
Section C.2.4, "Setting cell preferences"
How Do I...
C-1
Crystal Ball tasks
Table C–1
Crystal Ball tasks (Cont.)
Task
Section C.2.5, "Selecting Crystal Ball data"
Section C.2.6, "Copying, pasting, and clearing Crystal Ball data"
Section C.3, "Running simulations"
Section C.3.1, "Setting run preferences"
Section C.3.2, "Freezing cells during simulation runs"
Section C.3.3, "Running a simulation"
Section C.3.4, "Saving and restoring Crystal Ball results"
Section C.4, "Analyzing simulation results"
Section C.4.1, "Using forecast charts"
Section C.4.2, "Using overlay charts"
Section C.4.3, "Using sensitivity charts"
Section C.4.4, "Using trend charts"
Section C.4.5, "Using assumption charts"
Section C.4.6, "Using scatter charts"
Section C.4.8, "Setting chart preferences"
Section C.5, "Creating reports and extracting data"
Section C.5.1, "Creating reports"
Section C.5.2, "Extracting data"
Section C.5.3, "Printing extracted reports and data"
Section C.6, "Using the Crystal Ball tools"
Section C.7, "Using Crystal Ball spreadsheet functions"
Section C.8, "Using Crystal Ball macros"
Section C.9, "Using the process capability features"
Section C.9.1, "Activating the process capability features"
Section C.9.2, "Adding specification limits and a target"
Section C.9.3, "Chart display views and preferences"
The steps given here are condensed. Be sure to review the Crystal Ball User Manual for
details. To view it online, choose Start > Programs > Crystal Ball > Documentation (or
choose Help > Crystal Ball > User Manuals in Excel). The Crystal Ball Reference Manual
and other documents can help as well. And, as you work, you can choose Help >
Crystal Ball > Crystal Ball Help to display the entire Crystal Ball online help system.
Or, you can press the Help button in any Crystal Ball dialog to review information
about that dialog.
(In Excel 2007, choose Help > Resources > User Manuals to view the Crystal Ball
documentation.)
Also, in the following instructions, you can use the icon instead of the command
sequence.
C-2 Crystal Ball Getting Started Guide
Defining Crystal Ball models
C.2 Defining Crystal Ball models
To define a model in Crystal Ball, you define assumption cells and forecast cells. You
can also define decision variable cells for use with the Decision Table tool and
OptQuest. The following sections describe these tasks.
C.2.1 Defining assumption cells
First, determine the most appropriate probability distribution for each uncertain
variable:
1.
List everything you know about the conditions surrounding this variable.
2.
Review the descriptions of the probability distributions in Appendix D, "Choosing
a distribution".
3.
Also, consider using Crystal Ball’s distribution fitting feature, described in
Section C.2.1.3, "Fitting distributions to data".
4.
Select the distribution that characterizes the variable.
Then, define one or more assumption cells:
1.
Select a cell or a range of cells. The cells can be blank or have numeric values, but
they cannot have formulas or text.
2.
Choose Define > Define Assumption.
(In Excel 2007, click the upper half of the Define Assumption icon.)
3.
In the Distribution Gallery, select the distribution you want from the gallery. The
Basic category contains several frequently used distributions. Click All to view all
distributions shipped with Crystal Ball.
Alternately, click the Fit button to fit a distribution to historical data, as described
in Section C.2.1.3, "Fitting distributions to data".
For more information on the Distribution Gallery, see Section C.2.1.5, "Using the
Distribution Gallery".
4.
When the Define Assumption dialog appears, type in the parameters for the
distribution. The parameters can be either numeric values or cell references.
5.
Click Enter to accept the parameters and view the distribution curve.
6.
To interactively change the endpoints of the distribution, click one of the two
truncation grabbers (black triangles at the bottom of the distribution chart) and
drag it to the desired location. The implications of truncating a distribution are
discussed in the Crystal Ball User Manual.
7.
Click OK.
C.2.1.1 Entering cell references
In addition to numeric values, you can define distribution parameters as references to
specific worksheet cells. The cell references can refer to numeric values or equations
that have numeric results. Precede all cell references with an "=" sign. For absolute cell
references, precede the row and column coordinate with a "$" sign (e.g., =$A$1).
Besides direct cell references, you can use range names or formulas.
How Do I...
C-3
Defining Crystal Ball models
C.2.1.2 Alternate parameters for distributions
Percentile parameters can make it easier to specify distributions. To change parameter
sets for continuous distributions, choose Parameters in the Define Assumption dialog
menubar.
C.2.1.3 Fitting distributions to data
Distribution fitting automatically matches your historical data against probability
distributions. A mathematical fit is performed to determine the set of parameters for
each distribution that best describe the characteristics of the data. Then, the closeness
of each fit is judged using one of several standard goodness-of-fit tests. The highest
ranking fit is chosen to represent your data.
To fit distributions to data:
1.
Select a worksheet cell.
2.
Choose Define > Define Assumption.
(In Excel 2007, click the upper half of the Define Assumption icon to open the
Distribution Gallery.)
3.
Click Fit in the Distribution Gallery.
4.
Choose the source of the fitted data.
5.
Choose the distribution fitting characteristics.
6.
Click OK.
The fitted distributions appear in the Comparison Chart dialog, starting with the
highest-ranked distribution (best fit) down through to the lowest (worst fit).
7.
You can use the Next and Previous buttons to scroll through the fitted probability
distributions. Each probability distribution is shown superimposed over the data.
8.
Use the Comparison Chart dialog to visually compare the quality of the fits or to
view the goodness-of-fit statistics.
9.
To use the currently displayed distribution, either the best fit or another of your
choice, click Accept.
The Assumption dialog appears with the parameter entries taken from the chosen
distribution. You can change the distribution parameters before you click OK.
Note:
To run fittings on multiple data sets, use the Batch Fit tool.
C.2.1.4 Correlating assumptions
You can define correlations between pairs of assumptions. These relationships are
described in mathematical terms using a correlation coefficient, a number between -1.0
and +1.0 that measures the strength of the relationship. A positive value means that
when one assumption is high, the other is likely to be high. A negative value means
that the assumptions are inversely related; when one is high, the other is likely to be
low.
Crystal Ball uses rank correlation (Spearman) for all correlation computations to let
you relate assumptions with different distribution types.
To relate the current assumption to one or more assumptions:
1.
Select an assumption cell.
C-4 Crystal Ball Getting Started Guide
Defining Crystal Ball models
2.
Choose Define > Define Assumption.
3.
Click the More button to the right of the Assumption name in the Define
Assumption dialog.
4.
Click Correlate.
5.
Follow the directions to fill out the fields in the Define Correlation dialog.
You can define as many correlations to other assumptions as you want.
6.
Click OK to define the correlation and close the Define Correlation dialog.
C.2.1.5 Using the Distribution Gallery
The Distribution Gallery dialog is where you define assumptions for your models.
To display the Distribution Gallery, click a cell that is blank or contains a numeric
value, not a formula, and then click the Define Assumption icon.
In Excel 2007, if you click the upper half of the Define
Assumption icon, or if the assumption has already been defined, the
Distribution Gallery appears. If you click the lower half of the icon, a
list of All, Basic, or Favorite distributions appears, depending on the
active category in the Distribution Gallery.
Note:
For a given worksheet cell, you can select one of the available distributions to describe
that variable’s expected uncertainty. You can also fit a distribution to your historical
data. The Help button displays online help for the currently selected distribution.
You can create custom categories of distributions and share them with other Crystal
Ball users. You can also save modified distributions for future use.
For more information about the distributions, see Appendix D, "Choosing a
distribution". See the Crystal Ball User Manual and online help for the Distribution
Gallery for more information about creating and sharing categories and editing
information in the Description pane.
C.2.2 Defining decision variable cells
Decision variables are variables you can control, such as product price, investment
levels, and so on.
To define one or more decision variable cells:
1.
Select a value cell or a range of value cells.
The cells can be blank or have numeric values, but they cannot have formulas or
text.
2.
Choose Define > Define Decision.
3.
Enter requested information in the Define Decision Variable dialog.
For more information, click the Help button.
4.
Click OK.
C.2.3 Defining forecast cells
Forecasts are the outputs you are investigating in your model. Usually, they contain
formulas that reference the assumption cells, either directly or indirectly.
How Do I...
C-5
Defining Crystal Ball models
To define one or more forecast cells:
1.
Select a cell or a range of cells.
The cells must contain a numeric value or a formula, even one as basic as a
reference to another cell (=A2, for example).
2.
Choose Define > Define Forecast.
3.
Complete the Define Forecast dialog fields. The basic fields are Name and Units.
4.
If desired, expand the dialog by clicking the More button to the right of the Name
field.
5.
Set your preferences on the Forecast Window, Precision, Filter, and Auto Extract
tabs, as described in the following table.
Table C–2
Forecast Preference tabs
Tab
Description
Forecast Window
Sets the initial window view and whether Crystal Ball displays
the forecast window during a simulation.
Precision
Sets whether to stop simulations when specified precision levels
are reached.
Filter
Sets whether to include or exclude forecast values in certain
ranges.
Auto Extract
Specifies which statistics to extract to Excel after a simulation
runs.
6.
Click OK.
You can also set these forecast preferences by choosing
Preferences > Forecast Preferences in the forecast chart window.
Note:
C.2.4 Setting cell preferences
The Cell Preferences dialog sets formatting properties for assumption, decision
variable, and forecast cells.
To change the Cell Preferences settings:
1.
Choose Define > Cell Preferences.
(In Excel 2007, choose Define > Cell Prefs.)
2.
Change one or more of the settings discussed in the Cell Preferences dialog.
3.
Click Apply To to indicate whether to apply the settings at the sheet, workbook, or
all workbooks level.
C.2.5 Selecting Crystal Ball data
You can use the Define menu or group to select Crystal Ball data cells:
■
■
Use Define > Select All Assumptions to select all of the assumptions in the active
worksheet.
Use Define > Select All Decisions to select all of the decision variables in the active
worksheet.
C-6 Crystal Ball Getting Started Guide
Running simulations
■
■
Use Define > Select All Forecasts to select all of the forecasts in the active
worksheet.
Use Define > Select... to select assumptions, decision variables, or forecasts from a
tree or list. Use the Select command to quickly locate assumptions, decision
variables, or forecasts on your worksheet.
If you use Define > Select All [cell type], you can then choose
Define > Define [cell type] to cycle through all of the dialogs for
defining that type of cell. Then, you can verify and/or change their
settings.
Note:
If you are using Crystal Ball in Excel 2007, choose Select in the Define
group and then choose one of the commands described above.
C.2.6 Copying, pasting, and clearing Crystal Ball data
You can use the Define menu to copy, paste, and clear Crystal Ball data cells.
■
■
Use Define > Copy [Data] to copy the specified data type (assumptions, decision
variables, or forecasts) in the selected range. If multiple data types exist within the
range, you are prompted for which type or types to copy. You can copy and paste
from one worksheet to another within the same workbook.
Use Define > Paste [Data] to paste assumption, decision variable, or forecast cell
definitions from the copied range into the selected range. Assumption or decision
variable definitions are pasted into blank or value cells in the current selection,
replacing any existing assumption or decision variable definitions, respectively.
Forecast definitions are pasted into value and formula cells in the current
selection, replacing any existing forecast definitions.
If there are more assumption, decision variable, or forecast cells in the copied
range than cells, remaining ones will be ignored. If there are more cells than
copied assumptions, decision variables, or forecasts, the data in the copied range
will be reused starting with the first one.
■
Use Define > Clear [Data] to remove assumption, decision variable, or forecast cell
definitions from the selected range of the active worksheet. The actual worksheet
cells themselves are not changed. If multiple data types exist within the range, you
are prompted for which type or types to clear.
C.3 Running simulations
C.3.1 Setting run preferences
The run preferences control several aspects of running simulations:
■
Trials — The number of trials and precision control
■
Sampling — Sampling types and optional seed value
■
Speed — Run mode and window display
■
■
Options — Settings that control storing assumption data, using correlations, using
user-defined macros, and Control Panel display
Statistics — Percentile display, activating the process capability features
How Do I...
C-7
Running simulations
For details, click the Help button on each tab of the Run Preferences dialog or refer to
the online Crystal Ball User Manual.
To change the run preferences:
1.
Choose Run > Run Preferences.
2.
When the Run Preferences dialog appears, change appropriate settings on each
tab.
3.
Click OK.
If you have the Extreme Speed feature and choose Extreme
Speed on the Speed tab of the Run Preferences dialog, certain model
compatibility issues apply. For more information, see the Extreme
Speed appendix in the Crystal Ball User Manual or review the About
Extreme Speed topic in the Crystal Ball online help.
Note:
C.3.2 Freezing cells during simulation runs
The Freeze command lets you “freeze” or exclude certain Crystal Ball assumption,
decision variable, and forecast cells from a simulation. This lets you see the effect
certain cells have on the model while holding others to their worksheet values.
To freeze Crystal Ball data cells:
1.
Choose Define > Freeze.
2.
Select one or more assumptions, decision variables, or forecasts as described in the
Freeze dialog.
3.
Click OK.
C.3.3 Running a simulation
After you have defined assumption and forecast cells — and, optionally, decision
variable cells — in your worksheet model, you are ready to run a simulation. During
the simulation, Crystal Ball creates a forecast chart for each forecast cell using
frequency distributions to show the range of possible results.
During a Crystal Ball simulation, you can stop, reset, and continue the simulation at
any time and manipulate the forecast charts independently, displaying or hiding them
as needed.
C.3.3.1 Starting a simulation
To start a simulation:
■
Choose Run > Start [Simulation].
You can then stop, continue, single step, or reset the simulation.
After you start the simulation, the Run > Start [Simulation] command changes to Stop
[Simulation]. If you then choose Stop [Simulation], the simulation halts and the
command changes to Continue Simulation (in Excel 2003 or earlier). Choosing
Continue Simulation restarts the simulation where it left off, and changes the menu
command back to Stop [Simulation].
(In Excel 2007, choose Run > Start to continue the simulation.)
C-8 Crystal Ball Getting Started Guide
Running simulations
C.3.3.2 Stopping, resetting, and rerunning a simulation
To stop, reset and rerun a simulation:
1.
Choose Run > Stop [Simulation].
2.
Choose Run > Reset [Simulation].
3.
Click OK.
4.
Make any changes to assumptions, decision variables, or forecasts.
5.
Choose Run > Start [Simulation].
C.3.3.3 Using the Crystal Ball Control Panel
The Crystal Ball Control Panel appears by default when you run a simulation. It lets
you run, stop, reset, continue, and single-step simulations. It also contains the Run and
Analyze menus. Because you can use the Control Panel without hiding forecast
windows, it is often more useful than the Run commands and tools in the main Crystal
Ball menubar and toolbar.
C.3.3.4 Using single step
The [Single] Step command lets you see the simulation process "in action" by
generating one set of trial values at a time for the assumption cells and recalculating
the worksheet. You can use this command to track down a calculation error or verify
that the values being produced for your assumption cells are valid.
To step through one trial of the simulation, choose Run > [Single] Step.
C.3.4 Saving and restoring Crystal Ball results
You can save all open forecast windows and other charts as well as simulation data
after you run a simulation in Crystal Ball. You can only save results after a simulation
stops. Although only results are saved and not an entire model, restored results files
appear in Crystal Ball chart, report, and Extract Data dialogs so you can work with
them. You can run new charts and reports against them and extract their data to
worksheets.
Because the saved files contain only results and are not complete models, you can load
more than one results file at a time and you do not need to reset the current simulation
before loading results.
C.3.4.1 Saving results
To save Crystal Ball results:
1.
Choose Run > Save Results. The Save Results dialog appears.
(In Excel 2007, choose Run > Save or Restore, and then choose Save Results.)
2.
Navigate to the correct folder to save the results file.
3.
Name the results file. The default name is the name of the active workbook.
4.
Click OK.
The saved results file has a .cbr extension. Crystal Ball saves all results data and charts
that existed when the results were saved.
C.3.4.2 Restoring results
To restore Crystal Ball results:
How Do I...
C-9
Analyzing simulation results
1.
Choose Run > Restore Results. The Restore Results dialog appears.
(In Excel 2007, choose Run > Save or Restore, and then choose Restore Results.)
2.
Choose the .cbr file to restore.
3.
Click Open.
Crystal Ball opens all results data and charts saved in the results file. You can clear
these results from memory by choosing Analyze > Close All.
(In Excel 2007, choose Analyze > View Charts > Close All.)
C.3.4.3 Saving Crystal Ball models (not results)
Excel saves all the assumption, decision variable, and forecast definitions for your
Crystal Ball model with the workbook. When you close and reopen the workbook,
Crystal Ball remembers these definitions and you can pick up where you left off.
C.4 Analyzing simulation results
The primary tools for analyzing simulation results are the Crystal Ball charts. You can
create and view:
■
Forecast charts, Section C.4.1
■
Overlay charts, Section C.4.2
■
Sensitivity charts, Section C.4.3
■
Trend charts, Section C.4.4
■
Assumption charts, Section C.4.5
■
Scatter charts, Section C.4.6
■
OptQuest charts, Section C.4.7
To help further with results analysis and presentation, you can:
■
Create reports with data and charts, Section C.5.1
■
Extract data to Excel for further analysis, Section C.5.2
For detailed analysis guidelines, see “Guidelines for analyzing simulation results” in
Chapter 5 of the Crystal Ball User Manual.
C-10 Crystal Ball Getting Started Guide
Analyzing simulation results
C.4.1 Using forecast charts
Figure C–1
Forecast chart
Crystal Ball creates a forecast chart for each forecast cell using frequency distributions
to show the number of values that occur in a given interval.
Although Crystal Ball forecasts an entire range of results, the forecast chart only shows
a display range by default, which excludes extreme values. The endpoints for this
displayed range are shown on the left and right sides of the horizontal axis.
The trials, shown in the upper left, reflect the number of trials in the simulation. The
number shown in the upper right indicates the number of trials that fall within the
display range.
The forecast chart plots the frequency distribution based on bins or group intervals. As
Crystal Ball generates the forecast values, the number of values in each group interval
increases.
The frequency scale to the right of the chart shows frequency counts for the bins. The
probability scale to the left of the chart shows the probability of values falling within
the bins.
The certainty level appears below the forecast chart. It is calculated by comparing the
number of forecasted values in the certainty range with the number of values in the
entire range.
To display a forecast chart, choose Analyze > Forecast Charts. The Forecast Charts
dialog appears with a list of available charts. Check the box in front of the one(s) you
want to display and click OK.
(In Excel 2007, choose Analyze > View Charts > Forecast Charts.)
C.4.1.1 Using the certainty grabbers
To define the certainty level using certainty grabbers:
■
In the forecast chart, move the certainty grabbers to focus on a particular part of
the display area.
How Do I...
C-11
Analyzing simulation results
■
■
To anchor a certainty grabber, click it. To unanchor it, click it again. (Anchored
grabbers are darker in color than unanchored grabbers.)
You can move both certainty grabbers from one end to the other to cross them and
determine the certainty of values at the ends.
The certainty level changes to reflect the location of the certainty grabbers.
If you have activated Crystal Ball’s process capability features and entered at least one
specification limit, the certainty grabbers are automatically set to the specification
limit(s).
C.4.1.2 Forecast chart views
When you choose View or Preferences > Forecast in the forecast chart window you can
choose from among these views:
Table C–3
View
Forecast chart views
Example
Description
Frequency
Changes the view of the forecast chart to a frequency
distribution.
Cumulative
Frequency
Changes the view of the forecast chart to a cumulative
frequency distribution.
Reverse
Cumulative
Frequency
Changes the view of the forecast chart to a reverse
cumulative frequency distribution.
Statistics
Changes the view of the forecast chart to a table showing
the statistics of the simulation.
C-12 Crystal Ball Getting Started Guide
Analyzing simulation results
Table C–3
View
Forecast chart views (Cont.)
Example
Description
Percentiles
Changes the view of the forecast chart to a table showing
the forecast values broken into 10% increments.
Goodness Of
Fit
If a distribution is fitted, shows fitting information for
the forecast.
Capability
Metrics
If process capability features are activated and a
specification limit or limits are entered, shows capability
(quality) statistics for the forecast.
C.4.1.3 Customizing forecast charts
You can customize forecast charts by:
■
Changing forecast preferences — choosing forecast chart views and choosing
when forecast charts appear
Display a forecast chart and choose View or Preferences > Forecast.
■
Changing the overall appearance of charts with forecast chart preferences
Display a forecast chart and choose Preferences > Chart.
For more information about customizing forecast charts, see Section C.4.8, "Setting
chart preferences". You can also click the Help button in any of the preferences dialogs.
For some of the settings, you can use hot keys to bypass the preferences dialogs. For
information, see Section C.4.8.1, "Hot keys for chart preferences".
How Do I...
C-13
Analyzing simulation results
C.4.2 Using overlay charts
Figure C–2
Overlay chart comparing three reliability forecasts
After completing a simulation with multiple related forecasts, you can create an
overlay chart to display the relative characteristics of multiple related forecasts on one
chart. The frequency data from selected forecasts is superimposed in one location to
show similarities or differences that might not otherwise be apparent. There is no limit
to the number of forecasts you can view at one time on an overlay chart.
You can also use the overlay chart to fit standard probability distributions to displayed
forecasts.
C.4.2.1 Creating overlay charts
To create an overlay chart:
1.
Run a simulation in Crystal Ball (or restore saved results).
2.
Choose Analyze > Overlay Charts.
(In Excel 2007, choose Analyze > View Charts > Overlay Charts.)
The Overlay Charts dialog appears. If you have not created any overlay charts yet,
the dialog is blank.
3.
To create a new overlay chart, click New. The Choose Forecasts dialog appears.
4.
Check the boxes in front of the forecasts to include in the overlay chart.
5.
Click OK to create a new overlay chart with the selected forecasts.
The overlay chart is built and displayed with the frequency distributions for the
selected forecasts superimposed over each other. By default, they are displayed as
columns. You can change them to lines or areas in two or three dimensions and
can change the number of data points or intervals (bins) with hot keys or the Chart
Preferences settings. A default name is assigned; you can also change it with the
Chart Preferences settings.
6.
Follow the steps in Customizing overlay charts to change a variety of chart
features and highlight those of greatest interest.
C-14 Crystal Ball Getting Started Guide
Analyzing simulation results
You can also use “hot keys,” or keyboard equivalents for commands to quickly
change the chart view. For a list of these, see Section C.4.8.1, "Hot keys for chart
preferences".
7.
If you want, choose Overlay > Fit Probability Distributions to select and display
the best fitting distribution for each forecast in the chart.
C.4.2.2 Customizing overlay charts
The overlay chart can be customized in a number of ways to suit your preferences. You
can:
■
Add a title
■
Change the chart type to display the forecasts differently
■
Make the chart legend or grid lines visible or hidden
■
Change the number of group intervals (bins)
■
Change the color of each forecast
■
Make the overlay chart appear transparent
■
Make the overlay chart appear three-dimensional
■
Rotate the chart for the current session
You can customize overlay charts with the following menus in the chart menubar:
■
■
■
The View menu determines the type of distribution or data you want to see on the
forecast chart.
The Overlay menu lets you add and remove forecasts from the chart and fit
distributions to the displayed forecasts.
The Preferences menu lets you change the chart view, determine when the chart
appears, fit specific distributions to the forecasts, and set a variety of chart
preferences.
For a general overview of customizing charts, see Section C.4.8, "Setting chart
preferences". For details, click the Help button in each of the preferences dialogs.
How Do I...
C-15
Analyzing simulation results
C.4.3 Using sensitivity charts
Figure C–3
Sensitivity chart showing contributions to gross profit
Sensitivity charts show how much a given assumption affects your result. The overall
sensitivity of a forecast to an assumption is a combination of two factors:
■
The model sensitivity of the forecast to the assumption
■
The assumption’s uncertainty
During a simulation, Crystal Ball ranks the assumptions according to their importance
to each forecast cell. Sensitivity charts display these rankings as a bar chart, indicating
which assumptions are the most important or least important in the model. You can
add sensitivity charts to reports or copy them to the clipboard.
For more information about what sensitivity charts display, see Section C.4.3.3,
"Sensitivity chart views".
C.4.3.1 Benefits
Sensitivity charts provide these key benefits:
■
■
■
You can find out which assumptions are influencing your forecasts the most,
reducing the amount of time needed to refine estimates.
You can find out which assumptions are influencing your forecasts the least, so
that they can be ignored or discarded altogether.
As a result, you can construct more realistic worksheet models and greatly
increase the accuracy of your results because you know how your assumptions
affect your model.
C.4.3.2 A related tool
The Tornado Chart tool is similar to the sensitivity chart, but it evaluates each
assumption’s relationship to the forecast independently by testing each variable one at
a time. The Tornado Chart tool can help you discover if any of your assumptions have
non-monotonic relationships with the target forecast and can be used instead of
sensitivity charts if this limitation exists. For details, see Section C.4.3.4, "Sensitivity
chart limitations".
C-16 Crystal Ball Getting Started Guide
Analyzing simulation results
C.4.3.3 Sensitivity chart views
There are three sensitivity chart views available through the View menu on the
sensitivity chart menubar:
■
■
■
Contribution To Variance — The default view, Contribution To Variance, makes it
easier to answer questions such as “What percentage of the variance or
uncertainty in the target forecast is due to assumption X?” The percentages of
these variance contributions appear after their respective assumptions or other
forecasts. Crystal Ball calculates Contribution To Variance by squaring the rank
correlation coefficients and normalizing them to 100%.
Rank Correlation — Alternately, Crystal Ball calculates sensitivity by computing
rank correlation coefficients between every assumption and every forecast while
the simulation is running. The larger the absolute value of the correlation
coefficient, the stronger the relationship.
Sensitivity Data — This view shows contribution to variance and rank correlation
for each assumption in numeric form.
C.4.3.4 Sensitivity chart limitations
There are limitations for particular views or sensitivity charts in general. Sensitivity
calculations might be inaccurate or misleading for:
■
■
■
Correlated assumptions.
Assumptions whose relationships with the target forecast are not monotonic; that
is, an increase in the assumption is not accompanied by a strict increase in the
forecast, or vice versa.
Assumptions or forecasts that have a small set of discrete values.
C.4.3.5 Creating sensitivity charts
To create a sensitivity chart:
1.
Open a model with the data you want to analyze (or restore results).
2.
Choose Run > Run Preferences> Options.
3.
Make sure Store Assumption Values For Analysis is checked.
4.
Click OK.
5.
Run a simulation (not necessary for stored results) and choose Analyze>
Sensitivity Charts.
(In Excel 2007, choose Analyze > View Charts > Sensitivity Charts.)
The Sensitivity Charts dialog appears.
6.
Click the New button.
The Choose Forecast dialog appears. By default, this dialog appears in Tree view. If
you prefer, click the List box to change the view from a tree to a list.
7.
Check the box in front of the forecast to include in the sensitivity chart.
8.
Click OK to create a new sensitivity chart.
The assumptions are listed on the left side, starting with the assumption with the
highest sensitivity. If necessary, use the scroll bar to view the entire bar chart or
drag the edges of the chart to resize it.
How Do I...
C-17
Analyzing simulation results
If you try to create a sensitivity chart but Store Assumption
Values For Analysis was not checked in the Run Preferences dialog,
reset the simulation, check Store Assumption Values For Analysis, and
then run the simulation again.
Note:
C.4.3.6 Customizing sensitivity charts
You can customize the sensitivity chart by adding and removing assumptions, by
changing the target forecast, and by setting sensitivity preferences and chart
preferences.
C.4.3.6.1 Adding and removing assumptions By default, all assumptions in our model are
included in the sensitivity chart. To select the assumptions to include in the sensitivity
analysis:
1.
In the Sensitivity Chart window, choose Sensitivity > Choose Assumptions.
2.
In the Choose Assumptions dialog, check the assumptions to add to the sensitivity
chart and uncheck other assumptions to remove from the chart.
C.4.3.6.2 Changing the target forecast To select a forecast to include in the sensitivity
analysis:
1.
In the Sensitivity Chart window, choose Sensitivity > Choose Target Forecast.
2.
In the Choose Forecasts dialog, check the forecasts to add to the sensitivity chart
and uncheck other assumptions to remove from the chart.
C.4.3.6.3 Setting sensitivity preferences You can set a number of preferences that
determine:
■
■
■
■
The sensitivity view that appears
Whether the sensitivity chart appears automatically, and if so whether it appears
while the simulation is running or after it stops
How many assumptions are included in the chart, from the highest to the lowest
sensitivity value
Whether sensitivity values are limited to a certain value or higher
To set sensitivity preferences:
1.
Choose Preferences > Sensitivity.
The Sensitivity Preferences dialog appears.
2.
Use the Sensitivity Window tab to change sensitivity views and to specify when
the sensitivity chart appears.
3.
Use the Criteria tab to limit sensitivity values by rank or value.
For more information, click the Help button.
C.4.3.6.4 Setting sensitivity chart preferences The sensitivity chart preferences control the
overall appearance of a sensitivity chart.
To set sensitivity chart preferences:
1.
In the sensitivity chart window, choose Preferences > Chart.
2.
Use the General tab of the Chart Preferences dialog to set the chart title, gridlines,
legend, and chart effects.
C-18 Crystal Ball Getting Started Guide
Analyzing simulation results
3.
On the Chart Type tab, you can use the Chart Type drop-down list to choose one of
these chart types:
Bar (directional)
The default; horizontal bars to the right and left of the 0
line showing magnitude and direction of sensitivity
Bar (magnitude)
Horizontal bars to the right of the 0 line showing
magnitude of sensitivity but not direction
Pie
A circle divided into proportional “slices” showing the
magnitude of sensitivity
For information on the other settings, click the Help button.
C.4.4 Using trend charts
Figure C–4
Trend chart with quarterly sales data
Trend charts summarize and display information from multiple forecasts, making it
easy to discover and analyze trends that might exist between related forecasts.
Trend charts display certainty ranges for multiple forecasts in a series of colored
bands. Each band represents the certainty ranges into which the actual values of your
forecasts fall. For example, the band which represents the 90% certainty range shows
the range of values into which a forecast has a 90% chance of falling. By default, the
bands are centered around the median of each forecast. The bands grow wider as
forecasts move into the future. In this way, they demonstrate the compounding of
uncertainty that occurs as predictions are made farther and farther into the future.
C.4.4.1 Creating trend charts
To create a trend chart:
1.
Open a model with the data you want to analyze (or restore results). To produce a
meaningful trend chart, the model or restored results should have more than one
forecast.
2.
Run a simulation (not necessary with restored results), and then choose Analyze >
Trend Charts.
How Do I...
C-19
Analyzing simulation results
(In Excel 2007, choose Analyze > View Charts > Trend Charts.)
The Trend Charts dialog appears.
3.
In the Trend Charts dialog, click the New button.
4.
In the Choose Forecasts dialog, check the box in front of two or more forecasts to
include in the trend chart.
5.
Click OK to create the new trend chart.
C.4.4.2 Trend chart views
You can use the trend chart View menu to change the placement of the certainty bands
within the trend chart. The default setting centers the bands around the median of
each forecast. You can change the location of the bands so that they are anchored at
either the high end or the low end of the projected forecast ranges.
Smaller bands always appear on top of larger bands. This
obscures the larger bands. Don’t confuse the actual width of a band
with the portion that is visible.
Note:
To change the placement of the certainty bands:
1.
In the trend chart, open the View menu or choose Preferences > Trend.
2.
Choose one of the views in the following table:
Table C–4
Trend chart views
View
Effect
Description
Centered On
Median
The default; displays forecasts
centered around the median of each
forecast value.
Cumulative
Displays the forecasts anchored at the
lower end of the forecast range; shows
the certainty that the forecast values
will be at or below a given value
(cumulative probability).
Reverse
Cumulative
Displays the forecasts anchored at the
higher end of the forecast range; shows
the certainty that the forecast values
will be at or above a given value
(reverse cumulative probability).
You can use a Crystal Ball hot key to bypass the View menu. Each time you press
Ctrl-d, the next trend chart view appears.
C.4.4.3 Customizing trend charts
You can customize trend charts to display the probability that given forecasts will fall
in a particular part of a value range.
C-20 Crystal Ball Getting Started Guide
Analyzing simulation results
You can customize trend charts by:
■
Changing trend preferences — choosing trend chart views and choosing when
trend charts appear
Choose Preferences > Trend in the trend chart window.
■
Adding, removing, and ordering forecasts
Choose Trend > Choose Forecasts in the trend chart window.
■
Changing the overall appearance of charts with trend chart preferences -- setting
certainty band types and colors, selecting certainty bands, changing value axis
preferences
Choose Preferences > Chart in the trend chart window.
For some of the options, you can use hot keys to bypass the preferences dialogs. For
information, see Section A.5, "Chart preference hot keys".
For more information, click the Help button in each dialog or see the Crystal Ball User
Manual.
C.4.5 Using assumption charts
Figure C–5
Assumption chart for a normal distribution
Assumption charts show trial values for a simulation overlaid on the distribution for
that assumption.
You can view assumption charts after running simulations with Monte Carlo or Latin
hypercube settings and with different sample and trial sizes to compare the effects of
the different settings on the simulation values. More trials and larger samples should
generate smoother curves that conform more closely to the ideal distribution curves.
You can add assumption charts to reports or copy them to the clipboard for use in
other applications.
C.4.5.1 Creating assumption charts
To create an assumption chart:
1.
Choose Run > Run Preferences.
How Do I...
C-21
Analyzing simulation results
2.
Click the Options tab and be sure Store Assumption Values For Analysis is
checked.
3.
Run a simulation in Crystal Ball. Assumption charts, like forecast charts, are
created automatically.
C.4.5.2 Viewing assumption charts
To view an assumption chart:
1.
Choose Analyze > Assumption Charts.
(In Excel 2007, choose Analyze > View Charts > Assumption Charts.)
The Assumption Charts dialog appears.
2.
In the Assumptions Charts dialog, check the boxes in front of the chart or charts to
display and click OK.
C.4.5.3 Customizing assumption charts
You can customize assumption charts by:
■
Changing assumption preferences — choosing assumption chart views and
choosing when assumption charts appear
Display an assumption chart and choose View or Preferences > Assumption.
■
Changing the overall appearance of charts with assumption chart preferences
Display an assumption chart and choose Preferences > Chart.
For more information about customizing assumption charts, see Section C.4.8, "Setting
chart preferences". You can also click the Help button in any of the preferences dialogs.
For some of the settings, you can use hot keys to bypass the preferences dialogs. For
information, see Section A.5, "Chart preference hot keys".
C.4.6 Using scatter charts
Scatter charts show correlations, dependencies, and other relationships between pairs
of forecasts and assumptions plotted against each other.
In its basic form, a scatter chart contains one or more plots of a target variable mapped
against a set of secondary variables. Each plot appears as a cloud of points or symbols
aligned in a grid within the scatter chart window. Figure C–6 shows a set of all model
assumptions plotted against a target forecast. In this case, the Material 3 Reliability
forecast is the target.
C-22 Crystal Ball Getting Started Guide
Analyzing simulation results
Figure C–6
Scatter chart with optional correlations displayed
In Figure C–6, the Ordered Fit line shows where the pairwise points would appear if
they were sorted in ascending order. The closer the points conform to the line, the
closer the relationship among the plotted variables. Lines sloped from the lower left to
the upper right show positive relationships. If the relationship is negative, the line
slopes from the upper left to the lower right. Here, optional correlation coefficients
show the strength of the relationship.
In another form of scatter chart, called the Matrix view, each selected variable is
plotted against every other selected variable to show the relationships among them.
Figure C–7 shows intercorrelations among three forecasts in Matrix view. Material 2
Reliability and Material 3 Reliability have the highest intercorrelation while Material 1
Reliability and Material 2 Reliability have the lowest.
Figure C–7
Scatter chart in Matrix view
How Do I...
C-23
Analyzing simulation results
You can plot scatter charts directly through the Analyze menu, or you can create a
sensitivity chart and choose Sensitivity > Open Scatter Chart to create a chart showing
an exploded view of the effect each assumption has on the target forecast. The result is
similar in form to Figure C–6.
C.4.6.1 Creating scatter charts
To create a scatter chart:
1.
Choose Run > Run Preferences.
2.
Click the Options tab and be sure Store Assumption Values For Analysis is
checked.
3.
Run a simulation in Crystal Ball.
4.
Choose Analyze> Scatter Charts.
(If you are using Crystal Ball in Excel 2007, choose Analyze > View Charts >
Scatter Charts.)
5.
In the Scatter Charts dialog, click the New button.
6.
In the Choose Data dialog, check the box in front of two or more assumptions or
forecasts to include them in the scatter chart.
You can include up to 25 variables in a scatter chart. A
warning message appears if you select more.
Note:
If you try to create a scatter chart including an assumption but Store
Assumption Values For Sensitivity Analysis was not checked in the
Run Preferences dialog, check it, and then reset the simulation and run
the simulation again.
7.
To create a scatter chart in Scatter view, set a single assumption or forecast as the
target. You do not need to set a target to display the chart in Matrix view.
To set a target, check the box in front of the target assumption or forecast, click its
name, and then click Set As Target.
8.
Click OK to create the new scatter chart.
In complex models with lots of assumptions and forecasts, you
might find it helpful to begin by creating a sensitivity chart and then
creating a scatter chart from the data included within it. For example,
you could open a forecast chart and choose Forecast > Open
Sensitivity Chart to view a sensitivity chart. Then, within the
sensitivity chart, you could choose Sensitivity > Open Scatter Chart to
create a scatter chart using that forecast as the target.
Note:
C-24 Crystal Ball Getting Started Guide
Analyzing simulation results
Figure C–8
Scatter chart for the selected target, Scatter view
Here is some information about features shown in Figure C–8:
■
■
■
■
■
■
■
■
You can choose Preferences > Chart Preferences to change the chart title.
To change the number of trials displayed in the plots, choose Preferences > Scatter
> Criteria.
The Y-axis labels indicate the scatter chart target. Each X-axis label indicates the
secondary variable plotted against the target.
The Ordered Fit line shows where the pairwise points would appear if they were
sorted in ascending order. You can choose Preferences > Chart Preferences > Chart
Type to change it to a Linear Regression line, which uses a least-squares technique
to show the linear relationship of the points.
Auto is the default color for all symbols. With color set to Auto, plots are colored
according to the variables included in them:
■
Assumption vs. assumption = green
■
Forecast vs. forecast = dark blue
■
Assumption vs. forecast = dark teal (blue-green)
You can use the Plot Sizer to increase or decrease the size of all plots and the
amount of detail shown within them. To focus on a single plot, drag the Plot Sizer
pointer toward the right to enlarge the plot, and then use the scroll bars to center
it.
In Scatter view, plots move to fill available window space when they are resized.
In Matrix view, plots keep the same NxN configuration. You can scroll to view any
plots that don’t currently appear onscreen.
Frozen forecasts and assumptions are not included in scatter charts.
C.4.6.2 Customizing scatter charts
To customize scatter charts, use the menus in the chart window or click portions of the
chart:
■
Double-click within a plot to open the Chart Preferences dialog.
How Do I...
C-25
Analyzing simulation results
■
Double-click an axis to open the Axis dialog.
■
Double-click outside a plot or axis to open the Scatter Preferences dialog.
C.4.6.3 Adding and removing assumptions and forecasts
When you create a new scatter chart, some variables may be closely related to the
target or other elements in the matrix and some variables may be completely
unrelated. You can follow these steps to remove or change the forecasts and
assumptions included in it:
1.
In the Scatter Chart window, choose Scatter > Choose Data.
2.
In the Choose Data dialog, check the assumptions or forecasts to add to the scatter
chart and uncheck those to remove from the chart.
3.
If you want, set a different target.
4.
Click OK to activate the selected data.
C.4.6.4 Setting scatter preferences
You can set a number of preferences that determine:
■
■
■
■
The scatter view that appears
Whether the scatter chart appears automatically and whether it appears while the
simulation is running or after it stops
The plot size
The number of trials that are plotted relative to the total number of trials in each
simulation
To set scatter preferences:
1.
Choose Preferences > Scatter.
2.
To change how the scatter chart is presented, use the View drop-down list in the
Scatter Preferences dialog:
■
Scatter View (1xN) shows secondary variables plotted against a target.
■
Matrix View (NxN) shows all selected variables plotted against each other.
3.
Use settings in the Window group to determine whether the chart appears
automatically and if so, when it should appear.
4.
To change the size and amount of detail shown in each plot, slide the Plot Sizer left
for smaller plots or right for larger plots.
5.
To determine the number of trials that are plotted relative to the total number of
trials in each simulation, click the Criteria tab to display it.
You can choose a specific number or percentage of trials to display.
6.
Optionally, click Defaults at any time to restore original default settings for the
Scatter Preferences dialog.
7.
When all settings are complete, click OK to activate them and close the dialog.
Note: You can copy scatter charts and paste them into other
applications. For more information, see the Crystal Ball User Manual
and online help.
C-26 Crystal Ball Getting Started Guide
Analyzing simulation results
C.4.6.5 Setting scatter chart preferences
To set scatter chart preferences:
1.
In the scatter chart window, choose Preferences > Chart.
2.
On the General tab of the Chart Preferences dialog, you can set the following
features:
■
Chart title
■
Gridlines
■
Legend
■
Chart effects
For descriptions of each setting while you are viewing the dialog, click Help.
3.
Click the Chart Type tab to:
■
■
■
Choose whether to draw points, and if selected, to choose a symbol, color, and
size for them.
Choose whether to draw a line, and if selected, to choose a line type, color and
size. The Ordered Fit line type shows where pairwise points would appear if
they were sorted in ascending order. The Linear Regression line type uses a
least-squares technique to show the linear relationship of the points.
Choose whether to display correlation coefficients for each plot. These are
computed using the Spearman rank correlation method.
4.
You can use the Axis tab to choose a number format for the chart axes and to
indicate whether to round axis values.
5.
Optional step: You can choose Defaults at any time to restore all settings to their
original default values.
6.
Optional step: If you want to apply the settings to more than one chart, click
Apply To. Then, specify how they should be applied and click OK. Otherwise, go
to step 7.
7.
Click OK to apply the settings on all tabs to the active chart.
How Do I...
C-27
Analyzing simulation results
C.4.7 Using OptQuest charts
Figure C–9
OptQuest Results window, Best Solution view with Performance chart
If OptQuest is available to you, you can view OptQuest charts following an
optimization run. Depending on the view you choose, you can see a graph of
generated solutions, a table of the top solutions generated, or a chart of Efficient
Frontier data.
C.4.7.1 Creating OptQuest charts
To create an OptQuest chart:
1.
Open a model with the data you want to optimize, including at least one decision
variable.
2.
Run an optimization, and then choose Analyze > OptQuest Charts.
(In Excel 2007, choose Analyze > View Charts > OptQuest Charts.)
The default OptQuest Results window appears, as shown in Figure C–9.
3.
Choose View in the results window to choose another view: Solutions Analysis or
Efficient Frontier (if a variable bound was defined for a requirement or constraint
before running the optimization).
For more information, click Help in the menubar or see the OptQuest User Manual.
C-28 Crystal Ball Getting Started Guide
Analyzing simulation results
C.4.7.2 OptQuest chart views
When an optimization is complete, you can view the OptQuest Results window for
information about the current optimization.
4.5.0.1 Best Solution view
Figure C–9 shows Best Solution view results for an OptQuest example model, Product
Mix.xls.
In the Best Solution view, the OptQuest Results window shows a performance chart
plotting best solutions found during analysis. It also shows the single best solution
found for the objective, any requirements, any constraints, and all included decision
variables. To display Best Solution view, choose View > Best Solution in the OptQuest
Results window menubar.
4.5.0.2 Solution Analysis view
In Solution Analysis view, the OptQuest Results window lists the best solutions found
during the optimization. By default, the top 5% of solutions are sorted by the objective
value. Controls at the bottom of the window let you choose how many solutions to
view. Statistics are calculated for the solutions shown. To display Solution Analysis
view, choose View > Solution Analysis in the OptQuest Results window menubar.
Figure 4–8
Solution Analysis view
In the Show The Best group, indicate whether to show a specific number or percentage
of the best solutions or all solutions. Your entry defines the analysis range. For
example, if you want to examine the top 10% of all the solutions, check __ % of
Solutions and enter 10 in the box.
How Do I...
C-29
Analyzing simulation results
You can choose whether to include feasible, infeasible, or all solutions. If you have
requested an Efficient Frontier analysis, you can choose just the solutions for a
particular efficient frontier test point.
When you make your choices, statistics are calculated in the four rows at the bottom:
the minimum, mean, maximum, and standard deviation values for all columns
according to your display selections.
You can click the – or + at the left side of a column heading to condense sections and
show more columns onscreen. You can also click in the right side of a heading to sort
that heading. A small triangle appears. You can click it to sort the column in ascending
or descending order.
4.5.0.3 Efficient Frontier chart
If you have entered a variable requirement or constraint for the optimization, an
Efficient Frontier tab appears with the Performance Chart tab in Best Solution view.
Figure 4–9
Efficient Frontier chart, Best Solution view
The Efficient Frontier window displays a plot of the objective value against the
requirement or constraint that is being tested. The best solution for each test point
appears as a green diamond in the chart. The table below the chart shows the best
solution values for a specific test point. You can choose which best solution to view by
selecting the View Test Point drop-down menu or by clicking the diamond symbol in
the chart. For more information about Efficient Frontier analysis, see the OptQuest User
Manual.
C-30 Crystal Ball Getting Started Guide
Creating reports and extracting data
C.4.8 Setting chart preferences
To change appearance preferences for forecast charts and other charts:
1.
Bring the chart you want to change to the front by clicking on the window or by
opening it with the appropriate Analyze menu command or toolbar button.
2.
In the chart window, choose Preferences > Chart to display the Chart Preferences
dialog.
3.
Change one or more of the Chart Preferences settings.
■
■
■
Use the General tab the change the chart title and overall appearance of the
chart (such as grid, legend, 3D effects, transparency).
Use the Chart Type tab to select the data sets (series) to display in the chart,
the chart type and color of plotted series, marker lines, and more depending
on the chart.
Use the Axis tab, if available, to display chart axes, axis scales, and axis
number formats.
For information on each setting, click the Help button or see the Crystal Ball User
Manual.
4.
Click Apply To to apply these settings to other charts.
5.
When all preferences have been set, click OK.
At any time, you can click the Defaults button to restore original default settings.
You can also use hot keys to set some of these preferences, as described in the next
section.
C.4.8.1 Hot keys for chart preferences
Use the key combinations listed in Table A–12, "Hot keys for chart preferences" to cycle
through settings available in the Chart Preferences dialog. Most of these commands
work on the primary distribution — the theoretical probability distribution for
assumptions, and the generated values for forecasts and overlay charts.
C.5 Creating reports and extracting data
You can create pre-defined and custom reports, including charts, for analysis and
presentation of simulation results. You can also extract Crystal Ball data to Excel for
further analysis.
C.5.1 Creating reports
You can generate pre-defined reports for your simulation or you can create a custom
report with any or all of the following items: Report summary, forecasts, assumptions,
decision variables, overlay charts, trend charts, sensitivity charts.
Note: In Excel 2007, the following instructions apply if you click the
upper half of the Create Report icon.
If you click the lower half, a list of pre-defined reports appears. You
can create a pre-defined or custom report that uses current Options
settings from the Create Report Preferences dialog. To change those
Options settings, choose Report Preferences at the bottom of the report
list or click the top half of the Create Report icon.
How Do I...
C-31
Creating reports and extracting data
C.5.1.1 Creating a report — the basics
To create a report:
1.
Choose Analyze > Create Report.
(In Excel 2007, click the upper half of the Create Report icon.)
The Create Report dialog appears.
2.
Click an icon to choose a pre-defined report:
Assumptions — report summary plus assumption parameters, charts, and
correlations.
Decision Variables — decision variable bounds and variable types.
Forecasts — report summary plus forecast summaries, charts, statistics, and
percentiles.
Full, the default — all sections and details except assumption statistics and
percentiles.
Index — only forecast, assumption, and decision variable summaries.
OptQuest — OptQuest results and statistics, if OptQuest is available to you and
you have just run an optimization.
Custom — displays the Custom Report dialog for report definition.
3.
If you choose Custom:
■
Click the Custom button and follow the steps in Section C.5.1.2, "Creating
custom reports".
If you choose any type but Custom:
■
Click the Options tab to set a location and format for the report.
C.5.1.1.1 Choosing a location and format for your report When you have chosen a report
type or defined a custom report, you can choose a location and format for your report.
Note: In Excel 2007, the following instructions also apply if you click
the lower half of the Create Report icon and then choose Report
Preferences at the bottom of the report list.
To set location and format options:
1.
In the Location group of the Options tab, choose whether to create the report in a
new Excel workbook or the current workbook.
2.
If you want, enter a descriptive name for the new sheet in the Sheet Name field.
3.
In the Formatting group, indicate whether to include the cell location (workbook,
worksheet, and cell address) in the rightmost column of report headers and
whether to include cell comments. By default, these settings are checked.
4.
In the Chart Format group, choose Image to create a Crystal Ball chart or choose
Excel Chart to create an Excel chart.
5.
When all settings are complete, click OK.
C-32 Crystal Ball Getting Started Guide
Creating reports and extracting data
Crystal Ball creates the report as an Excel worksheet. You can modify, print, or save the
report in the same way as any other worksheet. For example, you can choose the File >
Print option for your worksheet model as you would for a normal worksheet.
C.5.1.2 Creating custom reports
To define a custom report:
1.
Choose Analyze > Create Report.
(In Excel 2007, click the upper half of the Create Report icon.)
2.
Click the Custom [Report] icon.
3.
In the Custom Report dialog, check one or more report sections to include in the
report.
4.
For each checked report section, define the report further by checking settings in
the Details group.
As each item is highlighted in the Report Sections group, appropriate settings
appear in the Details group.
5.
For each item checked in Report Sections, choose whether to display all of that
type of item, only selected items, or all open items.
As each item is highlighted in the Report Sections group, appropriate display
settings appear in the group at the upper right of the dialog. This group is labeled
with the name of the current selection in the Report Sections group. For Choose, a
chooser dialog appears so you can check the box in front of each item to display.
6.
When these settings are complete, click OK to close the dialog and return to the
Create Report dialog.
7.
Follow the steps in Section C.5.1.1.1, "Choosing a location and format for your
report" to make settings on the Options tab.
8.
Click OK to produce the report.
C.5.2 Extracting data
The Extract Data command lets you extract assumption and forecast information
generated by a Crystal Ball simulation into an Excel worksheet. Crystal Ball places the
extracted data in a location you select. You can only extract data after you run a
simulation or restore simulation results.
To extract data:
1.
Choose Analyze > Extract Data.
2.
In the Extract Data dialog, choose the appropriate setting in the Select Data To
Extract list.
If you choose Percentiles or Chart Bins, a picker dialog appears so you can choose
which percentiles or how many bins you want to use. For more information, click
the Help button in the dialogs or see these topics: Percentiles dialog and Chart
Bins dialog.
Data types are extracted in the order they appear in the Select Data To Extract list.
You can use the up and down arrows to rearrange the data types.
3.
In the Forecasts group, select forecasts for data extraction (All, Choose, or None).
4.
In the Assumptions group, select assumptions for data extraction (All, Choose, or
None).
How Do I...
C-33
Using the Crystal Ball tools
5.
Click the Options tab to specify a location for the extracted data.
You can click the Defaults button at any time to restore the original settings to both
tabs of the Extract Data dialog.
6.
When both the Data and Options tab settings are complete, click OK.
Crystal Ball extracts the simulation data to the specified location. The extracted data is
arranged as columns of forecasts and assumptions and rows of data. You can sort,
modify, print, or save the data in the same way as any other worksheet. For more
information, click the Help button in the Extract Data dialog.
C.5.3 Printing extracted reports and data
Create Report and Extract Data both export their information into Excel worksheets.
These worksheets may be saved, changed, reviewed, or printed like any other
worksheet. To print the file, choose File > Print.
(In Excel 2007, click the Office button and choose Print.)
C.6 Using the Crystal Ball tools
The Crystal Ball tools can help you build and refine your model. Some of them, such
as the Tornado Chart tool, display different views of your model for analysis and
presentation.
For a list of the tools and how to start them, see Section 4.2, "Other Crystal Ball tools".
As you work with the Crystal Ball tools, click the Help button on each dialog. The
Crystal Ball User Manual provides extensive information about each tool.
C.7 Using Crystal Ball spreadsheet functions
A number of spreadsheet functions are supplied with Crystal Ball for your use. They
are listed in the Insert Function dialog in Excel (in the Crystal Ball category). You can
use one group of functions to enter probability distributions manually into your
worksheet. These are described at the end of Appendix A in the Crystal Ball User
Manual, along with their limitations. A second group, the “Get” functions, can be used
to return certain simulation results (such as the certainty for a particular forecast).
These are described in the Crystal Ball Developer Kit User Manual.
C.8 Using Crystal Ball macros
You can use the macro calls in the Crystal Ball Developer Kit to automate Crystal Ball
data operations in Excel. For information about these macros, see the information at
the end of Chapter 4 in the Crystal Ball User Manual and also in the Crystal Ball
Developer Kit User Manual.
C.9 Using the process capability features
If you use Six Sigma or other quality methodologies, Crystal Ball’s process capability
features, including capability metrics for forecasts, can help you improve quality in
your organization. The following is a summary of these features. For more
information, see the Crystal Ball Process Capability Guide, available online through Start
> Programs > Crystal Ball > Documentation.
C-34 Crystal Ball Getting Started Guide
Using the process capability features
(In Excel 2007, you can also choose Help > Resources > User Manuals to open
documentation within Crystal Ball.)
C.9.1 Activating the process capability features
To activate the process capability features:
1.
Choose Run > Run Preferences or click the Run Preferences toolbar button. Then,
click the Statistics tab in the Run Preferences dialog and check Calculate Capability
Metrics.
Figure C–10
2.
Run Preferences dialog, Statistics tab
Click the Options button on the Statistics tab to choose long-term or short-term
metrics, to add a Z-score shift value, and to choose whether to calculate metrics
from the fitted distribution or forecast values.
C.9.2 Adding specification limits and a target
To add a lower specification limit (LSL), upper specification limit (USL), or target to a
forecast:
1.
Select the forecast cell.
2.
Choose Define > Define Forecast or click the Define Forecast toolbar button.
Figure C–11
3.
Define Forecast dialog with LSL, USL, and Target
Enter limit and target values into appropriate fields on the Define Forecast dialog.
You don’t need to enter a value into each field, but you need to enter at least one
value to generate the capability metrics.
C.9.3 Chart display views and preferences
Forecasts defined with at least one specification limit appear in Split View by default.
To switch the chart back to single view, choose View > Split View in a forecast chart. To
How Do I...
C-35
Using the process capability features
display capability metrics for a forecast, choose View > Capability Metrics in a forecast
chart. For a list of these, see online help or the Crystal Ball Process Capability Guide.
To display or hide marker lines for the limits and target in a forecast chart, choose
Preferences > Chart > Chart Type. Then, check or uncheck LSL, USL, Target at the
bottom of the Marker Lines list.
C-36 Crystal Ball Getting Started Guide
D
Choosing a distribution
D
In this appendix:
■
Which distributions should I use?
■
What parameters should I enter?
This appendix illustrates and summarizes the distributions available for use in
defining Crystal Ball assumptions.
For detailed information on choosing distributions, see Appendix A of the Crystal Ball
User Manual.
D.1 Which distributions should I use?
Choosing a distribution for an assumption is one of the most challenging steps in
creating a Crystal Ball model. Crystal Ball has 21 continuous and discrete distributions
you can use to describe an assumption, including a custom distribution, which can be
a combination of continuous and discrete ranges.
■
■
A continuous distribution assumes all values in the range are possible, so any
range contains an infinite number of possible values. These distributions are
smooth, solid curves.
A discrete probability distribution describes distinct, finite, commonly integer
values. These distributions look like different-height columns set next to each
other.
The first step in choosing a probability distribution is to use any available data for the
variable. In the absence of data, use your understanding of the physics or conditions of
the variable to help select a distribution. Finally, apply reasonable limits to a simple
distribution.
Choosing a distribution D-1
Which distributions should I use?
Table D–1
List of Crystal Ball distributions
Distribution
Conditions
■
Mean value is most likely.
■
It is symmetrical about the mean.
■
■
■
■
■
■
■
■
■
■
■
■
■
■
■
■
■
■
■
■
■
■
Applications
Examples
Natural phenomena.
People’s heights,
reproduction rates,
inflation.
When you know the
minimum, maximum,
and most-likely values,
useful with limited data.
Sales estimates, number
of cars sold in a week,
inventory numbers,
marketing costs.
More likely to be close to the mean than
far away.
Minimum and maximum are fixed.
It has a most likely value in this range,
which forms a triangle with the
minimum and maximum.
Upper and lower limits are unlimited.
Distribution is positively skewed, with
most values near lower limit.
Situations where values Real estate prices, stock
are positively skewed. prices, pay scales, oil
reservoir size.
Natural logarithm of the distribution is
a normal distribution.
When you know the
range and all possible
Maximum is fixed.
values are equally
All values in range are equally likely to likely.
occur.
Minimum is fixed.
A real estate appraisal,
leak on a pipeline.
Discrete Uniform is the discrete
equivalent of the Uniform distribution.
Describes the number
Number of heads in 10
of times an event occurs flips of a coin, likelihood
in a fixed number of
of success or failure.
Trials are independent. Probability is
trials, also used for
the same from trial to trial.
Boolean logic
The Yes-No distribution is equivalent to (true/false or on/off).
the Binomial distribution with one trial.
For each trial, only 2 outcomes are
possible; usually, success or failure.
Minimum and maximum range is
between 0 and a positive value.
Shape can be specified with two
positive values, alpha and beta.
Minimum and maximum are fixed.
It has a most likely value in this range,
which forms a triangle with the
minimum and maximum; betaPERT
forms a smoothed curve on the
underlying triangle.
Possible occurrences in any unit of
measurement is not limited.
Occurrences are independent.
Average numbers of occurrences are
constant from unit to unit.
This flexible distribution can assume
the properties of other distributions.
When shape parameters equal 1, it is
identical to Exponential; when equal to
2, it is identical to Rayleigh.
D-2 Crystal Ball Getting Started Guide
Represents variability
over a fixed range,
describes empirical
data.
Representing the
reliability of a company’s
devices.
When you know the
minimum, maximum,
and most-likely values,
useful with limited data.
Similar to Triangular, but
especially for project
management.
Applied for physical
quantities, such as the
time between events
when the event process
is not completely
random.
Demand for expected
number of units sold
during lead time,
meteorological processes
(pollutant concentrations).
Fatigue and failure tests Failure time in a reliability
or other physical
study, breaking strength
quantities.
of a material in a control
test.
Which distributions should I use?
Table D–1
List of Crystal Ball distributions (Cont.)
Distribution
Conditions
Applications
Examples
Conditions and parameters are
complex. See: Castillo, Enrique. Extreme
Value Theory in Engineering. London:
Academic Press, 1988.
Describes largest value
(Max Extreme) or
smallest value (Min
Extreme) of a response
over time or the
breaking strength of
materials.
Largest or smallest flood
flows, rainfall, and
earthquakes, aircraft loads
and tolerances.
Conditions and parameters are
complex. See: Fishman, G. Springer
Series in Operations Research. NY:
Springer-Verlag, 1996.
Describes growth.
Growth of a population as
a function of time, some
chemical reactions.
■
Midpoint value is most likely.
Econometric data.
Exchange rates.
■
It is symmetrical about the mean.
■
■
■
■
■
■
■
■
■
■
■
■
Approximates the Normal distribution
when degrees of freedom are equal to
or greater than 30.
Distribution describes the time between Describes events that
occurrences.
recur randomly.
Distribution is not affected by previous
events.
Time between incoming
phone calls, time between
customer arrivals.
Conditions and parameters are
complex. See: Fishman, G. Springer
Series in Operations Research. NY:
Springer-Verlag, 1996.
Analyzes other
distributions associated
with empirical
phenomena.
Investigating
distributions associated
with city population sizes,
size of companies, stock
price fluctuations.
Number of possible occurrences is not
limited.
Describes the number
of times an event occurs
in a given interval
(usually time).
Number of telephone calls
per minute, number of
defects per 100 square
yards of material.
Describes the number
of times an event occurs
in a fixed number of
trials, but trials are
dependent on previous
results.
Chance of a picked part
being defective when
selected from a box
(without replacing picked
parts to the box for the
next trial).
Occurrences are independent.
Average number of occurrences is the
same from unit to unit.
Total number of items (population) is
fixed.
Sample size (number of trials) is a
portion of the population.
Probability of success changes after
each trial.
Choosing a distribution D-3
What parameters should I enter?
Table D–1
List of Crystal Ball distributions (Cont.)
Distribution
Conditions
■
■
■
Applications
Models the distribution Number of sales calls
of the number of trials before you close 10
Trials continue to the r th success (trials
or failures until the r th orders.
never less than r).
successful occurrence.
Probability of success is the same from
trial to trial.
Number of trials is not fixed.
■
Number of trials is not fixed.
■
Trials continue until the first success.
■
■
■
Examples
Describes the number
of trials until the first
successful occurrence.
Number of times you spin
a roulette wheel before
you win, how many wells
to drill before you hit oil.
N/A
N/A
Probability of success is the same from
trial to trial.
Very flexible distribution, used to
represent a situation you cannot
describe with other distribution types.
Can be either continuous or discrete or
a combination of both. Used to input an
entire set of data points from a range of
cells.
D.2 What parameters should I enter?
The following table lists the parameter values for each Crystal Ball distribution.
Distributions are listed alphabetically by type (continuous or discrete).
For more information about these parameter values, see the description of each
distribution in Appendix A of the Crystal Ball User Manual. Chapter 4 of the Crystal Ball
Reference Manual lists defaults for each parameter value. (Both of these manuals are
available online through Start > Programs > Crystal Ball in the Windows Start menu or
Help > Crystal Ball in the Excel menubar when Crystal Ball is running.)
Table D–2
Distributions and their parameters
Distribution
Type
Parameter 1
Parameter 2
Parameter 3
Parameter 4
maximum value minimum value
beta (greater
than 0.3, alpha +
beta must be
less than 1000)
Beta
continuous
alpha (greater
than 0.3, alpha +
beta must be
less than 1000)
BetaPERT
continuous
minimum value likeliest value
maximum value
N/A
Exponential
continuous
rate (greater
than 0)
N/A
N/A
N/A
Gamma
continuous
location
scale (greater
than 0)
shape (greater
than 0.05 and
less than 1000)
N/A
D-4 Crystal Ball Getting Started Guide
What parameters should I enter?
Table D–2
Distributions and their parameters (Cont.)
Distribution
Type
Parameter 1
Parameter 2
Parameter 3
Parameter 4
Logistic
continuous
mean value
scale (greater
than 0)
N/A
N/A
Lognormal
continuous
location
mean value
standard
deviation value
N/A
Maximum
extreme
continuous
likeliest
scale (greater
than 0)
N/A
N/A
Minimum
extreme
continuous
likeliest
scale (greater
than 0)
N/A
N/A
Normal
continuous
mean value
standard
deviation value
N/A
N/A
Pareto
continuous
location (greater shape (greater
than 0)
than 0.05)
N/A
N/A
Student’s t
continuous
midpoint
degrees of
freedom
(integer
between 1 and
30, inclusive)
N/A
Triangular
continuous
minimum value likeliest value
maximum value
N/A
Uniform
continuous
minimum value maximum value
N/A
N/A
Weibull
continuous
location
scale (greater
than 0)
shape (greater
than 0.05)
N/A
Binomial
discrete
probability
(between 0 and
1)
trials (a whole
number greater
than 0 and less
than 1000)
N/A
N/A
Discrete
Uniform
discrete
minimum
(integer)
maximum
(integer)
N/A
N/A
scale (greater
than 0)
Choosing a distribution D-5
What parameters should I enter?
Table D–2
Distributions and their parameters (Cont.)
Distribution
Type
Parameter 1
Parameter 2
Parameter 3
Parameter 4
Geometric
discrete
probability
(between 0 and
1)
N/A
N/A
N/A
Hypergeometric
discrete
success
trials (whole
number less
than
population)
population
(whole number
greater than 0
and less than
1000)
N/A
Negative
binomial
discrete
probability
(between 0 and
1)
shape (whole
number greater
than 0 and less
than 1000)
N/A
N/A
Poisson
discrete
rate value
(between 0 and
1000)
N/A
N/A
N/A
Yes-No
discrete
probability
(between 0 and
1)
N/A
N/A
N/A
Custom
custom
See Appendix A
of the current
Crystal Ball User
Manual.
N/A
N/A
N/A
D-6 Crystal Ball Getting Started Guide
Index
Numerics
2D Simulation tool,
4-7
A
alternate parameters, C-4
analysis
solution, C-29
Analyze menu, A-2
analyzing simulations, C-10
analyzing time-series data, 4-8
assumption charts, C-21
creating, C-21
customizing, C-22
assumptions
correlating, C-4
defining, 3-2, C-3
B
Batch Fit tool, 4-6
Bootstrap tool, 4-6
C
CB Predictor, 4-8
Cell menu, A-1
cell preferences, C-6
cell references, C-3
cells
freezing, C-8
selecting data, C-6
certainty grabbers, C-11
certainty level, 2-6, 3-19
chart preferences, C-31
hot keys, A-8
charts
assumption, C-21
customizing, 3-21, C-31
forecast, C-11
interpreting, 3-17
OptQuest, 4-4, C-28
overlay, 4-1, C-14
scatter, 4-3
sensitivity, 4-3, C-16
trend, 4-2, C-19
choosing distributions, D-1
clearing data cells, C-7
Compare Run Modes tool, 4-7
compatibility, file, B-7
continuous distributions, D-1
Control Panel, Crystal Ball, 2-8, C-9
conventions, manual, 1-2
conversion, file, B-7
copying data cells, C-7
correlating assumptions, C-4
Correlation Matrix tool, 4-6
creating
assumption charts, C-21
overlay charts, C-14
reports, C-31
sensitivity charts, C-17
trend charts, C-19, C-28
Crystal Ball
system requirements, 1-1
using, C-1
Crystal Ball Control Panel, 2-8, C-9
Crystal Ball menus, A-1
Crystal Ball toolbar buttons, A-1, B-1
Crystal Ball tools, 4-6, C-34
Crystal Ball, benefits, 2-1
custom distributions, 3-8
custom reports, C-33
customizing
assumption charts, C-22
charts, 3-21, C-31
forecast charts, C-13
overlay charts, C-15
sensitivity charts, C-18
trend charts, C-20
D
data
extracting, 4-5, C-33
printing, C-34
Data Analysis tool, 4-6
data cells
copying, pasting, clearing, C-7
Decision Table tool, 4-7
decision variables
defining, C-5
Index-1
M
optimizing, 4-8
defining
assumption cells, C-3
assumptions, 3-2
decision variables, C-5
forecasts, 3-15, C-5
models, C-3
discrete distributions, D-1
distribution fitting, C-4
Distribution Gallery, C-5
Distribution Gallery menus, A-2
Distribution Gallery, All, 3-9
Distribution Gallery, Basic, 3-4
distributions
binomial, 3-7
choosing, D-1
continuous, D-1
custom, 3-8
discrete, D-1
list, D-1
normal, 3-12
parameters, D-4
triangular, 3-6
truncating, 3-15
uniform, 3-4
macros, using, C-34
manual conventions, 1-2
marker lines, C-35
menus
Analyze, A-2
Cell, A-1
Crystal Ball, A-1
Distribution Gallery, A-2
Help, A-2
Run, A-2
models, defining, C-3
Monte Carlo simulation, 2-7
N
normal distributions, 3-12
O
online help, 1-3
optimizing decision variables,
OptQuest, 4-8
OptQuest charts, 4-4, C-28
overlay charts, 4-1, C-14
creating, C-14
customizing, C-15
E
extracting data, 4-5, C-33
P
F
file compatibility and conversion,
fitting distributions to data, C-4
forecast charts, C-11
customizing, C-13
views, C-12
Forecast preferences, C-6
forecasts, defining, 3-15, C-5
freezing cells, C-8
functions, spreadsheet, C-34
Futura Apartments model, 2-4
G
grabbers, certainty, C-11
H
Help menu, A-2
help, online, 1-3
hot keys for charts, A-8
I
interpreting charts, 3-17
L
lines, marker, C-35
Index-2
4-8
B-7
Parameters menu, 3-10
parameters, alternate, C-4
parameters, distribution, D-4
pasting data cells, C-7
predicting trends, 4-8
preferences
cell, C-6
chart, C-31
forecast, C-6
run, C-7
printing, reports and data, C-34
process capability features, 4-7, C-34
profit, determining, 2-6
Q
quality features, 4-7, C-34
R
reports, 4-5
creating, C-31
custom, C-33
printing, C-34
requirements, system, 1-1
resetting simulations, C-9
restoring results, C-9
results, saving and restoring,
Run menu, A-2
Run preferences, C-7
C-9
running simulations,
2-5, 3-17, C-7
S
saving results, C-9
scatter charts, 4-3
creating, C-24
customizing, C-25
Scenario Analysis tool, 4-7
screen capture notes, 1-3
selecting data cells, C-6
sensitivity charts, 4-3, C-16
creating, C-17
customizing, C-18
views, C-17
simulations
analyzing, C-10
running, 2-5, 3-17, C-7
starting, C-8
stopping and resetting, C-9
Six Sigma features, 4-7, C-34
Solution Analysis window, C-29
Split View, C-35
spreadsheet functions, C-34
starting simulations, C-8
stopping simulations, C-9
Strategic Finance Setup tool, 4-7
support, technical, 1-3
system requirements, 1-1
T
technical support, 1-3
time-series analysis, 4-8
toolbar buttons, A-1, B-1
tools
2D Simulation, 4-7
Batch Fit, 4-6
Bootstrap, 4-6
Compare Run Modes, 4-7
Correlation Matrix, 4-6
Crystal Ball, C-34
Data Analysis, 4-6
Decision Table, 4-7
Scenario Analysis, 4-7
Strategic Finance Setup, 4-7
Tornado Chart, 4-7, C-16
Tornado Chart tool, 4-7, C-16
trend analysis, 4-8
trend charts, 4-2, C-19
creating, C-19, C-28
customizing, C-20
views, C-20
triangular distributions, 3-6
truncating distributions, 3-15
U
uniform distributions, 3-4
user manual conventions, 1-2
using
Crystal Ball, C-1
macros, C-34
V
views
forecast chart, C-12
sensitivity chart, C-17
split, C-35
trend chart, C-20
Vision Research model, 3-2
W
Welcome screen, 2-2
windows
Solution Analysis, C-29
Index-3
Index-4