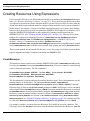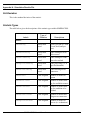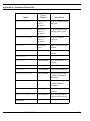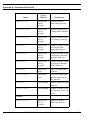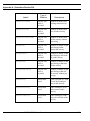
1
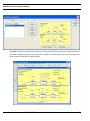
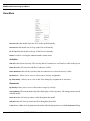
User’s Manual
SIMPROCESS
Release 4
Copyright © 2007 CACI Products Company
January 2007
All rights reserved. No part of this publication may be reproduced by any
means without written permission from CACI.
The information in document is believed to be accurate in all respects.
However, CACI cannot assume the responsibility for any consequences
resulting from the use thereof. The information contained herein is subject
to change. Revisions to this publication or new editions of it may be issued
to incorporate such change.
SIMPROCESS is a registered trademark of CACI Products Company.
Table of Contents
Organization of the SIMPROCESS Documentation Set ....................... 11
Part A
SIMPROCESS Functions and Features .................................................. 13
CHAPTER 1
Process Modeling and Analysis with SIMPROCESS................. 14
What is SIMPROCESS? ............................................................ 16
How Do You Use SIMPROCESS? ............................................ 17
SIMPROCESS Editions ............................................................. 18
SIMPROCESS Terminology and Menus ................................. 19
CHAPTER 2
SIMPROCESS Basics .................................................................. 63
SIMPROCESS Components ...................................................... 64
Using the Layout Toolbar to Create Activities ........................ 69
Generate Activity ........................................................................ 75
Delay Activity .............................................................................. 78
Dispose Activity........................................................................... 80
Defining an Entity ....................................................................... 81
Defining Resources and Processes............................................. 84
Simulation Setup ......................................................................... 88
Running a Simulation ................................................................. 91
Standard Report ......................................................................... 93
CHAPTER 3
Statistical Modeling Constructs ................................................... 94
Random Number Generation and Standard Distributions .... 96
User Defined Distributions......................................................... 98
Run Settings.............................................................................. 109
SIMPROCESS User’s Manual
3
Table of Contents
CHAPTER 4
Activity Modeling Constructs..................................................... 118
Entity-Related Activities .......................................................... 120
Entity Control Activities .......................................................... 129
CHAPTER 5
Resource Modeling Constructs.................................................. 147
Resources and Simulation ........................................................ 148
Defining Resources ................................................................... 149
Adding Resource Requirements to Activities......................... 152
Explicitly Getting and Freeing Resources .............................. 155
Replenishing Consumable Resources...................................... 159
Preempting Lower Priority Entities........................................ 161
CHAPTER 6
Graphical Modeling Constructs................................................. 162
Background Text....................................................................... 163
Background Graphics............................................................... 167
Importing Graphics Image Files ............................................. 168
Post Simulation Animation ...................................................... 172
CHAPTER 7
Activity-Based Costing ............................................................... 176
ABC and SIMPROCESS.......................................................... 177
Benefits of ABC with SIMPROCESS ..................................... 178
How to Use ABC in SIMPROCESS ........................................ 179
CHAPTER 8
Output Reports............................................................................ 185
Standard Report ....................................................................... 186
SIMPROCESS User’s Manual
4
Table of Contents
Custom Statistics....................................................................... 188
Real-Time Plots ......................................................................... 200
Custom Plots.............................................................................. 209
Expression Plots ........................................................................ 220
Simulation Results File ............................................................. 221
Part B
Advanced SIMPROCESS Functions and Features.............................. 222
CHAPTER 9
Reusable Templates and Libraries ............................................ 223
Library Concepts ...................................................................... 224
Defining and Editing Templates .............................................. 225
Editing Templates ..................................................................... 234
Advantage of Templates Over Copy/Paste ............................. 236
CHAPTER 10
Customizing a Model with Attributes and Expressions ............ 237
Introduction to Attributes and Expressions ........................... 239
Using Attributes in SIMPROCESS......................................... 241
User Defined Attributes............................................................ 242
Assign Activity........................................................................... 250
Variable Resource Usage.......................................................... 252
Writing Expressions ................................................................. 254
Evaluate (Evl) Function............................................................ 263
Expression Activation Events .................................................. 264
Attribute Value Initialization .................................................. 269
Example: Batching Entities Based on Weight........................ 270
Getting and Freeing Resources Using Expressions ............... 281
Creating Resources Using Expressions................................... 284
Changing Resource Capacity With Expressions.................... 291
Setting Maximum Resource Wait With Expressions ............ 292
SIMPROCESS User’s Manual
5
Table of Contents
User-Defined Functions ............................................................ 293
Dynamic Labels......................................................................... 294
Interfacing With A Database ................................................... 296
Interfacing With A Spreadsheet .............................................. 303
Accessing Statistics During Simulation................................... 308
Creating and Controlling Plots With Expressions................. 315
Summary.................................................................................... 318
CHAPTER 11
More Advanced Model Building................................................ 319
Defining a More Complex Generate Activity......................... 320
Resource Downtime .................................................................. 343
Event Logs ................................................................................. 362
Part C
Advanced SIMPROCESS Tools............................................................. 366
CHAPTER 12
Advanced Data Analysis............................................................. 367
An Introduction to Data Analysis and Modeling ................... 369
Why Statistical Simulation Experiments? .............................. 372
SIMPROCESS Statistical Distributions ................................. 373
CHAPTER 13
SIMPROCESS Database ........................................................... 375
Committing Results to the Database ....................................... 376
System, Design, and Scenario .................................................. 377
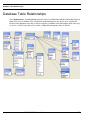
Database Table Relationships.................................................. 379
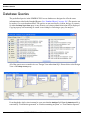
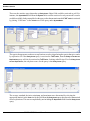
Database Queries ...................................................................... 380
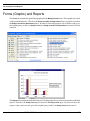
Forms (Graphs) and Reports................................................... 382
Launch Database Application.................................................. 384
SIMPROCESS User’s Manual
6
Table of Contents
SIMPROCESS and Other Databases ..................................... 385
CHAPTER 14
Experiment Manager ................................................................. 387
Defining Experiments ............................................................... 388
Running Experiments............................................................... 395
Experiment Operation.............................................................. 397
CHAPTER 15
OptQuest for SIMPROCESS ..................................................... 401
Overview of OptQuest for SIMPROCESS ............................. 402
Optimization Setup ................................................................... 404
Running an Optimization......................................................... 416
Tips and Suggestions ................................................................ 423
OptQuest Demonstration Models............................................ 429
CHAPTER 16
SIMPROCESS Dashboards....................................................... 431
Defining Dashboards ................................................................ 432
Assigning Dashboards .............................................................. 442
Displaying Dashboards............................................................. 447
Appendices ............................................................................................... 451
APPENDIX A
Importing Version 2.2.1 Models ............................................... 452
Import Procedures .................................................................... 453
Preparing Your Model For Import ......................................... 454
Graphical Import Results ........................................................ 457
Properties Import Results ........................................................ 464
SIMPROCESS User’s Manual
7
Table of Contents
Importing Document Files ....................................................... 467
APPENDIX B
Activity Summary Table ............................................................ 468
APPENDIX C
SIMPROCESS File Structure .................................................. 471
APPENDIX D
Statistical Distributions ............................................................. 477
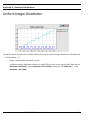
Uniform Distribution ................................................................ 479
Normal Distribution ................................................................. 480
Triangular Distribution............................................................ 481
Exponential Distribution .......................................................... 482
Gamma Distribution................................................................. 483
Beta Distribution....................................................................... 484
Erlang Distribution................................................................... 485
Weibull Distribution ................................................................. 486
Lognormal Distribution ........................................................... 487
Poisson Distribution.................................................................. 488
Hyper Exponential Distribution .............................................. 489
Uniform Integer Distribution .................................................. 490
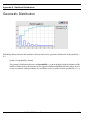
Geometric Distribution............................................................. 491
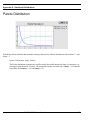
Pareto Distribution ................................................................... 492
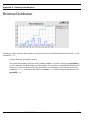
Binomial Distribution ............................................................... 493
Negative Binomial Distribution ............................................... 494
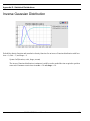
Inverse Gaussian Distribution ................................................. 495
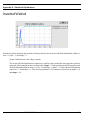
Inverted Weibull ....................................................................... 496
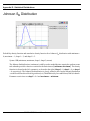
Johnson SB Distribution .......................................................... 497
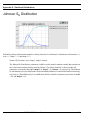
Johnson SU Distribution .......................................................... 498
Log-Logistic Distribution ......................................................... 499
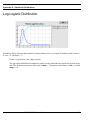
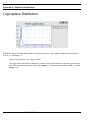
Log-Laplace Distribution ......................................................... 500
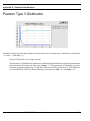
Pearson Type V Distribution ................................................... 501
SIMPROCESS User’s Manual
8
Table of Contents
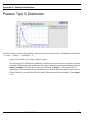
Pearson Type VI Distribution.................................................. 502
Random Walk Distribution...................................................... 503
Empirical Distribution ............................................................. 504
APPENDIX E
Statistical Tools Glossary .......................................................... 505
APPENDIX F
SIMPROCESS System Attributes and Methods ...................... 511
System Attributes...................................................................... 512
SIMPROCESS System Methods ............................................. 521
System Method Examples ........................................................ 551
SIMPROCESS Color Table ..................................................... 576
APPENDIX G
External Event Files.................................................................. 577
General Rules for Event Files .................................................. 578
Event Record Description ........................................................ 580
Examples.................................................................................... 582
APPENDIX H
Simulation Results File............................................................. 583
Format of the Simulation Results File .................................... 584
APPENDIX I
UML Interfaces ......................................................................... 592
Exporting to UML .................................................................... 594
Rose Use Cases .......................................................................... 596
SIMPROCESS User’s Manual
9
Table of Contents
APPENDIX J
Running Models Without GUI ................................................. 599
APPENDIX K
SIMPROCESS and External Java Classes .............................. 602
Java Extension Mechanism...................................................... 603
Model-Specific Java Additions ................................................ 604
ext Directory .............................................................................. 605
SIMPROCESS User’s Manual
10
Organization of the SIMPROCESS
Documentation Set
The SIMPROCESS documentation set consists of three manuals:
•
•
•
Getting Started With SIMPROCESS
SIMPROCESS User’s Manual
SIMPROCESS Metadata Manual
Getting Started
The Getting Started With SIMPROCESS manual is a must for first time SIMPROCESS users.
This manual can also be used for evaluation purposes. Chapter 1 provides an overview of
Process Modeling and Analysis and the SIMPROCESS product. Chapter 2 provides system
requirements and installation instructions. Chapters 3 and 4 of the Getting Started With
SIMPROCESS manual provide a tutorial, and Chapter 5 provides a description of the
demonstration and reference models.
User’s Manual
The User’s Manual can be opened directly from the Help/SIMPROCESS Manuals menu. It is
SIMPROCESS User’s Manual
11
divided into three parts. Part A is an excellent reference for beginners and casual users. This part
contains detailed documentation of the basic and intermediate functions of SIMPROCESS. Chapters
1 and 2 provide SIMPROCESS terminology and basics. Chapter 3 provides a detailed description of
SIMPROCESS Statistical Constructs and their use. Chapter 4 describes in detail how the
SIMPROCESS Activity Modeling blocks are used. Chapter 5 describes the use of Resources. Graphical
Modeling Constructs are covered in Chapter 6. Chapter 7 is dedicated to Activity-based Costing, and
Chapter 8 covers the Output Reports for analysis.
Part B is a reference intended for advanced users of SIMPROCESS. This part contains detailed
documentation of the programming and library management functions in SIMPROCESS Professional
Edition. Chapter 9 documents Reusable Templates and Library Management. Chapter 10 covers the
Advanced SIMPROCESS constructs such as attributes, expressions, and time stamps. Chapter 11
wraps-up the advanced features of SIMPROCESS with descriptions of the complex features of the
Generate activity and Downtime Schedules for Resources.
Part C describes the integrated statistical tools included with SIMPROCESS Professional. Chapter
12 of this manual provides an introduction to data analysis and ExpertFit. Chapter 13 covers using
the SIMPROCESS Database, while Chapter 14 discusses using the Experiment Manager. How to do
optimization using OptQuest is in Chapter 15, and Chapter 16 discusses SIMPROCESS Dashboards.
Metadata Manual
The Metadata Manual describes how to build and edit SIMPROCESS metamodels, assign metamodels
to a SIMPROCESS model, and enter metadata in a SIMPROCESS model.
SIMPROCESS User’s Manual
12
Part A
SIMPROCESS Functions and Features
The chapters in Part A describe the basic functions and features of SIMPROCESS.
SIMPROCESS User’s Manual
13
CHAPTER 1
Process Modeling and Analysis with
SIMPROCESS
The goal of Process Modeling is to create a simplified but useful model of a business
enterprise. The enterprise can be a small work group or development team, a particular
division, a related set of departments, or even an entire company. The model allows an analyst
to study the Processes in a business in order to:
•
•
•
•
•
Determine bottlenecks or wasted effort
Devise revisions to the Process to correct performance problems
Select Process designs that give the best results
Provide cost justification
Establish performance targets for the new Process implementation.
Many types of tools and techniques are available for Process Modeling. Frequently, a simple
diagram or flowchart can expose the obvious redundancies, unnecessary work, and
inefficiencies in a given Process. Tools which provide simple diagramming of a Process are
called static modeling tools. However, to expose less obvious bottlenecks and costs intrinsic
to the Process requires information about the resources employed in the Process,
measurements of the Processing capacity of the resources, and some measure of the expected
workflow through the Process.
Many Process modeling tools today do not allow a quantified analysis of the Process under
study. Some of those do not take into account the:
SIMPROCESS User’s Manual
14
•
•
•
•
Time-varying nature of many Processes
Non-linear interactions among elements of a Process
Random behavior of most real Processes
Unexpected events in the business environment
The bottom line is that most Processes are not well characterized by deterministic, mathematical
models. A dynamic business Process modeling tool, which can simulate the behavior of the Process
as it responds to the events occurring in the business environment, is required to analyze time-varying
business processes.
Why Dynamic Modeling?
A computerized dynamic model simulates the flow of materials and information through the Process.
The dynamic model accounts for the random variations in how work is done and the way materials
(and information) flow through the real world. Simulation offers several advantages over a simple
pictorial abstraction of a business Process. SIMPROCESS employs discrete event simulation to capture
the time-varying nature of the Process under study.
SIMPROCESS advantages include:
•
First, the analyst can correlate the data produced by the model with measurements taken from
the real Processes to increase certainty that the model has adequately captured the essential
features of the real Process.
•
Second, the model will generate quantified Process measurements such as: excess capacity
or bottlenecks, the time it takes work items to flow through the Process, and the percentage
of time expended in value-adding Processes versus non-value-adding Processes.
•
Third, the model allows the analyst to evaluate, in quantified terms, the effects of
reengineering the Process.
SIMPROCESS User’s Manual
15
What is SIMPROCESS?
What is SIMPROCESS?
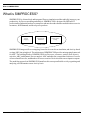
SIMPROCESS is a hierarchical and integrated Process simulation tool that radically improves your
productivity for Process modeling and analysis. SIMPROCESS is designed for BPR and IT
professionals of industrial and service enterprises who need to reduce the time and risk it takes to service
customers, fulfill demand, and develop new products.
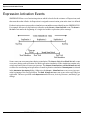
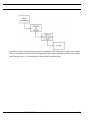
Process
Mapping
Event-driven
Simulation
Activity-based
Costing
SIMPROCESS
SIMPROCESS integrates Process mapping, hierarchical event-driven simulation, and Activity-based
costing (ABC) into a single tool. The architecture of SIMPROCESS provides an integrating framework
for ABC. The building blocks of SIMPROCESS are Processes, resources, entities (flow objects),
activities, ABC, and dynamic Process analysis. ABC embodies the concept that a business is a series
of inter-related Processes, and that these Processes consist of Activities that convert inputs to outputs.
The modeling approach in SIMPROCESS manifests this concept and builds on it by organizing and
analyzing cost information on an Activity basis.
SIMPROCESS User’s Manual
16
How Do You Use SIMPROCESS?
How Do You Use SIMPROCESS?
SIMPROCESS allows you to create an abstract model of a Process under study. You produce a
computer model of a business Process and documentation (diagrams and descriptions) to be printed.
SIMPROCESS is a dynamic modeling tool that simulates the flow of entities through the defined
Process. Entities could be:
•
•
•
•
•
•
proposals
orders
invoices
customers
work-in-Process
patients.
Items, Entities, that a Process receives, acts upon, or produces should be included in the definition of
the business Process. Items flow from one Process step to the next and at each step some task is
performed. The Resources, such as people, machines, or information required to complete the tasks
are also included in the business model.
SIMPROCESS generates valuable information about the Activities, Entities, and Resources in the
model. This data is used to validate the Process model. The generated statistics and reports are used
to determine where the Process could be improved. SIMPROCESS allows you to evaluate alternatives
and different management policies. SIMPROCESS helps a team decide which changes to a business
Process will provide the most benefits.
SIMPROCESS User’s Manual
17
SIMPROCESS Editions
SIMPROCESS Editions
SIMPROCESS has four editions:
•
Professional Edition - contains all the features and capabilities of SIMPROCESS. There are no
limits on model size for models built with SIMPROCESS Professional Edition.
•
University Edition - also contains all the features and capabilities of SIMPROCESS. However,
model sizes are limited to no more than 50 Processes and Activities.
•
Demonstration Edition - models are limited to no more than 25 processes and activities, 5
entity types, and 5 resource types. Also, none of the advanced features are accessible.
•
Runtime Edition - contains all the features and capabilities of SIMPROCESS except the ability
to save. There are no limits on model size, but models built or modified in this edition cannot
be saved.
SIMPROCESS User’s Manual
18
SIMPROCESS Terminology and Menus
SIMPROCESS Terminology and Menus
SIMPROCESS Terminology
This manual uses the following words and definitions in its description of SIMPROCESS.
Activities. An Activity is a basic step in a model where an operation is performed on an entity. Examples
of Activities are Generate, Delay, and Dispose. An Activity may or may not involve passage of time
or requirements.
Attributes are system and user-defined variables of model elements whose value can change during
the course of a simulation run. Attributes may be used to alter the behavior of a Process by changing
their value during a simulation. They can also be used to communicate information (such as system
time) between two Processes in a model or store data collected during a simulation run.
Connectors link Activities and Processes together and are paths used by entities to flow through the
model. Connectors can have delay times.
Cycle time. An Entity’s cycle time is the sum of the Processing times and delays it encounters as it
is processed in the model.
Entities represents people, goods, or information. Most are produced as a result of a Process or Activity.
Entities are generally created at the Generate Activity, although other Activities (e.g., Batch, Assemble)
may produce entity instances as well. Entities must enter a Dispose Activity to ensure statistics
collection.
Hierarchical Processes. The concept of a Process provides hierarchical modeling capabilities. A
Process is a collection of Activities and sub-Processes organized as a model network.
Layout contains graphical representations of the Activities, Processes, and Connectors that make up
a SIMPROCESS model. The Entities only appear on the layout while the simulation is running. The
layout can be made to resemble the physical layout of a system, or it can be closer in appearance to
a flow diagram.
Model is a representation of the system being studied. It is not intended to be an exact duplicate of
the system, but rather a simplified version that captures the relevant features.
Pads are small triangular graphic objects located along the border of an Activity or Process. Pads are
used for attaching connectors to the inputs and outputs of the Activity/Process. Entities enter and exit
Activities through input and output pads.
Alternative Process/Sub-Process. Alternative Processes define alternative behaviors or flows of a
SIMPROCESS User’s Manual
19
SIMPROCESS Terminology and Menus
Process. Multiple alternatives can be associated with a Process, but only one can be active at a time.
Resources are the agents required to perform an Activity. People, computers, and trucks are all
examples of Resources. Resources may be consumable (e.g., oil or paper) or reusable (e.g., trucks).
Simulation is defined as the reproduction of the dynamic and random behavior of a business Process
with the goal of quantifying some key characteristics of the business Process.
Templates of Activities, Processes, and Resources can be stored in a Library for reuse.
SIMPROCESS Menus
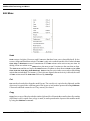
File Menu
New
creates a new model file.
Open loads a previously saved model. If the model directory (see Save As... below) does not exist, it
is created during the Open process.
contains a list of recently opened models. The first item is Clear Menu, which removes
all recently opened models from the Open Recent menu.
Open Recent
Close
closes the active model.
Properties
Group ID
opens a dialog that tracks the edit history of a model.
controls the Group ID of a model. There are two submenu items:
• Assign Group ID
• Clear Group ID
SIMPROCESS User’s Manual
20
SIMPROCESS Terminology and Menus
Assign Group ID will be enabled if no Group ID is assigned to the model; if one is assigned, Clear
Group ID will be enabled. No dialog is displayed by either action. If used, the Group ID is created
internally by SIMPROCESS. Assigning a Group ID facilitates collaborative work on a model
using a master model and templates placed into a Library. (See “Reusable Templates and
Libraries,” beginning on page 223 for more information on templates and Libraries.)
When a model is saved, SIMPROCESS assigns it an internal model ID. Each time a Process or
Activity is added from a template in a Library, the model ID is checked against one stored with
the template to determine whether the template was originally created from that same model. If
it was, the creation of Attributes, Resources, Entities and other items is suppressed based on the
presumption that they will already be present in the model. Each time a copy of a model is saved
using the Save As command, the internal model ID is changed. Saving a copy of the model to another
name to give to team members involved in collaborative model development is therefore not ideal.
Any templates they might create from the copy would not share the model ID of the original. This
results in duplication of Attributes, Resources, Entities and other items into the master model when
the team member's efforts are merged back into it via Library templates. The Group ID identifies
models created with Save As as belonging to the master model (using Assign Group ID on an open
model causes that model to become a master model). Save As does not change the Group ID. Thus,
if the master model has a Group ID assigned, every copy of the master model made via Save As
will carry the same Group ID. When a template is placed into a Library from any Process or
Activity, the Group ID will be stored in the template along with the model ID. When a template
is added to a model, the Group ID is checked before the model ID to avoid duplication of Attributes
and other items. Only if no Group ID is present in the model or if the Group ID of the model
and the Group ID of the template do not match will the model ID check be performed.
Save saves the model. Saving a model that has not previously been saved will execute Save As... so
the model can be named.
NOTE: It is a good idea to save a model any time you make changes to it and to save a model under
a different name any time you extensively change a model. SIMPROCESS saves your models with
the extension.spm and at the same time also saves a backup with the extension .bck. To save a new
model or to save an existing model under a new name, use File/Save As…. For information on automatic
saving, see “Other Preferences” on page 33.
Save As… is used to save a model for the first time, or to save a model with a new name. Save As...
creates a directory for the model (referred to as the model directory) that has the model name without
extension and is in the same directory as the model file. The model directory is the default location
for input and output files of various types and is the preferred location for imported images (see
“Importing Graphics Image Files,” beginning on page 168) and external Java classes (see
“SIMPROCESS and External Java Classes,” beginning on page 602). Note that when performing Save
As... the complete contents of the previous model directory are copied to the new model directory.
Import
SIMPROCESS User’s Manual
21
SIMPROCESS Terminology and Menus
Version 2.2.1 Model… imports a SIMPROCESS version 2.2.1 or 2.2.2 model. Due to changes in the
graphical coordinate system from earlier versions of SIMPROCESS to the current version, some
cleanup will be required. See “Importing Version 2.2.1 Models,” beginning on page 452 for more
information.
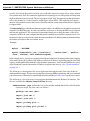
XPDL Model... imports an XPDL model. (See http://www.wfmc.org/standards/docs.htm for
information on XPDL.) At a minimum, the following must be true of the XPDL model for the import
to SIMPROCESS to be successful.
•
The XPDL model must validate against the XPDL 1.0 schema at http://www.wfmc.org/
standards/docs/TC-1025_schema_10_xpdl.xsd, or the XPDL 2.0 schema at http://
www.wfmc.org/standards/docs/TC-1025_bpmnxpdl_24.xsd.
•
There must be at least one WorkflowProcess element with the AccessLevel attribute
set to PUBLIC.
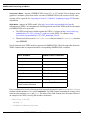
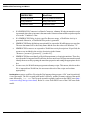
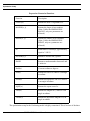
Not all elements of an XPDL model are imported to SIMPROCESS. The following table shows the
XPDL elements that are imported and their corresponding SIMPROCESS constructs.
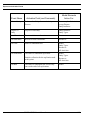
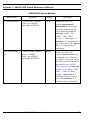
XPDL Element
SIMPROCESS Construct
WorkflowProcess
Process
ActivitySet
Process
Activity
Activity
Transition
Connector
DataField
Global Entity Attribute
FormalParameter
Global Entity Attribute
Performer
Resource
TypeDeclaration
Entity Type
SimulationInformation/
TimeEstimation/Duration
Activity Delay Time
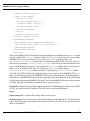
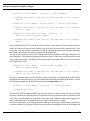
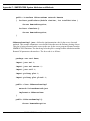
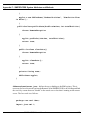
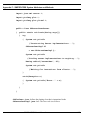
If x-y coordinates for Activity elements are to be imported, they must be in an ExtendedAttribute
element with the attribute Name set to Coordinates. The child element containing the x and y values
must have the attributes xpos and ypos. The name of the child element does not matter. Below is
an example of an XPDL Activity that includes coordinates.
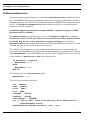
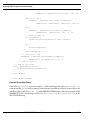
- <Activity Id="9">
<Route />
- <TransitionRestrictions>
SIMPROCESS User’s Manual
22
SIMPROCESS Terminology and Menus
- <TransitionRestriction>
- <Split Type="AND">
- <TransitionRefs>
<TransitionRef Id="1" />
<TransitionRef Id="38" />
<TransitionRef Id="2" />
</TransitionRefs>
</Split>
</TransitionRestriction>
</TransitionRestrictions>
- <ExtendedAttributes>
<ExtendedAttribute Name="Coordinates">
<xyz:Coordinates xpos="572" ypos="389" />
</ExtendedAttribute>
</ExtendedAttributes>
</Activity>
The type of SIMPROCESS activity that is created is based primarily on whether or not a Route element
exists as a child of the Activity element. If there is no Route element, then the corresponding
SIMPROCESS activity is a Delay activity. If there is no Route element and there is an
Implementation/SubFlow element, the corresponding SIMPROCESS Activity is a Process.
Other factors concerning TransitionRestrictions come into play when determining other
types of SIMPROCESS Activities. As an example, the Activity element above would result in a
Split Activity in SIMPROCESS. This is because there is a Split element within a
TransitionRestriction element, and there is more than one TransitionRef element.
Note that if the XPDL model being imported was previously exported from SIMPROCESS 4.3 or
higher, the model may contain some SIMPROCESS unique information that will help appearance.
During import, if SIMPROCESS detects unique information from other applications, this information
will be transferred to the new SIMPROCESS model. Thus, if the SIMPROCESS model is later exported
to XPDL, that application unique information will be exported as well.
Background... imports a Graphics Interchange Format (GIF), Joint Photographic Experts Group (JPEG
or JPG), or Portable Network Graphics (PNG) file for use as a background image.
Export
Graphics Image File…
creates a JPEG image of the current layout.
Simulation Results... exports the results of the current model to a tab-delimited file. The data from all
reports selected for the current model will be written to this file. The file can be opened with a text
editor or spreadsheet.
SIMPROCESS User’s Manual
23
SIMPROCESS Terminology and Menus
Activity List...
outputs the Process and Activity hierarchy to an ASCII file.
outputs the model to a UML-compatible file. This feature is disabled in the
SIMPROCESS Runtime version. See “UML Interfaces” on page 592.
UML Activity Model
outputs the model to an XPDL 2.0 compatible file that follows the schema at http://
www.wfmc.org/standards/docs/TC-1025_bpmnxpdl_24.xsd. (See http://www.wfmc.org/standards/
docs.htm for information on XPDL.) Exported XPDL models will contain some SIMPROCESS unique
information. This information is only useful to SIMPROCESS and should be ignored by other
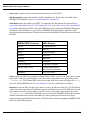
applications importing the model. The table below shows how SIMPROCESS model constructs export
to XPDL.
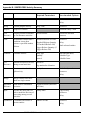
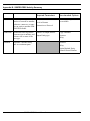
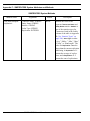
XPDL Model
SIMPROCESS Construct
XPDL Element
Process
WorkflowProcess
Activity
Activity
Entity
TypeDeclaration
Resource
Performer
Attribute
DataField
Connector
Transition
Branch Connector
Transition/Condition
Activity Delay Times
SimulationInformation/
TimeEstimation/Duration
Swimlanes
Pools/Pool/Lanes
Ultimus creates an XML file compatible with the Ultimus XML Converter. The XML file is created
in the model’s directory, and the name of the file consists of the name of the model followed by
_Ultimus.xml. The Ultimus XML Converter uses that XML file to create an Ultimus file (.wfl)
for use in Ultimus BPM Studio. See www.ultimus.com for more information on Ultimus.
Workpoint creates an XML file that can be used to create a WorkPoint archive file. The WorkPoint
archive file can be imported into WorkPoint to produce a WorkPoint process. The XML file is created
in the model’s directory, and the name of the file consists of the name of the model followed by
_WorkPoint.xml. Note that a WorkPoint process created from a SIMPROCESS model contains
minimal information and is merely intended to provide a starting point from which to begin
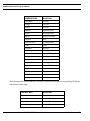
implementing an actual WorkPoint work flow. The table below shows the mapping of SIMPROCESS
Activities to WorkPoint objects.
SIMPROCESS User’s Manual
24
SIMPROCESS Terminology and Menus
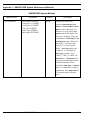
SIMPROCESS
WorkPoint
Assemble
Activity
Assign
Activity
Batch
Activity
Branch
Optional Delay
Clone
Not Applicable
Delay
Activity or Delay
Dispose
Stop
Free Resource
Not Applicable
Gate
Delay
Generate
Activity
Get Resource
Not Applicable
Join
Optional Delay
Merge
Not Applicable
Process
Sub-process
Replenish Resource
Not Applicable
Split
Optional Delay
Synchronize
Activity
Transfer
Stop
Transform
Activity
Unbatch
Activity
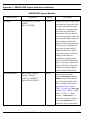
The following table lists the SIMPROCESS data element on the left and the corresponding WorkPoint
data element on the right.
SIMPROCESS
WorkPoint
Process Name
Process Name
Activity Name
Activity Name
Activity Comment
Activity Description
Activity Location
Activity Display Info
SIMPROCESS User’s Manual
25
SIMPROCESS Terminology and Menus
SIMPROCESS
WorkPoint
Activity Duration
Activity Planned Duration
Delay Duration
Delay Date Offset
Connector Name
Transition Name
•
If a SIMPROCESS Connector is a Branch Connector, a dummy Workpoint transition script
is generated where the script name is the same as the Connector name and the script description
is set to the "Condition" value.
•
If a SIMPROCESS Delay Activity specifies Resource usage, a WorkPoint Activity is
generated. Otherwise, a WorkPoint Delay node is generated.
•
SIMPROCESS Entity definitions can optionally be exported to WorkPoint process user data.
The user data name will be the Entity name and the user data value will default to "X".
•
SIMPROCESS resources are exported to WorkPoint activity descriptions. If specified, the
resources are included in the activity description in the format:
"Resource=[resource1],[resource2],...[resourceN]".
•
SIMPROCESS does not identify to WorkPoint upstream ( or looping) transitions. Therefore,
once the model is imported into WorkPoint, the user must locate all upstream transitions and
identify them as such by opening the transition properties and setting the appropriate checkbox.
•
In some cases, the WorkPoint import generates dummy scripts. This means, after the archive
file is imported into WorkPoint, the user must edit each of the scripts and set them
appropriately.
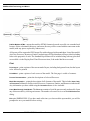
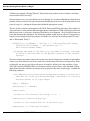
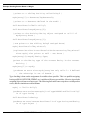
Dot Workflow creates a workflow file using the Dot language that presents a “flat” (non-hierarchical)
view of the model. The file is created in the model’s directory, and the file name consists of the model
name followed by _Dot.txt. The file can be opened in a graph visualizer such as ZRGViewer (http:/
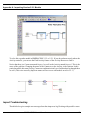
/zvtm.sourceforge.net/zgrviewer.html). Below is a view from ZRGViewer of the CallCenter demo
model.
SIMPROCESS User’s Manual
26
SIMPROCESS Terminology and Menus
Publish Model to HTML... outputs the model to HTML format to be made accessible via a standard web
browser. Select a destination directory, and a new directory will be created with the same name as the
model (with any spaces replaced by underscores).
All layouts will be exported to JPEG image files with web pages built around them. Lists of the model's
Activities, Processes, Resources, Entities, and each type of Global Attribute will be provided, including
links to the properties of each. The Standard Report data will be included along with any plots that
are available via the Display Real-Time Plots menu item, if the model had been executed.
Print
Print Layout… prints a picture of the current model layout, including background icons, but the layout
color will not be printed.
Print Model…
prints a picture of each screen of the model. The first page is a table of contents.
Process Documentation… prints
the descriptions of selected Processes.
Model Documentation… prints the description of all elements of the model. This includes Name, Path,
and Comment field entries of all Activities/Processes, Connectors, Entities, and Resources in the model.
Any information you have added using the Document button is also included.
List of Most Recently Used Models. The File menu contains a list of the most recently used models. Open
any of these models by clicking on its name. The number of recent files is set on the Edit/Preferences
dialog.
Exit quits SIMPROCESS. If you have made edits since you last saved the open models, you will be
prompted to save your models before exiting.
SIMPROCESS User’s Manual
27
SIMPROCESS Terminology and Menus
Edit Menu
Undo
Undo restores Activities, Processes, and Connectors that have been cut or cleared (deleted). It also
reverses Align and Distribute actions. The Undo is only active at the hierarchical level where the Cut,
Clear, Align, or Distribute occurred. A maximum of 10 Undo actions can be active at any one time. As
editing events occur that create Undo actions, the most recent 10 actions are the ones that are kept.
The Undo menu and the tool tip for the Undo button will update to show the next Undo action (Undo
Clear, Undo Cut, Undo Align, Undo Distribute). Undo actions are active in the reverse order of the editing
actions that created them. For instance, if Activities are aligned, then an Activity is deleted, the order
of Undo actions would be Undo Clear followed by Undo Align.
Cut
Cut cuts the selected object from the model layout. The cut object is copied to the clipboard, and the
object may be pasted onto a different part of the layout or into another open model using Edit/Paste.
Connectors and Pads cannot be cut. They can only be cleared.
Copy
Copy places a copy of the selected object in the clipboard. It will remain there until replaced by another
object that is cut or copied. Once a copy is made, it can be pasted on the layout or into another model
by using the Edit/Paste command.
SIMPROCESS User’s Manual
28
SIMPROCESS Terminology and Menus
Paste
Paste makes a copy of the object in the clipboard and pastes it onto the layout. Multiple copies of an
object can be pasted without additional copies being made. Pasting items into a model different from
the model where the copy or cut occurred can cause loss of entity, attribute, resource, function, or
distribution references. See “Advantage of Templates Over Copy/Paste” on page 236 for more
information.
Duplicate…
Duplicate… is a shortcut that copies a selected object from the layout and then does a paste to a position
selected on the layout. This combines Copy and Paste into one command. This is useful when you want
to quickly copy something on the layout and paste it somewhere else.
Clear
Clear
deletes a selected object without copying it to the clipboard.
Select All
Select All
selects all objects on the model layout.
Resize
Resize lets you resize a layout object. You can resize the horizontal and vertical directions separately
if you wish to resize the icon in a non-proportional way. The values represent pixels. The Default Size
button sets the Icon Width and Icon Height to the default size of the icon. Choose the Show Handles button
if you would like to drag to resize the object. Multiple objects can be resized at the same time by having
multiple items selected when choosing Resize. Important Note: An object cannot be resized smaller
than 10 x 10 pixels. Thus, if numbers are entered that are smaller, the object will be resized to 10 x
10. Also, Background Text objects cannot be resized using Resize. The font properties must be changed
to resize Background Text.
The following image shows three processes after Show Handles was selected.
SIMPROCESS User’s Manual
29
SIMPROCESS Terminology and Menus
Switch Activity To
Switch Activity To changes an activity from one type to another. This menu item is only displayed when
one and only one activity is selected on the layout. Processes do not activate this menu item. Items
that are in common between the old activity type and the new activity type are transferred to the new
activity. Since some activities allow multiple connections to output pads and some do not, all
connections to the old activity may not transfer to the new activity. This menu item also displays on
the pop up menu.
Preferences
Preferences allows the setting of personal preferences for various options in SIMPROCESS. These
preferences take effect after the dialog is closed.
SIMPROCESS User’s Manual
30
SIMPROCESS Terminology and Menus
If a model is open when the Preferences menu item is selected, check boxes appear that allow selection
of preferences to be applied to the active model.
selected for application to the active model are applied when OK is clicked. Before the
selected actions are applied to the active model, a dialog confirming that these actions should occur
appears.
Preferences
SIMPROCESS User’s Manual
31
SIMPROCESS Terminology and Menus
If No is selected, the active model is not updated. It may take a few minutes to apply updates to a large
model. Other editing actions are not allowed while the update occurs. Note that these updates actually
change the properties of the active model. The options to display or not display Activity, Pad, and
Connector names on the View menu do not change the model properties, just what is currently visible.
(See page 51.)
There are seven tabs on the Preferences menu:
•
•
•
•
•
•
•
Processes/Activities
Text Block
Text Label
Background Text
Pads
Connectors
Toolbars
Processes/Activities
Show Name
specifies to show the name on the layout by default for newly created Activities.
Confirm Delete
causes a confirmation dialog to appear when you delete an Activity or a Process.
Auto Connect Activities causes new activities placed on the layout to automatically connect (if possible)
with any previously selected activities. The type of connector to use (Bent or Straight) is set on the
Connections tab. This option can also be turned on/off on the pop up menu.
Display Process Badge causes a small icon (green plus sign) to display on the lower right hand corner
of non-empty Processess.
Activity Width/Height
sets the default width and height of new Activities.
Process Width/Height
sets the default width and height of new Processes.
Text Block
Show Text Block
displays the text blocks for the Activities on the layout.
The Font Attributes set the default Font Name, Size, Color, Bold and Italic.
SIMPROCESS User’s Manual
32
SIMPROCESS Terminology and Menus
Text Label
The Text Label preferences are for text labels that are created from the Text Block of a Process. See
“Labeling with Text Blocks,” beginning on page 72 for information on how to use these.
Add Text Label
sets whether the label should be added inside the process for each alternative.
sets whether the label should be horizontal (selected) or vertical (not selected)
Horizontal Text Label
on the layout.
The Font Attributes set the default Font Name, Size, Color, Bold and Italic.
Background Text
The Font Attributes set the default Font Name, Size, Color, Bold and Italic.
Pads
Show Name
shows the pad names on the layout.
Confirm Delete
Pad Size
causes a confirmation dialog to appear when you delete a Pad.
specifies the default size of pads: Small, Medium, or Large.
Connections
Show Name
displays Connector names on the layout.
Confirm Delete causes
Line Width
a confirmation dialog to appear when you delete a Connector.
specifies the default line width for new Connectors.
Line Style specifies
the default line style for new Connectors.
Default Connector for Auto Connect specifies the type of connector (Bent or Straight) to use when Auto
Connect Activities
on the Processes/Activities tab is selected.
Toolbars
The display of the System Toolbar and Layout Toolbar is optional.
Other Preferences
Time Between Auto Saves determines the approximate amount of time between automatic saves of the
model. The automatic save feature creates a file with the same name as the current model, except with
an identifier number assigned by the system added along with the extension .tmp (for example,
MyModel41123.tmp). If the current model is new and has not been saved, the name of the temporary
SIMPROCESS User’s Manual
33
SIMPROCESS Terminology and Menus
file will be the model’s assigned name (Model-1, Model-2, etc.) along with an identifer number and
a .tmp extension and will be located in the models directory.
NOTE: The automatic save does not affect the .bck file. The .bck file is created or updated
when you initiate a save. See page 21 for information on the backup file.
Maximum Number of Files on Recent File List defaults
to 4. Sets the number of files on the File menu.
The allowable values are 0 through 9.
is where the email address is set that is to be used with models
published via the Publish Model to HTML feature. If an entry is present, the popup menu that appears
in published models when holding the mouse over any Process or Activity will include a “mailto” link
with this address having a default subject line containing the complete path to the Activity or Process.
This is provided so that viewers can offer feedback or ask questions. This email address is not validated.
Note that not all email clients will properly handle the use of the “?subject” portion of a mailto link.
Email contact for published models
Maximum Number of Edit Log Entries
sets the limit of entries in the model’s edit log. The default is
unlimited (0 entry).
toggles the display of the Activity Properties Viewer dialog. This
dialog can be resized and remains visible until deselected here or the dialog is closed. Note that closing
the dialog will turn off this setting. Selecting any Activity or Process on the layout will display certain
Activity and Process properties. When an Activity is selected, the Activity duration in its Duration field
displays in the Duration Information field, and the Resource usage information displays in the Resource
Usage field. When an Activity or a Process is selected, the text in its Comment field displays in the
Comment Field section, and the text of the Documentation displays in the Documentation Text section.
The File/URL field will display the contents of that same field from the Documentation tab of the
properties dialog for the selected Activity or Process. If enabled, the View button will attempt to launch
your preferred web browser (for a URL) or suitable application for the file if it contains any path
information. By providing easy access to key Activity or Process properties, this feature is ideal for
use in model review and validation. ( See “Common Activity Input Fields” on page 70.)
Display Activity Properties Viewer
SIMPROCESS User’s Manual
34
SIMPROCESS Terminology and Menus
Activity Browser...
Activity Browser... is a feature for navigating among the Activities. A dialog lists all the Activities and
Processes contained in the model. Any name preceded by a (+) signifies a hierarchical Process or a
Process Alternative. Double-clicking on the Process or Process Alternative name will expand the tree
diagram, displaying Activities and Processes underneath. Double-clicking on the Activity name will
bring up the properties of the Activity. Each item has an icon that identifies the item as an Activity
or a Process, and an icon that indicates whether the item has Expressions or Resources. Select an
Activity and either Edit the Properties of that Activity or Go To the layer in the model layout where
that Activity resides. Expand All expands the complete model hierarchy, and Collapse All restores the
hierarchy to the top level.
SIMPROCESS User’s Manual
35
SIMPROCESS Terminology and Menus
The Activity Browser can be used to search for specific Processes or Activities. There are three search
criteria: Activity name, Activity type, or Activity icon. Each can be used individually or in combination.
Search criteria that are combined are combined using “and” logic. The asterisk (*) can be used as a
wildcard for name searches. The asterisk can go at the beginning of the search string, the end of the
search string, or both. Wildcards cannot be used in the middle of a search string. Select Ignore Case
to perform case insensitive searches. Selecting Find Activity finds the first Activity in the model
hierarchy that matches the search criteria. Subsequent clicks of Find Activity will continue the search
for the next match.
SIMPROCESS User’s Manual
36
SIMPROCESS Terminology and Menus
Connector Browser...
Connector Browser... is a feature for navigating among the Connectors. A dialog lists all the Processes
and Connectors contained in the model. Any name preceded by a (+) signifies a hierarchical Process
or a Process Alternative. Double-clicking on the Process or Process Alternative name will expand the
tree diagram, displaying Connectors and Processes underneath. Double-clicking on the Connector
name will bring up the properties of the Connector. Each item has an icon that identifies the item as
a Connector or a Process. Select a Connector and either Edit the Properties of that Connector or Go
To the layer in the model layout where that Connector resides. Expand All expands the complete model
hierarchy, and Collapse All restores the hierarchy to the top level.
SIMPROCESS User’s Manual
37
SIMPROCESS Terminology and Menus
The Connector Browser can be used to search for specific Connectors by name. The asterisk (*) can
be used as a wildcard for searches. The asterisk can go at the beginning of the search string, the end
of the search string, or both. Wildcards cannot be used in the middle of a search string. Select Ignore
Case to perform case insensitive searches. Selecting Find Connector finds the first Connector in the
model hierarchy that matches the search criteria. Subsequent clicks of Find Connector will continue
the search for the next match.
Model Search...
Model Search is a quick way of searching by name for items within the model. The Model Search dialog
has three areas: Search Items, Search Criteria, and Search Results.
SIMPROCESS User’s Manual
38
SIMPROCESS Terminology and Menus
Search Items
has eight check boxes: Process or Activity, Entity Type, Resource, Resource Downtime,
Global Attribute, Background Text, Connector, or Any (default). The other items become available for
selection when Any is deselected. Model Search searches the names of the selected Search Items based
on the options set in Search Criteria. Enter the string to search for in the text field of Search Criteria,
then select how to compare the string entered with the names of the selected Search Items. The options
are Equals, Starts With, Ends With, or Contains. Select Ignore Case to perform a case insensitive search.
Once the Search Criteria has been set, click the Find... button to perform the search. Search Results
displays the items found. The type of each item found (Process or Activity, Entity Type, Resource,
Global Attribute, Background Text, or Connector) is identified by an icon to the left of the name.
Process, Activity, or Entity Type items display a scaled down version of their assigned icons. Resource,
Global Attribute, Background Text, or Connector display an icon based on the legend to the right of
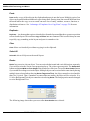
the list. The example below shows a search on the CallCenter.spm demonstration model. The
search was a case sensitive search for any names containing Type. Four background text items, four
activities, three entity types, one global entity attribute, and three connectors were found.
SIMPROCESS User’s Manual
39
SIMPROCESS Terminology and Menus
Selecting an item will cause the Edit... button to activate. The properties of the item can be edited by
clicking the Edit... button or by double-clicking an item. The Go To button will activate if the item
selected is a Process or Activity. Selecting Go To will take you to the level of the model where that
item is located.
Expression Search...
Expression Search is a quick way of searching for the existence of expressions or for expressions that
contain specific text. Searching for text can also include replacing text. As with Model Search, the
Expression Search dialog has three areas: Search Items, Search Criteria, and Search Results.
Search Items has seven check boxes: Process or Activity, Entity Type, Entity Instance, Resource, Function,
Model,
or Any (default). The other items become available for selection when Any is deselected.
searches the expressions of the selected Search Items based on the options set in
Search Criteria. To find items that have expressions no matter what the text of the expressions, leave
the Search For field empty. (Note that if the Search For field is empty, items that have Expressions stored
Expression Search
SIMPROCESS User’s Manual
40
SIMPROCESS Terminology and Menus
in files will be located.) To search for specific text in expressions, enter the search text in the Search
All searches are “contains” searches. That is, there is a match if the text in the Search For
field is contained within any line of an expression. Select Ignore Case to perform a case insensitive
search. If the Replace With field is not empty, the text in the Search For field found in expressions will
be replaced with the text in the Replace With field. There is no undo for replace actions. Also, replace
actions are case sensitive only. Selecting Ignore Case will empty and disable the Replace With field.
Expressions stored in files are not included in searches when the Search For field contains text.
For field.
Once the Search Criteria has been set, click the Find... button to perform the search. Search Results
displays the items found. The type of each item found (Process or Activity, Entity Type, Resource,
Function, or Model) is identified by an icon to the left of the name. Process, Activity, or Entity Type
items display a scaled down version of their assigned icons. Resource, Function, and Model display
an icon based on the legend to the right of the list. The example below shows a search on the
CallCenter.spm demonstration model. The search was a case insensitive search for any
expressions containing type. Four Activities, three Resources, and one Function were found.
Selecting an item will cause the Edit... button to activate. The properties of the item can be edited by
clicking the Edit... button or by double-clicking an item. The Go To button will activate if the item
selected is a Process or Activity. Selecting Go To will take you to the level of the model where that
item is located.
Metadata Search...
is a quick way of searching for the existence of metadata or searching for specific
metadata. See Chapter 4 of the SIMPROCESS Metadata Manual for Metadata Search instructions.
Metadata Search
Properties…
Selecting Edit/Properties… will bring up the Properties dialog box for the selected item. This has the
same effect as double-clicking on it. Use this menu item most often when you want to edit Hierarchical
Processes, since double-clicking on them will show their internal structure and not bring up their dialog
box.
SIMPROCESS User’s Manual
41
SIMPROCESS Terminology and Menus
Layout Menu
Size... brings up a dialog that allows you to specify the size (in pixels) used in the drawing of model
layouts. The layout is the area on the screen where models are built and displayed. The default setting
is a width of 925 and height of 575. The size can be changed for the current session, saved and used
for subsequent SIMPROCESS sessions, saved with the current model layout and always used to display
it, or saved and used with all layouts in a model. Each time a layout is displayed, its stored size will
be used. The session setting will be used if there is not a stored size.
Enforce Aspect Ratio defaults to not selected. If Enforce Aspect Ratio is selected, the ratio of height to
width must be 0.75. Selecting Enforce Aspect Ratio will cause the default width of 925 and height of
575 to change to 928 and 626 respectively since 925 and 575 do not conform to the 0.75 ratio. This
ratio is enforced whenever a change is made to the height or width. For example, if the height were
changed to 712, the width would automatically change to 952, and the entered value of 712 would
change to 714. Thus, both values are updated to the next higher values that meet the 0.75 ratio.
SIMPROCESS User’s Manual
42
SIMPROCESS Terminology and Menus
Width
is the width of the layout in pixels (640 minimum).
Height
is the height of the layout in pixels (480 minimum).
Default Setting either saves the entered width and height as the session default (Set as Default) and causes
this size to be saved for use in future SIMPROCESS sessions, or it removes the saved session setting
(Remove Default Setting) so that future SIMPROCESS sessions will use the 925 by 575 size. The setting
used for the remainder of the current SIMPROCESS session (unless changed again via this dialog)
will be the one specified here.
Apply to Current Model
enables the following four options:
•
Current Layout Only applies the entered values only to the active layout. The specified size
of the current layout will be stored with the model when the model is saved.
•
All Layouts in Current Model stores the entered values with all layouts in the active model so
that they become permanent (if the model is saved).
•
Clear Current Layout Setting removes a previously specified layout size for the current layout,
so that the layout is subsequently redrawn (when necessary) using the current session layout
size.
•
Clear All Layout Settings removes stored layout sizes for all layouts of the current model. The
layouts will subsequently display using the current session layout size.
The current session setting is only changed if no checkboxes are selected or if the Default Setting
checkbox is selected. Each time a layout is displayed, if a layout size is specified in the model, that
size will be used; if none is found, the current session setting will be used instead.
Swimlanes... allows you to add swimlanes to the current layout. The swimlanes dialog has two tabs:
Horizontal and Vertical. On the left side of each tab is the list of swimlanes. The right side has a miniature
view of the current layout. Note that more than one lane must be added for anything to appear on the
miniature view or on the actual layout. Both horizontal and vertical swimlanes can be on the same
layout. The example below shows a modified version of the demonstration model, Human
Resources.spm.
SIMPROCESS User’s Manual
43
SIMPROCESS Terminology and Menus
Click the Add... button to add a swimlane. This brings up a dialog which contains the name of the
swimlane, whether the name should be displayed (Show Name), whether the name should be displayed
horizontally or vertically (Name Orientation, horizontal swimlanes only), and the Font Attributes for
the name.
Edit the properties to set the appropriate name and display characteristics. The Metadata... button opens
a dialog for entering metadata. See Chapter 4 of the SIMPROCESS Metadata Manual for a full
discussion of entering SIMPROCESS metadata.
SIMPROCESS User’s Manual
44
SIMPROCESS Terminology and Menus
Adding a second swimlane causes a swimlane border to appear in the miniature view. Adding a third
swimlane would cause a second swimlane border to appear. There is always one less border than
swimlanes. The borders are evenly spaced down (or across for vertical swimlanes) on the layout.
Once there are at least two swimlanes defined, the Move button and the two buttons below the miniature
view activate. The Move button allows the rearrangement of the order of swimlanes without having
to delete and recreate. The Move button causes the selected item to move down in the list. Move causes
the item to go to the top of the list if the selected item is the last item. The Border Properties and Lane
Widths buttons change the look of the borders and the widths of the swimlanes. Border Properties brings
up a dialog that sets the Line Width, Line Style, and Line Color for each of the borders. The properties
apply to the borders top to bottom for horizontal swimlanes and left to right for vertical swimlanes.
Since there are only two lanes, there is only one border.
SIMPROCESS User’s Manual
45
SIMPROCESS Terminology and Menus
The Lane Widths button changes the widths of the swimlanes. The swimlane defaults to evenly spaced
widths. Each swimlane will be 50% of the layout if there are two swimlanes. The dialog allows you
to enter relative percentages for all or some swimlanes. Entries are not required for each swimlane.
The minimum swimlane width is 5% of the layout. Swimlanes that do not have an entry will be evenly
spaced across the remaining area of the layout. The Current Unassigned Lane Width Maximum Percentage
shows the maximum value that can be assigned to a lane. As-Is Process for Staffing is assigned 45%
of the layout area in the example below. This means 55% of the layout area is left for People Soft
HR. The Clear Widths buttons removes all swimlane width assignments.
For the image below, adjusting the width removes the overlap of the People Soft HR swimlane title
with the dynamic labels.
SIMPROCESS User’s Manual
46
SIMPROCESS Terminology and Menus
When OK is selected on the Swimlane Properties dialog, the swimlanes are drawn on the model layout.
Note that swimlane borders or titles may not be edited by clicking on the layout. All edits must be
done from the Swimlane Properties dialog.
SIMPROCESS User’s Manual
47
SIMPROCESS Terminology and Menus
Background Color
Current Layout
All Layouts
changes the background color of the visible layout to the selected color.
changes the background color of all layouts in the active model to the selected color.
Align…
Aligns a number of selected objects according to various criteria.
Top
aligns the tops of the selected objects.
Bottom
Left
aligns the bottoms of the selected objects.
aligns the left sides of the selected objects
Right
aligns the right sides of the selected objects
Center (Vertical)
aligns the centers of the selected objects along a vertical line.
Center (Horizontal)
aligns the centers of the selected objects along a horizontal line.
The screen shots below show the effect of using Align before and after aligning the horizontal centers:
SIMPROCESS User’s Manual
48
SIMPROCESS Terminology and Menus
Distribute…
Distributes three or more selected objects so that they are equally spaced, vertically, horizontally, or
circularly.
The screen shots below show the results of using Distribute on some unequally spaced objects.
Before using Distribute:
SIMPROCESS User’s Manual
49
SIMPROCESS Terminology and Menus
After using Distribute:
Distribute Pads
Pads added to a Hierarchical Process can be spaced evenly by selecting Distribute Pads. Although
intended for the Hierarchical Process, this menu item can be used for any Activity or Process.
Group combines multiple objects into a group. All normal editing operations that can be done on an
individual object can be done on the group. This can be useful when the model is divided into logical
sections. A section can be grouped and then moved with respect to the other sections. A group can
be cut from the layout, or copied and pasted to create an identical group.
Use Ungroup to edit individual components of a group.
Ungroup
breaks up a group into the original components that went into making the group.
Bring To Front
brings an object to the front of the layout so it can be edited.
Send To Back
sends an object that is at the front of the model layout to the back.
Snap To Grid.
Once turned on, objects can only be placed on the layout at grid intersections.
Grid Lines places a grid on the model layout as a convenience in aligning objects. The grid has no
significance to the model.
Grid Spacing
Grid Color
changes the spacing of the grid. Three levels are offered: Fine, Medium, and Coarse.
changes the color of the grid to the color selected on the color button.
SIMPROCESS User’s Manual
50
SIMPROCESS Terminology and Menus
View Menu
Descend
Ascend
takes the model down one level in the model hierarchy.
takes the model one level up in the Process hierarchy.
Go To Top
Seeds
takes the model to the top of the Process hierarchy.
is used for viewing the random number stream seeds.
Activities
Hide hides the selected Activity. The Activity and its Connectors to it will not be visible on the layout.
Show All
makes all Activities and their Connectors visible.
Show Attached
makes all the Activities that are connected to a selected Activity visible.
By Resource...
allows you to view or edit resource Activity assignments.
By Time Stamp...
allows you to view or edit Time Stamp key assignments at Activities.
Resources
By Activity
allows you to view or edit resource usage by Activity.
Activity Names. These menu items only affect the display of Activity names. The changes are not saved
with the model.
Show All
Hide All
makes all Activity names visible throughout the model.
makes all Activity names invisible throughout the model.
Local shows or hides Activity names based on their individual properties (set with the Properties dialog
SIMPROCESS User’s Manual
51
SIMPROCESS Terminology and Menus
Show Name
checkbox). This is the default setting when a model is opened.
Connector Names
These menu items only affect the display of connector names. The changes are not saved with the model.
Show All
makes all connector names visible throughout the model.
Hide All makes
all connector names invisible throughout the model.
Local shows or hides connector names based on their individual properties (set with the Properties dialog
Show Name
checkbox). This is the default setting when a model is opened.
Pad Names
These menu items only affect the display of Pad names. The changes are not saved with the model.
Show All
Hide All
Local
makes all Pad names visible throughout the model.
makes all Pad names invisible throughout the model.
shows or hides Pad names based on their individual properties (set with the properties dialog
checkbox). This is the default setting when a model is opened.
Show Name
Zoom In magnifies a section of the layout to see more detail. Select Zoom In and click and drag the mouse
to define the area on the layout to zoom.
Zoom Out
is the reverse of Zoom In.
View (1:1)
returns the layout window to its original size.
Refresh
redraws the current screen.
Create Menu
Activities provides an alternative way of creating Activities, rather than graphically dragging and
dropping them from the Layout Toolbar.
Activities added to a Library can be added to this menu and/or added to the Library Toolbar.
SIMPROCESS User’s Manual
52
SIMPROCESS Terminology and Menus
Processes
provides an alternative way of creating Processes.
Processes added to a Library will be added to this menu.
BackgroundText
provides an alternative way of creating static or dynamic labels.
BackgroundGraphic
provides an alternative way of changing the background.
Define Menu
Entities…
is used for managing Entity Types in the model.
Resources…
is used for managing Resources in the model.
SIMPROCESS User’s Manual
53
SIMPROCESS Terminology and Menus
Resource Downtimes…
is used for managing Resource Downtimes in the model.
Distributions is used
for managing customized Standard, Tabular, and Auto Fits Distributions. Once a
Distribution is defined, it can be used throughout the model without the need to redefine the parameters
of the distribution. (See “User Defined Distributions” on page 98.)
SIMPROCESS User’s Manual
54
SIMPROCESS Terminology and Menus
Functions… is used for managing Functions (Expressions that return a value). Functions defined here
can be used throughout the model.
Global Attributes... is used for globally defining attributes for Entity instances, Entity Types, Resources,
Activities, and the Model. See “Introduction to Attributes and Expressions,” beginning on page 239 for
more information on Attributes.
Model Expressions... defines customized Processing for the model at various points during a simulation.
This topic is covered in detail in Chapter 10, “Customizing a Model with Attributes and Expressions,”
beginning on page 237.
Time Stamps… manages Time Stamps. Time Stamps can be used as event logs. (See “Event Logs” on
page 362.)
SIMPROCESS User’s Manual
55
SIMPROCESS Terminology and Menus
Metadata
contains three sub menu items: Launch Metamodel Editor, Assign Metamodels, and Model
Metadata.... Launch Metamodel Editor opens the SIMPROCESS Metamodel Editor. Assign Metamodels
assigns a SIMPROCESS Metamodel to the active SIMPROCESS model. Model Metadata... is used to
enter metadata at the model level. See the SIMPROCESS Metadata Manual for information on these
topics.
Templates defines and edits Templates. This option also allows saving templates to a Library or loading
a new Library. See Chapter 9, “Reusable Templates and Libraries,” beginning on page 223.
Model Description… provides a place to document the model. See “document Subdirectory” on page
474
for information on customizing the headings.
Simulate Menu
SIMPROCESS User’s Manual
56
SIMPROCESS Terminology and Menus
Run Settings…
Run Settings
tab is used to set the run options for the simulation. (See “Run Settings” on page 109.)
Cost Periods tab defines cost periods for Activity based costing calculations. (See “Setting Up Cost
Periods” on page 179.)
Debug Traces tab
defines trace files of entity actions for debugging purposes. (See “Debug Traces”
on page 111.)
Expression Output
tab offers options for the OUTPUT statement. (See “Expression Output” on
page 112.)
Time Server tab allows the simulation time to be managed by the SIMPROCESS TimeServer. (See
“Time Server” on page 113.)
Animation Settings…
Show Clock
turns the simulation time clock on or off while the simulation is running.
Show Counts. If Show Counts is turned on, each Activity or Process will display a number above its icon.
•
Generate Activities show the number of Entities generated.
SIMPROCESS User’s Manual
57
SIMPROCESS Terminology and Menus
•
•
Dispose Activities show how many Entities have been disposed.
All other Activities and Processes show how many entities are in that Process or Activity.
Show Entities turns the display of Entities on or off during the animation. Showing Entities assists with
visualizing the workflow.
Update Dynamic Labels
turns the display of dynamic labels on or off during the animation.
Animation Speed.
Changes the Animation Speed during the simulation. The fastest value is 100, and
the default is 20. A smaller value is better while debugging the model.
The animation setting can also be changed by using the buttons and slider on the tool bar. A depressed
button means the item represented by the button is turned on. Going from left to right, the buttons are
Animation On, Show Clock, Show Entities, Show Counts, and UpdateDynamicLabels. The slider is for
Animation Speed. The final button displays the post simulation animation controls. (See “Post
Simulation Animation” on page 172.)
Run
Run
verifies the model (if selected) and then starts the simulation running.
Change Model Parameters
This item, available only while running a model which has attributes identified as Model Parameters,
will pause the simulation and allow parameter values to be changed. See “Running a Simulation with
Model Parameters,” beginning on page 91 for more information on Model Parameters.
Pause/Resume
If the simulation is running, it pauses the simulation. If the simulation is paused, it resumes running
the simulation.
Stop
stops the simulation and ends the collection of statistics.
SIMPROCESS User’s Manual
58
SIMPROCESS Terminology and Menus
Animation On
Animation On turns animation on or off, but does not turn on animation that is turned off in the Animation
Settings.
Verify Model
Verify Model checks the model to see whether or not all the Activities are connected properly and if
the model can be simulated. If this option is selected in the Run Settings, verification is done
automatically when a simulation starts. A notification of any problems found will be displayed along
with an option to stop the simulation.
Report Menu
Define Global Statistics Collection sets which statistics are collected during the model execution. See
“Default Performance Measures” on page 186.
Display Standard Report views reports that contain the statistical results of the simulation run. See
“Standard Report” on page 186.
Define Real-Time Plots sets which real-time plots to display during or after the simulation run. See
“Defining Plots” on page 200.
SIMPROCESS User’s Manual
59
SIMPROCESS Terminology and Menus
Define Custom Real-Time Plots creates plots with multiple values to view during or after the simulation
run. See “Custom Plots” on page 209.
Display Real-Time Plots
selects real-time plots for viewing. See “Displaying Real-Time Plots” on
page 203.
Launch Plot Application opens a blank plot window. Saved plots may then be opened for viewing. See
“Displaying Plots Remotely” on page 204.
Dashboards Defines new dashboards for use with models, or Assigns previously defined dashboards
to a model. See “SIMPROCESS Dashboards” on page 431.
Commit to Database saves simulation results in the SIMPROCESS database (SimProcDB). Commit
to Database is described in detail in Chapter 13–SIMPROCESS Database, on page 375.
Launch Database Application starts the database application from within SIMPROCESS. The Manage
Results form launches automatically when launching MS Access from this menu item. The Manage
Results form is described in detail in Chapter 13–SIMPROCESS Database, on page 375.
Experiment Menu
Define Experiments sets up the experiments to run. The experiments are stored in the file
Experiments.xml. Defining Experiments is described in detail in Chapter 14–Experiment
Manager, on page 387.
Run All Experiments
attempts to run every experiment defined.
Run Selected Experiments
attempts to run experiments for which the Selected field is checked.
Run Specific Experiment enters
an experiment name that SIMPROCESS will attempt to run.
Running experiments is described in detail in Chapter 14–Experiment Manager, on page 387.
SIMPROCESS User’s Manual
60
SIMPROCESS Terminology and Menus
Tools Menu
ExpertFit executes ExpertFit, a data analysis application from Averill Law & Associates, which can
be used to analyze data to determine the best standard statistical distribution fit.
executes OptQuest optimization from OptTek. See Chapter 15–OptQuest for
SIMPROCESS, beginning on page 401 for more information.
OptQuest
Remote
has four submenus.
•
Start Local Dashboard Server
•
Start RMI Registry starts the Java RMI Registry. Start SPServer will not activate until the Java
starts the Dashboard Server to run Dashboards locally. See
“Displaying Dashboards” on page 447.
RMI Registry has been started.
•
•
Stop RMI Registry
stops the Java RMI Registry.
Start SPServer starts SPServer. SPServer must be started for External schedules to operate. See
“Adding an External Schedule” on page 335.
•
Stop SPServer
stops SPServer.
Repair Cross-References. Cross references are used in SIMPROCESS models to track Entities,
Resources, and Attributes so items cannot be deleted that are in use. Models developed in releases 3.0
through 3.1.1 could have invalid cross references. Recommend running this utility on models
developed in release 3.0 through release 3.1.1. The action is applied to the active model.
Collect Model Metrics displays a list of metrics for the active model. The metrics can be saved to a file.
Metrics include
Model Name
Number of each type of Activity (Delay, Generate, etc.)
Number of Process Alternatives
Number of Entities, Resources, and Plots
Number of each type of Expression
SIMPROCESS User’s Manual
61
SIMPROCESS Terminology and Menus
Number of each type of Attribute
Icon Manager is used to import, export, and manage image files. A single image file can be imported
for use as an icon, or multiple files (such as a directory of image files) can be imported. See “Importing
Graphics Image Files” on page 168.
Manage Background Images is used to import, export, and manage background image files. See
“Background Images” on page 168.
Window Menu
Displays a list of open models. Allows you to change which model is active.
Help Menu
SIMPROCESS Help
displays a list of main help topics.
SIMPROCESS Manuals opens the SIMPROCESS Getting Started Manual, the SIMPROCESS User’s
Manual, and the SIMPROCESS Metadata Manual. These PDF files are the complete documentation
set for SIMPROCESS. They will open using the application designated for PDF files by the platform
on which SIMPROCESS is installed. On Linux systems, there must be a view.properties file
as described for the View button on the Documentation tab of Activity and Process properties dialogs.
(See “Common Activity Input Fields” on page 70.)
System Information displays a dialog that lists the relevant system information. It also includes a Run
GC
button. This button calls Java garbage collection and updates the Java memory information.
About SIMPROCESS displays information about SIMPROCESS, including the version, the copyright,
and technical support information.
SIMPROCESS User’s Manual
62
CHAPTER 2
SIMPROCESS Basics
A SIMPROCESS model contains the following components:
•
Processes
•
Activities
•
Entities
•
Resources
•
Connectors
•
Pads
Processes and Activities represent business operations in a SIMPROCESS model.
SIMPROCESS models can be arranged in a hierarchy, with Processes encompassing other
Processes and Activities.
SIMPROCESS User’s Manual
63
SIMPROCESS Components
SIMPROCESS Components
Processes
A set of Processes can represent the operation of a business at a very high level. This level
represents only an outline of the business Process.
Activities represent the details of business operations. For example, in a mail order fulfillment
operation, when a customer order is received, processing steps might include:
1.
Identifying the customer.
2.
Creating or accessing a customer profile.
3.
Verifying the customer profile against information contained in the customer’s order.
Each of these steps can be modeled as an Activity. Collectively, they comprise a single Process that
might be called “Access/Create Customer Profile.”
The Process construct allows a business Process to be broken down into successively more detailed
layers.
A Process can be (and usually is) composed of other Processes and Activities. Activities cannot be
decomposed.
Activities
SIMPROCESS contains a suite of Activities, each reflecting a different type of action. Actions can
be physical or logical.
Entities
Entities are objects that circulate through the model. They represent things (e.g., parts, deliveries, people)
and information (orders, service requests, etc.) that flow from Activity to Activity. The customer order
is an Entity in the order fulfillment process.
Unlike Processes and Activities, which appear as icons in the model layout, Entities aren’t visible until
a simulation is run. During the simulation, they emerge as icons flowing through the model, if animation
is turned on.
SIMPROCESS User’s Manual
64
SIMPROCESS Components
Resources
Resources are the agents that add value to Entities or perform work at Activities. Examples
include:
•
A customer calls in an order, which requires a clerk to handle it. Order entry is the Activity,
the order is an Entity, and the clerk is a Resource.
•
A truck is required to deliver merchandise to the customer; the truck is a Resource.
The way to minimize cycle time and Activity costs is by experimenting with different levels of Resources
and different costs.
The availability of a Resource affects the amount of time it takes an Entity to flow through the
Process. Lack of Resources can be a cause of bottlenecks in a business Process. A customer order
might arrive while two clerks are busy handling other tasks. Order fulfillment is delayed until a
clerk becomes available. The amount of time the customer order spends waiting for an available
clerk is shown in the Entity Cycle Time by State output report as Wait for Resource. Another way
to describe this situation is that the order waited in a queue for the available Resource.
Knowing how Resources are used is a key factor in understanding and improving upon the way a
business operates.
Connectors
Connectors link Activities and Processes together and are the paths used by Entities to flow
through the model. Connectors can have delay times.
SIMPROCESS User’s Manual
65
SIMPROCESS Components
Connector Names
A default Connector name, e.g., Conn44 is assigned. To change the Connector Name, edit the Name
field in the Connector properties.
Displaying Connector Names
The Edit Preferences option, on the Edit menu, determines if names of new Connectors are displayed
in the model. However, individual Connector dialogs have Show Name check boxes that will override
the model default.
The Name field is displayed across the middle of the Connector if Show Name is selected.
Display Properties
The Line Width and Line Style properties control the appearance of the Connector. Defaults for Line
Width and Line Style can be set in the Preferences. See “Preferences” on page 30.
Duration
A Connector defaults to no Duration. Duration can be specified by setting a Travel Time or by
If using Distance Divided By Rate, a value must be set for Distance and
Rate, and Rate must not be zero. No units are assumed for Distance or Rate. The Units field applies
to the value that results from Distance being divided by Rate.
Distance Divided By Rate.
Note that a Connector Duration affects Entity animation. When no Connectors on a layout have a
Duration, one Entity moves at a time. This is because the Entity movement occurs in zero
simulation time. However, when Connectors on a layout have a Duration, multiple Entities can be
moving at the same time since the movement represents the passing of time. If some Connectors on
a layout have a Duration and some do not, the movement of Entities on Connectors with a Duration
will stop while Entities cross Connectors with no Duration. The Units set for Travel Time or Distance
Divided By Rate also affect the animation of Entity movement. It is recommended (for animation
purposes only) that the Units of the Connector Duration match the Simulation Time Unit on the Run
Settings dialog. (See “Setting the Simulation Time Unit” on page 89.) If the Simulation Time Unit is
different from the Units of a Connector Duration, then it is possible that either the Entities will move
very slowly across the Connector no matter what Animation Speed (page 57) is set or the Entities
will never show up (again, no matter what Animation Speed is set). If animation is not a
consideration, then any value for Units is valid.
Connector Statistics
Collect Connector Statistics and Collect Connector by Entity Statistics are used to request statistics for
the specified Connector. See “Connector Statistics,” beginning on page 198 for more information.
SIMPROCESS User’s Manual
66
SIMPROCESS Components
Pads
Pads are small triangular objects attached to Activities and Processes which serve as attachment
points for Connectors. A single Pad can connect one or (possibly) more Connectors. Entities flow
in one direction, entering nodes at input Pads and exiting at output Pads. Three sizes of Pads are
available: small, medium, and large. The Pad size can be changed on the Pad properties dialog, or
by right clicking on the Pad and choosing Pad Size. The size of all the Pads on an Activity or
selected Activities can be changed by right clicking on a selected Activity and choosing Pad Size.
Pads also connect one level of a Process hierarchy to another. Pads can be queueing areas for
Entities waiting for a Resource or condition.
Putting it Together
A SIMPROCESS model shows a business Process as a set of Nodes (Processes and Activities)
connected by Connectors. Entities are generated from one or more Generate Activities, traverse the
model, and finally proceed to a Dispose Activity, where they are disposed. Entities pass through
other Activities, such as Delays and Branches.
A model is built by supplying numeric and symbolic attributes to the various Activities and the
Entities that are processed at these Activities. The Resources needed to process the Entities are also
defined.
The end result is a dynamic model of the business Process. Bottlenecks can be seen as they occur
when simulations are run on this model. Reports and statistics may be generated describing the
flow of people, materials, and information and quantifying how Resources are used. The model
may continue to be modified in order to experiment with different scenarios.
A simple model can be built with just three Activity objects: Generate, Delay, and Dispose.
All models require a Generate Activity to generate Entities and a Dispose Activity to end the
processing of Entities. Delay Activities are used to represent actions.
There are some things that are common to most Activities, such as the Activity name and
Resources required by the Activity. This chapter begins with a discussion of the input fields and
command buttons used to define these items. The remainder of the chapter describes the core
SIMPROCESS Activities in detail, with particular attention devoted to the Generate Activity and
SIMPROCESS User’s Manual
67
SIMPROCESS Components
the Entities.
The remaining SIMPROCESS Activities are described in Chapter 4–Activity Modeling Constructs,
beginning on page 118, and in “Explicitly Getting and Freeing Resources” on page 155.
SIMPROCESS User’s Manual
68
Using the Layout Toolbar to Create Activities
Using the Layout Toolbar to Create Activities
The Layout Toolbar is the two columns of buttons running down the left margin of the
SIMPROCESS window. These buttons are used to place model building blocks on the
SIMPROCESS layout — the central region of the SIMPROCESS window.
Begin by adding a Generate Activity to the model. Click once on the Generate Activity button.
Next, point and click on the SIMPROCESS layout. A Generate Activity icon is added at that
location.
Press and hold the Shift key while clicking on the layout to add several activities of the same type,
i.e., Generate. Each time the layout is clicked, a Generate icon is added to the layout. Release the
Shift key before dropping the last icon or click once on the Select tool to deactivate the Generate
SIMPROCESS User’s Manual
69
Using the Layout Toolbar to Create Activities
button.
Removing Objects from the Layout
Select an object such as an Activity icon from the layout and press the Delete key. Several items
may be removed at one time by drawing a rectangle around the objects and pressing Delete or
selecting Edit/Clear from the menu or the popup menu.
Common Activity Input Fields
Activity Properties dialogs have the following common input fields:
•
Name is the name chosen to identify the Activity. This name appears below the Activity, and
it can be moved on the layout.
•
Icon
•
Comment is a one-line comment about the Activity. This comment appears in the status bar
when the Activity is selected.
•
Documentation tab
contains a Document... button that opens an edit window for adding
descriptive text about the Activity. See “document Subdirectory” on page 474 for information
on customizing headings. Next to the Document... button is the Metadata... button. The
Metadata... button opens a dialog for entering metadata. See Chapter 4 of the SIMPROCESS
Metadata Manual for a full discussion of entering SIMPROCESS metadata. This tab also
contains a field for adding a link to a URL or another document. (See “Export” on page 23.)
The View button launches the preferred web browser if Is URL is selected. If Is URL is not
selected, SIMPROCESS assumes the URL is a file and will attempt to open the file with
whatever program is designated to open that type of file. For Windows, the View button enables
when Is URL is selected and the URL/File field is not empty, or Is URL is not selected and the
URL/File field indicates a path (contains backslashes or begins with ./). The same conditions
apply on Linux systems. In addition, on Linux, the view.properties file must be in the
SPUser directory, and the view.properties file must contain valid url.view and
file.view properties. Due to other applications being required, the View button is not
guaranteed to work in every case.
•
Attributes define custom attributes that the Activity requires. This topic is covered extensively
in Chapter 10, “Customizing a Model with Attributes and Expressions,” beginning on
page 237.
identifies the graphic icon representing the Activity.
SIMPROCESS User’s Manual
70
Using the Layout Toolbar to Create Activities
•
Expressions allow customized processing for the Activity at various points during a
simulation. This topic is covered in detail in Chapter 10, “Customizing a Model with
Attributes and Expressions,” beginning on page 237.
•
Event Logs
•
Text Block
•
Help
are used for defining timestamps and recorders.
is a three-line description that appears within the Activity’s icon on the layout.
displays information about the Activity.
The following tabs and fields are found on most Activity Properties dialogs:
•
Resources
•
Duration/Value is the amount of time it takes the Activity to process an Entity, once the required
defines the Resources required to process Entities arriving at the Activity. The
Entity waits in a queue until the Resource or Resources can be obtained.
Resources are obtained. Time can be defined as a constant, or as a statistical distribution.
•
specifies the units and measure for duration time in nanoseconds,
microseconds, milliseconds, seconds, minutes, hours, days, weeks, months, or years.
Duration/Time Units
The following buttons are found on all Activity Properties dialogs except Background Text. These
buttons allow the creation of items that are then available throughout the model.
•
New Entity
•
New Resource
•
Entity
•
Entity Type
•
Resource
•
Model
creates new Entity types.
creates new Resource types.
creates new global Entity instance attributes.
creates new global Entity Type attributes.
creates new global Resource attributes.
creates new Model attributes.
Attributes are covered extensively in Chapter 10, “Customizing a Model with Attributes and
Expressions,” beginning on page 237.
Naming Activities
Use the Name field to assign a name to an Activity. This name is shown below the Activity icon in
the model if the Show Name checkbox is selected.
SIMPROCESS assigns new Activities a default name. It is a good idea to change this to a name that
SIMPROCESS User’s Manual
71
Using the Layout Toolbar to Create Activities
is meaningful; one that indicates what occurs at this Activity. Activities can be named just about
anything, as long as the same name is not used twice in the same level of the model hierarchy.
Change the name of an existing Activity by clicking in the Name field and typing the new name.
The contents of the Text Block can be used as the Name by selecting the Use Text Block check box.
The lines of text are appended together with a space between each line to create the Name. When
Use Text Block is selected, the Name field is not editable. The values on the Text Block tab must be
changed to change the Name.
Choosing an Icon
The Icon field identifies the graphical icon used to represent the Activity in the model layout. All
Activity icons are arranged into sets. The set consists of predefined sets and user defined sets. (See
“Importing Graphics Image Files” on page 168.) The Icon Set field lists the sets of icons available.
The set All lists all icons regardless of set. Every Activity has several icons from which to choose.
The names of the standard icons differ slightly for each Activity, because they include the name of
the Activity.
Point and click on and icon’s name to select it. The icon button on the right gives a reduced view of
the icon. Click the icon button to see the actual size. GIF, JPG, and PNG files may be imported and
used as custom icons for Activities.
Adding a Comment
Use the Comment field to add a brief comment describing the purpose of this Activity. This field is
optional. Printing Process Documentation or Model Documentation will include comment in the
document. The comment will appear on the status bar when an Activity is selected.
Documenting the Activity
The Document button opens an editor in which descriptive information may be added about the
Activity. The editor opens with a preformatted template which is changeable. (See “document
Subdirectory” on page 474.) Print Document text using the SIMPROCESS Print facility.
Labeling with Text Blocks
The Text Block tab adds up to three lines of text to the inside of the icon on the layout.
SIMPROCESS User’s Manual
72
Using the Layout Toolbar to Create Activities
Text Block labels facilitate understanding of the Activity or Process in relation to the model.
Add descriptive labels to an icon by performing the following tasks:
1. Click on Text Block tab:
2. Fill in one to three lines of text.
3. Set the desired font attributes.
4. Make sure the Show Text Box is checked. The text entered is not displayed in the model unless
this box is not checked.
5. Click on OK.
Note: The Text Block is best used with blank box icons. Icons with a picture on them will not show
the Text Block properly.
Process properties include an additional option on the Text Block tab. The Add Text Label check box
places a label that contains the text of the Text Block inside each alternative of the Process.
SIMPROCESS User’s Manual
73
Using the Layout Toolbar to Create Activities
The lines of text are appended together with a space between each line to create the label. Select the
Properties button to set whether the label should be displayed horizonally or vertically and to set the
Font Attributes
of the label.
The label will be centered across the top of the layout when Horizontal is selected, and the label will
be centered along the left of the layout when Vertical is selected. Note that the labels cannot be
resized or moved. Changes can only be made from the Text Block tab of the Process properties
dialog. Defaults for Horizontal or Vertical and the Font Attributes can be set on the Text Label tab of
the Preferences dialog (Edit/Preferences).
Getting Help
The Help button displays information about the purpose of the Activity and the fields and buttons
on the General tab of the dialog. The other tabs have Help buttons that are specific to that tab.
SIMPROCESS User’s Manual
74
Generate Activity
Generate Activity
Generate Activities create Entities for a model during a SIMPROCESS simulation. Generally, the
first Activity defined in the model is a Generate.
SIMPROCESS generates Entities at the rate defined in the Generate Activity. Entities can be
generated at a constant number and rate, such as a specified interval of time, or according to a
statistical distribution. The schedule of generation can be as simple as one constant rate, or as
complex as dozens of different rates depending on the hour of the day, day of the week, season of
the year, etc.
A Generate Activity can generate one or more types of Entities
Defining a Basic Generate Activity
Click on the Entity pull-down arrow to select the default type of Entity to be generated by this
Generate Activity. The default Entity type can be overridden in each schedule.
Entities may be defined using the New Entity command button on this dialog.
Use the Quantity field to specify the default number of Entities to be generated each time Entities
are released. A specific number or probability distribution can be entered in the Quantity field or a
selection may be made from the Quantity pull-down list. The default quantity can be overridden in
each schedule.
SIMPROCESS User’s Manual
75
Generate Activity
A periodic schedule is the default schedule. The periodic schedule sets the interval and the time
unit. It will default to an interval of 1.0 and time unit of Hours. These defaults can be changed by
selecting the schedule (Periodic1) and choosing Edit. Change the name of the schedule, override the
default Entity type and quantity, and set the interval and time unit with this method.
The Interval field defines the time between Entity generation events. Enter a constant value or a
statistical distribution. Entities are generated at the end of each interval:
For example, assume Customer Orders to arrive at an exponential rate, with an average of 20
arrivals per hour. Click on the Interval pull-down arrow and find the definition for Exponential
Distributions. It reads:
Exp(10.0)
Select the distribution. Then, click on the details button to the right of the pull-down
arrow.
This displays a dialog for defining the parameters of the distribution:
Set the Mean value to indicate an average Entity generation rate of 20 per hour.
Assume that Quantity is 1, meaning that only one Entity is produced at each Entity generation
event:
SIMPROCESS User’s Manual
76
Generate Activity
•
Generate an Entity every 3 minutes to get 20 Entities in an hour (60 minutes).
The View button displays a graphical representation of the distribution:
Stream
identifies the random number stream used to seed the distribution.
More can be learned about statistical distributions and random number streams in Chapter 3,
“Statistical Modeling Constructs,” beginning on page 94.
SIMPROCESS User’s Manual
77
Delay Activity
Delay Activity
Delay Activities, common building blocks found in most models, have two functions: they
represent the passage of time during simulation and define the Resources required to perform a
task. The cycle time of an Entity traversing the model is the sum of the delays it encounters, i.e., the
time spent at the Activities in its path plus any hold time for a condition to be met and the wait time
for any Resources.
The Resources button opens a dialog for specifying the Resources required to perform an Activity.
See Chapter 5, “Resource Modeling Constructs,” beginning on page 147 for instructions on
defining Resource requirements for an Activity.
Specifying Delay Duration
Value represents the amount of time required to perform an Activity. This delay time can be
expressed as either a constant value or a statistical distribution.
Time Units determines if the Duration entered is measured as nanoseconds, microseconds,
milliseconds, seconds, minutes, hours, days, weeks, months, or years.
Type the value of the delay duration directly in the field, or select a value from a pull-down list.
A Delay Activity might be defined to represent the task of processing an order. This task takes an
average of 30 minutes to perform, though it may take as little as 15 minutes, or as much as 1 hour.
As shown below, a Triangular distribution is often used to represent the time required to complete a task:
SIMPROCESS User’s Manual
78
Delay Activity
1. Click on the arrow to the right of the Value field to display a list of distributions:
2. Scroll through the list to find the default definition for Triangular distributions. It reads:
Tri(0.0,5.0,10.0)
Select the distribution.
3. Click on the box to the right of the Value field. Fill in the following values:
•
Minimum
•
Select Minutes from the Units field.
of 15, Mode of 30, and a Maximum of 60.
4. Click on View to see what the curve looks like.
5. Click on OK to accept the definition.
See Chapter 3, “Statistical Modeling Constructs,” beginning on page 94 to learn more about these
parameters and the topic of statistical distributions.
SIMPROCESS User’s Manual
79
Dispose Activity
Dispose Activity
A Dispose Activity disposes of Entities when they are no longer needed in the simulation. The
Dispose marks the end of an Entity’s cycle time for the purpose of statistic collection (e.g., cycle
times and counts).
Dispose Activity Properties
The Dispose Activity Properties dialog contains only one unique field: Maximum Entity Count. Use
this field to set a limit to the number of Entities that can be disposed of at the Dispose during a
simulation. The simulation ends if this limit is reached. End a simulation after 1,000 customer
orders are processed by setting Maximum Entity Count to 1,000.
Leaving Maximum Entity Count undefined or setting a value of 0 or “none” indicates that there is no
limit.
SIMPROCESS User’s Manual
80
Defining an Entity
Defining an Entity
A particular type of Entity or a particular instance of an Entity may be referred to in the model.
When an Entity type is referred to, all Entities of a particular type, e.g., customer orders are also
referred. An Entity instance refers to an individual Entity (a single customer order).
Defining Entities in SIMPROCESS defines a type; SIMPROCESS generates instances of that
Entity during a simulation run. Define Entities in the following manner:
1. Click on Define on the SIMPROCESS menu, and then select Entities... from the pull-down
menu.
2. Click on Add to define a new Entity.
3. Specify the Entity Type Properties:
•
Entity Name identifies the type of Entity. Name can be any unique entity name.
Double-click on the default name supplied by SIMPROCESS, and enter Customer
Order as the Entity Name.
•
Entity Icon is the icon which will represent this Entity during a simulation run. The icon
appears during simulation if the Animation option is on.
Click on the downward-pointing arrowhead next to the Entity Icon field to get a list of
different icons to choose from the currently selected Icon Set.
•
Priority values range from 1 to 100. When Entities contend for the same Resource, the
Entity with the highest priority gets precedence.
SIMPROCESS User’s Manual
81
Defining an Entity
•
Preempt Lower Priority Entities sets
•
Entity Attributes, Entity Type Attributes, Entity Expressions, and Entity Type Expressions
whether instances of this type will preempt lower
priority Entities. If true, when an instance of this type reaches an Activity that uses
Resources and there are no Resources available, and the Entity currently using the
Resources is a lower priority Entity, this higher priority arriving entity instance will cause
the lower priority Entity to release the Resources so this Entity can obtain the Resources
and Process.
are used in association with any attributes or expressions defined for this Entity. A choice
can be made to create a new copy of an attribute or evaluate an expression every time
an instance of an Entity is created. Alternatively, one copy of an attribute can be created
or an expression evaluated once for an Entity type and have all instances refer to this
value. Attributes and expressions are discussed in Chapter 10, “Customizing a Model
with Attributes and Expressions,” beginning on page 237.
•
Document... opens an editor window into which extensive comments can be entered about
the Entity and the model. This is optional. The Entity document headings can be
customized. (See “document Subdirectory” on page 474.)
•
Metadata... opens a dialog for metadata entry. See the SIMPROCESS Metadata Manual
for information on using metadata in a SIMPROCESS model.
•
Comment
is used to enter brief text describing the purpose of the Entity.
4. Click on OK when data entry is completed. The defined Entity is added to the table in the Entities
dialog.
5. Add another Entity and name it Shipment. Click on the pull-down arrow next to the Icon field
to get a list of Entity icons.
SIMPROCESS User’s Manual
82
Defining an Entity
The list may be a lot longer than it first appears. Click near the top of the scroll bar to see
more list items. Select GreenDot. Then click on OK. The icon selected will appear on the
button next to the icon list. Clicking the button will bring a dialog that shows the default
size of the icon.
Note that the basic properties of Entities added to the model can be edited directly from the
table. However, changes made in the table are direct changes to the properties of the Entity
and cannot be canceled. Also, the table can be sorted by a particular column by clicking on
the column header. Holding the Shift key while clicking on a column header causes the
table to sort in the reverse order.
Copy the properties of an existing Entity (such as the one just defined) by selecting the Entity in the
table and click on the Copy button. Enter a different Entity Name and make any other changes on the
Entity Type Properties screen, and then click on OK.
Remove an existing Entity by selecting the Entity and clicking on the Remove button. The Undo
button restores Entity definitions that have been removed. Click on Close when Entities are defined.
SIMPROCESS User’s Manual
83
Defining Resources and Processes
Defining Resources and Processes
Resources
The next thing to define in the model are the Resources required to process Customer Order
Entities. To keep things simple, define just one Resource, the clerks needed to process customer
orders.
1. Select Resources... from the Define pull-down menu.
2. Select Add to define a new Resource.
See Chapter 5, “Resource Modeling Constructs,” beginning on page 147 for an explanation of the
remaining options and commands, and for more details on defining Resources, including predefined Resource types.
Processes
A SIMPROCESS Process defines Processes hierarchically. In this example, we will define a Process that
indicates how customer orders are handled
Select the Process button from the Layout Toolbar and click on the layout.
Display a dialog for defining the Process. Do this by either:
•
Clicking on the Process icon to select it, and then pressing Alt+Enter
SIMPROCESS User’s Manual
84
Defining Resources and Processes
•
Selecting the Process icon, and then selecting Edit from the menu bar, followed by Properties...
Alternative Sub-Processes
A Process may consist of a set of Alternative sub-processes. Each sub-process can represent an
alternative implementation of the Process. This allows the creation of many variations of a Process
and keeps them organized in one place.
Only one sub-process can be active at any point in time. An experiment may be run with
Alternative sub-process 1 active to measure the overall performance of the model. Alternative subprocess 2 can then be run and results compared.
SIMPROCESS defines a single default sub-process when a Process is created. Renaming the subprocess to something more meaningful for the model is accomplished by:
1. Selecting it from the Alternative Sub-Processes list on the Process dialog.
2. Clicking Edit to modify the sub-process definition.
3. Highlighting the existing name and typing over it. For this example, call the sub-process Main.
4. Click on OK.
The new name appears in the Alternative Sub-Processes list and becomes the sub-process.
SIMPROCESS User’s Manual
85
Defining Resources and Processes
More sub-processes may be added to the Process by clicking on Add and naming the new subprocess. Activate a different sub-process by selecting it from the Alternative Sub-processes list.
Sub-processes may be deleted with the Remove command button and copied using the Copy button.
Click on OK when the Process is defined.
Adding Detail to a Process
Once a Process is defined, define the Activities and Processes that make up the Process.
Right-click on the Process icon and choose Descend to open the layout of the currently active subprocess
A blank layout is shown, except for two Pads: an input Pad on the left and an output Pad on the right.
If the output Pad is not visible, scroll to the right.
These Pads connect any Processes and Activities at this level of the sub-process to the Activities
and Processes at the next higher level. Once the input and output Pad are connected by Connectors,
Entities flow from level to level.
SIMPROCESS User’s Manual
86
Defining Resources and Processes
Activities (and Processes) may be added within the sub-process to detail the tasks being performed.
NOTE: Make sure the Input and Output Pads are connected on all sub-processes. If this is not
done, Entities will have no path to follow across the Process. Entities entering the Process will
never emerge again.
SIMPROCESS User’s Manual
87
Simulation Setup
Simulation Setup
Two steps are needed before running a simulation:
•
Set the run time parameters for the simulation. This could include start and end dates or number
of times to repeat the simulation.
•
Set animation parameters.
Run Settings
Select Simulate from the SIMPROCESS menu and then click on Run Settings… to set run time
options.
Setting the Start and End Dates
The values chosen for the Start and End fields determine how long the simulation runs, in calendar
time. A simulated month of processing can be specified as:
Start:
1/1/2007 00:00:00:000:000:000
End:
2/1/2007 00:00:00:000:000:000
This indicates a starting date of January 1, 2007, at midnight, and an end date of February 1, 2007,
at midnight. The simulation terminates as soon as the clock strikes midnight at the end of January
31. The calendar button next to each date field can be used to set the date for that field. The
calendar button causes a graphical calendar to appear. The date selected on the graphical calendar
populates the appropriate date field.
A time must be entered or the hours, minutes, seconds, nanoseconds, microseconds, and
SIMPROCESS User’s Manual
88
Simulation Setup
milliseconds fields default to zero.
NOTE
Remember that Start and End dates for objects in the model,
must be coordinated those with the simulation run dates.
For example, a Generate Activity with Start and End dates
that fall outside of the simulation Start and End dates will not
generate Entities during the simulation. Or, a Resource
Downtime with Start and End dates outside of the simulation
Start and End dates will not be applied.
Run Dates and the Real Calendar
Both entity generation schedules and resource downtime schedules can be based on a day of the
week. SIMPROCESS calculates the day of the week, as well as the month, year, and time of day, at
any moment in a simulation. It maps the simulation dates to the real calendar. For example, in 2007
the year begins on a Monday.
Setting the Simulation Time Unit
SIMPROCESS allows the Simulation Time Unit to be set, which is the time unit of the simulation
clock. The simulation clock must maintain a constant time unit. The default is Hours. Even though
each individual time unit can be different, those times are converted to the time unit of the
simulation clock. Also, this is important for reducing rounding errors. If the primary delays in the
model are in seconds or less, the time unit of the simulation clock should be set to Seconds or less.
Converting a delay in nanoseconds (or even seconds) to hours could result in rounding errors,
whereas converting a delay in nanoseconds to seconds or less would not.
Animation Settings
SIMPROCESS User’s Manual
89
Simulation Setup
Show Clock
turns the simulation time clock on or off while the simulation is running.
Show Counts. If Show Counts is turned on, each Activity or Process will display a number above its icon.
•
•
•
Generate Activities show the number of Entities generated.
Dispose Activities show how many Entities have been disposed.
All other Activities and Processes show how many entities are in that Process or Activity.
Show Entities turns the display of Entities on or off during the animation. Showing Entities assists with
visualizing the workflow.
Update Dynamic Labels
turns the display of dynamic labels on or off during the animation.
Animation Speed.
Changes the Animation Speed during the simulation. The fastest value is 100, and
the default is 20. A smaller value is better while debugging the model.
SIMPROCESS User’s Manual
90
Running a Simulation
Running a Simulation
Start the simulation running, either by clicking the run icon on the tool bar, or selecting Simulate
from the SIMPROCESS menu bar, followed by Run.
Before starting the simulation, SIMPROCESS does two things:
1. Prompts for saving the latest changes to the model
2. Checks the model for errors.
SIMPROCESS issues informational messages and aborts the simulation if errors are found.
Choose Verify Model from the Simulate menu before running to check the model for errors before
running a simulation.
Running a Simulation with Model Parameters
If the model has User-defined Attributes which were selected as Model Parameters, when the
simulation run is started, SIMPROCESS will prompt for initial values for those Model Parameters.
The Model Parameters are displayed in a table. The column under Parameter gives the name of the
User-defined Attribute. The Value column shows the value the attribute will have at the start of the
simulation run.
To change the value of a Model Parameter, select it in the table. The Description of the selected
parameter will be displayed below the table along with its default value and the mode of its value
(integer, real, etc.)
The next step is to enter the desired value of the Model Parameter in the Value field. If Reset is
pressed, the selected Model Parameter will return to its default value. The Reset All button, under
the Help button, will set the value of all the Model Parameters back to their defaults.
Creating Model Parameters from User-defined Attributes is covered in Chapter 10, “Customizing a
Model with Attributes and Expressions,” beginning on page 237.
Model Parameters can be changed during a simulation run by selecting Change Model Parameters
from the Simulate menu.
Allowable Actions During a Simulation
While a simulation is running, a Process can be descended into to view Entity movement within the
Process hierarchy. Descending into a Process is done by using Descend on the View menu, clicking
SIMPROCESS User’s Manual
91
Running a Simulation
the down arrow on the tool bar, right clicking on a Process and choosing Descend, or by doubleclicking on a Process.
Choose Ascend on the View menu to ascend to a higher level of the model hierarchy. Click the up
arrow on the tool bar, right click on blank area and choose Ascend, or double-click on any blank
area of the model layout. Choose Go To Top instead of Ascend to ascend to the top level of a model.
The Simulate option on the menu bar causes the following options to occur:
•
•
•
•
Pause the simulation
Resume simulation after a pause
Stop the simulation before its scheduled end
Click on Animation Settings to change animation options. The simulation pauses while this
is being done. Changing the animation options using the tool bar does not pause the simulation.
Double click on an Activity icon to bring up its properties dialog. However, any changes made will
not be reflected in the running simulation.
Animation can be recorded for playback after the simulation ends. (See “Post Simulation
Animation” on page 172.)
SIMPROCESS User’s Manual
92
Standard Report
Standard Report
After the simulation run has completed, the Standard Report may be displayed to view output
statistics for the model. From the Report menu bar, choose Display Standard Report.
This will open the Display Standard Report dialog. In the Report Replications list box (if the model
ran for multiple replications), select an individual Replication, the Average of All Replications run,
or the Sum of All Replications run. Typically, the report of interest will be the Average of All
Replications report. Calculate Confidence Intervals is activated if the Average of All Replications
report is selected, which allows selection of 90%, 95%, or 99% confidence intervals for each
performance measure. Select to view the Standard Report with a Text Editor (Wordpad by default)
or with a Spread Sheet and press the Display Report button to open the report.
See Chapter 8, “Output Reports,” beginning on page 185 for more detail on the Standard Report.
SIMPROCESS User’s Manual
93
CHAPTER 3
Statistical Modeling Constructs
SIMPROCESS allows the analyzing of processes using discrete event simulation. This
means that SIMPROCESS models systems by taking the processes that happen in the real
world and breaking them down into the key events that occur. Parts move to a station in a
factory, are processed, and then move to the next station. If one part goes into a station and
one part comes out, then the most important aspect of modeling the station would be to
capture the processing time (which, in the real world, will vary due to any number of factors) by a statistical distribution.
A statistical distribution is used to give the model the randomness that always occurs in
the real world. Of course, if things in the real world never varied, simulation would not be
needed! Mean-value analysis of your system would suffice. Mean-value analysis is a simple way of predicting system performance by looking only at average rates. Unfortunately,
the real world almost never matches the performance predicted by mean-value analysis,
because statistical fluctuations almost always need to be taken into account.
Expertise in statistics or modeling is not needed to use SIMPROCESS, though; just having
some idea of how things vary is enough. If data shows it usually only takes 5 minutes for a
clerk to process some paperwork, but it can take as long as 15, that is the beginning of a
statistical model of that clerk. Exact answers are not necessary, just general behavior.
Introducing a small amount of randomness through simulation can be all that is needed to
transform a simplistic mean-value analysis into a realistic model.
SIMPROCESS provides a visual flow through the system, in addition to being able to model
SIMPROCESS User’s Manual
94
processes’ statistical nature. It is very difficult to know how people, machinery, deliveries, and
resources are going to interact in a proposed system. SIMPROCESS shows how these interactions
might occur while still in the planning stage. Animation provides valuable insight into how things work
and how they could work.
SIMPROCESS User’s Manual
95
Random Number Generation and Standard Distributions
Random Number Generation and Standard
Distributions
Random Number Generation
SIMPROCESS contains 215 random number streams, each having a different random number
seed. You can view the seeds available from Seeds on the View menu.
The purpose of using different random number streams in the model is to control variance. This is
an advanced topic well beyond the scope of this manual. Please refer to texts on statistics and randomness, including Simulation Modeling and Analysis by Law and Kelton (McGraw-Hill).
Standard Distributions
SIMPROCESS includes many standard probability distributions built in, and you can also create
empirical distributions from your own data. The following paragraphs discuss selecting distributions and provide brief descriptions of some of the most common standard distributions.
Choosing the Right Distribution for Your Data
It is not always clear which of the standard distributions should be used. Fortunately, simulation
results are usually not highly dependent on the choice of distributions. A distribution with approximately the right shape should be adequate.
ExpertFit (Tools menu) uses sophisticated statistical tests to determine the best fit distribution to a
set of experimental data. Additional information on ExpertFit is covered in the ExpertFit documentation, which is located on the Help menu in ExpertFit.
ModelFit, which is used with the Auto Fits feature, also fits distributions to empirical data. (See
“Auto Fits Distributions” on page 101.)
Common Distributions
Poisson: Used to model arrivals where the quantity within a time frame is known. Parameter:
Mean.
Exponential: Used to model the time between arrivals. Parameter: Mean.
Normal: Bell-shaped curve; avoid when mean is near zero. Also, the normal distribution is not usually a good distribution for service times since service times are usually skewed to the right. Parameters: Mean, Standard Deviation
SIMPROCESS User’s Manual
96
Random Number Generation and Standard Distributions
Lognormal: Can be good distribution for data that is skewed. Parameters: Mean, Standard Deviation
Triangular: Useful distribution for data that has the least amount of time, the most likely time, and
the most amount of time it takes to perform a task. Parameters: Minimum, Mode, Maximum
A complete listing of the statistical distributions available in SIMPROCESS is available in Appendix D. See “Statistical Distributions” on page 477.
SIMPROCESS User’s Manual
97
User Defined Distributions
User Defined Distributions
There are three methods for creating User Defined Distributions listed on the Define pull-down
menu. The first, Standard…, customizes an existing SIMPROCESS distribution. The second,
Tabular…, creates a statistical distribution from discrete data points using a table format. Auto Fits...
automatically fits a distribution from sample data at the beginning of a simulation. The sample data
can be in an ASCII file, spreadsheet, or database. ModelFit is used to perform the distribution
fitting. (See Help/About SIMPROCESS... for information on ModelFit.) Note that the Auto Fit feature
is licensed separately from SIMPROCESS.
These User Defined Distributions can be used anywhere in the model where a statistical
distribution is specified.
Standard Distributions
1. Using the Define Distributions pull-down menu, select Standard.... Use this dialog to Add, Edit,
Copy, or Remove User Defined Distributions found in the list box. Undo retrieves a distribution
that has been removed.
2. Choosing the Add, Edit, or Copy button brings up another dialog as shown below, where you
type in the Name and distribution:
Name
is any unique non-blank user distribution name.
Select a distribution for modification.
SIMPROCESS User’s Manual
98
User Defined Distributions
3. Using the distribution text box, either change the parameters of the distribution within the
parentheses or select the details button (three dots). This button opens a dialog containing the
parameter descriptions, e.g., Erlang parameters.
4. To see the PDF (Probability Distribution Function) and CDF (Cumulative Distribution Function) plotted, choose the View button from the dialog shown in Step 3. The PDF is labeled on
the left y-axis, the CDF on the right y-axis.
5. The graph can be saved to a file. To continue, select Close from the graph’s File pull-down
menu.
6. Once the data is entered, choose OK, and the defined User Distribution is added to the list box.
This User Defined Distribution can now be used anywhere in the model where a statistical distribution is specified.
7. To copy an existing User Distribution, select the distribution, choose the Copy button, and you
can enter another Name for the distribution.
8. To remove an existing User Distribution, select the distribution, and choose the Remove button.
9. Choose the Close button to finish with User Distributions.
Tabular Distributions
Tabular Distributions creates a statistical distribution from a table of discrete data points.
1. Select Tabular... from the Define Distributions pull-down menu. Use this dialog box to Add, Edit,
Copy, or Remove Tabular Distributions in the list box.
SIMPROCESS User’s Manual
99
User Defined Distributions
2. Choosing the Add, Edit, or Copy button brings up another dialog as shown below:
3. Type in the Name any unique non-blank User Distribution name.
4. Type is selected from the list box. Choose either a Discrete or Continuous probability distribution
function. If Discrete is chosen, only the exact values indicated in the right column will be chosen
when the distribution is sampled. If Continuous is chosen, SIMPROCESS will interpolate from
the specified Values and the probabilities associated with them.
5. To update the table, point and click on the cell you wish to modify. Type the number in the table
cell directly.
Rows may be added and deleted by clicking on a cell and then choosing the appropriate button
on the right. The row will be added above the one selected. The Erase Cell button causes the
entry in the selected cell to be erased.
A table may also be populated by importing data from a text file using the Import button.
Choose the View button to see the PDF and CDF plotted. The graph can be saved to a file.
Select Close from the graph’s File pull-down menu to continue.
6. Once the data is entered, choose OK, and the Tabular Distribution is added to the list box. This
Tabular Distribution can now be used anywhere in the model where a statistical distribution is
specified.
7. To copy an existing Tabular Distribution, select the distribution, choose the Copy button, and
enter another Name for the distribution.
8. To remove an existing Tabular Distribution, select the distribution, and choose the Remove
button.
9. Choose the Close button when the Tabular Distributions are complete.
SIMPROCESS User’s Manual
100
User Defined Distributions
Auto Fits Distributions
Creating an Auto Fit Distribution
Auto Fits Distributions creates a statistical distribution from external sample data using ModelFit.
1. Select Auto Fits... from the Define Distributions pull-down menu. Use this dialog box to Add,
Edit, Copy, or Remove Auto Fits Distributions in the list box.
2. Choosing the Add, Edit, or Copy button brings up another dialog as shown below:
3. Type in the Name any unique non-blank User Distribution name.
4. There are three tabs (File, Spreadsheet, and Database) that are used to specify the source of the
sample data. One or more types of data source can be used. However, only one list of sample data
will be fitted. Thus, if more than one data source is used, the data from all selected sources are
combined into one list for distribution fitting.
5. The File tab is used to specify an ASCII file as the data source. Use File Data Source must be selected
to use this type of data source. The Browse button can be used to locate the file. It is recommended
that the file be located in the model’s directory. Note that the file must contain a single column
of numbers with no header and no non-numeric values.
SIMPROCESS User’s Manual
101
User Defined Distributions
6. The Spreadsheet tab specifies a spreadsheet as a data source. The Spreadsheet can be a Workbook
file or an XML Spreadsheet. Once Use Spreadsheet Data Source has been selected, four fields are
required: File Name, Sheet Name, Starting Row, and Column. The Browse button can be used to locate
the spreadsheet file. Again, it is recommended that the file be in the model’s directory. Enter the
name of the worksheet in the Sheet Name field. Starting Row should have the row number (rows
start with 1) that contains the first value. Column should have the column number (column A would
be column number 1) of the sample data. The data must be in a single column with no empty cells.
The data is read beginning at the Starting Row and continues until an empty cell is reached. Both
Starting Row and Column are distribution list fields. Thus, the Starting Row and Column can be
parameterized (such as Evl(Model.StartingRow) or Evl(Model.Column) where
Model.StartingRow and Model.Column are Model Attributes designated as Model Parameters).
7. The Database tab is used to specify an SQL database as the data source. Use Database Data Source
must be selected to use this type of data source. Two items are required: DSN/Properties File and
SQL Query. DSN/Properties File must contain the database location/connection information. DSN
stands for Data Source Name and is the DSN established in the Windows ODBC Control Panel.
(See “Setting Up Database Using Windows and Open Database Connectivity (ODBC)” on
page 296 for more information on DSNs.) Properties File is the name of the properties file that
contains the JDBC url and driver information and, if necessary, username and password. A
Properties File must be used on a non-Windows system and must be located in the model’s
directory. (See “OpenDatabase” on page 298 for more information on Properties Files.) SQL Query
SIMPROCESS User’s Manual
102
User Defined Distributions
must contain the query that returns the sample data. The query can be parameterized by using model
attributes. For example, "Select TIME_VALUE From TimeTable" can be changed to
"Select Model.TableColumn From TimeTable". In this example,
Model.TableColumn is a STRING Model Attribute that contains the name of the column to read.
Note that if the query returns multiple columns, only the first column will be read for sample data.
8. Below the data source section of the dialog are two checkboxes: Set Default Type and Set Default
Bounds. These checkboxes allow "hints" about the sample data to be passed to ModelFit.
Information about the sample data can be useful in obtaining a proper distribution fit. If Set Default
Type is selected (default), then either Continuous (default) or Discrete can be selected. For
example, sample data representing time between arrivals is usually Continuous, whereas sample
data representing number of arrivals is usually Discrete. If Set Default Bounds is selected, then
the lower and upper bounds can be set and passed to ModelFit. Enter Lower Bound Value contains
two selections: -Infinity and 0.0. Enter Upper Bound Value contains one selection: Infinity. Other
numeric values can be used as bounds by typing the values in the appropriate field. For instance,
if the sample data represents task times, then there could be a minimum and/or maximum time
to perform the task. Thus, the fitted distribution should reflect those times. In the example below,
5 is the lowest possible value that the fitted distribution should return. This means the task
represented by the sample data has a minimum completion time of 5 (minutes, hours, etc.). Note
that if neither checkbox is selected, then no information about the sample data is passed to
ModelFit.
SIMPROCESS User’s Manual
103
User Defined Distributions
9. When selected, Always Execute Auto Fit at Simulation Start, causes the data sources to be read and
the distribution to be fitted every time the model is run. Note that fitting will also occur at the
beginning of a simulation if Always Execute Auto Fit at Simulation Start is not selected and the Fitted
Distribution field is empty (Fit Now has not been executed). An error will occur at simulation start
if distribution fitting is attempted, and the Auto Fit license has not been activated.
10. Stream contains the random number stream (1 - 215) to use when drawing random samples from
the Fitted Distribution.
11. The View Data button reads the data sources and displays a list of the sample data along with
summary statistics. The summary statistics include Number of Samples, Minimum, Maximum,
Mean, Standard Deviation, Median, Skewness, and Coefficient of Variation.
SIMPROCESS User’s Manual
104
User Defined Distributions
Note that if the Spreadsheet data source Starting Row or Column or Database data source SQL
Query are parameterized, the View Data button will not return data. A parameterized Spreadsheet or Database data source can only be read at the beginning of a simulation. View Data
includes data validation so it can be used to verify the data before a distribution fit.
12. The Fit Now button reads the data sources and calls ModelFit to perform the distribution fitting.
If a good fit is obtained, the Fitted Distribution field displays the results. Note that Fit Now will not
work if either the Spreadsheet or Database data sources are parameterized (see above). Fit Now
includes data and distribution validation so it can be used to verify the data and distribution fit
before a simulation run. The example error below shows that ModelFit created a Uniform
distribution with a negative lower bound. A negative lower bound is not allowed. (See “Statistical
Distributions” on page 477 for information on distribution requirements.) Also, an error will occur
if the Fit Now button is clicked and the Auto Fit license has not been activated.
13. The Fitted Distribution field contains the results of an Auto Fit. The contents of the field can be
selected and copied, but any changes to the field will not be saved. The details button to the right
of the Fitted Distribution field can be used to view the individual parameters and view a plot of
the distribution. Any changes made to the distribution parameters on the detail dialog will not be
saved.
14. ModelFit Alternatives contains alternative distribution fits for the sample data. An empty list means
that ModelFit determined that there were no acceptable alternatives. To use an alternative
distribution, either select the distribution then click the Select Alternative button or double click
the desired alternative. The primary distribution will be placed into the list of alternatives, and
the selected alternative will be placed into the Fitted Distribution field. Note that ModelFit
Alternatives are only applicable when using the Fit Now button. It is not possible to select an
alternative when Auto Fit is run at simulation start. The primary distribution will always be used
when Auto Fit is run at the beginning of a simulation. (When running Auto Fit at simulation start,
SIMPROCESS User’s Manual
105
User Defined Distributions
alternatives generated by ModelFit are written to the simprocess.log file.) To use an
alternative as the primary distribution, Always Execute Auto Fit at Simulation Start must not be
selected.
15. ModelFit Warnings contains warning messages from ModelFit concerning the Fitted Distribution.
These warnings are only displayed here when the Fit Now button is used. The warnings are written
to the simprocess.log file (SPSYSTEM directory) when fitting occurs at simulation start.
None is displayed if there are no warnings. The text of ModelFit Warnings can be selected and
copied using the platform specific keyboard shortcuts.
SIMPROCESS User’s Manual
106
User Defined Distributions
Empirical Distributions
Sometimes ModelFit cannot fit the sample data to one of the SIMPROCESS distributions. This
could be due to the sample data representing a distribution that SIMPROCESS does not support, an
insufficient sample size, or both. When this happens, ModelFit returns an empirical distribution.
The distribution defaults to Continuous unless Discrete is selected in Set Default Type.
An empirical distribution is a histogram based distribution and follows the format of the SIMPROCESS Tabular distribution (page 99). The distribution type displayed in the Fitted Distribution field
will be Emp followed by pairs of cumulative probability and value. The pairs are just comma separated values. In the example below, the first two pairs of cumulative probability and value are
(0.0060, 6.557) and (0.015, 7.715).
SIMPROCESS User’s Manual
107
User Defined Distributions
A table of the values can be displayed by selecting the details button next to the Fitted Distribution
field. By selecting the View button, the dialog allows viewing a Continuous or Discrete (based on
selected Type) plot of the empirical distribution. Note that changes to the Name, Type, or Stream are
not saved.
SIMPROCESS User’s Manual
108
Run Settings
Run Settings
Run Settings
Simulation Period
The Simulation Period determines how long the simulation will run. It is given in calendar and time
format. Choose an appropriate time span to see all aspects of the system.
Warmup Every Replication
When selected and the values for both the Number of Replications and Warmup Length are greater than
0, SIMPROCESS will start collecting statistics after the Warmup Length has expired for each
replication.
Warmup Length
If a Warmup Length is entered SIMPROCESS will start the collection of statistics for the model run,
after the end of the Warmup Length. This gathers information on your system after it has reached “Steady
State.”
Warmup Time Unit
The Warmup Time Unit specifies the time unit for the Warmup Length. It defaults to Hours.
Simulation Time Unit
The Simulation Time Unit specifies the time unit for the simulation clock. It defaults to Hours.
SIMPROCESS User’s Manual
109
Run Settings
Reset System
Resets the system to the initial conditions before each replication.
Verify Model on Run
Turns the automatic model verification on or off at the beginning of a simulation. The verification
process checks to make sure all pads are connected.
Number of Replications
When the model contains randomness (represented by statistical distributions) the model should be
run for multiple replications. This averages the results and gives a more accurate picture of “most likely”
outcome of the scenario being modeled.
Reports are gathered for each replication and the Sum and Average of all runs.
Reset Random Number Streams
This option resets the Random Number Stream before starting each new replication. Typically, this
should not be selected. In general terms, the reason for running the model for multiple replications
is to test how randomness affects the system. Turning this option on negates that test.
RMI Host
This indicates the host on which SPServer will be located if the model has an External schedule defined.
Defaults to “localhost.” (See “Adding an External Schedule” on page 335.)
RMI Port
This indicates the TCP port to use on the RMI Host. Defaults to 1099. (See “Adding an External
Schedule” on page 335.
Cost Periods
This tab sets the frequency over which the ABC Reports will be collected. The name of the currency
that the ABC Reports will use can also be set. (See “Setting Up Cost Periods” on page 179.)
SIMPROCESS User’s Manual
110
Run Settings
Debug Traces
This tab turns on/off debug tracing and defines debug traces. If checked, Create Entity Debug Traces
causes the creation of the debug traces defined in the box to the right. If no debug traces are defined,
no debug traces are created during the simulation run. Click the Add... button to define a debug trace.
This brings up a dialog for defining the debug trace.
Debug Trace Name is the name of the trace that will appear in the list of traces. Debug Trace File is the
name of the debug trace file to be created. If no path is included, the file will be created in the directory
of the model. Select the Entities to be included in the trace. Entity types to be included should be moved
from the list of entities on the left to the list of entities on the right. The checkboxes at the bottom are
the Entity actions that can be included in the trace. Note that the Clone, Assemble, Split, and Transform
actions apply to the Entity that initiates the action, not the Entity or Entities that result from the action.
Each debug trace file is a tab delimited file. The replication is added to the file (Replication 1,
Replication 2, etc.) and then a header line consisting of Action, Activity, Entity, SequenceNum, and
SimTime. Each action added to the file consists of the action name (Initialize, Accept, etc.), the name
SIMPROCESS User’s Manual
111
Run Settings
of the activity, the name of the entity, the sequence number of the entity, and the simulation time.
Expression Output
The SIMPROCESS Expression Language has a statement called OUTPUT. This statement displays
information in the SIMPROCESS Expression Output Dialog. (See “Expression Language
Statements” on page 257.) OUTPUT is especially useful for debugging. The Expression Output tab
offers options for the OUTPUT statement. (Note that these options also apply to the
ShowSystemAttributes and ShowUserAttributes System Methods. See “SIMPROCESS
System Methods” on page 521.)
There are two options: Suppress Dialog and Send Output to File. By default, both options are not selected.
If selected, the Suppress Dialog option prohibits the SIMPROCESS Expression Output Dialog from
displaying during a simulation. (Suppressing the dialog causes the simulation to run faster.) If Send
Output to File is selected, the OUTPUT statements are written to the file entered in the adjoining text
field. Since the file defaults to the model’s directory, the file name entered must not contain a path.
These options apply when running simulations using the Experiment Manager (see “Experiment
Manager” on page 387). However, Suppress Dialog has no affect on the Experiment Manager Status
SIMPROCESS User’s Manual
112
Run Settings
Messages dialog.
SIMPROCESS models can be run without the SIMPROCESS Graphical User Interface (see “Running
Models Without GUI” on page 599). The optimization tool OptQuest (see “OptQuest for
SIMPROCESS” on page 401) and the SIMPROCESS Dispatcher do this. (The SIMPROCESS
Dispatcher is an optional feature that allows SIMPROCESS to be used with a Web service. If the
SIMPROCESS Dispatcher was installed, see SIMPROCESS Dispatcher.pdf in the
dispatcher directory for more information.) If Suppress Dialog and Send Output to File are not
selected, then OUTPUT statements are written to the appropriate log file. In most cases, the log file
will be simprocess.log in the SPSYSTEM directory. When using OptQuest, the log file is
optQuest.log in the SPSYSTEM directory. The Dispatcher log file is Dispatcher.log. Its
location is dependent on where the Web service is located. If either Suppress Dialog or Send Output
to File is selected, then no information is sent to a log file. When Send Output to File is selected, the
OUTPUT statements are written to the designated file.
Whether running a model with or without the SIMPROCESS GUI, the file designated in Send Output
to File will contain output for all replications; however, when the same model is run again, the file will
be overwritten. So if a user, the Experiment Manager, OptQuest, or the SIMPROCESS Dispatcher
runs the same model multiple times, the file will only contain information from the last run.
Time Server
SIMPROCESS models have the ability to let an outside agent manage the advancement of simulation
time. The TimeServer is a separate application which can manage simulation time for multiple
participants. It can be run on the same machine as SIMPROCESS or on another system. See
SIMPROCESS TimeServer.pdf in the timeserver directory for more information, including
how to configure and run the TimeServer application. The timeserver directory is in the
SIMPROCESS installation directory.
The TimeServer supports one or more groups of players. Each group has a unique name among those
handled by a single instance of the TimeServer, and each group manages its own time independently
of all other groups. Thus, for a SIMPROCESS model to use the TimeServer, it must join a predefined
TimeServer group as a player.
SIMPROCESS User’s Manual
113
Run Settings
Time Server Settings
The Use Time Server option is initially not selected. When selected, IP Address, Port, Group, Player Name,
and Synchronize to Nearest become enabled. Values for IP Address, Port, Group, and Player Name are
required when using the TimeServer while Synchronize to Nearest is optional.
IP Address defaults to localhost, which indicates that the TimeServer will be running on the same
system as SIMPROCESS. If the TimeServer will be running on a different system, then the IP address
or host name of that system should be entered.
Port
can be between 1024 and 65535 inclusive and defaults to 26100.
Group is the name of the TimeServer group that this model will join. Groups are defined as part of
the TimeServer configuration. See SIMPROCESS TimeServer.pdf in the timeserver
directory for more information.
Player Name is the name by which the simulation will be known to the TimeServer Group. This name
cannot be duplicated within a Group.
In the example below, at the start of the simulation, the model will join the group CallCenter as
CallCenter 1.
SIMPROCESS User’s Manual
114
Run Settings
During simulation SIMPROCESS creates events internally, each bearing a time stamp indicating the
simulation time when they will be processed. Events are placed into a queue to be processed in the
order of their simulation times. A large and complex model will handle a great many such events as
it simulates.
When a TimeServer is used to manage simulation time externally, an additional step is introduced into
this process. Before any event can be processed, SIMPROCESS must have gained approval from the
TimeServer to advance to or beyond that event’s time. Therefore, SIMPROCESS must recognize when
it has events scheduled to occur later than the most recently approved time and send a request for time
advancement to the TimeServer.
When Synchronize to Nearest is not selected, this event handling occurs naturally, as dictated by the
simulation times of each event and the responses from the TimeServer. This is referred to as full
synchronization. Events may occur with very small amounts of time between them. Large and complex
models can send a significant number of time advancement requests to the TimeServer. Depending
on the number of players participating in the simulation group, and the complexity of their respective
simulations, this can result in a great deal of time spent simply waiting for time advancement approval
and can therefore cause overall simulation performance to suffer.
Selecting Synchronize to Nearest can sometimes improve this situation. When selected, it enables the
list for selecting an available time unit, which defaults to Hours. (All valid SIMPROCESS time units
are available.) When used, SIMPROCESS will round all its requests for time advancement to integer
numbers in the selected time unit (this time unit need not match the Simulation Time Unit, discussed
on page 109, though it should usually not be a smaller unit). This is referred to as rounded
synchronization.
SIMPROCESS User’s Manual
115
Run Settings
As an example, assume that the current simulation time is 1.0 Hours and that the next event in the
simulation is scheduled to occur at 1.25 Hours. Instead of sending a request for time advancement to
1.25 Hours, a request for 2.0 Hours will be sent. This is because 2 is the smallest integer value greater
than 1.25. If the TimeServer approves the request by sending a time advance notification of 2.0 Hours
back to the SIMPROCESS model, then simulation events with times less than or equal to 2.0 Hours
will not require sending new time advance requests. So if the next three events had times of 1.5, 1.75,
and 2.0 Hours, respectively, those events would not cause new time advance requests to be sent to
the TimeServer, thus potentially improving performance by reducing the overall number of requests
sent to the TimeServer and enabling SIMPROCESS to continue processing events without delay. (If
a shorter time were approved instead, SIMPROCESS would process its events up to the newly approved
time and submit another rounded time advance request.)
Note that the effectiveness of rounded synchronization will depend in part on the strategies employed
by the other players in the group. If the other players are using full synchronization, or are using rounded
synchronization with a smaller time unit, there may little or no benefit.
Time Server Errors
Various errors can cause the premature end of the initialization or run of a simulation that is using
the TimeServer.
•
•
•
•
•
•
•
•
TimeServer is not running
TimeServer stops
Invalid Group
Group is already full (all players have joined)
Group is reinitialized
Duplicate player name
Communication error
Another player terminates with an error condition (there is an option to continue in this case)
SIMPROCESS User’s Manual
116
Run Settings
Time Server Considerations
When another player completes normally before the completion of the SIMPROCESS simulation, the
simulation will continue until it is finished. However, if another player terminates for a different reason,
SIMPROCESS will ask whether to continue or stop the simulation.
A SIMPROCESS model should not use External schedules along with a TimeServer. This can lead
to unpredictable results. See “Adding an External Schedule,” beginning on page 335 for more
information on External schedules.
It is not strictly necessary for all SIMPROCESS players to use the same Number of Replications or to
have the same setting for Reset System (both discussed on page 110). However, it’s strongly suggested
that all SIMPROCESS players in a group use the same Number of Replications and Reset System settings.
SIMPROCESS User’s Manual
117
CHAPTER 4
Activity Modeling Constructs
The SIMPROCESS Activities that were not covered in Chapter 2, “SIMPROCESS Basics,” beginning
on page 63, can be divided into two categories: Entity Related and Resource Related.
Entity Related
These Activities coordinate groups of Entities and includes:
•
Assemble. Receives two or more Entities and assembles them into a single Entity that is
released.
•
•
•
Branch. Routes Entities through different Connectors of the model network.
•
•
•
•
Unbatch. Separates a batched Entity into its constituent parts (Entities).
•
Transfer. Routes an entity from one model layout to another model layout without using a
connector.
Merge. Routes Entities from different Connectors onto one Connector.
Batch. Stores Entities until conditions set by the user are met, and then releases the Entities
in one batch. The Entities emerge as a single unit, but retain their individual Entity
identification.
Split. Divides an Entity into parent and child Entities that can undergo parallel processing.
Join. Reunites families of Entities that were created in Split Activities
Transform. Transforms an arriving Entity into a different Entity type, and releases one or more
Entities of the new type.
SIMPROCESS User’s Manual
118
•
•
Clone. Makes duplicate copies of Entities.
•
•
Assign. Assigns values to global Entity and Model Attributes and sets Entity priorities.
Gate. Accumulates Entities until a condition is met and then releases a specified number of
them.
Synchronize. Coordinates the release of various Entities.
Resource Related
Unlike other SIMPROCESS Activities, these Activities affect Resources, not Entities:
•
•
•
Replenish Resource. Adds capacity to consumable Resources.
Get Resource. Obtains a Resource and holds on to it across several Processes and Activities.
Free Resource. Releases Resources obtained by Get Resource Activities.
Resource-related Activities are described in Chapter 5, “Resource Modeling Constructs,” beginning
on page 147. The Entity-Related Activities are covered in this chapter.
SIMPROCESS User’s Manual
119
Entity-Related Activities
Entity-Related Activities
Activities that are used to coordinate grouping of Entities are addressed here. The type of coordination
to be done is specified at the Activity. Entities are queued up in these Activities (except for Unbatch
and Split) until the conditions are met. This queueing time is reported as “Hold for Condition” in the
reports. This is reported separately from the “Wait for Resource” queueing time which can accumulate
at any Activity for which a Resource requirement has been specified.
•
•
•
•
•
•
•
Assemble Activity
Batch Activity
Unbatch Activity
Gate Activity
Synchronize Activity
Split Activity
Join Activity
Assemble Activity
The Assemble Activity is used to build several Entities into a single output Entity. Consider a case
where two approvals and a check are required to form one “approved loan.” An Assemble Activity
can be used to model this process.
Assemble has two input Pads (Component and Trigger) and two output Pads (Out and NoMatch) that
determine Entity behavior. The Component Pad places incoming Entities into a queue until all Entities
to be assembled have arrived. An Entity entering the Component Pad not on the component Entity
list will immediately leave the Assemble Activity through the NoMatch Pad.
The Trigger Pad is only relevant if Hold for Trigger is selected as one of the Activity’s options. Entities
entering the Trigger Pad can trigger the release of the assembled Entities. Assembled Entities are only
released when an Entity, such as a Customer Order, arrives at the Trigger Pad. The trigger can be
released by using the FireTrigger System Method instead of having an Entity enter the Trigger
Pad. The name of the Activity must be unique within the model for the system method to work properly.
See “SIMPROCESS System Methods” on page 521.
SIMPROCESS User’s Manual
120
Entity-Related Activities
Dialog Field Definitions
sets the rank method of the queue for the Entities to be assembled. There is a separate
queue for each component Entity type. The rank method is the same for all queues. The default is First
In First Out. The rank methods are:
Rank Method
•
•
•
•
•
•
•
•
First In First Out
First In Last Out
Earliest Created First
Latest Created First
Highest Priority Value First
Lowest Priority Value First
Highest Attribute Value First
Lowest Attribute Value First
Selecting Highest Attribute Value First or Lowest Attribute Value First will cause the Attribute field to be
active. Select the desired attribute from the list. If the selected attribute is a local Entity instance or
Entity type attribute, a run time error will occur if an Entity enters that does not have the selected attribute
defined.
Component Entities
is a list of component Entities to be converted to assembled Entities. Entities on
SIMPROCESS User’s Manual
121
Entity-Related Activities
the list are queued until the specified quantity of each Entity type has entered the Assemble Activity.
•
•
•
•
•
Add:
Opens a dialog to define component Entities
Edit:
Opens a dialog to modify the component Entity definition
Remove:
Removes the selected component Entity
Batch Components: When selected, the assembled Entity batches the component Entities.
When not selected, component Entities are disposed when the assembled Entity is released.
Hold for Trigger:
Holds output Entities until an Entity enters the Trigger Pad.
Assembled Entity shows
the Entity type to be released after all component Entities have entered the
Activity. A combo box provides a list of defined Entity types.
Duration specifies the delay time of the Activity. The time set in the Duration will be applied after the
Assembled Entity has been created. Thus, the Duration will be reflected in the Cycle Time of the
Assembled Entity.
•
Value: The amount of time required to perform this Activity. Use the combo box to select a
statistical distribution or enter a constant value directly in this field.
•
Units:
Determines if the Duration entered is measured as nanoseconds, microseconds,
milliseconds, seconds, minutes, hours, days, weeks, months, or years.
Batch Activity
The Batch Activity combines several Entities into one Entity while retaining the identities of the
original Entities. The resultant Entity travels throughout the process as a single Entity. It can be
disassembled into its constituent Entities using an Unbatch Activity at some later time.
The Batch Activity is useful when combining several Entities (e.g., merchandise ordered by various
customers) into a parent Entity for transportation. After the transportation Activities, the parent Entity
can be broken down into the Entities that comprised it. Statistics can be collected for the batched Entity
separately from its constituent members.
SIMPROCESS User’s Manual
122
Entity-Related Activities
Dialog Field Definitions
Batched Entity is the type of Entity that will serve as the container or parent Entity. An Entity of this
type is created and all other Entities become children of the parent.
Quantity to Batch
is the maximum number of Entities that fit in one batch.
Maximum Hold Time: is the maximum amount of time to hold before a batch that has met the Minimum
Quantity requirement
is released.
Minimum Quantity is the minimum number of Entities that must be in a batch before it can be released.
Duration is the time specified for a Batch Activity that will be applied after the Batched Entity has been
created. It will be reflected in the Cycle Time of the Batched Entity.
sets the rank method of the queue for the Entities to be batched. The default is First In
The rank methods are:
Rank Method
First Out.
•
•
First In First Out
First In Last Out
SIMPROCESS User’s Manual
123
Entity-Related Activities
•
•
•
•
•
•
Earliest Created First
Latest Created First
Highest Priority Value First
Lowest Priority Value First
Highest Attribute Value First
Lowest Attribute Value First.
The Attribute field will be active if Highest Attribute Value First or Lowest Attribute Value First is selected.
Select the desired attribute from the list. If the selected attribute is a local Entity instance or Entity
type attribute, a run time error will occur if an Entity enters that does not have the selected attribute
defined.
Unbatch Activity
An Unbatch Activity separates a batch Entity into its constituents (children) and then destroys
(Disposes) the parent Entity. Many levels of batching are possible, i.e., batches can be composed of
batches. The Unbatch Activity defaults to only disaggregate one level of batch at a time. Unbatch Nested
Batches must be selected to disaggregate all levels.
The time specified in the Duration will be applied before the unbatching occurs. It will be reflected
in the Cycle Time of the Batched Entity.
The Unbatch Activity defaults to disposing the Batched Entity that enters the Activity. Retain Batched
Entity must be selected for the Batched Entity to not be disposed,. The Batched Entity will continue
SIMPROCESS User’s Manual
124
Entity-Related Activities
through the simulation with no child Entities.
Gate Activity
The Gate Activity accumulates Entities until some number of Entities have been received or until a
signal is received to release Entities. It then sends a designated number of Entities out into the model.
Entities can be batched in a Gate Activity.
A Gate Activity has two Pads that determine Entity behavior, the Hold Pad and the Trigger Pad. The
Hold Pad, located on the lower left of the Gate icon, is a queue for incoming Entities. Entities that
arrive at that Pad are stored here. The Trigger Pad, located on the upper left of the Gate icon, signals
release of Entities.
A Gate Activity has two gating policies that can be effective concurrently. The first gating policy is
called Trigger Release. An Entity is disposed of when it arrives at a Trigger Pad, and it triggers the release
of the number of Entities as specified in the Trigger Release Quantity field. A Trigger Pad can synchronize
the flow of Entities between different Activities.
The Gate Activity can be used as a buffer or queue to hold material from one section of the model
until a condition is met in another part of the model. A Trigger Entity is sent to the Trigger Pad of the
Gate Activity when that condition is met.
An example of this would be if customer orders are printed out and sent on to the shipping department
on an hourly basis. This could be reflected in the model by a Gate Activity, which is triggered when
it receives an Entity that is generated hourly by a Generate Activity.
The second gating policy is called Threshold Release. It allows the release of some number of Entities
once a threshold number of Entities have arrived. This policy is useful, for example, in cases where
a truck must wait until it is full before it departs.
Gating policies can be effective concurrently, so this Activity can implement a truck leaving when it
is full or on the hour, even if it is not full.
Note that Entities can be released from Gate Activities using Expressions. See Chapter 10,
“Customizing a Model with Attributes and Expressions,” beginning on page 237 for information on
Expressions. Also, see “Methods ReleaseEntity, Gate, GetEntity, EntityExists:,” beginning on
page 568.
SIMPROCESS User’s Manual
125
Entity-Related Activities
Dialog Field Definitions
Batch Entities will
batch the Entities before leaving the Activity.
Batched Entity is the type of Entity that will serve as the container or parent Entity. An Entity of this
type is created, and all other Entities become children of the parent.
Rank Method sets the rank method of the queue for the Entities waiting at the Gate. The default is First
In First Out.
•
•
•
•
•
•
•
•
The rank methods are
First In First Out
First In Last Out
Earliest Created First
Latest Created First
Highest Priority Value First
Lowest Priority Value First
Highest Attribute Value First
Lowest Attribute Value First
The Attribute field will be active if Highest Attribute Value First or Lowest Attribute Value First is selected.
Select the desired attribute from the list. If the selected attribute is a local Entity instance or Entity
SIMPROCESS User’s Manual
126
Entity-Related Activities
type attribute, a run-time error will occur if an Entity enters that does not have the selected attribute
defined.
Threshold Release
•
On/Off: Enables/disables the Threshold Release feature. Threshold Release is on when the check
box is selected.
•
Threshold Quantity:
Threshold Release
The threshold number of Entities to accumulate and release when the
is checked on.
Trigger Release
•
Release All: Releases all the accumulated Entities when a Trigger Entity has been received
on the Trigger Pad.
•
Quantity: The number of Entities to release when a Trigger Entity has been received on the
Trigger Pad. This is used with the Trigger Release policy. The value can be a constant integer
or can be derived from a statistical distribution.
The Trigger can be released by using the FireTrigger System Method instead of having an Entity
enter the trigger Pad. The name of the Activity must be unique within the model for the system method
to work properly. See “SIMPROCESS System Methods” on page 521.
Duration is the time specified for a Gate Activity that will be applied when the Entities are released.
Each Entity released will have a duration, unless the Entities were batched. In that case there is only
one duration for the Batched Entity.
Synchronize Activity
A Synchronize Activity coordinates the release of many Entities, which may be of various types. The
number of input/output Pads for a Synchronize Activity is specified. Entities arriving at each Pad are
stored in separate queues. Each queue releases one Entity to its corresponding output Pad when each
queue has at least one Entity.
A project may require four jobs to be done in parallel, with the work kept in step at various tasks within
the process. All others must be at the same stage of completion before work can proceed on one job.
Synchronize Activity may be used with four Pads to model the wait time and release of the parallel tasks.
SIMPROCESS User’s Manual
127
Entity-Related Activities
Dialog Field Definitions
Number of Pads
is the number of pairs of input and output Pads required by this Activity.
Rank Method sets the rank method of the queues for each input Pad. Each queue will have the same
rank method. The default is First In First Out. The rank methods are:
•
•
•
•
•
•
•
•
First In First Out
First In Last Out
Earliest Created First
Latest Created First
Highest Priority Value First
Lowest Priority Value First
Highest Attribute Value First
Lowest Attribute Value First
The Attribute field will be active if Highest Attribute Value First or Lowest Attribute Value First is selected.
Select the desired attribute from the list. If the selected attribute is a local Entity instance or Entity
type attribute, a run time error will occur if an Entity enters that does not have the selected attribute
defined.
Duration is the time specified for a Synchronize Activity that will be applied to each Entity when the
Entities are released.
SIMPROCESS User’s Manual
128
Entity Control Activities
Entity Control Activities
This section discusses Activities that are used in the control of Entities through the process model:
•
•
•
•
•
•
Assign Activity
Transform Activity
Branch Activity
Merge Activity
Transfer Activity
Clone Activity
Assign Activity
The Assign Activity is one method used to assign values to attributes. The Assign Activity can also
be used to change the priority of an Entity.
The Assign Activity is covered in detail in “Assign Activity,” beginning on page 250.
Dialog Field Definitions and Buttons
Set Entity Priority sets or changes the Priority of an Entity. The priority defaults to None, which means
the Entity priority is not changed. Entity priority must be within the range 1 to 100. If a value less than
SIMPROCESS User’s Manual
129
Entity Control Activities
1 is returned from the distribution, then the Entity priority is not changed. If a value greater than 100
is returned from the distribution, then a warning is displayed, and the Entity priority is set to 100.
NOTE: Entities with a higher priority use available Resources first.
Set Attributes
•
•
•
Duration
lists existing attribute assignments:
Use Add… to set values for Entity attributes.
Use Edit… to modify existing assignments. Select the attribute assignment you want to modify
from the Set Attributes list.
Use Remove to delete a previously defined assignment.
is used as in other SIMPROCESS Activities.
Transform Activity
The Transform Activity changes one type of Entity into another type. A single arriving Entity can be
changed into many output Entities (all of the same type.)
Dialog Field Definitions and Buttons
Output Entities
•
Quantity is the number of new Entities to create. This number of each Entity arriving will be
generated for every Connector exiting the Activity.
SIMPROCESS User’s Manual
130
Entity Control Activities
•
•
Entity Type
is the type of Entity to be released. Select the type from the pull-down list.
The time specified in the Duration will be applied before the transform occurs, thus it will
be reflected in the Cycle Time of the incoming Entities. The outgoing Entities will not have
accrued any Cycle Time.
Copy Attributes tab is where attributes of the arriving Entity can be selected to be transferred to the
new output Entity. Examples of attributes that can be copied include User Defined Attribute values,
creation time, etc. Time Stamps and Entity Priority can also be copied.
Specifying Attributes to Copy
Selecting the Copy Attributes tab displays the following:
The following options on the Copy Entity Fields and Attributes tab can be selected:
•
Copy Creation Time copies the simulation creation time of the original Entity to the transformed
Entities.
•
Copy Time Stamps applies the list of predefined timestamps carried by the arriving Entity to
transformed Entities.
•
Copy Entity Priority
applies the priority of the arriving Entity to transformed Entities.
The transformed Entity receives the default Priority value defined in the Entity Type unless it is copied.
User Defined Entity Attribute values associated with the incoming Entity may also be copied. During
simulation, different variable types (Integer, Real, Boolean, and String) can be added to an Entity.
SIMPROCESS User’s Manual
131
Entity Control Activities
Click on OK when finished to leave the dialog, confirming your current selections. The Cancel button
cancels the current dialog selections.
Branch Activity
A Branch Activity routes Entities to different paths of the process model. It allows modelling decision
processes, with alternative pathways selected depending on the result.
In the Branch Activity detail dialog, you select the type of branching criteria to use: Probability, Entity
Type, Attribute value, or Priority. The precise criteria are specified on the Connectors associated with
the Branch.
Consider the case where the order fulfillment process for new customers requires a step that is not
needed for repeat customers, such as creating a customer profile. Use different Entities for new
customers and repeat customers and branch on Entity Type.
Or use a single Customer Order Entity and assume that a certain percentage of customers are new and
a certain percentage are repeats. Select Branch Type Probability and then set the probability of each event
on the Connectors leading from the Branch output Pad:
SIMPROCESS User’s Manual
132
Entity Control Activities
Dialog Field Definitions and Buttons
Select Branch Type
•
Probability. Entities routed based on a probability specified on each Connector leading from
the Branch. All probabilities must sum to 1.0, or one of the Connector’s should have the
Otherwise field set to True. Stream is the random number stream to use for the probabilities.
•
Attribute. Route Entities to the appropriate Connector based on values of User Defined
Attributes or System Attributes. (See “Using Attributes in SIMPROCESS,” beginning on
page 241 for more information on User Defined and System Attributes.)
•
Entity Type. Route Entities based on type, e.g., send Orders one way and Bills another. Set
the Entity Type on the Connectors emanating from the Branch.
•
Priority.
Ability to route higher priority items on one path, lower on another. The priorities
are specified on the Connectors.
Branch Connectors
Connectors link Activities and Processes together. Connector names can assist in labeling a model,
e.g., the Entity type that flows. SIMPROCESS will automatically label Connectors emanating from
Branch Activities. (See “Connectors and Branch Activities” on page 135 for details.)
SIMPROCESS User’s Manual
133
Entity Control Activities
The Branch Connector Properties dialog contains the Name of the Connector, Comment, the Line Width
and Line Style, Branching Parameters, Duration, Collect Connector Statistics, and Collect Connector by
Entity Statistics.
To display the Connector Properties, either double-click on the Connector, right click on the Connector
and choose Properties, click to select the Connector and click the Properties button on the tool bar,
or click to select the Connector and choose Properties on the Edit pull-down menu.
Connector Names
A default Connector name, e.g., Conn44 is assigned. To change the Connector Name, edit the Name
field in the Connector properties. The AutoLabel check box is discussed below.
Displaying Connector Names
The Edit Preferences option, on the Edit pull-down menu, determines if Connector names are displayed
in the model. However, individual Connector dialogs have Show Name check boxes that will override
the model default.
The Name field is displayed across the middle of the Connector if Show Name is selected.
The Auto Label check box applies only to Connectors from Branch Activities. The Name will be
generated by SIMPROCESS. SIMPROCESS uses entries in the Connector Detail dialog box depending
SIMPROCESS User’s Manual
134
Entity Control Activities
on the Entity Type.
Connectors and Branch Activities
There are additional fields that appear in the Connector detail dialog box when the Connector is
connecting a Branch Activity to another Activity or Process. When a Connector emanates from a
Branch Activity, use the Branch Connector Properties dialog box to specify the branching parameters.
The corresponding Connector Properties are based on the type of Branch selected in the Branch Activity
Properties dialog.
Entity Type —Select the type of the Entities that should flow along this Connector from the combo box.
—Enter the probability (a number between 0 and 1.0) that the Entity will flow on this
Connector.
Probability
Priority —
Enter the Entity priority number to branch on. Values are from 1 to 100.
When Entities are contending for Resources, Entities with
a higher priority get to use available Resources first. The
higher the number, the higher the Entity’s priority.
Attribute —The
first line shows the name of the Attribute selected in the Branch Properties box.
Branching can be based on the equality of numbers, strings, booleans, or on ranges of numbers. If the
selected Attribute is a local Entity instance or Entity Type attribute, a run time error will occur if an
Entity enters that does not have the selected Attribute defined.
Otherwise —If Otherwise is selected, this Connector becomes the default branching Connector. This
means all Entities pass through this Connector if none of the criteria in any other Connectors are
satisfied.
SIMPROCESS User’s Manual
135
Entity Control Activities
Branch Activity Type
Probability
Attribute
Entity Type
Priority
Connector Properties Used
Display Example
Probability (between 0 and 1.0)
0.75
Otherwise (True or False)
Otherwise
Branch If Attribute Is (value)
Displays User Defined Attribute
Name on Connector with IF or
AND conditions, e.g.
My Attr1 = 5, or
4 < My Attr1 < 7
Otherwise, (True or False)
Otherwise
Type (from Entity type combo
box)
Request for Quote
Otherwise (True or False)
Otherwise
Priority (Entity Priority 1-100)
1
Otherwise (True or False)
Otherwise
Merge Activity
A Merge Activity routes Entities from different Connectors into one Connector. Merge can be used
to TimeStamp all Entities or to reduce the number of “to and from” Connectors to create a more visually
appealing model. Also, a Merge Activity is useful if groups of Activities will be copied and pasted.
By using a Merge Activity, Connectors are not lost during the copy and paste.
SIMPROCESS User’s Manual
136
Entity Control Activities
Transfer Activity
A Transfer Activity routes entities without the use of a Connector. Entities can be routed within the
same model (Local) or to other models (Remote) with theTransfer Activity. (NOTE: Although, the
Remote capability is discussed, this capability has not yet been implemented.) The Transfer Type for
a Transfer activity can be Send or Receive. A sender routes entities to a receiver. Thus, Transfer
Activities should be used in pairs. Every sender should have an associated receiver. A sender can only
connect with one receiver, but a receiver can have multiple senders connected to it. Each Transfer Type
designates a Connection Type of Local or Remote. Local means the entity transfer will occur within the
same model. A Send Transfer Activity that is designated Local can only connect with a Receive Transfer
Activity in the same model that has also been designated Local. Remote means the entity transfer will
occur between models. A Send Transfer Activity designated Remote can only connect with a Receive
Transfer Activity in a different model that is also designated Remote.
When the activity is placed on the layout, it does not have an input pad or output pad. Selecting Send
causes an input pad to be added to the activity. Selecting Receive causes an output pad to be added
to the activity. Once the combination of Send or Receive and Local or Remote has been set, it cannot
be changed. The activity must be deleted and recreated if either option needs changing. The default
combination for a new Transfer Activity is Send and Local.
SIMPROCESS User’s Manual
137
Entity Control Activities
Dialog Field and Button Definitions
Transfer Type sets the Transfer Activity as Send or Receive. Both Send and Receive have a Connection
Type (Local or Remote). The Connection Type options enable based on the selection of Send or Receive.
Connection Type sets the Transfer Activity as Local or Remote. The Local option has a Connection button
associated with it, and the Remote option has a Protocol button associated with it. The Connection button
is active when Local is selected, and the Protocol button is active when Remote is selected.
The Connection button for the Send option operates differently from the Connection button for the
option. Clicking the Connection button associated with Send/Local brings up a modified
version of the Activity Browser dialog. (See “Activity Browser...” on page 35 for more information
on using the Activity Browser.) This version includes a Cancel button.
Receive
SIMPROCESS User’s Manual
138
Entity Control Activities
All the functions of the dialog are the same as the Activity Browser dialog. Select the receiving Transfer
Activity. (The Find Activity/Process section of the dialog can be used to search for Transfer activities.)
The activity selected when Close is clicked must be a Transfer Activity with Receive and Local selected.
An error will occur if the activity selected is not a Transfer activity with Receive and Local selected.
Click Cancel to not make a selection or to keep the current selection. Although the selection of Send
or Receive and Local or Remote cannot be changed once selected, the Connection can be changed once
set.
The Connection button associated with the Receive option displays a list of the Send Transfer Activities
routing entities to that Receive Transfer Activity. No editing of the connections is allowed. The dialog
is for informational purposes only.
SIMPROCESS User’s Manual
139
Entity Control Activities
The Protocol buttons will set the sending and receiving protocols for Remote transfers when the Remote
capability is implemented.
Clone Activity
The Clone Activity generates duplicate Entities. Note that this activity is only available from the Create
menu. This is because the Clone activity exists primarily to support pre-SIMPROCESS version 4.0
models. Since the cloned entities leaving the Clone activity are of the same type as the entity entering
the activity, the entity statistics for the type of the entering activity are affected by the creation of the
cloned entities. The entity statistics are skewed by the Clone activity. The Split activity is the
recommended activity for entity cloning since the cloned entity can be a different type of entity. Thus
the statistics for the original entity are not affected by the creation of cloned entities.
SIMPROCESS User’s Manual
140
Entity Control Activities
Dialog Field Definitions
•
Number of Copies per Connector is the number of Entities that will come out the Clones Pad
into each Connector.
•
If a Duration is defined for the Activity, the time specified in the Duration will be applied before
the cloned Entities are created. In other words, it will be reflected in the Cycle Time of the
incoming Entities.
•
If Time Stamps are defined for the incoming Entity, those values can be passed to the Clones
by selecting Copy Time Stamps.
Split and Join Activities
The Split and Join Activities work together to temporarily split the processing of an Entity among
parallel Activities.
At the Split Activity, an Entity is converted into two or more Entities, each of which follows a different
path before (optionally) reuniting at a Join Activity.
The Split Activity generates child Entities from the parent Entity. The children and the parent Entity
belong to the same family. After going their separate ways, the family is reunited at the Join Activity,
where a single Entity, the parent, exits for continued processing.
In the order fulfillment process, Split and Join might come into play in the handling of rush orders.
To speed up processing of rush orders, the work might be divided among several clerks at some point:
The figure above shows how a Split Activity takes a customer order Entity and releases three Entities,
SIMPROCESS User’s Manual
141
Entity Control Activities
the original and two children (or clones). Each Entity goes to a different Activity, where a different
task is performed on the order.
Defining a Split Activity
When you add a Split Activity to the SIMPROCESS layout, it has one input Pad and two output Pads
attached:
The upper output Pad is named Clones; the lower Pad is named Original (if you double-click on the
Pads, you will see their names in the Pad Detail dialog).
Use the Original Pad to route the original Entity to the next Activity in its path. Use the Clones Pad
to route each of the split Entities to their next Activities. An unlimited number of split Entities of
different Entity types can be released at a Split Activity, but all Entities emerge from the same Pad.
Dialog Field Definitions
The unique attribute of the Split Activity is:
SIMPROCESS User’s Manual
142
Entity Control Activities
Family Name. This names the family of Entities being created. The original Entity and its children can
be identified by their common family name. Family Name is used at a Join Activity to identify the Entities
to be joined. Family names must be unique within a model.
Identifying Split Entities
Split Entities are Attributes of the Connector: a Split Entity is defined for each Connector linking a
Split Activity to a connecting Activity.
A single Connector is drawn from the Original output Pad to an adjoining Activity’s input Pad. Then,
the Split output Pad is connected to the other adjoining Activities.
As an example, the figure below shows the distribution of rush order processing into three simultaneous
Activities: paper work, retrieval of an item from inventory, and updating of the inventory database.
The Original Pad of the Split Activity is connected to the input Pad of the Update Database Activity,
so the original customer order Entity flows through Update Database.
Double-clicking on one of the Connectors emanating from the Split Pad opens the Split Connector
properties.
SIMPROCESS User’s Manual
143
Entity Control Activities
Dialog Field Definitions
The unique attributes of the Split Connector are:
•
Entity Type
is the field where the Split Entity type that will flow along this Connector is
selected.
•
Quantity
•
Copy Attributes opens a dialog where Global Entity Instance attributes to copy from the
original Entity to each of the Split Entities are selected. Entity Priority and Time Stamps can
also be copied from the original Entity to each of the Split Entities.
•
New Entity
specifies how many of the split Entities will flow along this Connector for each
original Entity that enters the Split Activity.
button opens the Entity definition dialog for modifying Entity-type definitions.
Clicking on the Entity Type pull-down box displays a list of the Entities in the model. The Entity to
flow along this Connector is selected here.
For analysis purposes, consider using a different name for the children. For example, if the original
Entity type Customer Order is used for each of the paths leading from the Split Activity, distortions
in the statistics for the Customer Order Entity could occur. When all split Entities meet again at the
Join Activity, the two split Entities are destroyed at the Join, while the original Entity continues on.
When total cycle time for Customer Order Entities is calculated at the end of a simulation, those split
Entities skew the statistics.
Cycle times for the split Entities are measured from generation in the Split Activity to termination in
SIMPROCESS User’s Manual
144
Entity Control Activities
the Join Activity, while the original Entity’s cycle is measured from a Generate to a Dispose Activity.
An Entity named Temp is defined and used on the Split Connectors in the case of Rush Order Processing
in order not to skew the cycle time or Entity count statistics for Customer Order Entities.
Note that using an Entity named Temp for split Entities is adequate if the simulation statistics of these
Entities is not important. Define a different Entity type for each Split path if the number of each split
Entity generated during a simulation is important, or any other Entity statistic is important.
Select the Auto Label option if you want SIMPROCESS to display the Entity name on the Connector.
The name will be displayed unless Show Name on the Connector is turned off.
Click on OK when you finish defining the Connector.
Defining a Join Activity
Entities released from a Split Activity are reunited at a Join Activity.
The Join Activity icon has one input Pad and two output Pads. The upper output Pad is named Join;
after reuniting with their family, the original Entity exits through this Pad. The lower Pad is named
NoMatch; Entities that are not members of the Join family leave through this Pad. An Entity that is
not a member of the Rush Order family that enters the Join Activity will pass through the Join Activity
and exit through the NoMatch Pad. Note that no processing time will apply even if a delay duration
is specified.
SIMPROCESS User’s Manual
145
Entity Control Activities
Dialog Field Definitions
Family Name identifies the Entity family to be joined. The pull-down list for Family Name contains the
names of all families that have been defined in the model. Family names do not have to be unique in
Join Activities, i.e., two Join Activities could use the same family name. This would be done if the
same split Entities needed to be joined twice. The exiting Entity could be a batch that could be later
unbatched and joined again after further processing.
Batch Family Members tells SIMPROCESS to batch the child Entities with the original Entity. The Entity
could be separated into its components at an Unbatch Activity. Otherwise, all the child Entities are
disposed in the Join Activity. SIMPROCESS releases the original Entity through the Join Pad.
By default, All Family Members Required is not selected. When the original Entity enters a Dispose
Activity or is otherwise destroyed before it reaches a Join, SIMPROCESS releases one of the child
Entities at the Join Activity. Which child Entity is released cannot be specified; SIMPROCESS selects
it.
Note that if any of the child Entities are disposed before they reach their Join Activity, the rest of the
family still reunites at the Join; if the rest of the family is already at the Join Activity at the moment
the child Entity is destroyed, SIMPROCESS processes and releases the original.
If All Family Members Required is selected, then no Join will occur until all family members (children
and parent) arrive at the Join Activity. Thus, if any members of the family are disposed before the Join,
then the remaining family members will remain queued in the Join Activity.
SIMPROCESS User’s Manual
146
CHAPTER 5
Resource Modeling Constructs
A Resource is an agent that is required to perform the tasks associated with an Activity. People,
equipment, vehicles, money, and space can be modeled as Resources. The limited availability of
Resources is an important constraining factor in business processes.
• A bank customer requires the help of a loan officer in order to submit a loan application.
• On a manufacturing line, a computer board cannot be populated with chips unless both an operator and a surface mounting tool are available.
The loan officer, the operator, and the surface mounting tools are Resources whose availability affects
the activity in these examples.
SIMPROCESS provides the means for modeling Resources and for measuring the impact on the
performance of a business process. In addition, variable and fixed costs associated with Resources
may be used to measure Process costs and activity costs. See Chapter 7, “Activity-Based Costing,”
beginning on page 176 for more details.
This chapter describes how to:
•
•
•
•
Define Resources
Define groups of Resources for complex Resource requirements
Define the Resource requirements of activities
Use Resource related activities such as: Get Resource, Free Resource, and Replenish
Resource.
SIMPROCESS User’s Manual
147
Resources and Simulation
Resources and Simulation
When an Entity arrives at an activity, SIMPROCESS checks to see if any Resources are required to
process it. If Resources are required, SIMPROCESS attempts to obtain them. Once an activity gains
control of one or more units of a Resource, those Resource units are unavailable to any other activity.
The activity retains control of the Resource units until it finishes Processing the Entity.
Resource Allocation Policy
During simulation, many activities may simultaneously contend for units of the same Resource. If a
required Resource is not available when an Entity arrives at an activity, the Entity waits for that Resource
in a queue. This state is defined as “Wait for Resource” in the SIMPROCESS Standard Report.
If an activity requires units from two different Resources and units from only one Resource is available,
SIMPROCESS may or may not obtain the Resource units that are available. It depends on the rules
defined for the Activity. Any Resource units an activity holds are unavailable to other activities.
SIMPROCESS attempts to satisfy Resource requirements in the order of the priority of Entities queued
for the Resource. Priority is an Entity attribute assigned when the Entity is defined. All Entities with
the same priority are treated on a first-come, first-served basis. A higher priority Entity may (optionally)
preempt a lower priority Entity when the Resource units needed are not available. See “Preempting
Lower Priority Entities” on page 161.
SIMPROCESS User’s Manual
148
Defining Resources
Defining Resources
Use the Resource option from the Define pull-down menu, to define Resources in a model.
In the following discussion, Resources for an order distribution Process will be used: sales
representatives to Process the orders, trucks to deliver merchandise, and fuel to power the trucks.
1. On the Define pull-down menu, select Resources...
The Resources dialog is used to define new Resources, modify existing Resource definitions,
copy Resource definitions, or delete Resources. The Add function creates a new Resource
definition. The Edit, Remove, and Copy functions are only active if there are existing Resource
definitions. These functions operate on the Resource selected in the table:
Edit
modifies an existing Resource definition.
Remove
Copy
deletes a Resource definition.
creates a new Resource based on the definition of an existing one.
Type specifies the Resource template that will be used to create a new Resource definition.
Undo
restores a Resource that has been removed.
Add Template saves the Resource definitions for re-use. Templates are discussed in “Adding
Resource Templates,” beginning on page 230.
SIMPROCESS has one Resource type pre-defined which can be used when defining a new Resource.
New Resource templates can be created and added to the Type list. (See “Adding Resource Templates,”
beginning on page 230 for more information on Resource Templates.) When the Add button is chosen,
a new Resource with the characteristics of the Type selected will be created. The pre-defined type is
a default Resource:
SIMPROCESS User’s Manual
149
Defining Resources
•
•
•
•
One unit of resource.
No downtime defined.
No costs defined.
No Attributes or Expressions defined.
See “Resource Downtime,” beginning on page 343 for more information on Resource Downtime.
Click on Add to define a new Resource:
On the Resource dialog Name is any unique name identifying the Resource. Define the sales
clerk staff, and name the Resource Sales Rep.
NOTE
Special characters, such as “/”, “+”, single quotes, or “-”,
should not be used in the Name of a Resource. This
adversely impacts statistics and cost data collection.
Units identifies the initial capacity of the Resource. If the Resource is not consumable, capacity
is constant throughout the simulation. If the Resource is consumable, capacity will vary over
the length of the simulation. This fluctuation in capacity will be reflected in the capacity
statistics in the Standard Report. Number of Units of a Resource can also be specified with
a single line Expression, or a User-defined Attribute. See “Variable Resource Usage,”
beginning on page 252 for more information.
Fractional Usage indicates whether or not fractional units of the Resource can be allocated.
If this box is checked, a non-integer value for Units (e.g., 2.5, 10.2) may be defined. It also means
that an activity can acquire a fractional part of the Resource.
SIMPROCESS User’s Manual
150
Defining Resources
Consumable is used to identify resources that cannot be released and reused later, such as paper
or oil. They must be replenished before demand is greater than supply.
The Cost tab allows cost values to be assigned to Resources and keeps track of the expense
involved in using Resources. This function is described in detail in Chapter 7, “Activity-Based
Costing,” beginning on page 176.
Expressions
tab provides the means of writing specialized Processing instructions.
The Attributes tab defines attributes for the Resource. Attributes are customized variables.
Typically, expressions include Processing of attributes. These topics are discussed in depth
in Chapter 10, “Customizing a Model with Attributes and Expressions,” beginning on
page 237.
The Document function is used the same way it is for Activities, to store descriptive text about
the Resource. The default headings can be customized. (See “document Subdirectory” on
page 474.)
The Downtime tab is where the periods when the Resource will not be available in the model
are defined. Resource downtimes are described in “Defining Downtime Schedules of
Resources,” beginning on page 347
Note that the basic properties of Resources added to the model can be edited directly from the table.
However, changes made in the table are direct changes to the properties of the Resource and cannot
be canceled. Also, the table can be sorted by a particular column by clicking on the column header.
Holding the Shift key while clicking on a column header causes the table to sort in the reverse order.
SIMPROCESS User’s Manual
151
Adding Resource Requirements to Activities
Adding Resource Requirements to Activities
Once the model flow and resources are defined, the Resource requirements of each Activity must be
added to the model.
The Resource requirements for an activity are defined by double-clicking on the activity’s icon to
display the Activity Properties dialog box. On the dialog box, click on the Resources tab:
Add adds an individual Resource requirement for the activity. The units required default to 1.0 when a
Resource is added. Use Edit to modify an existing requirement definition.
Any existing resources will be listed under the Requirements heading. Highlight the resource allocation
to be modified, and press Edit. Units may be a constant or a distribution. Resource requirements can also
be set by using the Evl function with User-defined Attributes. See “Variable Resource Usage” on
page 252.
If the units requested are larger than the defined capacity of the Resource and the Resource is not a
consumable Resource, a runtime error will occur. However, if the Resource is a consumable Resource,
the Entity will remain in the wait for Resource queue. Entities remain in the wait for Resource queue
SIMPROCESS User’s Manual
152
Adding Resource Requirements to Activities
until the consumable Resource has been replenished to a level at or above the required allocation.
Remove
deletes the requirement highlighted in the Requirements box.
Once a list of Resources has been chosen for the activity, the combination of Resources in the Requires
area may be specified.
Requires
•
•
•
defines the combination of Resources required to perform this activity:
Any One Member
— any one of the Resources listed is sufficient to perform the task.
All Members —
all members in the Requirements list are needed in order for this activity to
Process an Entity. SIMPROCESS does not obtain any member until all the required Resources
are available.
Reserve As Available — all listed Resources are required and will be reserved as they become
available.
•
Number Of Members — A certain number of members of the list (but not all members) are
needed to Process an Entity. Enter the value of number in the box.
Reserve As Available
may pose a risk of deadlock.
Activities A and B are both defined as requiring Resources 1
& 2, using Reserve As Available logic. An Entity arrives at
activity A, which obtains Resource 1. Resource 2 is not
available, so A waits for it.
Now an Entity with higher priority arrives at Activity B.
Activity B waits for Resources 1 and 2. Then Resource 2
becomes available. Although Activity A has been waiting for
Resource 2 longer than Activity B has, B gets the Resource
because the Entity it is processing has a higher priority than
Activity A’s Entity. A deadlock develops since neither
activity will release the reserved Resource. Make sure this
situation cannot develop.
Maximum Wait for Resource Time is used to set the maximum amount of time an Entity will wait for
the requested Resources to become available. The Value field can be None, a constant, or any valid
statistical distribution and will represent units as selected in Time Unit. A Value of None indicates that
the Entity will wait as long as necessary to obtain the requested Resources. If Value is something other
than None and the Entity is still waiting for Resources when the specified time has passed, the Entity
leaves the Activity without processing. When this occurs, the Entity System Attribute EndWait is
set to TRUE. (See “Customizing a Model with Attributes and Expressions” on page 237 and “System
Attributes” on page 512 for information on SIMPROCESS System Attributes.) Thus, EndWait can
be checked to determine whether an Entity exited an Activity without processing and the Entity can
SIMPROCESS User’s Manual
153
Adding Resource Requirements to Activities
be routed appropriately. (Important: EndWait is not automatically reset to FALSE. This must be
done in an Expression once the current value of EndWait is no longer needed for Entity routing.)
For Activities that collect statistics, Entity Counts for Entities that exit without processing are displayed
in the Total Not Processed category of the Activity Entity Count statistics (page 196) in the
Standard Report (page 186). Note that there is also a MaxWait System Attribute that can be used to
set the maximum amount of time that an Entity will wait for requested Resources (see “Setting
Maximum Resource Wait With Expressions” on page 292).
Release Entities In Process at Start of Downtime sets whether Entities are released when Processing is
interrupted by Resource downtime. This option is not available on the Resource usage dialog of the
Get Resource activity. This is because Get Resource activities have no delay for Processing. See
“Defining Downtime Schedules of Resources” on page 347.
SIMPROCESS User’s Manual
154
Explicitly Getting and Freeing Resources
Explicitly Getting and Freeing Resources
When an Entity arrives at an activity, if a Resource is listed in the Resource requirements list for the
activity, SIMPROCESS attempts to obtain the Resource required to process the Entity. If the required
Resource or Resources are not available, the Entity waits until the Resources become available. When
processing is completed, the activity releases the Entity and frees the Resources.This is an implicit
way to get and free a Resource. However, some business processes require more control over resource
allocation. The Get Resource and Free Resource options allow the model to explicitly control the
allocation of Resources.
A clerk may perform a series of activities, and it is necessary that the same clerk execute all the activities
in a given order. Therefore, the model should "Get" the Resource, perform all the activities and then
"Free" the Resource. The remainder of the section will describe how to model this series of actions
with SIMPROCESS.
.
Get Resource and Free Resource Activities
Get Resource Activity
The Get Resource activity obtains a Resource and holds on to it across multiple Processes and activities.
Assign a unique Tag to each Get Resource activity. Although it is possible to use the same Tag twice
at different levels of the model hierarchy, it is highly discouraged.
In the Get Resource Activity Properties dialog, click on the Resources tab to specify the Resources to
be allocated. Fill out the Resources Usage dialog as specified in “Adding Resource Requirements to
Activities” on page 152.
SIMPROCESS User’s Manual
155
Explicitly Getting and Freeing Resources
The Access/Create Customer Profile Process is shown with a Get Resource activity added:
Get Resource obtains Resources that would otherwise have been obtained in the ensuing activities. Do
not define the same Resource requirement in those activities as well.
Free Resource Activity
The Free Resource activity is used to release Resources obtained at a Get Resource activity.
SIMPROCESS User’s Manual
156
Explicitly Getting and Freeing Resources
All Resources that have been allocated for this Entity can be freed by clicking on the Release all Allocated
box.
Resources
An explicit set of Resources to be freed can be defined by clicking on the Add button in the FreeResource
Activity Properties dialog box. The Add button brings up the following dialog.
Assign a Name to the action being defined. This name will be displayed in the List of Actions field of
the FreeResouce Properties dialog box.
The Tag and Resource fields combine to define free Resource actions:
1. Tag indicates the Get Resource activities whose Resources will be released. The pull-down list
contains all the Get Resource tags in the model.
SIMPROCESS User’s Manual
157
Explicitly Getting and Freeing Resources
A tag may be selected from the listbox, or any tag! may be specified, which causes the free
action to ignore the tag assigned at the Get Resource activity.
If more than one Get Resource activity was used, separate free actions can be defined for each
set of Resources to be freed.
2. Use the Resource pull-down list to specify the Resource being freed, or select any Resource!
to free all Resources allocated for the Entity. Resources are only freed if they were obtained
in the activities specified in the Tag field.
To release more than one Resource, but not all the listed Resources, create a separate action
for each.
3. Select OK to accept the definition. The action now appears in the List of Actions schedule.
You can add additional actions to the list by clicking on Add and defining the action.To modify the
definition for an action item, highlight it in the listbox and click on Edit. To remove the action, click
on Remove.
SIMPROCESS provides the option of whether or not to deduct the amount acquired from consumable
Resources when those Resources are freed. Click on the Consumable Resources will be consumed check
box in order to decrement consumable Resources. For example, a Get Resource activity obtains 50
gallons of Diesel Fuel in anticipation of shipping merchandise to a customer. Before reaching the
shipping activity, the Entity enters a branch node in which the merchandise order is canceled. In this
situation, one branch of the path leads to a Free Resource activity where the consumable Resource is
not consumed, since it was not used. The other path continues on to the shipping activity, and then
to a Free Resource activity in which the fuel Resource is consumed.
Getting and freeing Resources can also be accomplished using expressions. See “Getting and Freeing
Resources Using Expressions” on page 281.
SIMPROCESS User’s Manual
158
Replenishing Consumable Resources
Replenishing Consumable Resources
The Replenish Resource activity is used to replenish a consumable Resource during a simulation.
Diesel fuel is a consumable resource used when shipping merchandise. Once an order is made, the
truck and a quantity of fuel will be allocated as Resources to perform the shipping. The fuel quantity
is deducted from the inventory and gets replenished by a daily shipment received each morning.
Double-click on the Replenish Resource icon to define this action.
SIMPROCESS User’s Manual
159
Replenishing Consumable Resources
Select the consumable Resource on the drop down menu, and then click on Add to define a replenish
action:
The Resource field identifies the Resource to be replenished. The pull-down list shows all
the consumable Resources defined in the model.
Units indicates the quantity of the Resource to be added either in a real number or a statistical
distribution. The distribution can be selected from the pull-down list of the Units field. The
Replenish to Capacity box indicates that a Resource should be replenished only up to the value
specified in its Units field when the Resource was defined.
Note that Resources can also be replenished using expressions. See “Changing Resource Capacity With
Expressions” on page 291.
SIMPROCESS User’s Manual
160
Preempting Lower Priority Entities
Preempting Lower Priority Entities
A higher priority Entity may preempt a lower priority Entity when the Resources are not available.
Selecting Preempt Lower Priority Entities on the Entity definition dialog will potentially cause all
Entity instances of this type to interrupt Activities processing lower priority Entities.
In this example, if a Rush Order Entity enters an activity that requires Resources, and no Resources
are available, SIMPROCESS will check the Entities being processed. If there is a lower priority Entity
Processing, the Processing will stop and the Resources will be released. When the Processing is
stopped, if the Interrupt Processing Entity instance expression has statements, it is executed. The Rush
Order Entity obtains the Resources and starts Processing. The Entity that was interrupted goes back
to the wait for Resource queue. It will be placed in the queue ahead of all other Entities with the same
or lower priority. When the interrupted Entity obtains Resources again, it will Process with the time
that was remaining when it was preempted. Also, if the Resume Processing Entity instance expressions
has statements, it is executed. (See page 275 for information on Entity instance expressions.)
SIMPROCESS User’s Manual
161
CHAPTER 6
Graphical Modeling Constructs
Graphical constructs in SIMPROCESS include:
• Background Text (static and dynamic)
• Background Graphics
In addition, graphics can be imported for use as backgrounds or icons, and animation can be recorded
for playback.
SIMPROCESS User’s Manual
162
Background Text
Background Text
There are two types of background text in SIMPROCESS: static text and dynamic labels.
Static text is used for annotating the model layout and does not change during simulation.
Dynamic labels are updated during simulation and are used to display information about
changing properties of model elements. Several text labels can be grouped together on the
layout and their horizontal and vertical alignment can be set using the Align option.
Dynamic labels can be updated automatically or by using the SIMPROCESS Expression
Language. The SIMPROCESS Expression Language is an advanced feature found in
SIMPROCESS Professional. Updating dynamic labels using expressions is covered in
Chapter 10–Customizing a Model with Attributes and Expressions. This topic begins on
page 237.
Properties are specified in the Background Text dialog, invoked by selecting a text tool from
the Layout Toolbar (marked by a capital T) and clicking on the background in the location
where text is to be placed. Text can be moved by clicking and dragging. The following shows
a static label. Note that the Static Label field and Font Attributes are all that are required for
a static label.
The dialog is divided into two sections: the top group of controls, designated as Dynamic Label
Properties, is only applicable to dynamic text; the bottom group — Font Attributes — is used
SIMPROCESS User’s Manual
163
Background Text
to specify all text properties. Defaults for the Font Attributes can be set on the Background
tab of the Preferences dialog (Edit/Preferences).
Text
SIMPROCESS provides a list of the available fonts. Some fonts will not properly display
their names in the combo box if the Java environment is unable to handle them. Avoid using
these fonts. All rotation settings in the Angle combo box can be used with any font settings.
Note that once the text is placed on the layout, the selection box around it has no handles.
The only way to resize font text is to change its point size in the Fonts dialog. Once the text
is placed on the layout, it can be moved, its properties edited, and it can be grouped with other
objects on the layout.
When a dynamic label is placed on the layout, in addition to its font attributes, appropriate
information needs to be entered in the Dynamic Label Properties group. Each dynamic label
must have a unique combination of Name and Id number. Usually, Id number will be 0, unless
two dynamic labels have the same name. The name typed into the Name text box will not appear
on the layout. It will only be used to reference the label. Also, choose the type of value with
which the dynamic label will be updated. The choice between String, Integer, and Real is made
in the Mode combo box. If the value of the dynamic label is Real, also specify Width and
Precision in the corresponding value boxes. Width is the total number of digits that will be
shown for the displayed value (including the decimal point), while Precision specifies the
number of digits after the decimal point that will be displayed. If the Width is greater than
the value being displayed, it will be padded with spaces on the left side. If the Mode is Integer,
then only the Width field needs to be set.
The Value field can be left empty. If so, the dynamic label can only be updated by using the
SIMPROCESS Expression Language (page 294). Likewise, if the Mode is String, the dynamic
label can only be updated through the SIMPROCESS Expression Language. If the Value field
is not empty, the dynamic label will update automatically every time the selected value
changes. The six buttons to the right (Entity, Resource, Activity, Connector, Time Stamp, and
Model Attribute) are used to set the Value for the dynamic label. These buttons are active when
a valid Name and Id has been entered and the Mode is not String. Each button brings up a dialog
that lists each model element of that type (Entity, Resource, etc.) on the left. Once a value
is selected on the left, the values available are listed on the right. Only one item can be selected
on each side.
Selecting the Entity button displays the following dialog.
SIMPROCESS User’s Manual
164
Background Text
The Value field can be changed by selecting a different value using one of the six Set Value
buttons. Select the Clear Value button to clear the Value field. As stated earlier, leaving the
Value field empty means the dynamic label can only be updated using expressions.
Although it is not necessary, add a Static Label to the dynamic label definition. If this is not
done, there will be no place holder for the dynamic label on the layout after the dialog is closed.
This label can still be found by dragging a rubber band box in the selection mode around the
area where it was placed. A very small selection box may appear at the location of the label.
SIMPROCESS User’s Manual
165
Background Text
The label’s properties can then be edited by choosing Edit/Properties off the menu. Also,
adding a static label to the side of the dynamic label makes it simpler to find the dynamic
label location and provides a description of the value being updated. The static label is not
replaced when dynamic value is updated since they are two separate labels.
SIMPROCESS User’s Manual
166
Background Graphics
Background Graphics
Select the Background Graphic icon from the Layout Toolbar and move it to the layout to
add a background graphic. The Select Background dialog will open. Backgrounds can be
previewed before adding to the layout by selecting a background then clicking the Preview
button. Choose the background, and select OK to close the dialog. Once the graphic is on the
layout, it can be resized by selecting Edit/Resize. Note that background graphics cannot be
resized using the resize handles.
The properties of the Background Graphic has two options on the properties dialog, Locked
and On Top.
The Locked option locks the Background Graphic to its current position on the layout,
preventing inadvertent moving of the Background Graphic while editing or navigating.
Background Graphics default to unlocked.
Turning the On Top option on brings the Background Graphic to the front of the layout display.
Typically this option is left off, so that the Processes, Activities, and Connectors on the screen
will appear on top of the Background Graphic.
Note that Background Text added after a Background Graphic has been added to a layout
will be behind the Background Graphic. If the Background Graphic is not transparent, the
Background Text will not be visible. To solve this, make sure Locked is not selected, then
select the Background Graphic and choose Layout/Send to Back.
SIMPROCESS User’s Manual
167
Importing Graphics Image Files
Importing Graphics Image Files
A Graphics Interchange Format (GIF), Joint Photographic Experts Group (JPEG), or Portable
Network Graphics (PNG) graphic can be imported into SIMPROCESS. An imported graphic
can be used as a Background Graphic, as an icon representing a Process or Activity, or as
an icon representing an Entity.
Background Images
To use an imported graphic as a background, select Manage Background Images from the Tools
menu. This will open the Manage Background Images dialog. The dialog has two actions for
importing background images: Import Image and Import for Model. Import Image imports a
background graphic for use by any SIMPROCESS model. Import for Model imports a
background graphic only for the currently active SIMPROCESS model. Import for Model is
disabled if no model is open or the active model has not been saved and given a name.
Selecting the Import Image or Import for Model buttons will open the Import Background Image
dialog.
Select the Browse button, and choose a graphics file. Enter a name in the Background Name
field. This is the name that will display in the list of available backgrounds and must be unique.
Select OK to import the graphics file for use in SIMPROCESS.
Other features available from the Manage Background Images dialog can be accessed by
selecting Manage Images, which opens the Export or Delete Background Image dialog.
SIMPROCESS User’s Manual
168
Importing Graphics Image Files
This dialog allows exporting any of the available backgrounds to external graphics files,
including those provided with SIMPROCESS. In addition, it will allow deletion of any
imported background images. Note that background graphics imported for the currently
active model will have ** (a pair of asterisks) before the name.
Activity, Process, and Entity Images
Use the Icon Manager (Tools/Icon Manager) to import a graphics file for use as a Process,
Activity, or Entity.
The Icon Manager is used to import, export, and manage image files. A single image file can
be imported for use as an icon, or multiple files (such as a directory of image files) can be
imported. Select For Current Model to have the import apply only to the currently active
SIMPROCESS model. For Current Model will be disabled if no model is open or if the currently
active model has not been saved and given a name.
Choose Single Icon and click Import to import a single image for use as an icon. Use the Browse
button to locate the Image File to import. Once selected, enter the Icon Name which must be
unique among all icons, no matter what category or set. Select the Icon Category and Icon Set.
If the Icon Set needed is not listed, create a new set by typing it in the Icon Set field. Click
OK to finish the import.
SIMPROCESS User’s Manual
169
Importing Graphics Image Files
A directory of images can be imported by choosing Multiple Icons and clicking Import. Using
the Browse button, select the directory that contains the images to import. Only directories
will be listed in the file chooser. Files may not be selected. All .gif, .jpg, and .png files
in the directory will be imported. The Icon Name for each will default to the name of the file
minus the extension. These names can be changed as long as they remain unique among all
the standard and imported icons. An error message will appear listing the names that are not
unique.
Note
When a graphic is imported into SIMPROCESS, a copy of the
graphic is placed by SIMPROCESS in the UserFiles.jar
file located in the SIMPROCESS/SPUser directory. If the
graphic is imported for the currently active model, a copy of the
graphic is placed in the ModelImages.jar file located in the
model’s directory.
Export exports images to a directory. It lists all the icons in SIMPROCESS, whether standard
to SIMPROCESS or imported. The export dialog will list the Icon Name, Category, Icon Set,
SIMPROCESS User’s Manual
170
Importing Graphics Image Files
and whether the icon is Standard, Imported, or Model. (Standard indicates the icon was included
as part of the SIMPROCESS installation. Imported means the icon was imported for use by
any SIMPROCESS model. Model signifies the icon was imported for use by the currently
active SIMPROCESS model.) Simply select the Export checkbox next to the icons to export
and click OK. Using the Browse button, select the directory for the exported images.
Manage brings up a dialog that lists the imported icons. This dialog changes the Icon Name,
Category, Icon Set, or Deletes the icon. Icons that were imported for the currently active model
will have ** (a pair of asterisks) before the name.
SIMPROCESS User’s Manual
171
Post Simulation Animation
Post Simulation Animation
Animation is very useful in verifying and validating a model as well as communicating a
model to management or customers. Normally, when turned on, animation displays while
a model is simulating, which causes the simulation to slow significantly. In addition, only
the animation for the current simulation time can be viewed. In other words, something in
the past cannot be viewed again without restarting the simulation and waiting through the
simulation to get to the point of interest.
Post simulation animation displays an animation from a simulation without the simulation
running. During a simulation the animation is recorded for playback. Animations can be
recorded without displaying the animation during a simulation. Playback of animations that
have been recorded can be paused, fast forwarded, and rewinded.
Note: Due to the addition of Connector delays and concurrent animation in SIMPROCESS
Version 4.2, any animations that were recorded in a version prior to 4.2 will no longer replay.
The animations must be recorded again.
Post Simulation Animation Toolbar
Post simulation recording and playback is controlled by the post simulation animation toolbar.
The post simulation animation button displays and hides the post simulation animation
toolbar. The button is to the right of the Animation Speed slider on the System Toolbar. The
toolbar displays at the bottom of the SIMPROCESS layout.
SIMPROCESS User’s Manual
172
Post Simulation Animation
The two buttons on the left are for recording, and the remainder are for playback.
Recording an Animation
Animation events are recorded in a file for playback. In order for the Record On/Off button
to be active, an animation event file must be set using the Set Record File button. The Set Record
File button brings up a dialog where the name of the file is entered. Do not enter the path to
the file. Animation event files are automatically created in the model’s directory. The file name
is saved with the model. If an animation event file had been previously set, the Record On/
Off button will activate when the toolbar is displayed.
The Record On/Off button is a toggle button. When the button is selected, animation events
SIMPROCESS User’s Manual
173
Post Simulation Animation
are recorded. Thus, recording can be turned on and off multiple times during a simulation.
The animation option buttons on the System Toolbar, or the Animation Settings dialog
(Simulate/Animation Settings menu item) control which animation events are recorded.
Animation On, Show Clock, and Animation Speed (slider) do not apply to recording animation
events. The events recorded are determined by the status of Show Entities, Show Counts, and
Update Dynamic Labels. If an item is selected, those type of animation events are recorded.
In the example below, only the movement of entities and Activity counts would be recorded.
Note that the Animation On button is not selected. Animation does not need to display during
recording.
Warning: Animation events files can be very large. When recording counts and movement
of entities, animation events for every level of the model must be recorded. Recording all
that information will create very large files if recording is done for the whole simulation. The
larger the model is, the larger the animation event file will be. Recording the movement of
entities has the biggest impact. Recording only dynamic label events and/or Activity count
events typically produces much smaller files.
Animation Playback
An animation event file of an animation that has been recorded must be opened for playback.
This is done using the Open File button on the post simulation animation toolbar.
Important: Make sure the animation event file opened was recorded from the currently active
model. The file browser will automatically open to the directory of the model. If the model
has changed since the animation event file was created, delete the previous animation event
files and record again.
Play
Once a file has been opened, the Play and Fast Forward buttons activate. Pressing Play will
start the playback from the beginning of the animation event file.
SIMPROCESS User’s Manual
174
Post Simulation Animation
Fast Forward
Pressing Fast Forward brings up a dialog where an amount of time to skip is entered. Note
that the value entered must correspond to the Simulation Time Units set in the Run Settings.
(See “Setting the Simulation Time Unit” on page 89.) That time unit will display on the dialog.
If Fast Forward is used before Play, the time entered fast forwards the playback from the
beginning of the simulation. Thus, if recording did not begin at the start of the simulation,
it is possible that the time entered for Fast Forward will still be before recording began. So
when Play is pressed, the playback begins where recording started.
Rewind
Rewind is available once playback has started. Pressing Rewind brings up a dialog where the
amount of time to back up is entered. This time must fall within the model’s Simulation Time
Units. The playback starts over at the beginning if the time entered goes past the beginning
of the playback.
Note: Both Fast Forward and Rewind have an advantage over animation during simulation.
During simulation, Activity counts and dynamic labels only update when an entity enters or
leaves an Activity/Process. So, when navigating through models during a run, there is
normally a wait for counts and dynamic labels to display the most current values. A Fast
Forward or Rewind during playback causes all counts and dynamic labels on the current level
to immediately update to their values at that time.
Stop
Stop
ends the playback.
Pause
When selected, the playback pauses. Press again to resume the playback.
Animation Controls
The animation buttons on the System Toolbar control what is visible during a simulation
animation, and they control what is visible during animation playback. Just like during
simulation animation, disabling Show Entities will stop the display of the movement of
entities. Show Counts and Update Dynamic Labels work similarly. Remember, the Animation
On setting has no effect on animation playback. Also, these animation settings have no effect
if those particular animation events were not recorded.
SIMPROCESS User’s Manual
175
CHAPTER 7
Activity-Based Costing
The purpose of this introduction to Activity-Based Costing (ABC) is to summarize its basic principles
and describe the benefits of the integration provided with SIMPROCESS. A list of ABC references
is provided in the back of the chapter for further reading.
The goal of ABC is to mimic the causal relationships among Resources, Activities, and Entities in
assigning overhead costs. “The fundamental belief behind this costing approach is that cost is caused
and causes of cost can be managed. The closer you can come to relating the costs to their causes, the
more helpful your accounting information will be in guiding the management decisions of your
business.” states the Ernst & Young Guide to Total Cost Management (Ernst & Young, 1992).
Enterprises use Resources to conduct activities. Resources perform activities to add value to products
and services. The key to understanding cost dynamics in any enterprise is modeling the relationship
between activities and their causes; and the relationship between activities and costs. If cost dynamics
are not modeled (which is usually the case with traditional management accounting information
systems), the performance information provided is incomplete or misleading.
SIMPROCESS User’s Manual
176
ABC and SIMPROCESS
ABC and SIMPROCESS
Activity Based Costing is a technique for accumulating cost for a given cost object (i.e., product,
service, customer) that represents the total and true economic Resources required or consumed by the
object.
Activity Based Costing occurs in two phases. First, cost data is organized into Activity cost pools. In
other words, the costs of significant activities are determined. This first phase is sometimes referred
to as Activity based Process costing. Then, the amounts in the cost pools are assigned to products,
services, or other cost objects. The second phase is referred to as Activity based object costing.
The architecture of SIMPROCESS provides an integrating framework for ABC. ABC embodies the
concept that a business is a series of inter-related Processes, and that these Processes consist of activities
that convert inputs to outputs. The modeling approach in SIMPROCESS manifests this concept and
builds on it by organizing and analyzing cost information on an Activity basis.
One of the major challenges in successful implementation of ABC is finding the appropriate level of
detail for the business Process analysis. The organization of business Processes is critical to
reorganizing the cost data into Activity pools. The hierarchical modeling approach of SIMPROCESS
facilitates this organization and accommodates varying levels of detail for ABC analysis. Another
significant value of the ABC analysis in SIMPROCESS comes from the dynamic analysis of costs
based on the event-driven simulation. Because SIMPROCESS tracks Resource interdependencies and
captures the random nature of Processes, the cost statistics provided by SIMPROCESS are far more
accurate than results obtained from static analysis.
SIMPROCESS User’s Manual
177
Benefits of ABC with SIMPROCESS
Benefits of ABC with SIMPROCESS
Focus on Cost Drivers
One of the most important benefits of ABC is the focus it provides for estimating the key causes of
costs. Executives can use these estimates to prioritize and monitor improvement efforts. For example,
understanding the cost of poor quality can justify the investment in a quality program. Likewise,
understanding the cost of complex or diverse products and services can help streamline the product
and service offerings.
Strategic Pricing
Life cycles of product and services are becoming shorter and shorter. The up-front costs of developing,
testing, and marketing are not recouped until revenue is generated. Understanding the cost trade-off
between life cycle stages is critical to strategically pricing the products, i.e., understanding when the
total investment in product development can be recouped is valuable information for strategic pricing.
ABC with SIMPROCESS allows simulation of the Process changes during the life cycle of a product/
service for strategic or time-based pricing.
Evaluation of Capital Investments
Reengineering business Processes requires a trade-off between the benefits and costs of making Process
improvement changes. Without the trade-off, executives and managers are faced with making large
investment decisions based on gut feel.
SIMPROCESS User’s Manual
178
How to Use ABC in SIMPROCESS
How to Use ABC in SIMPROCESS
To get Process cost information from a SIMPROCESS model, first define the costs of the model's
Resources and the cost periods to be analyzed. SIMPROCESS will distribute these costs to activities
and to Entities as the simulation proceeds and provide extensive reporting of the results based on userspecified cost reporting periods.
In order to provide a comprehensive cost analysis, SIMPROCESS differentiates between fixed costs
and several types of variable costs that can be assigned to a Resource. SIMPROCESS allows multiple
cost periods to be analyzed simultaneously and allows model level definition of costing periods. These
features help to bridge the gap between an accountant's view and a manager's view of a business Process,
provide an effective communication vehicle for the participants in a Process reengineering project,
and make SIMPROCESS a complete business Process analysis tool.
SIMPROCESS' costing facility is very simple to use. Prior to running a simulation, define the cost
periods for cost calculation purposes or accept the default cost periods, which are based on calendar
quarters. Also, define costs for at least some of the Resources in the model, presumably those that
represent the most significant costs in the business Process (hourly payroll, salaries, capital equipment
depreciation, etc.). The following describes how to complete these two steps.
Setting Up Cost Periods
Pick the cost periods that are most suitable for the system under study. SIMPROCESS selects
Quarterly cost periods as the default but also allows Weekly, Monthly, Half Yearly, and Yearly
cost periods. The following example demonstrates how to set cost periods for the default run length.
Select Simulation/Run Settings from the main menu.
Then, click on the Cost Periods tab. This will display the Cost Periods definition tab as shown below.
SIMPROCESS User’s Manual
179
How to Use ABC in SIMPROCESS
The list in the upper left of this dialog shows the currently defined cost periods. The default periods
are Quarter1, Quarter2, Quarter3, and Quarter4. At the bottom of the dialog, is the Period Frequency
selection list with the default Quarterly selected. Click the down arrow button to see all of the Period
Frequencies that SIMPROCESS offers: Weekly, Monthly, Quarterly, Half Yearly, and Yearly.
Notice that if a new Period Frequency is selected, SIMPROCESS will create a new set of periods in
the period list and assign each a default name (Month1, Month2,..., or Week1, Week2,...). Notice also
that SIMPROCESS will automatically create and name enough cost periods to span the currently
specified run length. (The simulation Start Time and End Time are set from the Run Settings tab.)
This dialog also sets the name of the Currency used on the cost reports. This is a simple label used in
the reports. SIMPROCESS provides no currency conversion facilities and assumes that all cost
amounts are in the same currency (e.g., Dollars or Euros).
When a particular cost period is selected and the View... button is clicked, SIMPROCESS will display
the Cost Period detail dialog which shows the start and end dates and times for the cost period and the
name of the period. The name of each cost period can be changed to be more descriptive in the context
of the cost report. For example, the cost periods could be called Spring, Summer, Fall, and Winter rather
than Quarter1, Quarter2, etc. Click the OK button to alter the cost period name or the Cancel button
to discard any changes.
Setting Up Resource Costs
Costs can be specified for each Resource in the model. All Resources do not have to have costs specified.
SIMPROCESS will generate cost reports only for those Resources that have costs assigned. Both fixed
and variable costs can be assigned to non-consumable Resources, and two of the three variable costs
can be assigned to consumable Resources. These costs are specified as part of defining each Resource.
Select the Define/Resource option from the menu bar. Then pick a previously defined Resource from
the list for editing or add a new one using the Edit or Add buttons. This will display the Resource
SIMPROCESS User’s Manual
180
How to Use ABC in SIMPROCESS
Properties
dialog as shown below:
Click the Cost tab to display the Resource Costs for this Resource. Since the Resource is
nonconsumable, all Variable Costs and the Fixed Cost are included.
The box at the top shows the Variable Costs, and the box below shows the Fixed Cost. Below is the
Cost tab for a consumable Resource.
SIMPROCESS User’s Manual
181
How to Use ABC in SIMPROCESS
The check box at the bottom left-hand corner of the dialog, Collect Cost Statistics, is turned on by default
whenever cost information is entered. Leave this selected. Otherwise, cost statistics will not be
gathered.
Variable Costs
Three types of variable costs can be specified for non-consumable Resources:
•
Usage Cost per Entity
•
Cost Per Unit - This cost is applied
•
Cost per Time Unit
•
Time Unit
- This cost is applied to each Entity that is processed by the Resource.
It is used to represent “flat fee” charging schemes. The same cost is assigned regardless of the amount of the Resource's units that is used or the duration of the Activity.
Example: Often administrative charges or service call charges are based on this kind
of charging scheme.
to each Entity that is Processed based only on the amount
of the Resource's capacity that is used to Process the Entity. The cost is not calculated
based on the time that the Activity takes to complete. Example: Fuel may be defined
as a consumable Resource and cost per unit may be $1.50 per gallon. Every time a
gallon of fuel is consumed, it will cost $1.50.
- This cost is calculated based on the amount of Resource capacity used
and the time used. Example: Machine rental charges or hourly salary paid to employees are a common example of this type of cost.
that applies to the Cost per Time Unit. Defaults to Hours.
Fixed Cost
Fixed Cost is defined in the box below the Variable Costs box. Enter the fixed cost amount in the Per
Unit value box, and select the time basis for the cost from the selection list below. Machine depreciation
or fixed salaries are common examples of this type of cost. To specify the fully burdened cost of a
SIMPROCESS User’s Manual
182
How to Use ABC in SIMPROCESS
set of salaried employees represented by this Resource, and the cost per employee is $50,000 per year,
enter 50000 in the Per Unit box, and select Yearly from the list below. Click the down arrow to the right
of the list to see the available items. The list contains the same time intervals that are available for
the Cost Period Frequency. These do not have to be the same in both places. SIMPROCESS will perform
all the necessary conversions automatically.
For example, annual salaries can be specified and the simulation run with weekly cost periods.
SIMPROCESS will convert the annual salary costs to weekly costs when generating the cost data. After
a simulation is completed, reports of the costs are available. The total cost and the cost by period can
be seen by choosing Display Standard Report from the Reports menu. These costs are divided into three
categories: Resource by Activity, Resource by Entity, and Activity by Entity.
Cost Calculations
When a simulation is run, SIMPROCESS pauses at the end of each cost period to calculate the period
costs. SIMPROCESS tracks all the activities that used the Resource and all of the types of Entities
processed. For each Resource that has costs specified and that is set to calculate costs, SIMPROCESS
will distribute the Resource's fixed and variable costs for the period to all of the activities that made
use of the Resource during the period. This distribution is based on the amount of the available capacity
used by the Activity during the period. For example, suppose that a Resource is used evenly by two
activities and was busy 50% of the time for the cost period. Further, suppose that during the period
each Activity processed five Entities, two of type A and three of type B. SIMPROCESS will calculate
the costs for this period as follows:
1. Calculate the variable costs for each Resource based on the number of Entities Processed
and the processing times as described.
2. For each of the two Resources, calculate the portion of fixed cost represented by idle time.
Then calculate both the fully absorbed and capacity-based fixed costs. (In this case, the fully
absorbed costs should be twice the capacity costs, since the Resource was 50% idle during
the period.)
3. Add the variable costs to the fully absorbed costs and the capacity-based costs, creating two
period costs for each Resource.
4. Divide the period costs for the Resource based on the usage by activities. (In this case, the
period costs will be split evenly between the two activities.)
These steps are completed for all Resources in the model that are set to calculate costs. Each Activity
accumulates its period costs from all of the Resources that it actually made use of during the period. Next,
SIMPROCESS will calculate the Entity costs based on these Activity costs. After all Resource costs are
distributed to the activities, the Activity costs are then distributed to each type of Entity Processed by the
Activity, based on the total number of Entities Processed. These calculations proceed as follows:
SIMPROCESS User’s Manual
183
How to Use ABC in SIMPROCESS
1. The Activity determines the total number of Entities Processed for the period and the portion
of this total represented by each type.
2. The Activity costs are apportioned to the Entities based on the number of each Entity type
divided by the total number of Entities.
The pool of Activity cost is broken out to each Entity type based on the Entity usage of that Activity.
The Activity cost is displayed in the cost report for the total number of each Entity type, not for each
Entity instance. To calculate the Entity instance cost, divide the cost for that Entity type (the cost number
displayed in the report) by the total number of Entities of that type processed (available in the Standard
Report).
Upon completion of these calculations, SIMPROCESS resumes the simulation for the next cost period.
Note
Get Resource Activities accumulate the costs of Resources
obtained at Get Resource Activities. This is because the
Resource was not actually assigned to any of the activities where
processing occurred.
References
Michael R. Ostrenga, Terrence Ozan, Robert Mc Ilhattan, Marcus Harwood, The Ernst & Young Guide
to Total Cost Management, John Wiley & Sons, New York, 1992.
Douglas Webster, Activity Based Costing: A Tool for Reengineering the Enterprise, Enterprise
Reengineering, April/May 1995, pp. 18-23.
SIMPROCESS User’s Manual
184
CHAPTER 8
Output Reports
SIMPROCESS collects statistics by default for all Entities and all Resources for the Standard Report.
SIMPROCESS also allows the definition of custom statistics to gather more specific information about
a model. The Entity and Resource statistics gathered for the Standard Report will usually be sufficient
when starting a model. As the focus of the analysis is sharpened and the model becomes detailed, custom
statistics will be added to narrow in on the performance measures of most interest.
Further, real-time plots (see “Real-Time Plots,” beginning on page 200) and SIMPROCESS
Dashboards (see Chapter 16, ”SIMPROCESS Dashboards,” beginning on page 431) can be viewed,
a Simulation Results file containing all the statistics gathered from the model can be exported in a tabdelimited format (see “Simulation Results File,” beginning on page 583), and results can be exported
to a database (see Chapter 13, ”SIMPROCESS Database,” beginning on page 375).
SIMPROCESS User’s Manual
185
Standard Report
Standard Report
After the simulation run has completed, display the Standard Report to view output statistics for the
model. From the Report menu bar, choose Display Standard Report.
This will open the Display Standard Report dialog. In the Report Replications list box (if the model ran
for multiple replications), an individual Replication, the Average of All Replications, or the Sum
of All Replications can be selected. Typically, for runs of multiple replications the Average of All
Replications report is most useful. Calculate Confidence Intervals is activated if the Average of All
Replications report is selected. Calculate Confidence Intervals allows selection of 90%, 95%, or 99%
confidence intervals for each performance measure. Next, select to view the Standard Report with a
Text Editor (Wordpad by default on Windows) or with a Spreadsheet. Press the Display Report button
to open the report.
To view the Standard Report with a spreadsheet, select Spreadsheet, then use the Browse button to point
to its executable, i.e., Excel.exe. Once the spreadsheet is open, the Standard Report data is best
viewed in the left justified mode and with AutoFit checked for the columns.
Default Performance Measures
SIMPROCESS will collect by default the following performance statistics on Entities and Resources:
•
•
For each Entity defined in the model, Cycle Time and Count statistics are displayed.
For each Resource defined in the model, average and maximum number of units busy is
measured and shown as a percent of capacity.
SIMPROCESS User’s Manual
186
Standard Report
•
ABC reports for each Resource with cost defined in the model. The ABC reports have three
sections that are broken down by cost period and total cost. These sections are Resource by
Entity, Resource by Activity, and Activity by Entity. See Chapter 7–Activity-Based Costing,
beginning on page 176 for more detail on Activity-Based Costing.
On the Report menu, Define Global Statistics Collection brings up a dialog that sets global statistics
options. As stated above, Collect Entity Statistics and Collect Resource Statistics are selected. The results
of the selection options are described in the following sections. The Output Time Units field sets the
units for cycle time statistics in the Standard Report. Generate Standard Report after run causes the
Standard Report to be generated automatically after a simulation run. This is most useful when using
the Experiment Manager (page 387) or optimization (page 401). Note that Standard Reports generated
automatically are not accessible from within SIMPROCESS. The file (which is located in the model’s
directory) must be opened separately.
Attributes are handled differently for the Standard Report. The Standard Report check box on the
Attribute Properties dialog must be selected for each attribute that needs to collect statistics. The report
will display either Time-weighted or Observation-based statistics depending on the option chosen.
Statistics can be kept for all types of attributes except Entity Instance Attributes. Lastly, if the value
of an attribute does not change during the simulation run, its statistics will all be zeroes in the Standard
Report. See “User Defined Attributes,” beginning on page 242 for more information on Attributes.
SIMPROCESS User’s Manual
187
Custom Statistics
Custom Statistics
SIMPROCESS provides the ability to add custom statistics to the Standard Report for analyzing the
performance of business Processes. Such performance measures as cycle time, Activity costs, and
Resource utilization can be calculated by SIMPROCESS. This chapter describes the types of statistics
available, and how to define, display, print, and export them.
Entity Statistics
Entity statistics provide detailed information about the numbers of Entities existing in the model during
a simulation and the amount of simulation time (cycle time) that Entities require to pass through the
model. SIMPROCESS provides five types of Entity statistical reports:
•
•
•
•
•
Total Count
Entity Count by State
Entity Cycle Time by State
Real-time Plots
Attribute Value
Total Count, Entity Count by State, and Entity Cycle Time by State are selected either from the Define
dialog by choosing Collect Entity Statistics or by choosing Collect Entity
Statistics when each Entity is defined. If Collect Entity Statistics on the Define Global Statistics Collection
dialog is selected, then the above statistics (other than Real-time Plots and Attribute Value) will be
in the Standard Report for every Entity defined. If only statistics for selected Entities are desired, then
the global Collect Entity Statistics should not be selected, and the Collect Entity Statistics on the Entity
Definition dialog should be selected for the desired Entities.
Global Statistics Collection
SIMPROCESS User’s Manual
188
Custom Statistics
Total Count Statistics
These statistics show the total number of Entities that have been generated during the simulation, how
many remain in the system at the end of the simulation, and how many have exited the system throughout
the simulation.
Entity Count by State Statistics
These statistics present the simulation-generated Entity count statistics for selected Entity types.
Statistics are time-weighted for Entity counts. These statistics show the average number of Entities
in the system broken down by four states: in-process, waiting for Resource, holding for condition, and
traveling.
Cycle Time by State Statistics
Cycle Time statistics present the simulation-generated cycle time statistics for selected Entity types.
The cycle time calculations are based on the number of Entities that were processed at the end of the
simulation. These statistics show the breakdown of the Cycle Time by state. The four states that an
Entity may be in are in-process, waiting for Resource, holding for condition, and traveling.
Real-time Plots
Real-time plots display statistics while the simulation is running. This may slow the simulation but
real-time plots give a running view of the performance metrics during the simulation. If multiple realtime plots are selected, they will be stacked on top of each other. Real-time plots can be minimized,
moved, resized, or closed while the simulation is running. Real-time plots that have been closed can
be displayed again. See “Displaying Real-Time Plots” on page 203.
There are two types of real-time plots: traces and histograms. Traces display the instantaneous value
of a particular statistic along with a running mean. Histograms display the number of occurrences of
values of a statistic. These are grouped into value ranges called bins. The bin size is set automatically
by SIMPROCESS. Traces and histograms for the same statistic do not have to be displayed together.
Individual charts may be selected. Real-time plots are selected under the Report menu item Define RealTime Plots/Entities. Plots may be customized and hidden. See “Real-Time Plots” on page 200.
Cycle Times Trace and Cycle Times Histogram — These reports show the individual cycle time
measurements for each Entity of a given type. Charts are generated for each Entity type that is selected.
The charts are updated as each Entity of the given type completes its cycle time. This occurs when
the Entity is transformed or disposed in the model. The observation points on the trace are connected
only to improve their visibility and are not meant to suggest continuity.
Entities in System Trace and Entities in System Histogram — These charts show the individual Entity
count measurements (that is, the number of Entities that exist in the model) for each Entity type. Charts
are generated for each Entity type that is selected. The charts are updated as each Entity of the given
type is created and disposed in the model.
SIMPROCESS User’s Manual
189
Custom Statistics
Wait For Resource Trace and Wait For Resource Histogram — These charts show the current number of
Entities that are in the waiting for Resource state.
SIMPROCESS User’s Manual
190
Custom Statistics
Wait For Resource Cycle Times Trace and Wait For Resource Cycle Times Histogram — These charts show
the time spent waiting for Resources.
Hold For Condition Trace and Hold For Condition Histogram — These charts show the current number
of Entities that are in the holding for condition state that may be associated with Activities such as
Assemble, Gate, and Batch.
Hold For Condition Cycle Times Trace and Hold For Condition Cycle Times Histogram — These charts show
the time spent holding for a condition to be met.
Entities In Process Trace and Entities In Process Histogram — These charts show the current number
of Entities that are in the Process.
Process Cycle Times Trace and Process Cycle Times Histogram — These charts show the time Entities
spend processing.
Entities Traveling Trace and Entities Traveling Histogram — These charts show the current
number of
Entities that are traversing Connectors.
Travel Times Trace and Travel Times Histogram — These charts show the time Entities spend traversing
Connectors.
Attribute Value Statistics
The attribute value statistics must be specified in the dialogs where attributes themselves are defined.
If the attributes are defined while Entity types are being defined, then the statistics must be selected
where those attributes are defined.
Time-Weighted Average —
This collects time-weighted statistics for Entity attributes.
SIMPROCESS User’s Manual
191
Custom Statistics
Observation-Based Average —
Real-Time Histogram Plot —
Real-Time Trace Plot —
Standard Report —
This collects observation-based statistics for Entity attributes.
This displays a histogram of the attribute’s values.
This displays a trace of the attribute’s values.
Displays the results in the Standard Report.
Set Plot Properties —
Displays a plot properties dialog for each type of plot selected.
Resource Statistics
Resource statistics provide detailed information about the amount of time Resources spend in possible
states during a simulation. SIMPROCESS provides four types of statistics which show various
summaries of the state information for a Resource:
•
•
•
•
Utilization by State Statistics
Utilization by Activity Statistics
Real-time Plots
Attribute Value Statistics
Utilization by State is selected either from the Define Global Statistics Collection dialog by choosing
Collect Resource Statistics or by choosing Collect Resource Statistics when each Resource is defined.
The Utilization by State statistics will be in the Standard Report for every Resource defined if Collect
on the Define Global Statistics Collection dialog is selected. The global Collect
Resource Statistics should not be selected, and the Collect Resource Statistics on the Resource Definition
dialog should be selected if only statistics for selected Resources are desired. Similarly, Utilization
by Activity is selected either from the Define Global Statistics Collection dialog by choosing Collect
Resource by Activity Statistics or by choosing Collect Resource by Activity Statistics when each Resource
is defined.
Resource Statistics
SIMPROCESS User’s Manual
192
Custom Statistics
Utilization by State Statistics
These statistics present summaries of the simulation-generated statistics for the time that the number
of units of the selected Resources spent in each state. The average number of units and percentages
that were idle, busy, planned downtime, unplanned downtime, and reserved are shown in the Standard
Report. Also included in the Standard Report are the percentages that a Resource was idle, busy, or
reserved, given the Resource was available. That is, downtime (planned or unplanned) is not included.
The time available is considered to be the total time for the Resource. Thus, if a Resource has no
downtime defined, then the percentages for idle, busy, and reserved will be the same for the calculations
including downtime and the calculations not including downtime.
Utilization by Activity Statistics
These statistics show the average number of units that were busy by Activity.
Real-time Plots
These reports display the simulation-generated instantaneous capacity allocations for each of the five
Resource states. The reports present their data while the simulation is running. This may slow the
simulation but they provide a running view of the Resource’s behavior throughout the simulation. Realtime plots are selected under the Report menu item Define Real-Time Plots/Resources.
All report data is shown on an X-Y plot where the (horizontal) X-Axis represents simulation time and
the (vertical) Y-Axis shows the Resource's units. One chart is produced for each selected Resource.
Plots may be customized and hidden. See “Real-Time Plots” on page 200.
SIMPROCESS User’s Manual
193
Custom Statistics
Capacity Trace and Capacity Histogram —These reports show the capacity of a Resource during the
simulation. These plots are only useful for consumable Resources.
Units Idle Trace and Units Idle Histogram —These reports show the amount of a Resource's units which
are left idle during the simulation.
Units Busy Trace and Units Busy Histogram —These reports show the amount of a Resource's units which
are busy during the simulation.
Planned Downtime Trace and Planned Downtime Histogram —These reports show the amount of a
Resource's units which are not available due to planned downtime during the simulation.
Unplanned Downtime Trace and Unplanned Downtime Histogram —These reports show the amount of
a Resource's units which are not available due to unplanned downtime during the simulation.
Total Downtime Trace and Total Downtime Histogram —These reports show the amount of a Resource's
units which are not available due to unplanned and planned downtime during the simulation.
Units Reserved Trace and Units Reserved Histogram—These reports show the amount of a Resource's
units which are in reserved state during the simulation.
Attribute Value Statistics
The attribute value statistics must be specified in the dialogs where attributes themselves are defined.
If the attributes are defined while Resources are being defined, then the statistics must be selected where
those attributes are defined.
Time-Weighted Average —
This collects time-weighted statistics for Resource attributes.
Observation-Based Average —
Real-Time Histogram Plot —
Real-Time Trace Plot —
Standard Report —
This collects observation-based statistics for Resource attributes.
This displays a histogram of the attribute’s values.
This displays a trace of the attribute’s values.
Displays the results in the Standard Report.
Process/Activity Statistics
Process/Activity Statistics provide detailed information about the numbers of Entities entering and
leaving particular Processes/Activities during a simulation. SIMPROCESS provides seven types of
Activity statistics:
• Total Entity Counts
SIMPROCESS User’s Manual
194
Custom Statistics
•
•
•
•
•
•
•
Total Entity Counts by Entity
Entity Count by State
Entity Count by State by Entity
Cycle Time by State
Cycle Time by State by Entity
Real-time Plots
Attribute Values
The Process/Activity statistics are limited in scope to specific Processes/Activities in contrast to Entity
statistics which encompass the entire model. Cycle Time by State, Total Entity Counts, and Entity Count
by State are selected globally from the Define Global Statistics Collection dialog by choosing Collect
Activity Statistics or locally by choosing Collect Activity Statistics on the individual Activity properties
dialog. Activity statistics will be in the Standard Report for every Activity defined if Collect Activity
Statistics on the Define Global Statistics Collection dialog is selected. The global Collect Activity Statistics
should not be selected, and the local Collect Activity Statistics on the Activity properties dialog should
be selected if only statistics for selected Activities are desired. Similarly, Total Entity Counts by Entity,
Cycle Time by State by Entity and Entity Count by State by Entity are selected globally from the Define
Global Statistics Collection dialog by choosing Collect Activity by Entity Statistics or locally by choosing
Collect Activity by Entity Statistics on the appropriate Activity.
WARNING
Collect Activity Statistics and Collect Activity by Entity Statistics should
NOT be selected from the Global Statistics Collection dialog for large
models. This could cause memory problems and would lead to much
unneeded information. It is recommended that Activity statistics always
be selected at the appropriate Activity.
SIMPROCESS User’s Manual
195
Custom Statistics
Entity Count Reports
These reports present the simulation-generated Entity count statistics for selected Processes/Activities.
Total Entity Count—This report shows the total number of Entities that (1) have arrived at the Process/
Activity, (2) are remaining in the Process/Activity at the end of the simulation, (3) have been processed
by the Process/Activity, and (4) left the Activity without processing. These can also be broken down
by Entity type.
Count By Entity State—This
report shows the average and maximum Entity counts broken down by
Entity states, that were processed by the selected Activity. That is, how many were in the Activity,
Wait For Resource, In Process, and Hold for Condition states. Entity counts for Processes will not be
broken down by state. These can also be viewed by Entity type.
Cycle Time by State Statistics
These statistics present the simulation-generated cycle time statistics for the selected Process/Activity
and are calculated based on the Entity counts for the selected Processes/Activities.
Cycle Time statistics present the simulation-generated cycle time statistics for Entity types that
processed at the selected Activities or Processes. The cycle time calculations are based on the number
of Entities that were processed at the end of the simulation. These statistics show the breakdown of
the Cycle Time by state. The three states that an Entity may be in are waiting for Resource, holding
for condition, and in-Process. Cycle Time will not be broken down by state for Processes. These
statistics can also be broken down by Entity type.
SIMPROCESS User’s Manual
196
Custom Statistics
Real-time Plots
Real-time Plots display statistics while the simulation is running. This may slow the simulation but
shows a running view of the Entity count throughout the simulation. The selected charts are generated
for each Process/Activity selected. The observation points are connected in trace charts to improve
their visibility and are not meant to suggest continuity. See “Real-Time Plots” on page 200.
Cycle Times Trace and Cycle Times Histogram —These charts show the individual cycle time
measurements for each Process/Activity.
Wait For Resource Cycle Times Trace and Wait For Resource Cycle Times Histogram —These charts show
the individual wait for Resource time measurements for each Activity. These charts are not available
for Processes.
Hold For Condition Cycle Times Trace and Hold For Condition Cycle Times Histogram —These charts show
the hold for condition time measurements for each Activity. These charts are not available for Processes.
Process Cycle Times Trace and Process Cycle Times Histogram —This chart shows the processing time
measurements for each Activity. These charts are not available for Processes.
Entity Counts Trace and Entity Counts Histogram —These charts show the number of Entities in each
Process/Activity.
Wait For Resource Trace and Wait For Resource Histogram —These charts show the number of Entities
waiting for Resources for each Activity. These charts are not available for Processes.
Hold For Condition Trace and Hold For Condition Histogram —These charts show the number of Entities
holding for a condition for each Activity. These charts are not available for Processes.
Entities In Process Trace and Entities In Process Histogram —These charts show the number of Entities
processing for each Activity.
Attribute Value Reports
The attribute value reports must be specified in the dialogs where the attributes themselves are defined.
If the attributes are defined locally for a Process/Activity, then the reports must be selected where those
attributes are defined.
Time Weighted Average—This
collects time-weighted statistics for the selected Process/Activity
attributes.
Observation Based Average —
This collects observation-based statistics for the selected Process/
Activity attributes.
Real-Time Histogram Plot —
This displays a histogram of the attribute’s values.
SIMPROCESS User’s Manual
197
Custom Statistics
Real-Time Trace Plot —
Standard Report —
This displays a trace of the attribute’s values.
Displays the results in the Standard Report.
Connector Statistics
Connector Statistics provide detailed information about the numbers of Entities entering and leaving
particular Connectors during a simulation. SIMPROCESS provides seven types of Connector statistics:
•
•
•
•
•
•
•
Total Entity Counts
Total Entity Counts by Entity
Entity Count
Entity Count by Entity
Cycle Time
Cycle Time by Entity
Real-time Plots
The Connector statistics are limited in scope to specific Connectors in contrast to Entity statistics which
encompass the entire model. Cycle Time, Total Entity Counts, and Entity Count are selected globally
from the Define Global Statistics Collection dialog by choosing Collect Connector Statistics or locally
by choosing Collect Connector Statistics on the individual Connector properties dialog. Connector
statistics will be in the Standard Report for every Connector defined if Collect Connector Statistics on
the Define Global Statistics Collection dialog is selected. The global Collect Connector Statistics should
not be selected, and the local Collect Connector Statistics on the Connector properties dialog should
be selected if only statistics for selected Connectors are desired. Similarly, Total Entity Counts by
Entity, Cycle Time by Entity and Entity Count by Entity are selected globally from the Define Global
Statistics Collection dialog by choosing Collect Connector by Entity Statistics or locally by choosing
Collect Connector by Entity Statistics on the appropriate Connector. Connector statistics are usually only
needed for Connectors with a Duration.
WARNING
and Collect Connector by Entity Statistics
should NOT be selected from the Global Statistics Collection dialog for
large models. This could cause memory problems and would lead to
much unneeded information. It is recommended that Connector statistics
always be selected at the appropriate Connector.
Collect Connector Statistics
SIMPROCESS User’s Manual
198
Custom Statistics
Entity Count Reports
Total Entity Count—This report shows the total number of Entities that (1) have arrived at the Connector,
(2) are remaining in the Connector at the end of the simulation, and (3) have traversed the Connector.
These statistics can be broken down by Entity type.
Entity Count—This report shows the average and maximum Entity counts. These can be broken down
by Entity type.
Cycle Time Statistics
These statistics present the simulation-generated cycle time statistics for the selected Connector and
are calculated based on the Entity counts for the selected Connectors. The cycle time calculations are
based on the number of Entities that were processed at the end of the simulation. These statistics can
be broken down by Entity type.
Real-time Plots
Real-time Plots display statistics while the simulation is running. The charts are generated for each
Connector selected. The observation points are connected in trace charts to improve their visibility
and are not meant to suggest continuity. Plots may be customized and hidden. See “Real-Time Plots”
on page 200.
Cycle Times Trace and Cycle Times Histogram —These charts show the individual cycle time
measurements for each Connector.
Entity Counts Trace and Entity Counts Histogram —These charts show the number of Entities in each
Connector.
SIMPROCESS User’s Manual
199
Real-Time Plots
Real-Time Plots
Real-Time Plots display the change in value of statistics as the simulation runs for Entities, Resources,
Activities, Processes, Connectors, Time Stamps, and Attributes.
Defining Plots
Entities, Resources, Activities, and Connectors
Plots for Entities, Resources, Activities, Processes, and Connectors are defined on the Report menu.
Selecting Entities..., Resources..., Activities..., or Connectors... from the Define Real-Time Plots menu item
will bring a dialog listing the appropriate type of items defined in the model on the left, and the realtime plots available for that item on the right. Select an item on the left, then select the plots desired
on the right. Multiple items can be selected on the right by holding down the Control key when selecting.
The Select All button can be used if all plots are desired. The Deselect All button deselects all plots.
Once the desired plots have been selected, click OK. During the simulation, when the first value occurs
for a particular plot, the plot appears. The plot will remain unless minimized or closed. Real-time plots
SIMPROCESS User’s Manual
200
Real-Time Plots
that have been closed can be displayed again.
NOTE
Real-Time plots that have been displayed will not automatically
disappear at the end of a simulation run. Each one must be closed
individually. Note that all open plots will be closed when SIMPROCESS
is closed.
Time Stamps
Plots for time stamps are determined when the time stamp is defined. Select Time Stamps... from the
Define menu, and choose Add for a new time stamp or Edit to add plots to an existing time stamp. Enter
or edit the Start Key and Stop Key.
Select Collect Statistics to report the statistics on the Time Stamp in the Standard Report. Real-Time
Trace Plot causes the creation of trace plot of the data, and Real-Time Histogram Plot causes the creation
of a histogram of the data.
Attributes
Attribute plots are selected on the attribute definition dialog. All attribute types except Entity Instance
attributes can have plots. Trace or histogram or both can be selected. Plots will be created for each
item defined in the model if the attribute is a global Entity, global Resource, or global Activity attribute.
For instance, if there are ten Activities/Processes in a model, and a global Activity attribute is defined
with plots, then 10 sets of plots will be created since each Activity will have the attribute. Except for
Model attributes, it is best to use local attributes when selecting plots for an attribute. Also, if an attribute
is an array attribute, plots will be created for each member of the array.
SIMPROCESS User’s Manual
201
Real-Time Plots
Setting Plot Properties
Each item that can have plots has a Set Plot Properties button. This button sets the plot title, sets the
X axis legend, sets the Y axis legend, hides the plot at the start of the simulation, and, depending on
plot type, sets X axis type and the units for the X axis and Y axis. For trace plots, the X axis can either
be a standard axis (default) or a date axis. A date axis displays a date and/or time instead of numbers.
If the plot properties are not set, defaults will apply to the plots. The default title is the item name plus
the plot name. For instance, the default title for a trace of cycle times for an Activity named Delay1
would be “Delay1 Cycle Times Trace.” For a standard X axis the default units for the X axis of trace
plots is the Simulation Time Unit selected in the Run Settings. See “Setting the Simulation Time Unit”
on page 89. The default units for the Y axis of trace plots depends on the type of value being plotted.
If the value is a cycle time (total, processing, wait for Resource, hold for condition, or traveling), the
default unit is the Output Time Units selected in the Define Global Statistics Collection dialog. If the value
is not a cycle time, then the Y axis is set according to the values plotted. Histograms follow the same
rules for the X axis since the X axis plots the values in a histogram. To change any of the defaults,
or to hide the plot, choose the Set Plot Properties button. This button will display a dialog for each plot
selected.
SIMPROCESS User’s Manual
202
Real-Time Plots
Defaults will apply if Graph Name, X Axis Label, or Y Axis Label are left blank. The X Axis Type defaults
to Standard Axis with Hours selected for the Simulation Time Unit. When Date Axis is selected, Label
Format activates. Label Format designates the type of date and/or time labels to display on the X axis.
The possible options for Label Format are Date, Time, and Date and Time. Note that the Time format
should only be used when the simulation length is 24 hours or less. The date and time formats adjust
based on the location selected for the operating system. A United States location will display Jan 21,
2005 as 1/21/05, whereas a European location will display as 21/1/05. The plot properties default to
hide the plot and to not display the plot on a remote server. The plot properties dialog will display X
Axis Type and Value Time Unit based on the plot type and the value being plotted. Traces of cycle times
will offer both options. All other traces will only offer the X Axis Type option. Histograms of cycle
times will offer the Value Time Unit option. All other histograms will not have either option.
When plots are deselected, any properties set are lost. The properties must be reset if the plot is selected
again. Also, on the Define Real-Time Plots dialogs for Entities, Resources, Activities, and Connectors,
there is a Delete Properties button. This button will remove the plot properties from selected plots
without deselecting the plots.
Displaying Real-Time Plots
Plots that are hidden are displayed during or after a simulation by choosing Display Real-Time Plots
on the Report menu or clicking the button on the tool bar. These only become active at the beginning
of a simulation run.
SIMPROCESS User’s Manual
203
Real-Time Plots
A dialog appears that lists all plots (hidden or not) defined in the model. All the plots are listed in the
same dialog regardless of type (Entity, Resource, etc.).
The plots that are selected will display when OK is pressed. Once a plot is displayed it can be minimized
or closed. Any plot closed can be viewed again by using Display Real-Time Plots from the Report menu
or the tool bar. All plots remain available for display until the model is closed. The plots are recreated
if the model is run again.
Displaying Plots Remotely
The ability to display real-time plots on a remote server is a plug-in capability that can be licensed
separately from CACI. The Display Plot on Remote Server option must be selected, and the Remote Server
URL must be entered.
Before the model with the remote plots starts simulation, the Java RMI Registry must be started and
SPPlotServer must be started on the server where the remote plots are to appear. This requires the use
of the SPRemote.jar and plot.jar files which are found in the SPSYSTEM directory where
SIMPROCESS was installed (copy these to another system as required). To use the same system enter
rmi://localhost/ for the Remote Server URL field. To display the plots on a different system,
change localhost to an appropriate value that will resolve to the Internet Protocol (IP) address of
the system where the RMI Registry and SPPlotServer are located. Alternatively, just use the actual
IP number.
To start the RMI Registry, a batch file or UNIX shell script can be constructed, because the RMI Registry
program is required to have in its classpath the locations of files referenced by server Processes. Here
are some examples of what should be contained in those files:
SIMPROCESS User’s Manual
204
Real-Time Plots
Windows batch file:
set CLASSPATH=SPRemote.jar
rmiregistry
UNIX shell script using the Bourne shell or a derivative:
CLASSPATH=SPRemote.jar
export CLASSPATH
rmiregistry
UNIX shell script using the C shell or a derivative:
setenv CLASSPATH SPRemote.jar
rmiregistry
Sample batch files and scripts are located in the SPUser\SampleFiles directory. SPUser is in
the directory where SIMPROCESS was installed. The sample batch files and scripts are intended to
be used in the SIMPROCESS installation directory.
Adjust the precise CLASSPATH value as needed, based on where the copy of SPRemote.jar is
located and the current working directory. Once the RMI Registry program is started, SPPlotServer
can then be started. When using localhost, enter this command from the SIMPROCESS directory
on the system where SIMPROCESS is installed:
jre\bin\java -classpath SPSYSTEM\SPRemote.jar;SPSYSTEM\plot.jar
com.caci.remote.SPPlotServer
Alternatively, the PlotServ batch or script file in the SPUser\SampleFiles directory can be
run. Simply copy the appropriate file to the SIMPROCESS installation directory before running.
If not using localhost, from the directory where SPRemote.jar and plot.jar are located, enter this
command:
jre\bin\java -classpath SPRemote.jar;plot.jar
com.caci.remote.SPPlotServer
Use colons in the classpath for non-Windows systems. Once the Java RMI Registry and SPPlotServer
have been started, load and run the model.
Note that remote plots are not plotted locally. Real-time plots are created either locally or remotely,
but not both. Remote real-time plots cannot be hidden (even if selected in the Real-Time Plot
Properties). That is, they will display as soon as simulation data is sent to the plot. Also, once a remote
real-time plot has been closed, there is no way to reopen it since remote real-time plots are not in the
list of plots available through the Display Real-Time Plots button or menu item.
SIMPROCESS User’s Manual
205
Real-Time Plots
Automatic Saving of Plots
Plots are automatically saved in the plots directory (which is created in the model’s directory) at
the end of a simulation run. Only local plots are saved. All plots are saved using the name of the plot
as the name of the file. When creating the file name, some special characters (:, !, @, #, $, %, ^, &,
*, /, and \) in the name of the plot are replaced by underscores. Note that not all special characters are
replaced, and, depending on the system and the special characters, special characters that are not
replaced with underscores could cause an error during the automatic save of the plot. Trace plots have
a .trc extension and histogram plots have an .hst extension. These plots will be overwritten each
time the model is run. Thus, if a plot file needs to be saved, it should be renamed or moved, or the
plot can be saved using the File/Save option. Launch Plot Application on the Report menu opens a plot
window. Saved plots can be opened using the File/Open option of the plot window.
Post Plotting Options
Each plot window has a menu and four buttons. These provide options to save, print, and format plots.
Also, the plots have a zoom capability.
File Menu
•
•
•
•
•
•
Open
- Opens a previously saved plot
Save
- Saves a plot in XML format
SaveAs
Export
Print
- Saves a previously saved plot under a new name
- Saves the plot as an encapsulated postscript file
- Prints the plot
Close
- Closes the plot window.
Edit Menu
SIMPROCESS User’s Manual
206
Real-Time Plots
•
Format
- Changes the format of the plot
Special Menu
•
•
•
•
•
About
- Lists information on plot developers
Help -
Limited information on zooming plots
Clear
Fill
- Erases the values plotted
- No effect on plot
Reset Axes
- Resets axes ranges to starting values
Plot Buttons
Button functions, as seen from left to right, are as follows:
•
•
•
•
Prints the plot. (Same as File/Print.)
Resets the X and Y ranges to their original values. (Same as Special/Reset Axes.)
Sets the plot format. (Same as Edit/Format.)
Rescales the plot to fit the data. Used after zooming to return to full view of plot.
SIMPROCESS User’s Manual
207
Real-Time Plots
Plot Zooming
Once the simulation is complete, portions of the plot can be zoomed. To select the area for zooming,
left mouse click at one corner of the area and drag over the area. When the mouse is released, that area
will fill the plot. The following two plots demonstrate this. The first plot is the original plot. The second
shows the plot with a portion zoomed.
SIMPROCESS User’s Manual
208
Custom Plots
Custom Plots
The real-time trace plots available from Define Real-Time Plots on the Report menu plot one value along
with its mean. Define Custom Real-Time Plots offers the option of selecting more than one value to be
on a trace and/or histogram plot. Thus, various values can be viewed in comparison with one another
on the same plot. Selecting Define Custom Real-Time Plots brings up a dialog that lists the custom plots
defined in the model. Clicking the Add button brings up a dialog that has the trace and histogram plot
properties on the left and the list of values to plot on the right. Note that if a trace plot and histogram
plot are selected, the values plotted are the same for both plots. Another custom plot must be defined
if different values are to be on the trace plot and histogram plot. The plot properties on the left are the
same as described on page 202.
Adding Values To Custom Plot
The buttons located under Select Plot Values of the Custom Plot Properties dialog determine which
values will be plotted in the trace and/or histogram plots. The buttons are Entity, Resource, Activity,
Connector, Time Stamp, and Model Attributes buttons. These buttons bring up the appropriate list of items
along with the values that can be plotted.
Entity
- displays a list of Entities defined in the model. Once an Entity has been selected, the values
SIMPROCESS User’s Manual
209
Custom Plots
for plotting appear. The values that can be plotted are Number Created, Number Disposed, Number
In System, Number Processing, Number Waiting, Number On Hold, Number Traveling, Cycle Time,
Processing Time, Wait Time, On Hold Time, and Travel Time.
Resource - displays a list of Resources defined in the model. Once a Resource has been selected, the
values available for plotting appear. The values that can be plotted are Capacity, Units Idle, Units Busy,
Units Down, Units Planned Down, Units Unplanned Down, and Units Reserved.
Activity - displays a hierarchical tree of the model. Once a Process or Activity has been selected, the
values available for plotting for that item appear. The values that can be plotted for Processes are
Number Entities In Process and Entity Cycle Time. The values that can be plotted for Activities are
Number Entities In Activity, Number Entities Waiting, Number Entities On Hold, Number Entities
Processing, Number Entities Accepted, Number Entities Released, Number Entities Balked, Entity
Cycle Time, Entity Wait Time, Entity Processing Time, and Entity On Hold Time.
SIMPROCESS User’s Manual
210
Custom Plots
Connector - displays a hierarchical tree of the model displaying only Processes, Process Alternatives
and Connectors. Once a Connector has been selected, the values available for plotting for that item
appear. The values that can be plotted for Connectors are Number Entities Traveling and Entity Cycle
Time.
Time Stamp - displays the Time Stamps defined in the model. Once a Time Stamp has been selected,
SIMPROCESS User’s Manual
211
Custom Plots
the only value available for plotting is Cycle Time.
Model Attributes - displays a list of the Integer and Real Model Attributes defined in the model. Array
attributes are listed by element. Once an attribute has been selected, the values available for plotting
appear for that attribute. The values that can be plotted are the Value of the attribute and the Mean
of the attribute. The Mean is the observation mean.
Values can be added to the plot from each type (Entity, Resource, etc.). However, adding values from
different types and within types must be done with care. The units for each of the values should match.
For instance a cycle time should not be plotted along with a number of Entities value (for example,
Number In System). Those types of values have different units.
To add values, select the item on the left and the values desired on the right. Only one item on the left
can be selected at a time. However, multiple values on the right can be selected. If all are desired, the
Select All button can be used. Once selections are made, click the Add Values button. If the Add Values
button is not clicked, no values for plotting are added. Thus, multiple values from the items on the
left (Entity, Resource, etc.) can be added to the trace before clicking OK. Note that statistics do not
have to be collected on the values selected for the values to plot.
SIMPROCESS User’s Manual
212
Custom Plots
The custom plot below plots three values: two Entity and one Activity. Hardware Sales and Software
Sales are Entities. The value Entities In System is being plotted for both. Sales Process is a Process.
The value Number Entities In Process is being plotted for it. All three of these values have the same
units (number). Only a trace plot is defined. Following the dialog is the actual plot.
SIMPROCESS User’s Manual
213
Custom Plots
Removing Values From Custom Plot
Removing values from a custom plot is accomplished from the Custom Plot Properties dialog. There
are two buttons for removing values: Remove and Remove All. The Remove All button clears the plot
of all values. The Remove button clears the values that have been selected. More than one value can
be selected by holding down the Control key when selecting.
Setting and Removing Plot Group
Custom plots can be assigned to groups. Groups are based on Activities and Processes. A plot can be
assigned to any group but can only belong to one group. Plot groups only apply to custom plots or
Activity/Process plots from Define Real-Time Plots/Activities on the Report menu. (See “Real-Time
Plots” on page 200.)
Setting Plot Group
Plot groups allow custom plots to be associated with a particular Process or Activity, and they limit
the number of plots in the Display Real-Time Plots dialog. The latter can be valuable if there are many
custom plots and/or Activity plots defined in a model. Display Real-Time Plots on the Report menu or
the tool bar brings up a dialog that lists all of the hidden plots in the model. This list can be restricted
SIMPROCESS User’s Manual
214
Custom Plots
by assigning custom plots to groups. For instance, below is a portion of a model that models hardware
and software sales and hardware and software service. There are two subprocesses: Sales Process and
Service Process.
Plots can be assigned to these Processes so that, when one of the Processes is selected, only the plots
assigned to its group appear when Display Real-Time Plots is selected.
To set the plot group, click the Set Plot Group button on the Custom Plot Properties dialog. This opens
a dialog that has the hierarchical view of the Activities and Processes in the model (similar to the
Activity Browser dialog from the Edit menu). The item selected when OK is clicked is the group to
which the plot is assigned. Plots cannot be assigned to the model, TopProcess, or a Process alternative.
If one of those is selected when OK is clicked, the plot is not assigned to a group.
SIMPROCESS User’s Manual
215
Custom Plots
As an example, all the plots chosen to be hidden in the Customer Service model are shown below. This
list was displayed after the model was run using the Display Real-Time Plots button on the tool bar.
By selecting the Sales Process, this list can be restricted to the plots in the Sales Process group.
SIMPROCESS User’s Manual
216
Custom Plots
The list includes two custom plots (Sales Calls In System Trace and Sales Calls In System Histogram)
and two Activity plots from Define Real-Time Plots on the Report menu (Sales Process Entity Count
Histogram and Sales Process Cycle Times Trace).
Selecting the Sales and Service Processes causes the list to include plots assigned to both Processes.
Removing Plot Group
A plot can be removed from a plot group by either changing the assignment using the Set Plot Group
button or using the Remove Plot Group button on the Custom Plot Properties dialog. The Remove Plot
Group button simply removes the plot from the group, and no reassignment occurs. The button does
SIMPROCESS User’s Manual
217
Custom Plots
nothing if the plot is not assigned to a group.
Setting Legends
The legends on custom plots default to the names of the values in the plot (for instance, Software Sales
Calls:Entities In System). The Set Legends button allows the legend title to be changed. Also, the color
of the trace line can be changed. When one or more values in the custom plot have been selected, the
Set Legends and Reset Legends buttons become active. The Select All button selects all values in the
custom plot, and the Deselect All button deselects all values in the custom plot.
The Set Legends button brings up a dialog in which the text of the legend and the color of the trace
line can be set. Only the values selected will be in the dialog. Double clicking on a single value will
bring up the dialog with just the options for that value. The color of the value must be set if the text
of the legend is set. If not, the color will be Aquamarine, which is the first color in the color list.
SIMPROCESS User’s Manual
218
Custom Plots
The Reset Legends button resets the text and color of the legend to its default.
SIMPROCESS User’s Manual
219
Expression Plots
Expression Plots
Real-time Plots and Custom Plots, once defined, are updated automatically by SIMPROCESS. Also,
these plots are reset at the beginning of each replication. There is no way to control when the plots
are updated or reset. However, plots can be created and controlled using the SIMPROCESS Expression
Language. (See Chapter 10, ”Customizing a Model with Attributes and Expressions,” beginning on
page 237 for more information on Expressions.) Creating and controlling plots through the
SIMPROCESS Expression Language allows plotting to be done across replications. Also, this
capability allows replication summary statistics to be graphed.
There are five System Methods for plotting listed in “SIMPROCESS System Methods” on page 521:
CreatePlot, AddPlotLegend, ClearPlot, DisplayPlot, and PlotValue. A discussion
of these methods can be found in the section “Creating and Controlling Plots With Expressions” on
page 315. Note that the demonstration model SplitJoin.spm that is included with SIMPROCESS
has an example of Expression Plots (open model and view Define/Model Expressions).
SIMPROCESS User’s Manual
220
Simulation Results File
Simulation Results File
The Simulation Results file is generated from the File menu. Select File/Export/Simulation Results to
open the Save Statistics dialog. The Simulation Results file will, by default, have an .xpt file extension
and be saved to the current model directory. This file is tab-delimited and can be opened using a text
editor or spreadsheet.
The file will contain the complete statistical measures corresponding to the reports selected for the
current model. This file contains raw statistical data that is displayed in the Standard and Custom
Reports in a standard format that can be opened by many different applications.
For a complete listing of the format of the Simulation Results file, see “Simulation Results File,”
beginning on page 583
SIMPROCESS User’s Manual
221
Part B
Advanced SIMPROCESS Functions and Features
The chapters in this section describe the advanced functions and features available in SIMPROCESS Professional.
SIMPROCESS User’s Manual
222
CHAPTER 9
Reusable Templates and Libraries
One of the most powerful features of SIMPROCESS is the reusable Template. A Template is an
Activity, hierarchical Process, Resource, or Resource Downtime that is defined and reused over and
over. A Library is a collection of templates that can be saved and loaded during a modeling session.
SIMPROCESS provides a standard set of templates, such as Activities, Processes, Resources, and
Resource Downtimes. Templates provide the ability to set default parameters for SIMPROCESSprovided items. For example, specialized Resources such as Tellers, Loan Officers, Branch Managers
can be defined in the Resource Library for Business Process Modeling in a financial services business.
A Library could also contain templates that may represent competing models of the Business Processes
that are being compared.
Many different Templates can be created and loaded into the system when they are needed. Customized
Processes/Activities can be added to the Library Toolbar (for easy reuse) and/or added to the Create
pull-down menu.
SIMPROCESS User’s Manual
223
Library Concepts
Library Concepts
The SIMPROCESS Template and Library feature supports the reuse and organization of the various
constructs used in building models.
The development of specialized objects organized into Libraries is encouraged. Over time, the
Libraries of objects will grow. With a large set of Libraries of reusable model building blocks, new
models can be built faster. For example, a set of Processes (Warehouse, Manufacture, Transport) and
Resources (Trucks, People, etc.) relevant to the Distribution domain can be created and saved to a
Library named Distribution. These can then be used to quickly build distribution models.
Libraries built can be saved and loaded during the modeling session as they are needed. The import
and export features enable the sharing of Libraries with colleagues and increases the building blocks
available for model construction.
In addition to providing a repository for storing categories of modeling constructs, the Library
Management facilities can be used to customize defaults for model elements that are built into
SIMPROCESS (statistical distributions, Activity parameters, etc.). Processes and Activities that are
used frequently can be kept on the Library Toolbar for quick access. Processes and Activities that are
used less frequently can be accessed through the Create pull-down menu.
See “File Menu,” beginning on page 20 for information on using a model’s Group ID with templates.
In summary, Libraries:
•
•
•
•
•
Are repositories for model building constructs created by the user
Facilitate reuse of Processes, Activities, Resources, and Resource Downtimes
Allow placement of Processes and Activities on the Library Toolbar and the Create menu
Allow the grouping of Processes and Activities in user-defined templates
Facilitate importing and exporting of customized model elements for use in other models or
by colleagues.
SIMPROCESS User’s Manual
224
Defining and Editing Templates
Defining and Editing Templates
The Define/Templates pull-down menu provides access to various options for manipulating templates.
The two functions available under this pull down menu are Add and Library Manager.
Add
displays a dialog for adding a Process or Activity to a Library.
Library Manager brings up the SIMPROCESS Library Manager. The Library Manager is used to create,
load, save, remove, edit, import, and export Libraries of templates
Using The Library Manager
Library Management
The Library Manager is the primary tool for managing templates. Before creating templates, a Library
should be created. When no Libraries exist, the Library Manager is empty.
New
creates a new Library in which templates can be stored. A dialog for entering a name appears.
SIMPROCESS User’s Manual
225
Defining and Editing Templates
When OK is selected, the new Library appears in the Library Manager. This new Library is empty
at this point, but templates can now be stored in it.
Edit allows the editing of the Library name if a Library is selected. If a Process or Activity template
is selected, Edit allows the editing of certain template options.
Remove deletes the selected item. If a Library is selected, the Library and all templates in the Library
are deleted. If a template is selected, then only that template is deleted from its Library.
Load brings a Library that has been previously saved into the current SIMPROCESS session. The
templates can then be used to build models.
All Libraries will be shown in the Library Manager. A dot by the Library means the Library has not
been loaded. A folder by the Library means that it has been loaded. Simply select the desired Library
and click Load.
SIMPROCESS User’s Manual
226
Defining and Editing Templates
removes a Library from the current SIMPROCESS session. There will be a prompt to save
the Library if it has not been previously saved.
Unload
Save saves a template Library for future use. When the Library Manager or SIMPROCESS is closed,
there will be a prompt to save Libraries if there are Libraries that have not been saved.
Import
imports a Library file that was exported by another SIMPROCESS user.
Export
exports a Library file that another SIMPROCESS user can import.
Template Structure
All elements of a Process or Activity template can be viewed from the Library Manager. Process
templates include all the Processes and Activities that were a part of the Process. Activity templates
include the Activity itself. Both types of templates contain other elements that were referenced by the
Process or Activity placed in the Library. These elements include Resources, Resource Downtimes,
SIMPROCESS User’s Manual
227
Defining and Editing Templates
Entity Types, global Entity Attributes, global Entity Type Attributes, global Resource Attributes,
global Activity Attributes, Model Attributes, named distributions, tabular distributions, Functions, and
Auto Fits distributions. Note that code stored in a file for an Expression in a Process or Activity template
or code stored in a file for a Function referenced is not included in the template. The file references
are included in the template, but the template does not carry the files or their content with it.
The figure below shows a template named Process Calls in the Customer Service Library.
The elements with a “+” can be expanded to see the items included. Elements without a “+” were
not included in the templated item. A partially expanded view is shown below.
SIMPROCESS User’s Manual
228
Defining and Editing Templates
Adding a Process/Activity Template
To create a Process or Activity template, select the Process or Activity in the model, and choose
Templates/Add from the Define menu. Alternatively, right mouse click on the Process or Activity and
choose Add Template from the pop up menu.
SIMPROCESS User’s Manual
229
Defining and Editing Templates
This brings up a dialog where the template options can be set.
Label
is the name of the template that will be stored in the selected Library.
Layout Icon
is the icon that will display when the template is used in a model.
Library Toolbar Parameters determine the Library Toolbar settings. If On is checked, the template will
appear on the Library Toolbar. The Library Toolbar is on the right side of the screen. If Custom Toolbar
Icon is selected,the Toolbar Icon list is active.
The icon for the template on the Library Toolbar is selected from the Toolbar Icon list. The Toolbar
Label is the tool tip that will appear when the mouse is over the icon.
Menu Parameters determine the menu placement of the template. If On is selected, the template will
appear on one of the Create sub-menus with the name from the Label field. Menu Owner sets the submenu for the template. One of the current sub-menus can be used or a custom menu name can be entered.
As shown above, On can be selected for both Library Toolbar Parameters and Menu Parameters. However,
must be selected for at least one of the two.
On
The Library that this template should be added to is selected from the Add to Library list. If no Library
has been created, then the template will be added to a Library named Default (which can be renamed).
Adding Resource Templates
SIMPROCESS User’s Manual
230
Defining and Editing Templates
Resource templates are created from the Resource list. The Resource list displays all the resources
defined in the model. It is accessed from Resources on the Define menu. The Resource list has an Add
Template button.
Select the Resource and click the Add Template button. This brings up the properties of the template.
The template properties are simply the Resource properties with the Add to Library option added. As
with the other template types, if there has not been a Library defined, the Resource template will go
SIMPROCESS User’s Manual
231
Defining and Editing Templates
into the Default Library. Resource templates display in the Type combo box on the Resource list dialog
as long as the Library in which the Resource templates reside is loaded.
Adding Resource Downtime Templates
Resource templates are created from the Resource Downtime list. The Resource Downtime list displays
all the resource downtimes defined in the model. It is accessed from Resource Downtimes on the Define
menu. The Resource Downtime list has an Add Template button.
Select the Resource Downtime and click the Add Template button. This brings up the properties of
the template.
SIMPROCESS User’s Manual
232
Defining and Editing Templates
The template properties are the Resource Downtime properties with the Resource assigments removed
and the Add to Library option added. As with the other template types, if there has not been a Library
defined, the Resource Downtime template will go into the Default Library. Resource Downtime
templates display in the Type combo box on the Resource Downtime list dialog as long as the Library
in which the Resource Downtime templates reside is loaded.
SIMPROCESS User’s Manual
233
Editing Templates
Editing Templates
Templates cannot be edited directly from the Library Manager. However, template Library parameters
can be edited from the Library Manager.
Editing Templates
Templates can only be edited when they are part of a model. Thus, the way to change a template is
to open a new model, place the template within the model, make the necessary changes, then add the
changed template to the Library. If the template is added with the same name, it replaces the original.
Editing Library Parameters
To change the Library options for a template, select the template in the Library Manager and click
the Edit button. This will bring up the same properties dialog that appeared when the template was
added to its Library. The only difference is that the Library for the template cannot be changed.
Below are the template properties for Sales Process. Any property can be changed except the Library
owner. That field is missing. To place the template in a different Library, it must be added to that Library.
SIMPROCESS User’s Manual
234
Editing Templates
SIMPROCESS User’s Manual
235
Advantage of Templates Over Copy/Paste
Advantage of Templates Over Copy/Paste
Portions of models can be copied from one model and pasted into another model. However, the copy
action only copies the Activity/Connector structure. References to Entities, Resources, Resource
Downtimes, user defined distributions, Functions, or Attributes within the Activities are not carried
because those items may or may not exist in the model in which the paste occurs. This means all those
references must be redefined in the new model. When this occurs, a dialog will appear after the paste
that lists the items that have invalid references. Those items can be edited from the list.
Templates also allow portions of one model to be used in another model. However, since templates
carry references to the Entities, Resources, and Attributes used, those items remain referenced in the
Activities. Those references do not have to be redefined in the new model.
SIMPROCESS User’s Manual
236
CHAPTER 10
Customizing a Model with Attributes and
Expressions
SIMPROCESS provides a wide range of predefined model elements and statistical options, but every
business Process is unique in some way. There will be times when flexibility is needed to model
complex situations, and the built-in functions of SIMPROCESS may be inadequate. In those cases,
Attributes and Expressions can be defined.
For example, a typical SIMPROCESS model for an appliance manufacturer’s distribution Process
might include a batch Activity where customer orders are collected for shipment. Products may be
shipped on a predetermined schedule, or when the total number of pending orders reaches a certain
number. The SIMPROCESS Batch Activity readily handles these scenarios with the Quantity to Batch
and Release Threshold options.
But suppose the dispatching of a shipment depends on the total weight of the appliances that have been
accumulated. How is this situation modeled?
SIMPROCESS User’s Manual
237
Add weight of current
order item to total
weight of all orders
received.
Is total weight over
the max allowed?
Yes
Release Shipment
No
Customizing reports is another area where flexibility might be needed. SIMPROCESS provides several
reports that track the flow of Entities through a model. The values for how many Entities of a particular
type (each customer order, for example) are processed during simulation, or the average amount of
time an Entity takes to make its way through the simulation are available in the Standard Report.
But suppose the percentage of orders that are shipped by a promised delivery date (service level) is
needed to measure success in attaining service goals.
Two advanced SIMPROCESS features, Attributes and Expressions, provide the ability to handle these
and many other situations.
SIMPROCESS User’s Manual
238
Introduction to Attributes and Expressions
Introduction to Attributes and Expressions
Attributes
Attributes are user-defined and built-in variables of model elements whose values can change during
the course of a simulation run. For example, for a Batch Process where Entity release depends on the
weight of the Entities received, an Attribute is the total weight of the items accumulated in the Batch
Activity.
To determine the percentage of orders processed within a specified period of time, Attributes need
to track the processing time for each order, the number of orders that meet the promised delivery date,
and the total number of orders processed.
Attributes may be used to:
•
•
•
Alter the behavior of a Process by changing the value of an Attribute during a simulation
Communicate information (such as Attribute values) between two Processes in a model
Store data collected during a simulation run.
There are two categories of SIMPROCESS Attributes: built-in System Attributes, which
SIMPROCESS automatically creates and updates, and User Defined Attributes, which the user creates.
For example, the number of Entities generated for each Entity type (e.g., number of orders) is
automatically tracked and stored in a built-in System Attribute named NumberCreated. To track
an Attribute such as weight, which SIMPROCESS does not know about, an Attribute called
applianceWeight could be created.
Some System Attributes can be modified by users. These are called “Get-Set” type System Attributes.
Generally, these are variables that control Process parameters such as the number of Entities to batch
or amount of time of the next delay. By modifying these System Attributes, the behavior of the
simulation can be affected.
System Attributes that cannot be changed include those that monitor statistics, such as the number of
Entities generated during the simulation. These are called “Get-Only” type System Attributes.
Information on the status of a simulation, such as which Activity is processing an Entity or what type
of Entity is being processed, is also available through “Get-Only” System Attributes.
See “SIMPROCESS System Attributes and Methods,” beginning on page 511 for a complete list of
System Attributes.
SIMPROCESS User’s Manual
239
Introduction to Attributes and Expressions
Expressions
Attributes are a powerful simulation feature when used in conjunction with SIMPROCESS
Expressions. Expressions are user-written statements that SIMPROCESS executes during a simulation
run. Expressions are defined at the point at which the Expression is to be evaluated; for example, at
the beginning of the simulation, or at the moment an Entity (e.g., a customer order) is received by an
Activity (e.g., order distribution).
In the case of the model where releasing of shipments depends on the total weight of orders such as
appliances, the following could be done:
1. An Attribute called applianceWeight could be defined and its value set whenever an
appliance-order Entity is generated by SIMPROCESS. The value to assign
applianceWeight would be determined by checking the name of the Entity type (e.g.,
dishwasher-order, television-order). This information is available from the System Attribute
Name.
2. When an Entity is received at the Batch Activity, the Entity’s applianceWeight value
would be added to the total weight of all orders waiting to be shipped (another User Attribute).
The total weight would then be checked. If it exceeds a certain value, the Batch Activity would
be forced to release a shipment.
One way to force a shipment to be released is to change the batch size to a value equal to the current
number of Entities in the Batch Activity. These values are available in System Attributes.
This chapter describes:
•
•
•
Built-in System Attributes
User-Defined Attributes
How to write an Expression which uses User-Defined Attributes and System Attributes.
SIMPROCESS User’s Manual
240
Using Attributes in SIMPROCESS
Using Attributes in SIMPROCESS
This section contains a closer look at Attributes and how they can be used in SIMPROCESS. It starts
with a look at the System Attributes built into SIMPROCESS and then goes on to a detailed discussion
of User-Defined Attributes.
System Attributes
SIMPROCESS provides access to the state of a simulation through a set of built-in variables. These
System Attributes provide information such as:
•
•
The type of Entity currently in an Activity
•
•
The name of the Activity holding a particular Entity
The number of Entities of a particular type that have been generated thus far in the simulation
The type of Entity being generated by a Generate Activity.
A complete list of System Attributes is given in “SIMPROCESS System Attributes and Methods,”
beginning on page 511. The table entries below show the Attributes accessible from Batch Activities:
Object
Name
Type
Get/
Set
Batch MaxBatchSize INTEGER Both
Activities MinBatchSize INTEGER Both
MaxWaitTime
REAL
Both
Description
Number of Entities to batch.
Number of Entities must be in a batch
before it can be released.
Time to wait before releasing an
undersized batch.
1. The MaxBatchSize Attribute is an integer value representing the maximum number of Entities
to batch at a Batch Activity. The current value of the Attribute can be retrieved and changed.
2. The MinBatchSize Attribute is an integer value containing the minimum number of Entities
a Batch Activity must hold before it can release a batched Entity.
3. The Attribute MaxWaitTime specifies the maximum amount of time to wait before releasing
the batched Entities that have met the Activity’s MinBatchSize. The value is a real number
(e.g., 1.0, 7.5, etc.) representing the time unit selected for the maximum wait time. The value
of this Attribute can be retrieved and changed.
SIMPROCESS User’s Manual
241
User Defined Attributes
User Defined Attributes
Customizing a model begins with defining Attributes. These Attributes can represent model element
Attributes that are not built into SIMPROCESS, such as Entity weight and size or skill level of a
Resource.
Attributes can be defined in association with:
•
•
•
•
Entity types or Entity instances
Processes or Activities
Resources
The Model itself.
How an Attribute is defined tells SIMPROCESS whether to create an instance of that Attribute for every
model element of the same type (e.g., Entities, Resources), or to just create the Attribute for a particular
type of model element (customer order Entities, truck Resources). In SIMPROCESS terminology,
Attributes are either globally-defined or locally-defined. Model Attributes are only globally-defined.
When an Attribute is defined globally, an instance of that Attribute is automatically created for each
model element of that class. For example, if the model contains Entities of different types of appliances
(refrigerators, televisions, toasters, etc.) and a weight value needs to be assigned to each Entity, a global
Entity Attribute could be defined (applianceWeight). SIMPROCESS creates an instance of that
Attribute for every Entity in the model, so every Entity has an appliance weight Attribute which can
be referenced.
The only Activity concerned with weight is the Activity where Entities are batched. In this case, it makes
sense to locally define an Attribute for that particular Activity. When that’s done, no other Activity will
have a weight Attribute automatically created for it.
Note that Attributes for different model elements can have the same name. For example, a global
Attribute called applianceWeight could be defined for Resources. It can have a completely different
meaning and data type. Global and local Attributes for the same model element cannot have the same
name.
All attributes (global or local) are managed using a table similar to Entities and Resources. Changes
to global attribute definitions from the table cannot be canceled. Each table can be sorted by a particular
column by clicking the column header. Holding the Shift key while clicking the column header causes
the sort to be in reverse order.
Creating a User Defined Attribute
Global Attributes can be defined from the SIMPROCESS menu or from the dialog of a model element.
SIMPROCESS User’s Manual
242
User Defined Attributes
Local Attributes can only be defined from the dialog of a model element.
Globally Defining an Attribute from the Menu
To globally define an Attribute from the SIMPROCESS menu select Global Attributes... from the Define
menu. The following dialog appears:
The Global Attribute Definitions dialog is used to add a new Attribute or to change, copy, or delete existing
Attributes. There are five tabs: Entity, Entity Type, Resource, Activity, and Model. Each tab represents
model elements for which global Attributes can be defined. Note that the Entity tab defines Attributes
for each Entity instance created by the simulation. The originating Entity Type for the Entity instance
is not considered. So every Entity instance created by the simulation will have an instance of each
Attribute listed on the Entity tab. Attributes defined from the Entity Type tab are assigned to each Entity
Type. That is, for all Attributes listed on the Entity Type tab, there is one of each Attribute created for
each Entity Type that all Entity instances originating from that type can reference. Each tab shows
the names of all Attributes of that type previously defined. If no Attributes have been defined, the list
in each tab will be empty and the Edit, Copy, and Remove buttons will be inactive. The Undo button
activates when an Attribute is removed. Select the Entity tab and click on Add to create a new Attribute.
SIMPROCESS User’s Manual
243
User Defined Attributes
In the Attribute Properties dialog:
Name can be anything (except as noted below), as long as the name has not been previously
used for another Attribute of the same class of model element. For new Attributes,
SIMPROCESS initializes the field with a default name.
Value is the default initial value of this Attribute. The value must correspond to the data type
specified in the Mode field. For instance, 1.0 cannot be entered if the Mode is Integer. If the
Mode is Object, the Default value is UNDEFINED. An Object Attribute’s value can only be
set during a simulation run. Anything entered in the Default field is ignored. (See Mode types
below.)
Mode is the data type of the Attribute. Click on the arrow button to select either Integer, Real,
String, Boolean,
Integer
Real
or Object:
values are numbers without fractional or decimal parts.
values can contain fractional parts.
A String is any series of alphanumeric characters.
Boolean
values can be either TRUE or FALSE.
An Object is a reference to another model element in the model, a reference for Expression
Language constructs, or a reference to external Java classes. For example, during a
simulation an Object Attribute can point to an Activity in the model.
SIMPROCESS User’s Manual
244
User Defined Attributes
Array Dimension allows for Attributes to be set up as an array. The default value of 0 means
the Attribute is not an array. If an array dimension is provided and the user wishes to reference
the Attribute in the Expression language, it must be done using an integer subscript (e.g.,
myattribute[2] := value;). The subscripted arrays are zero-based, meaning that a
subscript of 0 refers to the first item in the array.
Model Parameter, when checked, means that every time the model is run, a dialog will open
allowing new initial values to be entered for the Attribute. Only global, user-defined Attributes
can be set as Model Parameters. If a Comment is entered for the Attribute, this will appear in
the Description field of the Model Parameters dialog when the Attribute is selected.
Model Parameters can be changed during a simulation run by selecting Change Model
Parameters from the Simulate menu. Note that changing the value of Model Parameters during
a simulation run may or may not affect the simulation. For instance, if the Model Parameter
is used to set the number of units of a Resource, changing the value of the Model Parameter
will have no affect on the simulation since the units of a Resource are set at the beginning
of a simulation run. However, changes to Model Parameters used to control entity flow or
used for time durations will affect the simulation. If the Model Parameter is an Entity instance
attribute, only Entities created after the change will reflect the change.
There is another option that does not appear on the properties dialog for global Entity
Attributes. Do Not Reset Before Each Replication is a property of global Entity Type, Resource,
Activity, and Model Attributes. If Reset System is selected on the Run Settings (page 109),
all Attributes (other than Entity Attributes) are reset to their initial value before each
replication. This does not happen if Do Not Reset Before Each Replication is selected. The
Attribute maintains its current value.
refer to statistics collected for Attributes during a simulation run. These
statistics are used in SIMPROCESS reports. Note that no statistics can be collected for Entity
instance Attributes.
Statistics Types
Observation Based and Time-Weighted
refer to the way statistics are collected:
Observation Based tells SIMPROCESS to collect statistical data without considering the
amount of time an Attribute maintains a particular level. Each time the value of an
Attribute changes, the new value is added to a running total.
Time-Weighted provides time-weighted statistics. That is, the length of time an Attribute
remains at a particular value is factored into the statistical data when the average value
is calculated.
Real Time Histogram Plot tells SIMPROCESS to plot the Attribute value changes as they occur
during the simulation run (Real Time Plot) using a Histogram-type graphic. The plots can be
saved, printed, resized, and re-read from prior saves using the menu on the Plot dialog.
SIMPROCESS User’s Manual
245
User Defined Attributes
Real Time Trace Plot tells SIMPROCESS to plot the Attribute value changes as they occur during
the simulation run to a trace type graphic. The trace plots can be manipulated similar to the
Histogram Plots.
Standard Report tells SIMPROCESS to write the statistics to the standard report file.
Click on OK to accept the options selected, or click on Cancel to exit without setting/resetting any
options.
An existing user Attribute can be copied by selecting the Attribute in the table and then clicking on
the Copy button. The Global Attribute Properties dialog is displayed with the options and defaults set
to the values of the copied Attribute.
To remove an existing user Attribute, select the Attribute from the table, and then click on the Remove
button. The Undo button will restore an Attribute definition that was removed.
The Local button is on every tab except the Model tab (Model Attributes are only global). Selecting
Local brings up a dialog that displays all model elements of the same type that have local Attributes.
For example, the Local button on the Activity tab shows all Activities that have local Attributes defined.
Selecting an item on the left displays the local Attributes for that item on the right. An item on the
left can be edited by double clicking or by selecting the Edit... button. Note that from this dialog local
Attributes cannot be defined for items that do not already have local Attributes.
SIMPROCESS User’s Manual
246
User Defined Attributes
Click on Close when finished defining or modifying global Attributes.
Globally Defining Attributes from Dialogs
All global Attributes (other than Model Attributes) can also be accessed from the properties dialog
of the appropriate model element (Entity, Resource, or Activity). For example, assume a model has
three Entities defined (refrigerator-order, television-order, and toaster-order). Selecting Entities... from
the Define menu, brings up the list of defined Entities.
Editing the refrigerator-order brings up the properties dialog. The image below shows the Entity
tab selected.
Attributes
SIMPROCESS User’s Manual
247
User Defined Attributes
There are no local Entity Attributes defined for this Entity. The Global button brings up the Global
Attribute Definitions dialog with the appropriate tab active. Since the Entity Attribute tab is selected
on the Entity properties dialog, the Entity tab will be active on the Global Attribute Definitions dialog.
Note that the Local button is missing since the Global Attribute Definitions dialog was opened from
the properties dialog of a model element.
Defining a Local Attribute for a Model Element
A local Attribute is defined for a single model element (Entity, Resource, or Activity). Local Attributes
are defined from the properties dialog of the model element. Note that Entity instance and Entity Type
local Attributes are both defined from the Entity properties dialog (Entity Attributes and Entity Type
Attributes tabs). The Resource and Activity properties dialog each have an Attributes tab. Attributes
defined locally exist only for the model element in which they were defined. Local Attributes are
managed in the same manner as the Global Attributes by using the Add..., Edit..., Copy..., and Remove
buttons. The Attributes tab for Resource properties is shown below.
SIMPROCESS User’s Manual
248
User Defined Attributes
SIMPROCESS User’s Manual
249
Assign Activity
Assign Activity
The Assign Activity can be used to assign values to globally defined Attributes and local Entity instance
and Entity Type Attributes. The Assign can also change the priority of an Entity.
Changing an Attribute Value with the Assign Activity
The Set Attribute list box of the Assign Activity is used to change the value of any global Attribute
(except globally-defined Resource Attributes) and local Entity instance and Entity Type Attributes.
Once an Attribute has been selected, clicking on the Add button will open up the Assign Attribute
Properties dialog.
The combo box in the Set Attributes field contains the names of all the Attributes that the Assign Activity
can access. Selecting an Attribute from the pull down list and then clicking on the Add button will open
the Attribute Assignment dialog where the Attribute value is specified. Likewise, by selecting an Attribute
from the left side of the Set Attributes list and clicking on the Remove or Edit buttons an Attribute
assignment can be removed or changed.
SIMPROCESS User’s Manual
250
Assign Activity
The Operation field contains the operators that can be used to change the value of the selected
Attribute. The supported operators are; =, +, -, *, and / (equals, addition, subtraction,
multiplication, and division).
The Value field contains the value to be used with the Operation. This can take the form of
a constant, a Statistical Distribution, a User-defined Function, or an Evaluate (Evl) Function.
User-defined Functions can be found on page 293 of this chapter. The Evaluate Function
is covered on page 263.
Each time an Entity enters the Assign Activity, the Set Attribute commands are performed.
Important: If the Attribute selected for assignment is a local Entity or Entity Type Attribute,
a run time error will occur if an Entity enters the Activity that does not have the selected
Attribute defined.
SIMPROCESS User’s Manual
251
Variable Resource Usage
Variable Resource Usage
User-defined Attributes can be used to request units of Resources. Using an Attribute allows the units
of Resource required by each Entity to vary. For instance, in the example from Chapter 5 (page 152)
an Entity needed one unit of the Service Rep Resource for that Activity.
Thus, every Entity will get one and only one unit of the Resource. However, there may be instances
where the amount of Resources needed would be different for each Entity. This is true many times
when using consumable Resources (such as fuel). Any type of Attribute may be used to set these levels
(Entity, Entity.Type, Resource, Activity, or Model). When Attributes are used, they must be provided
in the Evl distribution function such as “Evl(Model.myattribute).” The Evl function gives added
flexibility since mathematical functions can be used with the Attributes. “Evl(Model.myattribute +
(Entity.myEntityattribute * SQRT(Activity.myActivityattribute))” is an example.
In addition to Attributes, any statistical distribution may be used. Use Edit to modify the existing
requirement definition and then enter the Attribute that will have the unit information. The Attribute
must be a real or integer type Attribute.
SIMPROCESS User’s Manual
252
Variable Resource Usage
During the simulation run, if the units of Resource requested is larger than the Resource capacity, the
Entity will not proceed since there will never be more units available than capacity. This will not occur
when using consumable Resources. If the Resource is consumable, the Entity will continue when more
Resource units are available. Also, if a fractional number of units is requested and fractional usage
was not selected for the Resource, an error will occur.
SIMPROCESS User’s Manual
253
Writing Expressions
Writing Expressions
The previous section discussed how to define user Attributes. This section discusses how to use them.
For Attributes to be useful, they must be able to be accessed and changed during a simulation run.
SIMPROCESS provides opportunities to do this at many points during a simulation. The instructions
written to process Attributes and SIMPROCESS model elements are called Expressions.
An Expression is a user-defined routine that runs within the larger SIMPROCESS program. In effect,
SIMPROCESS checks at various points during a simulation run to see if there are any special
instructions for it. If so, it runs the code. Expressions accomplish simulation and modeling requirements
for which standard SIMPROCESS processing does not support.
The SIMPROCESS Expression language is introduced first, then how Expressions are implemented
is explained.
SIMPROCESS Expression Language Basics
The SIMPROCESS Expression language contains the basic features of any programming language.
Complex Expressions can be written in this language.
In the definitions that follow, the word expression with a lower case “e” refers to a mathematical
expression. Expression with a capital “E” refers to the SIMPROCESS Expressions feature.
Types
SIMPROCESS supports a limited set of data types. The supported types are as follows:
•
BOOLEAN
A variable that contains the binary values of TRUE or FALSE
•
REAL
A variable that contains a real number
•
INTEGER
A variable that contains an integer number
•
STRING
A variable that contains an array of characters
Types are specified in either one of two ways: by declaring a variable local to the Expression such
as the variables myReal and myString:
SIMPROCESS User’s Manual
254
Writing Expressions
myReal : REAL;
myString : STRING;
or by selecting the Attribute type from the Attribute definition dialogs. The Attribute definition dialogs
support the same types that can be declared locally in the Expression. However, the data type of Object
is not supported in the Expressions. ANYOBJ is used instead of Object.
Operators
•
Assignment Operator
The assignment operator is used to assign a value to an Attribute:
:=
For example:
x := 15;
assignWeight := 1000;
The colon (:) preceding the equal sign (=) is required. An error will occur if it is omitted.
String values can be concatenated using the + operator:
For example:
mystring1:= "hello ";
mystring2:= "dolly";
mystring3:= mystring1 + mystring2;
The string mystring3 now contains the value “hello dolly”. String concatenation can also
be used on functions that return string values such as the SUBSTR function.
For example:
mystring1:= SUBSTR(0,5,mystring3) + " dude";
The variable mystring1 will now contain “hello dude”.
•
Compare Operator
An equal sign without a preceding colon is used when comparing two values. Thus, the
statement beginning:
IF assignWeight = 1000...
SIMPROCESS User’s Manual
255
Writing Expressions
compares the value of Attribute assignWeight to the number 1000.
•
Arithmetic Operators used in the SIMPROCESS Expression language are + (addition), (subtraction), * (multiplication), / (division), DIV (integer division), and MOD (modulus).
•
Relational Operators include =, <> (not equal), <, <=, >, >=.
Literals
•
A string of printable characters on a single line is enclosed in quotation marks:
"The plain in Spain looks lovely in the rain.";
•
A boolean literal is entered as uppercase TRUE or FALSE:
myBool := TRUE;
•
An integer literal is entered as a whole number:
myInteger := 67;
•
A real literal is entered as a whole number plus a decimal, fraction, or whole number plus
a fraction:
myReal1 := 67.;
myReal2 := 67.133;
myReal3 := 0.345;
Type Checking
•
The use of variables (both those defined locally in the Expression and those defined as
Attributes) in Expressions will be checked for correct type on assignment statements. For
example, the following code will produce a type mismatch by the Expression interpreter.
myReal : REAL;
myString : STRING;
myString := "Hello Dolly";
myReal := myReal + myString;
SIMPROCESS User’s Manual
256
Writing Expressions
System Methods
•
System methods are commands which result in a system action or return a value from the
underlying system. One commonly-used function is SimTime, which returns a Real number
containing the current simulation time.
•
For a list of System Methods available in SIMPROCESS, refer to page 521.
Expression Language Statements
•
IF condition
{ELSIF condition}
{ELSE condition}
END IF;
•
WHILE condition
END WHILE;
•
FOR expression TO|DOWNTO expression [BY expression]
END FOR;
•
•
•
RETURN (possible return value)
EXIT (with WHILE or FOR loops)
OUTPUT
SIMPROCESS Expression language syntax:
1. The SIMPROCESS Expression language is case sensitive. An Attribute named
Applianceweight is not the same Attribute as the Attribute referred to as
applianceWeight.
2. All built-in language elements are in capital letters (IF, END,WHILE, etc.).
3. Each Expression language statement ends with a semicolon (;). The exceptions to this are
lines that begin with IF, ELSIF, ELSE, WHILE, and FOR.
4. Comments can be included in Expressions by enclosing them in curly brackets ({ }). For
example:
{This is a comment}
Do not end a comment line with a semicolon.
5. Basic conditional logic has the form:
SIMPROCESS User’s Manual
257
Writing Expressions
IF a < b
x := c;
ELSIF a < c
x := d;
END IF;
For example:
IF batchweight > 2000
MaxBatchSize := 100;
batchWeight := 0;
ELSIF batchweight > 1800
MaxBatchSize := 110;
END IF;
Messages can be displayed in the SIMPROCESS Expression Output Dialog with the OUTPUT
statement. This is useful for tracking the value of Attributes as a simulation proceeds. The OUTPUT
statement has the form:
OUTPUT(expression);
For example:
OUTPUT("Just assigned a weight to Entity");
OUTPUT("Current batch weight ",
batchWeight);
In the second example, the value of Attribute batchWeight is displayed following the text
"Current batch weight ". The literal string and Attribute name are separated by a comma so the
actual batchWeight value will appear next to the string.
SIMPROCESS User’s Manual
258
Writing Expressions
Expression Editor
Editing any Expression activation event brings up the Expression Editor, shown below. On the right
is the text area for entering the Expression. The dialog contains a single menu, Edit, which includes
the traditional Cut, Copy, Paste and Select All items. It also includes Find..., Replace... and Go To... items,
any of which display a dialog containing Find, Replace and Go To Line tabs. The Find and Replace features
include matching case, whole word searching, search up/down direction selection, and a Replace All
command. The Go To Line tab allows movement directly to any given line number of the expression
text, which can be useful when a validation error message includes a line number. Entering a very
large number goes to the last line; entering zero or a negative value goes to the first line; entering a
non-numeric value causes an error message to be displayed.
On the left are four tabs (Expression Language, System Methods, System Attributes, and User Defined
Attributes) listing the items that can be included in the Expression. The Expression Language tab lists
data types, operators, and constructs of the SIMPROCESS Expression Language along with a
description of the selected item. The System Methods tab lists the System Methods available for
SIMPROCESS along with the Arguments, the type the system method Returns, and a Description of
the selected item. The System Attributes tab lists the System Attributes defined for each simulation
object in SIMPROCESS. Included is the Get/Set property of the Attribute, the Type of the Attribute
(e.g., INTEGER, REAL), and a Description of the selected item. (See “SIMPROCESS System
Attributes and Methods,” beginning on page 511 for more information on System Attributes and
SIMPROCESS User’s Manual
259
Writing Expressions
System Methods.) The User Defined Attributes tab lists all the global Attributes defined in the model
and any local Attributes defined for the Expression owner including the Type of the selected Attribute.
Double clicking an item on any of the lists causes the item to appear in the Expression text area.
The Validate button below the text area checks the syntax of the Expression without closing the editor.
The Done button checks the syntax of the Expression and, if there are no errors, closes the Expression
editor.
Expressions entered into the Expression editor are saved as a part of the model file. This is the preferred
method of storing Expressions since copies made of the model file (either external to SIMPROCESS
or with Save As) will automatically have any Expressions that were defined in the original model file,
all the capabilities of the Expression Search feature (page 40) are available, and templates defined
(page 225) will also have any Expressions included in the original item being templated. However,
Expressions can also be stored in external files. This can be useful if the same Expression is used
multiple places, or if there is a need to change an Expression without opening the model. The same
Expression file can be used with multiple models, but this is discouraged since it is best if the Expression
file is stored in the model’s directory. Storing an Expression file in the model’s directory shows clear
linkage between an Expression file and a model. An Expression file must be an ASCII file. If a word
processor is used to create the file, make sure the file is saved in text format. Note that when using
Expression Search, if the Search For field is empty, the Expression Search will find any item that has
an Expression whether stored in the model or stored in a file, but searches for specific text ignore
Expressions in files.
To use an external file for an Expression select the Use Expression in File checkbox, and enter a file
name in the adjoining text field. If the file name does not have a path included, the file is assumed
to be in the model’s directory. If a path is included, it must be a complete path. SIMPROCESS will
not create the file entered in the text field. The file must be created by an editor independent of
SIMPROCESS. When there is already a file assigned, the text of the Expression file is loaded into
the Expression editor when the editor opens. If the file is assigned after the editor opens, the Refresh
button can be used to load the Expression. Expressions from files are not editable in the Expression
editor. The text of an Expression in a file is loaded into the Expression editor so the syntax of the
Expression can be checked using the Validate button. Expressions edited in another editor should always
have the syntax checked before running the simulation. If the syntax error is caught at run time the
simulation will stop. If the Validate button shows there are errors, the Expression can be modified in
another editor, the file re-saved, and then the Expression reloaded using the Refresh button. Clicking
the Done button checks the syntax before closing the Expression editor. However, unlike when the
expression is stored in the model, the option to close with errors is available.
If the Use Expression in File checkbox is deselected, the text of the Expression becomes editable.
However, if the editor is closed with Use Expression in File deselected, the Expression becomes a part
of the model. If Use Expression in File is reselected before closing the editor, any changes made are
lost since Expressions are only read from the specified file. Changes to the Expression must be done
and saved to the file in another editor. Expressions can be copied from the SIMPROCESS Expression
SIMPROCESS User’s Manual
260
Writing Expressions
Editor and pasted into another editor by highlighting the desired text and using the Copy and Paste
commands.
Using Attributes in Expressions
The value of an Attribute may be useful in the calculation of an Expression for a different construct
than that for which the Attribute was defined. For instance, the duration of a Delay Activity could take
the value of an Attribute of the Entity currently at the Delay Activity. To do so, the Expression on the
Activity must access the value of the Attribute on the Entity. This is accomplished by referring to the
Entity Attribute with the prefix “Entity.” followed by the name of the Entity Attribute.
Using the duration example above, for an Entity Attribute called “TimeFactor”, the duration that
each Entity (that carries the TimeFactor Attribute) will spend at a Delay Activity can be set with
the following statement:
NextDelay := Entity.TimeFactor;
By placing the above statement in the “Accept Entity” activation event (for a listing of activation
events, see “Expression Activation Events,” beginning on page 264) on the Delay Activity, the value
of the System Attribute, NextDelay, will take the value of the TimeFactor Attribute. The result
is, for each instance of an Entity reaching this Activity, its processing time at that Activity is determined
by the value of the Entity Attribute, TimeFactor, that each instance of the Entity carries. However,
this assumes that there is no wait for Resources. If an Entity has to wait, another Entity could enter
and change NextDelay before the first Entity is able to process. The preferred method is to use the
Evaluate function in the Duration Value field on the Delay Activity to return the value of the Attribute
TimeFactor. This method is better, since the duration of each Entity at the Delay Activity is calculated
from the TimeFactor Attribute. This is visible on the Properties dialog of the Delay rather than in
an Expression. Also, there is no possibility of another Entity changing the value of the delay. See the
“Evaluate (Evl) Function” on page 263 for more detail.
The format would be similar for an Entity Type Attribute. If the Attribute to be referenced was named
“TypeTime”, it would be used in the Expression of a construct other than an Entity as:
Entity.Type.TypeTime
The same holds true for Attributes of other SIMPROCESS constructs as well. An Activity Attribute
called “ActivAttr” that is referenced in an Expression on a construct other than an Activity, would
be referred to as:
Activity.ActivAttr
A Model Attribute called ModAttr would be referred to as:
SIMPROCESS User’s Manual
261
Writing Expressions
Model.ModAttr
User-defined Resource Attributes can be accessed by an Expression from any other construct in
SIMPROCESS, and values can be assigned to those Attributes by using the syntax described above.
However, User-defined and System Attributes for Resources must be accessed by using the
Resource System Method.
For instance, to reference the number of units currently busy of the Resource called Resource1, use:
Resource("Resource1").UnitsBusy
These are just some basics of the SIMPROCESS Expression language. See “System Method
Examples” on page 551 for more detail.
SIMPROCESS User’s Manual
262
Evaluate (Evl) Function
Evaluate (Evl) Function
The simplest use of an Expression is with the Evaluate (Evl) function. This function supports a single
line Expression. That Expression can contain any of the System Methods, System Attributes, Userdefined Attributes and Operators that are supported at the Activation Events level described in the next
section. The Evl function can be found on any of the combo boxes where the standard distributions
and User-defined Functions are listed.
An example using the Evaluate function is a system with a processing time (Delay) that is a function
of an Entity Attribute. Select the Evl(1.0) function on the Hours field from the Delay Activity’s
Properties dialog. Clicking the Detail button will open an Evaluate dialog where the Expression
describing the processing time is entered. This example reads the Entity’s processing time (given by
the Entity Attribute ProcTime) and multiplies it by 1.5. This value would then be the delay time for
the Activity. Entity.ProcTime could be typed in directly or selected from the Global Attributes
list. Once selected in the Global Attributes list, the attribute can be added to the Expression by selecting
Add Selection to Evl.
SIMPROCESS User’s Manual
263
Expression Activation Events
Expression Activation Events
SIMPROCESS has a set of activation points at which it checks for the existence of Expressions, and
then runs those that it finds. An Expression is assigned to an activation point at the time it is defined.
Each activation point corresponds to a simulation event and has a name identifying it to SIMPROCESS.
For example, the start of a replication is referred to as the Start Simulation event. The Start
Trial event marks the beginning of a single trial within a replication (after warmup).
Some events can occur many times during a simulation. The Start Trial and End Trial events
occur once during each replication of a multi-replication simulation. If the simulation contains only
a single replication, these events occur just once. The Start Simulation and End Simulation
events occur once during each replication of a multi-replication simulation if Reset System is selected
in the Simulation Run Setting dialog. Otherwise, the Start Simulation event occurs just once
at the beginning of the first replication. The End Simulation event occurs at the end of the last
replication. These are specified on the Expressions tab of Process, Activity, Resource, and Entity Type
dialogs.
SIMPROCESS User’s Manual
264
Expression Activation Events
Start Run and End Run are model Expressions only (menu Define/Model Expressions). These
Expressions are executed only once no matter how many replications are run. Start Run is the very
first Expression executed, and End Run is the very last Expression executed. These Expressions are
particularly useful for opening and closing files that are needed throughout the simulation. (See
“Methods OpenFile, CloseFile, ReadFromFile, and WriteToFile:,” beginning on page 555 for
information on opening and closing files.) The Start Simulation and Start Trial model
Expressions are executed before the Start Simulation and Start Trial Expressions of Entity
Types, Resources, Activities, and Processes. The End Simulation and End Trial model
Expressions are executed after the End Simulation and End Trial Expressions of Entity Types,
Resources, Activities, and Processes.
Events related to Entities and Resources can occur numerous times throughout a simulation trial. For
example, an Entity’s arrival at an Activity is a simulation event called Accept Entity (so-called
because the Entity is being accepted into the Activity). This can occur thousands of times during a
long simulation, once for each Entity that arrives at the Activity.
SIMPROCESS User’s Manual
265
Expression Activation Events
Every Expression is associated with a specific SIMPROCESS model element. Select the model element
that requires customized processing, specify the event at which the processing is to occur, and then
write the Expression to do the processing. “Example: Batching Entities Based on Weight” on page 270,
describes this Process in detail.
Not every event is available as an activation point for every model element. For example, the initial
value of an Attribute for an Entity can be set when the Entity is first generated (Initialize
Entity), or when the Entity is released from a Generate Activity (Release Entity). But the
value of an Entity Attribute cannot be set when the simulation first begins to run (Start
Simulation), because no Entities have been generated at that point.
The table below contains a complete list of activation events. Note that the order of the elements is
the order in which the Expressions are executed.
SIMPROCESS User’s Manual
266
Expression Activation Events
Event Name
Activation Point (and Comments)
Model Elements
Active For:
Start Run
The beginning of a simulation run. Occurs
only once, no matter how many replications.
Model.
Start Simulation
The beginning of the first replication, before
the warm-up period (if any). If Reset
System is selected, it occurs at the beginning of each replication.
Model.
Entity Types.
Resources.
All Activities.
Start Trial
Beginning of a trial within the simulation,
after the warm-up period (if any).
Model.
Resources.
Entity Types.
All Activities.
Initialize Entity
Creation (allocation) of an Entity.
Entity Instances.
Entity Types.
This typically occurs in a Generate Activity,
but may also occur in the Batch, Transform,
Copy, Split, and Assemble Activities.
Accept Entity
Arrival of an Entity at an Activity or Process.
Processes plus all Activities
except Generate.
Entity Instances.
Get Resource
Obtainment of a Resource by an Activity.
Resources.
All Activities except
Generate, Free Resource, &
Dispose.
Interrupt Processing
Entity processing is interrupted by a higher
priority Entity or by a Resource going
down.
Entity Instances.
Resume Processing
Entity processing is resumed after interruption.
Entity Instances.
Free Resource
Release of a Resource by an Activity.
Resources.
All Activities except Generate, Get Resource, & Dispose.
SIMPROCESS User’s Manual
267
Expression Activation Events
Event Name
Activation Point (and Comments)
Model Elements
Active For:
Release Entity
Release of an Entity from an Activity or
Process.
Processes plus all Activities
except Dispose.
Entity Instances.
Dispose of
Entity
Dispose of an Entity.
Entity Instances.
Entity Types.
Start Downtime
Resource initiates a downtime.
Resources.
End Downtime
Resources ends a downtime.
Resources.
End Trial
End of a simulation trial.
Model.
Entity Types.
Resources.
All Activities.
End Simulation
The end of a simulation replication.
Model.
Entity Types.
Resources.
All Activities.
Statistic collection for the replication ends
at this point.
End Run
The end of a simulation run. Occurs only
once at the end of all replications.
SIMPROCESS User’s Manual
Model.
268
Attribute Value Initialization
Attribute Value Initialization
User-defined Attributes can be initialized at several places in a SIMPROCESS model. The following
procedure shows how SIMPROCESS sets Attribute values along the simulation timeline.
When the simulation is started, SIMPROCESS will:
1.
2.
Initialize Attributes to the values that are specified in the Attribute Definition dialog
Execute the reset system mechanism if the Reset System option is selected and Do Not Reset
Before Each Replication is not selected (reset Attribute to the values specified in the Attribute
Definition dialog)
3.
Execute any Start Simulation Expressions (Attributes can be set to different values in these
Expressions).
After a replication is complete, SIMPROCESS may reset Attribute values for the next replication. If
the Reset System option is selected in Run Settings, SIMPROCESS will continue on the next replication
starting from item 2, as listed above. Otherwise, it will start from item 3.
SIMPROCESS User’s Manual
269
Example: Batching Entities Based on Weight
Example: Batching Entities Based on Weight
This example describes a method of releasing Entities based on weight, an Attribute that
SIMPROCESS is not inherently aware of. The model depicts the product distribution Process of an
appliance manufacturer. Here is a simplified view of the model:
1.
Appliance orders are received from customers.
This is the Generate Activity. Each appliance order is an Entity.
2.
The orders are processed and eventually make their way to a distribution center in the form
of appliances.
This takes place within a subprocess. The details are not important for this example.
3.
Appliances are shipped to customers from the distribution center. A Batch Activity is used
to ship appliances as a group.
Shipments are released when the total weight of all appliances awaiting delivery reaches 5000
pounds.
In order to accomplish the objective of releasing the batch when a certain weight is accumulated, do
the following:
1.
Define Attributes to represent the weight Attribute of Entities (define global Entity Attribute
applianceWeight).
2.
Assign values to the weight Attributes.
3.
Accumulate and track the weight of Entities received at the Batch Activity (define local
Attribute at Batch Activity named batchWeight).
4.
Trigger the release of Entities if a specified weight is reached, and prevent the release of
Entities otherwise.
Build Process Flow
Open a new model and place a Generate Activity, Process, Batch Activity, and Dispose activity on
the layout. Connect the Activities. Descend into the Process and connect the incoming Input Pad to
the outgoing Output Pad. The details of the Process are not important for this example.
SIMPROCESS User’s Manual
270
Example: Batching Entities Based on Weight
Initializing Entity Attributes
First, assign a value to the applianceWeight of each Entity generated during a simulation. This can
be done as soon as the Entity is created. Then, when the Entity reaches the Batch Activity, add its weight
to a running total and compare this total to the maximum allowable weight. The points in the simulation
where Expressions need to be activated are:
•
•
Entity initialization
Receipt of the Entity by an Activity.
Entities are initialized by SIMPROCESS at the Initialize Entity event. Entities are received
by an Activity at the Accept Entity event.
Initialize Entity
Accept Entity
Defining the Expression at Entity Initialization
To assign an initial value to an Entity’s applianceWeight, define an Expression for each type
of Entity in the model. The Expression is a single assignment statement (e.g., applianceWeight
:= 1000.0) to be executed when the Entity is first generated (the Initialize Entity event):
1.
From the Define pull-down menu, select Entities.
SIMPROCESS User’s Manual
271
Example: Batching Entities Based on Weight
2. This model contains three Entity types. An Expression must be defined for each Entity. Start
by selecting the first Entity on the list, and then press Edit.
3. Every refrigerator-order Entity that is generated needs to be initialized, so select the Entity
Expressions tab.
4. Six simulation events are listed on the Entity Expressions tab. These are the points during the
simulation at which SIMPROCESS checks for Expressions which apply to Entity instances.
The event needed is Initialize Entity, which is the point at which an Entity is first
generated (initialized). Highlight Initialize Entity and click on Edit.
5. SIMPROCESS invokes the Expression editor and opens an Expression script dialog. Add just
one line to the text dialog:
applianceWeight := 1000.0;
This assigns a value of 1000.0 to applianceWeight.
6. Close the editor.
7. Follow the same procedure for each of the Entities in the model, but assign them different
weights. Assign a weight of 100.0 to television-order and 10.0 to toaster-order.
8. Click OK when finished.
Defining the Expression When an Entity Is Released
The method described above works fine to initialize the applianceWeight Attribute of Entities.
It’s fairly simple, too; it requires only a single statement in each Expression. But it is redundant in that
Expressions must be defined for each type of Entity. Defining an Expression for each Entity would
be tedious and time consuming if there are many different types of Entities.
There are other options. A weight does not have to be assigned to the Entities as soon as they are created.
SIMPROCESS User’s Manual
272
Example: Batching Entities Based on Weight
All that is required is the weight be assigned before the Entity reaches the Batch Activity where
appliances are distributed (DISTRIBUTE-ORDERS).
In this model, all Entities are generated by a single Generate Activity. So an Expression can be defined
in the Generate Activity that activates whenever an Entity is released (Release Entity event).
This is the most efficient way to proceed. One Expression handles the initialization of any Entity’s
applianceWeight.
1. Double-click on the Generate (RECEIVE-ORDERS) Activity.
2. In the Generate Activity Properties dialog, click on the Expressions tab. Five simulation events
are listed. The first, Start Simulation, will occur before any Entities are generated. Start Trial
will occur before any Entities are generated if there is no warmup period; otherwise, some
Entities could be generated if Entity generation was scheduled during the warmup period.
Release Entity serves the purpose, so highlight it and click on Edit.
3.
Enter the following lines in the Expression dialog:
IF Entity.Name = "refrigerator-order"
Entity.applianceWeight := 5000.0;
ELSIF Entity.Name = "television-order"
Entity.applianceWeight := 100.0;
ELSE
Entity.applianceWeight := 10.0;
END IF;
These instructions check the name of the Entity being released at the Activity. The name
identifies the type of Entity. A value is assigned to applianceWeight based on the Entity
type.
4. Close the editor.
5. Click on Close, and then OK.
Releasing Entities Based on Weight
Two more Expressions are needed to complete the model. In the first Expression, check the weight
of the Entities received at the batch Activity and trigger their release if the weight reaches a certain
number:
1.
Double-click on the DISTRIBUTE-ORDERS Activity.
2.
In the Batch Activity Properties dialog, click on the Expressions tab.
SIMPROCESS User’s Manual
273
Example: Batching Entities Based on Weight
3.
There are eight activation events listed on the Expressions tab for a Batch Activity. Accept
Entity occurs when an Entity arrives at the Activity, so highlight this event and click on Edit.
4.
Insert the following code:
batchWeight := batchWeight + Entity.applianceWeight;
IF batchWeight >= 5000.0
MaxBatchSize := NumberIn;
OUTPUT("Batch weight is ",
batchWeight);
batchWeight := 0.0;
END IF;
In this Expression, the weight of the just-received Entity is added to the total weight of all
Entities received. If the total weight exceeds 5000.0, a batch release is triggered by resetting
MaxBatchSize, the Attribute that sets the maximum number of Entities that can be held
in the batch. With the Activity about to be emptied of Entities, the batchWeight Attribute
is reset to zero.
The OUTPUT statement in the Expression is there as an example of displaying information
in the message dialog. It is not needed by the model. OUTPUT statements can be interspersed
in Expressions in order to trace events during a simulation. Displaying the value of
batchWeight, for instance, verifies that the batch is really released when the weight
exceeds 5000.0.
5. Close the Accept Entity editor.
6. Edit the Start Simulation event. Enter the code below. This causes the Batch Activity
to wait for the logic in Accept Entity to cause a batch release.
MaxBatchSize := 10000;
7. Close the Start Simulation editor.
There is one more thing this model needs. The maximum batch size must be reset again after the Entities
are released. Entities should not be released when the DISTRIBUTE-ORDER batch reaches a certain
number. Only accumulating 5000 pounds of weight should trigger release.
As it stands now, MaxBatchSize is set to the size of the previous batch accumulated at the Activity.
This was done to force a release of Entities when batchWeight reached 5000 pounds. The number
of Entities could reach the current MaxBatchSize again before accumulating 5000 pounds of
weight. To prevent that, reset this Attribute to a number that can not possibly be reached before
accumulating 5000 pounds of weight:
1.
In the Expressions tab, select Release Entity. This is the event where the Entities are released
from the batch Activity.
SIMPROCESS User’s Manual
274
Example: Batching Entities Based on Weight
Press Edit.
2. Enter the following statement:
MaxBatchSize := 100000;
3. Close the editor.
The model should now be ready to run.
An Alternative Method Using Entity Types
This example works fine, but there are alternative approaches (as there often are when building models
in SIMPROCESS).
A couple of alternatives have already been described for initializing the value of the
applianceWeight Attribute (“Defining the Expression at Entity Initialization” on page 271 versus
“Defining the Expression When an Entity Is Released” on page 272). Another alternative involves
defining the applianceWeight Attribute for Entity types instead of Entity instances.
In this example, a weight Attribute was defined for every Entity instance in the model. Every
refrigerator order was assigned a weight of 5000, every television order, 100, etc. The assigned weights
remained unchanged during the course of the simulation.
Another approach would be to define an applianceWeight Attribute for each Entity type and
initialize it at the Start Simulation event. Then, in the Expression defined at Accept Entity
for the DISTRIBUTE-ORDERS Activity, the Entity’s weight would be referenced as:
Entity.Type.applianceWeight
This would work fine for this example. But suppose that the weight of an order could be affected by
some step in the Process being modeled and this needed to be reflected in the model. For example,
a customer order could include accessories for an appliance (e.g., cables and remote control for a
television), adding to the weight of the order. In that case, attaching the applianceWeight Attribute
to each Entity instance allows the weight of each television order to vary, which cannot be done if
the Attribute belongs to the Entity’s type.
Using Object Attributes in Expressions
The code in this example uses an Expression language construct referred to as a qualified reference.
For instance:
Entity.Name
SIMPROCESS User’s Manual
275
Example: Batching Entities Based on Weight
refers to an object, named Entity, and an Attribute, Name.
An object Attribute leads SIMPROCESS to the model element containing the Attributes of interest.
Unlike other Attributes, the value of the object is not of interest, only the values of its system or user
Attributes.
In step 3, the type of Entity being released by the Generate Activity was identified. The System Attribute
Name identifies the Entity type. But a Name Attribute also identifies Resources and Activities. So
referring to Name alone is ambiguous. In fact, SIMPROCESS assumes the reference is to the model
element that called the Expression (the RECEIVE-ORDERS Activity). To avoid confusion in the
Expression, always qualify Attributes with the object name such as (Entity.Name, Self.Name,
Activity.Name, Self.myattribute, etc.).
That is where object Attributes come in. They identify the model element of interest.
•
The Entity object Attribute tells SIMPROCESS to look at the Entity being processed in
the current Activity.
•
An Attribute called Self points at the current model element; that is, the model element the
Expression has been invoked from.
So Entity.Name returns the type name of the Entity instance being processed at the RECEIVEORDERS Activity, while Self.Name returns the name “RECEIVE-ORDERS.”
A qualified reference is also employed to set the User Defined Attribute applianceWeight:
Entity.applianceWeight := 5000.0;
Now, applianceWeight was specifically defined as an Attribute of Entities. However, this does
not mean that any reference to this Attribute would be unmistakable, that it can only refer to one thing.
But in fact, the reference to applianceWeight must be qualified by an object reference. This is
because without specifying a qualifier, SIMPROCESS assumes the reference is to an Attribute of the
current model element. In this case, the current model element is the Generate Activity, RECEIVEORDERS, since it is the model element which invoked the Expression. There is no Attribute named
applianceWeight associated with this Activity, and an unqualified reference to
applianceWeight would result in an error.
Note that an unqualified reference to the Attribute Name refers to the name of the current model element,
RECEIVE-ORDERS. If that is the Attribute of interest, the Attribute does not have to be qualified.
Object references can be stacked to gain access to variables that may not be within the scope of the
current object but may still be of interest in an Expression. For example, the following Expression
snippets are valid uses of object references from within an Activity Expression under the Accept Entity
event.
SIMPROCESS User’s Manual
276
Example: Batching Entities Based on Weight
OUTPUT("In ",Self.Name, " Entity = ", Entity.Name);
{ produces the name of the Activity and the name of the current
Entity }
OUTPUT("In ",Self.Name, " Entity Type = ", Entity.Type.Name);
{ produces the name of the Activity and the name of the current
Entity’s type }
OUTPUT("In ",Self.Activity.Name, " Entity = ",
Activity.Activity.Entity.Name);
{ produces the name of the Activity and the name of the current
Entity }
Notice in the third OUTPUT example, the object reference to the current Activity is stacked. In other
words, the Object Self points to itself, and the Activity object also points to the current Activity. This
is basically a circular reference and does not really do anything other than slow down the simulation
and confuse anyone that may read the Expression (something like
Activity.Activity.Activity.Entity.Name could also have been used which is the same result but is even
more confusing). The Expression language allows this feature so that access can be gained to certain
objects when appropriate. Consider the following example from within a Resource Expression under
the Get Resource event:
OUTPUT("In ",Self.Name, " Activity.Entity.Name
Activity.Entity.Name);
= ",
{ produces the name of the Activity and the name of the current
Entity in that Activity }
The above statement gains access to the Entity in the Activity that is assigning the Resource. When
using the stacked object references, pay close attention to what is the current state of the model. Consider
the following example for an Entity Expression under Initialize Entity event.
OUTPUT("In ",Self.Name, " Activity = ", Activity.Name);
{ produces an error
}
The above OUTPUT statement produces an error since there is no Activity object in scope at the time
an Entity is initialized. An Entity must be accepted into an Activity before the above statement would
work. This is a good example of being aware of the state of the simulation when referencing objects.
Other common mistakes are using the Resource object references (for example,
Resource("myResource").Activity.Name from within an Activity Expression before the Get Resource
event has occurred) or Sibling and Child references without considering the state of the Siblings and
SIMPROCESS User’s Manual
277
Example: Batching Entities Based on Weight
Children (for example, Sibling("Delay6").Entity.Name may produce an error if there is no Entity
current in the Delay6 Activity).
Object references are very powerful but can be confusing. It is recommended that the simplest form
possible of object reference be used in Expressions and that objects be accessed from the most obvious
point of scope (i.e., placing the Expressions behind the appropriate events).
The use of object reference also applies to the Child, Parent, and Sibling references. Any number of
object references can be stacked and return appropriate results unless a Child or Sibling is referenced
that does not exist, or a Parent is referenced from the top-level diagram - all of which will return an
error and terminate the simulation. The following example would work in a Process Expression as
long as it was invoked from a Process that is at least three levels deep, has a Sibling named "Delay6",
and a Child named "Delay7":
OUTPUT("In ",SelfName, " Sibling = ", Sibling("Delay6").Name,
Child("Delay7").Name), " two parents up = ",
Self.Parent.Parent.Name;
{ produces the name of the Activity, the name of Delay6, the name
of Delay7, and the name of the parent’s parent of the current
Process }
There are certain cases where it may be necessary to use object references as variables to gain further
control over what Attributes can be accessed or to provide some flexibility in an Expression. There
are basically two ways to use object references in variables: define local script variables of type
ANYOBJ, or define SIMPROCESS user-defined variables of type Object. Note that both of these
applications allow the variable to be setup as an array (just like any other variable type). Consider the
following examples:
{ this expression is placed in the Accept Entity event of an Activity
that has two local attributes defined - Attribute1 is a String
and Attribute2 is of type Object }
myobj : ANYOBJ;
myobjarray[5] : ANYOBJ;
myobj:=Self;
{ points to the Activity the script is in
}
myobjarray[0]:=Activity.Entity;
{ points to the current Entity in the Activity }
myobjarray[1]:= Sibling("Delay6");
SIMPROCESS User’s Manual
278
Example: Batching Entities Based on Weight
{ points to a sibling Activity called Delay6 }
myobjarray[2]:= Resource("myResource");
{ points to a Resource defined in the model }
Self.Attribute1:="hello dolly";
Self.Attribute2:=myobjarray[0];
{ points to the Activity.Entity object assigned to cell 0 of
myobjarray above }
Self.Attribute2:=myobjarray[1];
{ now points to the sibling Delay6 assiged above}
myobj.Attribute1:="hey mister";
{ replaces the value in attribute1 with the new string "hey mister"
since myobj also points to self - see above }
myobjarray[4]:=myobj.Entity.Type;
{points to the Entity type of the current Entity in the current
Activity }
myobjarry[5]:= myobj;
{ produces an error since myobjarray has only cells 0 - 4 defined
- the subscript is out of bounds ]
Type checking is done on the assignment of variables where possible. This is to prohibit assigning
basic type (REAL, INTEGER, STRING, etc.) variables to Object-type variables. Likewise, it precludes
assigning object references to basic types. The following lines in the same script above would produce
errors, and the simulation would terminate.
myobj := "hello dolly";
{produces an error because myobj is of type ANYOBJ and "hello dolly"
is of type String }
Self.Attribute1:=Entity;
{produces an error because Attribute1 is of type String and Entity
is of type object }
SIMPROCESS User’s Manual
279
Example: Batching Entities Based on Weight
Note (as seen in the examples above) that type checking is not done between object type variables.
For example, if an Entity object is assigned to a variable defined as an object, an Activity or Resource
object can be assigned to that same variable without causing any errors. However, the Expression may
not work properly if the variable should contain an Entity object reference and another object type
has been assigned to it.
There are a few special rules on object references. Self and Model object references can only be used
as the first reference in an Expression statement. Something like
myobj:=Self.Activity.Self;
results in an error, since Self can only appear as the first object reference qualifier for the statement.
SIMPROCESS User’s Manual
280
Getting and Freeing Resources Using Expressions
Getting and Freeing Resources Using Expressions
There are two system methods for getting and freeing Resources: GetResource and
FreeResource. “SIMPROCESS System Methods” on page 521 summarizes the methods. These
system methods provide the same basic capability as the Get Resource and Free Resource Activities.
(See “Get Resource and Free Resource Activities” on page 155.) The main difference is that with the
Get Resource system method, the Resource requested can be different for every Entity. The Get
Resource Activity assumes each Entity entering the Activity requires the same Resources. Thus, if
different Resources are needed, the Entity must be routed to a different Get Resource Activity that
requests those Resources. The demonstration model, H2O.spm, which is included in the
SIMPROCESS installation, compares the usual method of obtaining resources with the
GetResource system method. The model is described in Chapter 5 of the SIMPROCESS Getting
Started Manual.
GetResource
GetResource can be used in several Activities that can acquire Resources (Get Resource, Delay,
Branch, Transform, Gate, Synchronize, and Assign Activities). The Expression to get a Resource must
go in the Accept Entity Expression of the Activity. GetResource may not be used in an Entity, Entity
Type, or Resource Expression. The full command is
GetResource("Resource", "Units", "Tag");
The first parameter must be a String and is the Resource name. The second parameter can be a String,
Integer, or Real. This is the number of units of the Resource to acquire. By allowing the second
parameter to be a String, distributions can be used. The third parameter must be a String, but it is
optional. This parameter corresponds to the tag used in the Get Resource Activity. The tag defaults
to any tag! if the third parameter is omitted. If multiple GetResource system methods are used
at an Activity, the Resources are obtained based on the rule set in the Resource usage of that Activity.
The rules are Any One Member, All Members, Reserve As Available, and Number of Members. The default
is Any One Member. Therefore, if multiple GetResource system methods are used, only one of the
Resources will be acquired if the Resource acquisition rule has not been set to All Members. No
Resources have to be listed in the Resource usage dialog for the Resource acquisition rule to be set.
When requesting Resources on the Resources tab of Activity properties, a particular Resource can only
be added to the Requirements once. Thus, the selected acquisition rule always applies to different
Resources. However, since a GetResource system method is equivalent to a Resource listed under
Requirements, if two GetResource system methods in the same activity reference the same Resource
then each GetResource request is treated in the same manner as if each referenced different
Resources. For example, assume the following statements are in the Accept Entity expression of an
Activity.
SIMPROCESS User’s Manual
281
Getting and Freeing Resources Using Expressions
GetResource("Resource1", 1);
GetResource("Resource1", 1);
If the acquisition rule is Any One Member, then only one unit of Resource1 will be acquired since each
statement is considered a "Member". If All Members is selected, then two units of Resource1 will be
acquired. Note that if Resource1 only has one unit defined, then the above statements will generate
a runtime error if All Members or Reserve As Available (which requires all members) are selected.
FreeResource
FreeResource can be used in several Activities that can release Resources (Free Resource, Delay,
Branch, Transform, Gate, Synchronize, and Assign Activities). Just like GetResource,
FreeResource must be used in the Accept Entity Expression of the Activity, and FreeResource
may not be used in an Entity, Entity Type, or Resource Expression. Both of these methods must go
in the Accept Entity Expression because these methods set up the requests for the events to occur while
the Entity is processing in the Activity. Therefore, order within the Accept Entity Expression does not
matter. A FreeResource system method for a particular Resource can come before the
GetResource, since this is occurring when the Entity is being accepted into the Activity. However,
since these system methods operate like the Activities of the same name, the FreeResource for
a particular Resource can be in a different Activity from the GetResource for that Resource. If the
FreeResource is in a different Activity, the Resource will not be released until the Entity has
completed processing in that Activity, even though the FreeResource system method is in the
Accept Entity Expression. The full command is
FreeResource("Resource", "Tag", TRUE);
The first parameter must be a String. It is the name of the Resource to be released. The second parameter
must be a String as well. This is the tag of the Resource to be released. The third parameter is a Boolean
(thus only TRUE and FALSE are allowed). For consumable Resources, this determines whether the
Resource should be consumed. The third parameter is optional. If omitted, it defaults to TRUE
(meaning the Resource should be consumed). This parameter has no effect on non-consumable
Resources. The second parameter (tag) is also optional. However, if the second parameter is omitted,
the third parameter must also be omitted. The tag defaults to any tag! if the tag parameter is missing.
There are two keywords for this system method: AnyResource and AnyTag. These can be used
in the place of the Resource parameter and the tag parameter. So possible options are (without the last
parameter):
•
•
•
•
•
FreeResource("Resource1", "myTag");
FreeResource("Resource1", "AnyTag");
FreeResource("Resource1"); this operates the same as the previous
FreeResource("AnyResource", "myTag");
FreeResource("AnyResource", "AnyTag");
SIMPROCESS User’s Manual
282
Getting and Freeing Resources Using Expressions
•
FreeResource("AnyResource"); this operates the same as the previous
These are the same combinations that are available in the Free Resource Activity. The following
example shows getting and freeing a Resource at a typical Delay Activity.
GetResource("Sales Rep", 1);
FreeResource("Sales Rep");
Combining Get and Free Expressions With Activities
These system methods can be used with the Get Resource and Free Resource Activities. Any Resource
obtained with the GetResource system method can be released by a Free Resource Activity.
However, it is important to note that tags used in a GetResource system method will not be available
in a Free Resource Activity if those tags have not been used in a Get Resource Activity. Likewise,
any Resource obtained with a Get Resource Activity can be released with a FreeResource system
method.
SIMPROCESS User’s Manual
283
Creating Resources Using Expressions
Creating Resources Using Expressions
For most models, Resources are defined when the model is created using the Define/Resources menu
item. (See “Resource Modeling Constructs” on page 147.) This is done because the Resources that
are required by the model are known when the model is created. However, there are times when the
design of the model requires that the model be configured from an outside source (such as a database).
In this instance, the number of resources and their characteristics may not be known until runtime.
In this scenario, the model is typically run without the SIMPROCESS Graphical User Interface (GUI)
using the SIMPROCESS Dispatcher or other methods for running a model apart from the
SIMPROCESS GUI. (See “Running Models Without GUI” on page 599.) There are four system
methods for creating and configuring Resources: CreateResource, SetResourceCost,
SetResourceDowntime, and SetResourceExpression. “SIMPROCESS System
Methods” on page 521 summarizes the methods. SetResourceCost,
SetResourceDowntime, and SetResourceExpression can be used with Resources created
using CreateResource or with Resources defined when creating the model (Define/Resources).
These system methods are not intended for the novice user. The proper use of these system methods
requires indepth knowledge of simulation modeling and SIMPROCESS.
CreateResource
This statement creates a new Resource within a SIMPROCESS model. CreateResource can only
be used in the Start Run Expression (Define/Model Expressions). Resources cannot be created during
a trial or between replications. The full command is
CreateResource(Name:STRING, Units:REAL, Fractional:BOOLEAN,
Consumable:BOOLEAN, ResourceStats:BOOLEAN,
ResourceByActivityStats:BOOLEAN);
The first parameter is a String and must be a unique Resource name. The second parameter sets the
starting capacity of the Resource. The parameters Fractional, Consumable,
ResourceStats, and ResourceByActivityStats must be TRUE or FALSE. Fractional
Resource usage is allowed if the Fractional parameter is TRUE. The Resource will be consumed
when released if the Consumable parameter is TRUE. (Note that consumable Resources created with
CreateResource can only be replenished by using the IncreaseCapacity system method.)
Resources created at runtime will have statistics collected if Collect Resource Statisitics or Collect
Resource by Activity Statistics are selected on the Statistics Collection dialog (Report/Define Global
Statistics Collection, see “Default Performance Measures,” beginning on page 186). Statistics will also
be collected if ResourceStats and/or ResourceByActivityStats are set to TRUE.
For example, consider a scenario where the Resources for a model are stored in a database. The
following code (in the Start Run Expression) reads the database and creates the Resources. (RunId
SIMPROCESS User’s Manual
284
Creating Resources Using Expressions
and Database are Model Attributes which were previously initialized.)
sql : STRING;
name : STRING;
units : REAL;
sql := "Select Name, Units from Resource_Table where RunId=" +
INTTOSTR(Model.RunId);
ReadFromDatabase(Model.Database, "Set", sql);
WHILE GetNext("Set")
name := GetResult("Set", "Name");
units := GetResult("Set", "Units");
CreateResource(name, units, FALSE, FALSE, FALSE, FALSE);
END WHILE;
Once a Resource has been created, other characteristics can be set (Cost, Downtime, and Experssions).
Note that local Resource Attributes cannot be created through Expressions. However, global Resource
Attributes can be used by Resources created using CreateResource. Most likely, other global
Resource Attributes would be created to hold information about the Resource, such as ID or
Description. The value of these Attributes would be obtained from the external source.
SetResourceCost
SetResourceCost is used to set the value of a Resource cost. (See “Activity-Based Costing” on
page 176.) A nonconsumble Resource can have four types of cost, three of which are variable and one
that is fixed. A consumable Resource can have two types of cost, both of which are variable. This system
method is not limited to the Start Run Expression. It can be used at any point during a simulation run.
However, changes to cost values made during a run will not take effect until a new cost period begins.
The full command is
SetResourceCost(ResourceName:STRING, Cost:REAL, CostType:STRING,
TimeUnit:STRING);
ResourceName is the name of the Resource to which the Cost applies. The Cost must be greater
than or equal to zero. For a nonconsumable Resource, CostType can be PerEntity, PerUnit,
PerTimeUnit, or Fixed. CostType can only be PerEntity or PerUnit for a consumable
Resource. When the CostType is PerTimeUnit, the TimeUnit must be one of the valid
SIMPROCESS time units (Nanoseconds, Microseconds, Milliseconds, Seconds,
Minutes, Hours, Days, Weeks, Months, Years). When the CostType is Fixed, the
TimeUnit must be Weekly, Monthly, Quarterly, Half-Yearly, or Yearly. If the
CostType is PerEntity or PerUnit, then the TimeUnit parameter can be omitted. If included,
it is ignored.
SIMPROCESS User’s Manual
285
Creating Resources Using Expressions
The example below expands on the previous example. In this example, after the Resources are created,
the costs will be set. The example assumes that the CostTypes retrieved from the database are in the
proper format. If this were not the case other logic would be required. Also, the time unit is retrieved
for every cost type. However, as stated above, this field is ignored by SetResourceCost if it is
not needed.
sql : STRING;
name : STRING;
units : REAL;
cost : REAL;
costType : STRING;
timeUnit : STRING;
sql := "Select Name, Units from Resource_Table where RunId=" +
INTTOSTR(Model.RunId);
ReadFromDatabase(Model.Database, "Set", sql);
WHILE GetNext("Set")
name := GetResult("Set", "Name");
units := GetResult("Set", "Units");
CreateResource(name, units, FALSE, FALSE, FALSE, FALSE);
sql := Select Cost, CostType, TimeUnit from Cost_Table where
Resource=’" + name + "’";
ReadFromDatabase(Model.Database, "CostSet", sql);
WHILE GetNext("CostSet")
cost := GetResult("CostSet", "Cost");
costType := GetResult("CostSet", "CostType");
timeUnit := GetResult("CostSet", "TimeUnit");
SetResourceCost(name, cost, costType, timeUnit);
END WHILE;
END WHILE;
SetResourceDowntime
A globally defined Resource Downtime (see “Global Resource Downtime” on page 344) can be
applied to a Resource using the SetResourceDowntime command. As with CreateResource,
SetResourceDowntime can only be used in the Start Run Expression. The full command is
SetResourceDowntime(ResourceName:STRING, DowntimeName:STRING);
The ResourceName parameter is the name of the Resource to which the DowntimeName will
apply. Note that a global Downtime cannot be applied more than once to the same Resource.
SIMPROCESS User’s Manual
286
Creating Resources Using Expressions
The example below expands the previous example to include Downtime.
sql : STRING;
name : STRING;
units : REAL;
cost : REAL;
costType : STRING;
timeUnit : STRING;
downtimeType : INTEGER;
sql := "Select Name, Units from Resource_Table where RunId=" +
INTTOSTR(Model.RunId);
ReadFromDatabase(Model.Database, "Set", sql);
WHILE GetNext("Set")
name := GetResult("Set", "Name");
units := GetResult("Set", "Units");
CreateResource(name, units, FALSE, FALSE, FALSE, FALSE);
sql := Select Cost, CostType, TimeUnit from Cost_Table where
Resource=’" + name + "’";
ReadFromDatabase(Model.Database, "CostSet", sql);
WHILE GetNext("CostSet")
cost := GetResult("CostSet", "Cost");
costType := GetResult("CostSet", "CostType");
timeUnit := GetResult("CostSet", "TimeUnit");
SetResourceCost(name, cost, costType, timeUnit);
END WHILE;
sql := Select DowntimeType from Downtime_Table where Resource=’"
+ name + "’";
ReadFromDatabase(Model.Database, "DTSet", sql);
WHILE GetNext("DTSet")
downtimeType := GetResult("DTSet", "DowntimeType");
{DowntimeType of 0 indicates no downtime}
IF downtimeType = 1
SetResourceDowntime(name, "StandardShift");
ELSIF downtimeType = 2
SetResourceDowntime(name, "NightShift");
END IF;
END WHILE;
END WHILE;
SIMPROCESS User’s Manual
287
Creating Resources Using Expressions
SetResourceExpression
Expressions can be assigned to Resources created using CreateResource through the use of text
files. The SIMPROCESS Expression Language code must be in a text file (ASCII) that is located in
the model’s directory. The code should be created and validated in SIMPROCESS before being saved
to a file. The SetResourceExpression statement links a text file to a particular Resource
Expression. The full command is
SetResourceExpression(ResourceName:STRING, ExpressionType:STRING,
ExpressionFile:STRING);
The ResourceName specifies the Resource to use. The ExpressionType must be Start
Simulation, Start Trial, Get Resource, Free Resource, Start Downtime, End
Downtime, End Trial, or End Simulation. ExpressionType is case sensitive.
ExpressionFile is the complete name of the text file that contains the Expression code. No path
is needed since the file must reside in the model’s directory.
The example below expands the previous example to include Expressions. In this example, the
proportion of time that the Resource is fully used needs to be determined. A global Resource Attribute
named MaximumUse of type INTEGER has been defined. Time-weighted statistics were selected
for the Attribute. In getresource.txt is the following code
IF UnitsBusy = Capacity
MaximumUse := 1;
ELSE
MaximumUse := 0;
END IF;
The following code is in freeresource.txt
MaximumUse := 0;
These files are used in the code below.
sql : STRING;
name : STRING;
units : REAL;
cost : REAL;
costType : STRING;
timeUnit : STRING;
downtimeType : INTEGER;
sql := "Select Name, Units from Resource_Table where RunId=" +
INTTOSTR(Model.RunId);
ReadFromDatabase(Model.Database, "Set", sql);
SIMPROCESS User’s Manual
288
Creating Resources Using Expressions
WHILE GetNext("Set")
name := GetResult("Set", "Name");
units := GetResult("Set", "Units");
CreateResource(name, units, FALSE, FALSE, FALSE, FALSE);
sql := Select Cost, CostType, TimeUnit from Cost_Table where
Resource=’" + name + "’";
ReadFromDatabase(Model.Database, "CostSet", sql);
WHILE GetNext("CostSet")
cost := GetResult("CostSet", "Cost");
costType := GetResult("CostSet", "CostType");
timeUnit := GetResult("CostSet", "TimeUnit");
SetResourceCost(name, cost, costType, timeUnit);
END WHILE;
sql := Select DowntimeType from Downtime_Table where Resource=’"
+ name + "’";
ReadFromDatabase(Model.Database, "DTSet", sql);
WHILE GetNext("DTSet")
downtimeType := GetResult("DTSet", "DowntimeType");
{DowntimeType of 0 indicates no downtime}
IF downtimeType = 1
SetResourceDowntime(name, "StandardShift");
ELSIF downtimeType = 2
SetResourceDowntime(name, "NightShift");
END IF;
END WHILE;
SetResourceExpression(name, "Get Resource", "getresource.txt");
SetResourceExpression(name, "Free Resource",
"freeresource.txt");
END WHILE;
Resource Usage
Since the Resources required for the model are not defined when the model is created, it is impossible
to assign Resource usage on an Activity’s Resources tab. Thus, the GetResource and
FreeResource system methods must be used (page 281). The modeler must know which Activities
will require Resources, but the modeler does not have to know which Resources will be required or
the quantity of the Resources that will be required. For example the Accept Entity expression of the
Activity could contain
SIMPROCESS User’s Manual
289
Creating Resources Using Expressions
GetResource(Entity.ResName, Entity.ResQuantity);
FreeResource(Entity.ResName);
where ResName is a STRING Entity Attribute containing the name of the Resource, and
ResQuantity is a REAL or INTEGER Entity Attribute containing the number of units required.
Most likely, the values of these Attributes would be set by an outside source.
SIMPROCESS User’s Manual
290
Changing Resource Capacity With Expressions
Changing Resource Capacity With Expressions
IncreaseCapacity and DecreaseCapacity are system methods that will change the capacity
of a Resource during a simulation run. “SIMPROCESS System Methods” on page 521 summarizes
the methods. The methods apply to all Resources, whether consumable or not. Thus,
IncreaseCapacity could be used to replenish a consumable Resource (however, the replenish
to capacity option is not available). Just as with consumable Resources, the statistics for a Resource
will reflect increases or decreases in capacity.
IncreaseCapacity
IncreaseCapacity can go in any type of Expression. When executed, it immediately increases
the number of units of the Resources. The command is:
IncreaseCapacity("Resource1", 2);
The first parameter must be a String. It is the name of the Resource to increase. The second parameter
must be an Integer or a Real. Even though the second parameter can be a Real, the number of units
to increase cannot be fractional (even if the Resource is a fractional Resource).
DecreaseCapacity
Just like IncreaseCapacity, DecreaseCapacity can go in any type of Expression. When
executed, it decreases the capacity of the Resource as units of the Resource become available. If the
number of units to decrease are less than the number of units idle, then the decrease happens
immediately. If not, then the capacity units are decreased as units go to idle. Note that if the request
for decrease is larger than the current capacity, SIMPROCESS will reduce the capacity to zero.
However, SIMPROCESS will keep track of the number of units not yet decreased. For example, if
Resource1 has a capacity of 3, and the capacity is decreased by 4, then the capacity of Resource1 is
zero. Then, if the capacity of Resource1 is increased by one, the capacity of Resource1 will still be
zero. This is because there was one unit of decrease still not applied to Resource1. The full command is
DecreaseCapacity("Resource1", 2);
The first parameter must be a String. It is the name of the Resource to decrease. The second parameter
must be an Integer or a Real. Even though the second parameter can be a Real, the number of units
to decrease cannot be fractional (even if the Resource is a fractional Resource).
DecreaseCapacity is not a substitute for the consuming of consumable Resources. Consumable
Resources will be consumed when released. It is not necessary to use a system method.
DecreaseCapacity is intended for non-consumable Resources.
SIMPROCESS User’s Manual
291
Setting Maximum Resource Wait With Expressions
Setting Maximum Resource Wait With Expressions
The Resources tab of Activity properties dialogs allows a maximum wait time to be set (see “Adding
Resource Requirements to Activities” on page 152). The maximum wait time is the maximum amount
of time that an Entity will wait for the requested Resources to be acquired. The same thing can be
accomplished using the Entity System Attribute MaxWait (see “System Attributes” on page 512).
If the value for MaxWait is greater than zero, then the Entity will exit the Activity without processing
if Resources have not been acquired by that time. Note that the time unit that applies to MaxWait
is the Simulation Time Unit specified in the Run Settings (see “Run Settings” on page 109). If greater
than zero, the MaxWait System Attribute overrides the Value set in the Maximum Wait for Resource
Time section of the Resources tab of the Activity properties dialog. MaxWait must be set in the Accept
Entity Expression. For example putting
Entity.MaxWait := .25;
in the Accept Entity Expression means that the Entity will wait at most .25 time units (if the Simulation
Time Unit is Hours, then .25 represents .25 hours). The value for MaxWait must be reset to zero when
a maximum wait for Resources is no longer needed. MaxWait is not reset automatically. It is best
to set MaxWait to zero in the Release Entity Expression of the Activity where MaxWait was used.
Entity.MaxWait := 0.0;
When an Entity exits an Activity without processing, the Entity System Attribute EndWait is set to
TRUE. Thus, EndWait can be checked to determine whether an Entity exited an Activity without
processing and the Entity can be routed appropriately. Important: As with MaxWait, EndWait is
not automatically reset to FALSE. This must be done in an Expression once the current value of
EndWait is no longer needed for Entity routing.
Entity.EndWait := FALSE;
For Activities that collect statistics, Entity Counts for Entities that exit without processing are displayed
in the Total Not Processed category of the Activity Entity Count statistics (page 196) in the
Standard Report (page 186).
SIMPROCESS User’s Manual
292
User-Defined Functions
User-Defined Functions
A User-defined Function will return the value of an Expression each time it is called from within
the model. This allows re-use of a single function in multiple places in the model. The value returned
must be a real number.
To create a User-defined Function, go to the Define menu, and select Functions. This opens a list box
displaying any previously defined Functions. The Expression Editor dialog opens for Add, Edit, and
Copy. The Name of the function must be unique across all Functions, Standard distributions, Tabular
distributions, and Auto Fits distributions. (See “User Defined Distributions,” beginning on page 98
for information on defining Standard, Tabular, or Auto Fits distributions.)
The final line of the Expression should be a RETURN statement such as:
RETURN (Entity.Time * Activity.Factor);
where Entity.Time and Activity.Factor are Attributes. Each time this Function is called,
it will return the value of the multiple of the two Attributes. Note that only REAL or INTEGER values
can be returned. Also, the value received by the caller is always a REAL even if an INTEGER value
followed the RETURN.
The Name entered for the User-defined Function will appear in every combo box in the model where
a statistical distribution can be entered. Also, User-defined Functions can be used in Expressions by
using the Function system method. See “SIMPROCESS System Methods” on page 521.
The text of a Function can be stored in an external file. See “Expression Editor,” beginning on page 259
for a discussion of that option.
SIMPROCESS User’s Manual
293
Dynamic Labels
Dynamic Labels
There are two types of background text in SIMPROCESS: static text and dynamic labels. Static text
is used for annotating the model layout and does not change during simulation. Dynamic labels, as
their name implies, are updated during simulation and are used to display information about changing
properties of model elements. One way to update dynamic labels is through an
UpdateDynamicLabel method in the Expression builder. (See “Background Text” on page 163
for a discussion of the other way to update dynamic labels.)
To update a dynamic label using Expressions, the dynamic label must have a unique combination of
Usually, Id number will be 0, unless two dynamic labels have the same Name.
The name typed into the Name text box will not appear on the layout. It will only be used to reference
the label from the Expression builder. The type of value with which the dynamic label will be updated
must also be selected. The choice between String, Integer, and Real is made in the Mode combo box.
If the value of the dynamic label is Real, Width and Precision must be specified in the corresponding
value boxes. Width is the total number of digits that will be shown for the displayed value (including
the decimal point), while Precision specifies the number of digits after the decimal point that will be
displayed. If the Width is greater than the value being displayed, it will be padded with spaces on the
left side. If the Mode is Integer, then only the Width field needs to be set.
Name and Id number.
Note that the Value field does not have to be empty to use UpdateDynamicLabel. The same
dynamic label can be updated automatically and with UpdateDynamicLabel.
SIMPROCESS User’s Manual
294
Dynamic Labels
Once the dynamic label is defined, it can be updated by making a function call to the
UpdateDynamicLabel method in the Expression builder. This method requires the following five
arguments in this order:
MasterEditor — (typed as shown), reference to the main layout window.
name — a string (in quotes) used to designate the dynamic label in the Name text box of
dialog. Make sure letter case is the same in both places.
Background Text
ID number — the integer in the Id box of the Background Text dialog.
text color — a string (in quotes) of the color in which the text is to appear. A list of
color names is found in “SIMPROCESS System Attributes and Methods,” beginning on
page 511. As with name, letter case must be as shown in the table. This overrides the font
color selected in the properties dialog.
value — integer, real, or string value to display; type must correspond to what was selected
in the Mode combo box of the Background Text dialog.
For example, to display a string showing the name of the Entity leaving a delay Activity, as well as
a real value showing the amount of time this instance of an Entity spent at the Activity, and an integer
showing number of Entities currently at that Activity, enter the following three commands in the
Expression builder of the delay Activity at the Release Entity entry point:
UpdateDynamicLabel
(MasterEditor,"num",0,"Orange",
NumberIn);
UpdateDynamicLabel(MasterEditor,"name",0,
"Aquamarine",Entity.Name);
UpdateDynamicLabel(MasterEditor,
"lastdelay",0,"IndianRed",LastDelay);
For more information on Expression builder terminology and syntax, see “SIMPROCESS System
Attributes and Methods,” beginning on page 511.
Note that both dynamic and static text font Attributes can be changed during simulation by selecting
the text and editing its properties. The change will take effect immediately after the Background Text
dialog is closed and the simulation is resumed.
SIMPROCESS User’s Manual
295
Interfacing With A Database
Interfacing With A Database
Expressions can retrieve information from an SQL database, and can modify an SQL database by
inserting into tables, deleting from tables, and updating tables. Knowledge of SQL is required since
all queries to the database are SQL queries. A sample model named DatabaseDemo.spm is part
of the ExpressionDemos directory.
Setting Up Database Using Windows and Open Database Connectivity
(ODBC)
When using Windows, the database must have a Data Source Name (DSN) specified in ODBC before
SIMPROCESS can communicate with a database. Chapter 2 of the Getting Started Manual has detailed
instructions on creating a DSN for the database that comes with SIMPROCESS. A similar procedure
is followed for every database that is to communicate with SIMPROCESS in this way. However,
instead of using the DSN SimProcessDatabase (which is for the database that comes with
SIMPROCESS), another must be created. (Note, the OpenDatabase command on page 298 contains
information on how to set up database connections for non-Windows systems.)
To create the DSN:
1.
2.
3.
Open the ODBC control panel (on Windows 2000 and XP it is under the Administrative Tools
control panel).
Select the User DSN tab and click on Add.
Select the appropriate driver for the database (for example, Microsoft Access Driver) and click
Finish.
Clicking Finish brings up a dialog where the DSN is entered. The example below shows a DSN called
MyDatabase.
SIMPROCESS User’s Manual
296
Interfacing With A Database
Once a DSN has been entered, click the Select button. Browse to the location of the database, and,
when found, click OK. The database will appear above the Select button.
Continue to click OK until ODBC is closed. The DSN created will be used by SIMPROCESS to
communicate with the selected database. A unique DSN is required for every database that will
interface with SIMPROCESS.
SIMPROCESS User’s Manual
297
Interfacing With A Database
Database System Methods
There are six database-related System Methods which can be used in Expressions. (See
“SIMPROCESS System Methods” on page 521.)
•
•
•
•
•
•
OpenDatabase
CloseDatabase
ReadFromDatabase
WriteToDatabase
GetNext
GetResult
OpenDatabase
OpenDatabase is used to create a connection between SIMPROCESS and a database. This must
be done before any other database System Methods are used (the Start Run Expression is a good place
to use it). Before using the method an Attribute must be defined (normally a Model Attribute) of type
Object. (See “User Defined Attributes” on page 242.) This Attribute will be used as a reference to the
database connection. The syntax for Windows with ODBC is
Model.ObjectAttribute := OpenDatabase("DSN", "UserName",
"Password");
where DSN is the DSN created in ODBC. UserName and Password are optional. These are only
required if the database requires them for access.
Alternatively, a database properties file can be used. This file should be similar in content to the
sProcDB.properties file in the SPUser directory. This file is used to connect SIMPROCESS
to the database that comes with SIMPROCESS. (Note, do not modify sProcDB.properties.
Copy the file before making changes.) A database properties file must be used when not using Windows
and ODBC; however, a database properties file can be used with Windows and ODBC instead of the
above procedure. Below is the contents of sProcDB.properties.
jdbc.drivers=sun.jdbc.odbc.JdbcOdbcDriver
jdbc.url=jdbc:odbc:SimProcessDatabase
jdbc.username=""
jdbc.password=""
Simply change each of the properties to reflect the protocols needed for the system. If using a database
properties file with Windows and ODBC, the properties are the same except the end of the url property
is the DSN set up in ODBC. When using a database properties file the syntax is:
SIMPROCESS User’s Manual
298
Interfacing With A Database
Model.ObjectAttribute := OpenDatabase("PropertiesFileName");
where PropertiesFileName is the name of the database properties file. The preferred locations for
a properties file are the model’s directory or the SPUser directory. If not in one of those two
locations, the PropertiesFileName must include the complete path to where it can be found.
If the connection is successful, the Attribute will contain a reference to the connection. Note that the
connection is only valid for the model that created the connection. If another model needs to use the
same database, that model must create its own connection.
CloseDatabase
CloseDatabase is used to close a connection to a database. This normally occurs at the end of a
simulation (End Simulation or End Run Expression). The syntax is
CloseDatabase(Model.ObjectAttribute);
The only parameter is the Object Attribute that was used in the OpenDatabase system method
that created the connection.
ReadFromDatabase
ReadFromDatabase gets information from a database and places the information into a Result Set.
GetNext and GetResult are used to assign the data from a Result Set to Attributes or local variables
in the model. The syntax is
ReadFromDatabase(Model.ObjectAttribute, "ResultSetName",
"SQLQuery");
Model.ObjectAttribute is the Object Attribute that was used in the OpenDatabase
system method that created the connection. ResultSetName is a unique string identifier for
the Result Set created by the query. SQLQuery is a string and is the query that creates the Result
Set. Normally the query would start with the SELECT command.
WriteToDatabase
WriteToDatabase is used to modify the tables of the database. Nothing is returned. The syntax is
WriteToDatabase(Model.ObjectAttribute, "SQLQuery");
Model.ObjectAttribute is the Object Attribute that was used in the OpenDatabase
system method that created the connection. SQLQuery is a string and is the query that modifies
the tables of the database. This query can start with INSERT, UPDATE, or DELETE.
Note that WriteToDatabase can slow the simulation as table sizes increase. Also, be careful when
SIMPROCESS User’s Manual
299
Interfacing With A Database
using WriteToDatabase if there is the possibility the simulation will be stopped early by user
intervention. Updates to the database can lag behind the simulation. Thus, if the simulation is stopped
early there is the potential that the CloseDatabase command would be executed before all the
WriteToDatabase commands have finished. The consequence would be an error that could
possibly crash SIMPROCESS. Omit the CloseDatabase command if this scenario might occur.
If the CloseDatabase command is omitted, SIMPROCESS will not release the database until
SIMPROCESS is closed.
GetNext
GetNext controls the position within a Result Set. Result Sets are simply tables of data. The columns
are the fields requested in the SQL query. For instance, if the query was "SELECT CallTime,
WrapUpTime FROM Times" the columns in the Result Set would be CallTime and WrapUpTime.
GetNext sets the row of the Result Set. So GetNext is used in conjunction with GetResult.
GetResult gets a value from the table (Result Set) once the row has been set. When a Result Set
is first created by a ReadFromDatabase, the row pointer in a Result Set is pointing to before the
first row. Thus, GetNext must be called before GetResult. The syntax is
BooleanVar := GetNext("ResultSetName");
BooleanVar is any Attribute or local variable defined to be a BOOLEAN. TRUE is returned
if the next row exists, FALSE if not (at the end). ResultSetName is the user selected name
given to a Result Set by a ReadFromDatabase.
Note that GetNext only moves forward through the rows. Going backwards is not possible. The only
way to go back to the beginning of a Result Set is to execute again the ReadFromDatabase that
created the Result Set.
GetResult
GetResult assigns a value from a Result Set to an Attribute or local variable in the model. The value
comes from the current row of the Result Set. The current row is set by GetNext. The syntax is
Variable := GetResult("ResultSetName", "Field");
Variable can be an Attribute or a local variable. ResultSetName is the user-selected name
given to a Result Set by a ReadFromDatabase. Field is the field from the database (column
of the Result Set) that has the desired value.
The type of the value returned (INTEGER, REAL, BOOLEAN, or STRING) to Variable must
match with the type of the Variable. Note that only INTEGER, REAL, BOOLEAN, and STRING
values can be placed in a Result Set.
SIMPROCESS User’s Manual
300
Interfacing With A Database
Database Example
The following are several examples on how to use the database System Methods. They are categorized
by Expression type.
Start Simulation Example
This example assumes two real Model Attributes (CallTime and WrapUpTime) have been defined.
Each of the Model Attributes have an array size that is equal to or larger than the number of values
returned by the query. The values are placed in array Model Attributes because the values need to be
referenced throughout the simulation. Also an object Model Attribute (DatabaseConn) was defined
for the connection. Note that in the SQL query double quotes are required around the table name Times
Table (for MS Access). Double quotes can be placed in strings by using \".
SQLString : STRING;
count : INTEGER;
Model.DatabaseConn := OpenDatabase("MyDatabase");
SQLString := "SELECT CallTime, WrapUpTime FROM \"Times Table\"
WHERE Month = 12";
ReadFromDatabase(Model.DatabaseConn, "Times", SQLString);
count := 0;
WHILE GetNext("Times")
Model.CallTime[count] := GetResult("Times", "CallTime");
Model.WrapUpTime[count] := GetResult("Times", "WrapUpTime");
count := count + 1;
END WHILE;
End Simulation Example
This example just shows closing a connection.
CloseDatabase(Model.DatabaseConn);
Accept Entity Example
In this example an Entity enters an Activity and gets its delay time from the database. This assumes
the WHILE loop in the Start Simulation example was not performed.
SQLQuery : STRING;
IF GetNext("Times")
Entity.Delaytime := GetResult("Times", "CallTime");
ELSE {will read again to start over if no more times are found}
SQLQuery := "SELECT CallTime, WrapUpTime FROM \"Times Table\"
WHERE Month = 12";
SIMPROCESS User’s Manual
301
Interfacing With A Database
ReadFromDatabase(Model.DatabaseConn, "Times", SQLQuery);
IF GetNext("Times")
Entity.Delaytime := GetResult("Times", "CallTime");
END IF;
END IF;
Release Entity Example
This example shows writing to a database. The processing time of the Entity for the Process is placed
in the database in a table named ProcessTimes. The simulation time the Entity entered the Process
was stored in an Entity instance Attribute called StartTime.
SQLString : STRING;
time : REAL;
time := SimTime - Entity.StartTime;
SQLString := "INSERT Into ProcessTimes (ProcessTime) VALUES (" +
REALTOSTR(time) + ")";
WriteToDatabase(Model.DatabaseConn, SQLString);
SIMPROCESS User’s Manual
302
Interfacing With A Spreadsheet
Interfacing With A Spreadsheet
Expressions can retrieve information from an Excel compatible spreadsheet, and can modify a
spreadsheet by inserting new Worksheets, values, and formulas. A sample model named
SpreadsheetDemo.spm is part of the ExpressionDemos directory.
Spreadsheet System Methods
There are four spreadsheet-related System Methods which can be used in Expressions. (See
“SIMPROCESS System Methods” on page 521.)
•
•
•
•
OpenSpreadsheet
CloseSpreadsheet
ReadFromSpreadsheet
WriteToSpreadsheet
OpenSpreadsheet
OpenSpreadsheet is used to create a connection between SIMPROCESS and an Excel compatible
spreadsheet file. This must be done before any other spreadsheet-related System Methods are used
(the Start Run Expression is a good place to use it). Before using the method an Attribute must be defined
(normally a Model Attribute) of type Object. (See “User Defined Attributes” on page 242.) This
Attribute will be used as a reference to the spreadsheet. The syntax is
Model.ObjectAttribute := OpenSpreadsheet("Mode", "FileName");
where Mode is either Input or Output. A spreadsheet file cannot be open for both reading and
writing at the same time. If FileName does not contain a path (the preferred method), the file’s
location will be the model’s directory. If the Mode is Input, the file must already exist.
Two different file types are supported: Workbook files (which usually have the .xls extension) and
Excel XML Spreadsheet files (which usually have the .xml extension). SIMPROCESS can only read
from or write to Workbook files compatible with Excel 97 through Excel 2002. If the Workbook file
was created with Excel 2003 or later, the Workbook must be saved as an XML Spreadsheet in order
to read from or write to it from SIMPROCESS. When a spreadsheet is opened for Output and the
file does not already exist, SIMPROCESS will create a Workbook file that is compatible with any of
the latest versions of Excel. Also, the Workbook file is compatible with the Calc spreadsheet program
in OpenOffice 1.1 (www.openoffice.org), widely used with Linux and other platforms. If a spreadsheet
file opened for Output already exists and is an XML Spreadsheet, SIMPROCESS will retain that
format.
SIMPROCESS User’s Manual
303
Interfacing With A Spreadsheet
CloseSpreadsheet
CloseSpreadsheet is used to close a spreadsheet file. (If opened for Output, the file’s contents
will be written at this time.) This normally occurs at the end of a simulation (End Simulation or End
Run Expression). The syntax is
CloseSpreadsheet(Model.ObjectAttribute);
The only parameter is the Object Attribute that was used in the OpenSpreadsheet system
method that created the connection.
ReadFromSpreadsheet
ReadFromSpreadsheet gets information from a spreadsheet and places the information into a
local variable or Attribute. The syntax is
ReadFromSpreadsheet(Model.ObjectAttribute, "Worksheet", Row,
Column, Variable);
Model.ObjectAttribute is the Object Attribute that was used in the OpenSpreadsheet
system method that created the connection. Worksheet is a string identifying the specific
worksheet. Row and Column are INTEGER values that identify a particular cell of the
Worksheet and both must be greater than or equal to one. Variable represents a local variable
or an Attribute that will receive the value read from the spreadsheet. The Variable type
(INTEGER, REAL, STRING, or BOOLEAN) must match the type of the value returned.
A run-time error will occur if the specified Worksheet does not exist, or if a cell at the specified Row
and Column does not exist (a cell which contains no data is not considered to exist). Also, if the
spreadsheet is a Workbook, a run-time error will occur if the requested cell contains a formula. In an
XML Spreadsheet, the value calculated by the formula will be returned if it already exists in the file;
if not, a run-time error will result.
WriteToSpreadsheet
WriteToSpreadsheet is used to modify a spreadsheet. Nothing is returned. The syntax is
WriteToSpreadsheet(Model.ObjectAttribute, "Worksheet", Row,
Column, Value);
Model.ObjectAttribute is the Object Attribute that was used in the OpenSpreadsheet
system method. Worksheet is a string identifying the specific worksheet. Row and Column
are INTEGER values that specify the particular cell of the Worksheet and both must be greater
than or equal to one. Value is the value to be written to the specified cell. Value can have the
type INTEGER, REAL, STRING, or BOOLEAN. If the requested Worksheet and/or cell do not
exist, SIMPROCESS will create them. Formulas can be written to a spreadsheet. For
SIMPROCESS User’s Manual
304
Interfacing With A Spreadsheet
SIMPROCESS to recognize a formula, the Value parameter must be a STRING and must begin
with "=" (e.g., "=SUM(A1:A20)"). Note that formulas written by SIMPROCESS will not
produce a value in the cell until the spreadsheet has been opened in Excel or another compatible
spreadsheet program.
Read and Write Cell References
Spreadsheet cell references in ReadFromSpreadsheet and WriteToSpreadsheet are based
on Row and Column numbers. Thus when referring to a column, its alphabetic designation (e.g., the
A in A1) must be changed to a numeric value, so that A becomes 1, B becomes 2, C becomes 3, and
so on. Also, the A1 format is Column, Row, whereas ReadFromSpreadsheet and
WriteToSpreadsheet use Row, Column.
Formula Cell References
As mentioned earlier, WriteToSpreadsheet can write formulas to a spreadsheet. There are two
methods of referring to cells in formulas. The method used to construct formula strings in
SIMPROCESS depends on whether the file being written to is a Workbook or an XML Spreadsheet.
In a Workbook, a Row value of 1 and Column value of 1 refers to the cell known as A1 if editing
in Excel or a compatible program. To write numeric data into cells A1 through A25 of a Workbook,
the WriteToSpreadsheet statements must refer to rows 1 through 25 and column 1. But cell
references in a formula used in the WriteToSpreadsheet statement for a Workbook take the same
form as that used in Excel. So to write a formula in cell A27 containing the sum of cells A1 through
A25, the necessary WriteToSpreadsheet statement would look similar to this:
WriteToSpreadsheet(Model.ObjectAttribute, "Worksheet", 27, 1,
"=SUM(A1:A25)");
When the resulting Workbook is opened in Excel, the formula bar would show the formula above in
cell A27, and the cell itself would display the resulting numeric sum.
This type of cell reference is considered relative to the cell into which the formula is placed. Absolute
cell references require the use of the $ symbol, as in =SUM($A$1:$A$25). The reasons for choosing
absolute or relative cell references in Workbooks are beyond the scope of this manual, though either
may certainly be used. As a reminder, ReadFromSpreadsheet cannot read from a cell containing
a formula in a Workbook file and will produce a run-time error.
When writing to XML Spreadsheets, the Row and Column numbers must still be used in the formula
strings. The WriteToSpreadsheet statement for placing this same =SUM(A1:A25)formula into
row 27 and column 1 now becomes something similar to this:
SIMPROCESS User’s Manual
305
Interfacing With A Spreadsheet
WriteToSpreadsheet(Model.ObjectAttribute, "Worksheet", 27, 1,
"=SUM(R[-26]C:R[-2]C)");
The R[-26]C portion refers to a cell that is 26 rows above the one in which the formula appears. That
is, its location is relative to that cell (at row 27, in the above example) and its row number can be
discovered by adding the bracketed value [-26]to that row number, thus resulting in a row number
of 1. The C portion refers to a column and is also an offset computed against the column number of
the cell into which the formula is being written. An offset value of zero is usually omitted, but the column
offset in this formula could also be written as C[0]. It is therefore possible to refer to any row and
column by using appropriate offset values. And since this form is relative, the addition of rows and
columns to the worksheet would cause the result of the formula’s calculation to change.
As with the earlier Workbook formula example, the colon character indicates a range. The cell at the
opposite end of the range is identified in the same manner as the first. In this example, the ending cell’s
row is the formula’s row (27) added to the offset value (-2), or 25. The column number, just as with
the previous reference, is the same as that of the formula (since an offset of zero is omitted).
If the resulting XML spreadsheet containing this formula were then opened in Excel, the formula bar
would show the same thing for cell A27 as in the Workbook file: =SUM(A1:A25). And the cell would
display the same numeric result as the Workbook (assuming that both had the same values written into
the cells being summed).
Absolute cell references are much easier to determine than the relative form when writing to XML
spreadsheet files. A formula such as =SUM(R1C1:R25C1)uses absolute row and column number
references, so that it too represents a formula that sums rows 1 through 25 of column 1. The key
difference in this format is the lack of bracketed numbers, so that the values are absolute row or column
number references rather than offset values based on the formula’s cell location. Since absolute row
and column numbers must be used here, each must have a value of one or greater.
As a reminder, when using ReadFromSpreadsheet to read a cell containing a formula from an
XML spreadsheet, its value will be returned if present. However, when a formula is written as described
above using WriteToSpreadsheet, the cell’s new value will not be calculated until Excel or a
compatible spreadsheet program opens the file, recalculates the formula result, and then saves the file
to XML format with this new value in place. Any attempt to reopen the XML spreadsheet file for input
and read from the cell before that has occurred would result in a run-time error.
Additional Spreadsheet XML Information
Much more information on the format of XML spreadsheets, formally known as SpreadsheetML
(Spreadsheet Markup Language), is available from Microsoft. Among the complex topics discussed
in that documentation are matters such as XML namespace usage and the additional capabilities of
this file format. While it is possible to construct and manipulate these files using any tool that is fully
SIMPROCESS User’s Manual
306
Interfacing With A Spreadsheet
cognizant of the SpreadsheetML format and rules, there are some necessary limitations in what
SIMPROCESS is able to handle. Some of these are listed below.
•
When horizontal cell merging is used, the ReadFromSpreadsheet statement should
correctly recognize this fact and locate a requested cell, if present. However, ReadFromSpreadsheet will not recognize vertically merged cells (i.e., those merged across multiple rows), and WriteToSpreadsheet will not respect any merging of cells. Excel or
a compatible program may be unable to read the resulting XML file.
•
Protection of any kind is not recognized. Using WriteToSpreadsheet will cause new
worksheets or cells to be created if not present, regardless of any protection settings.
•
•
Array formulas are not supported.
Styles cannot be manipulated directly in SIMPROCESS. However, with the exception of
those relating to protection, any styles already present in an existing XML spreadsheet file
should not be affected by writing to the file using WriteToSpreadsheet.
•
SIMPROCESS may have difficulty with any XML spreadsheet file that uses namespace
prefixes in a way that differs from what appears in Microsoft’s publicly available SpreadsheetML schema. The schema does not use prefixes on any of the elements of its XML.
And it uses a small set of prefixes in a consistent manner on the attributes found on XML
elements. XML which uses namespace prefixes on elements and uses different prefixes
than those seen in the schema is perfectly valid, provided it is compliant with the schema.
But upon opening any XML spreadsheet, Excel changes its namespace usage to match the
form seen in the SpreadsheetML schema. That form is the only one SIMPROCESS currently supports. Therefore, the safest thing to do before allowing ReadFromSpreadsheet and WriteToSpreadsheet to operate on an XML spreadsheet file (if it may
have been manipulated by any other program) is to open it in Excel and save it again. This
usually has the additional side effect of recalculating any formulas present.
•
The SpreadsheetML schema is complex and likely to continue evolving in the future.
There may be other features which will not function correctly with SIMPROCESS.
SIMPROCESS User’s Manual
307
Accessing Statistics During Simulation
Accessing Statistics During Simulation
There are times when it is useful to obtain the value of statistics during a simulation. For example,
the value of certain statistics can be used to alter simulation flow, values can be placed into a userdefined database, or statistical values can be used in optimization. Any statistic collected during the
simulation run can be accessed. This is done using various System Methods. (See “SIMPROCESS
System Methods” on page 521.) There are nine System Methods for accessing statistics:
•
•
•
•
•
•
•
•
•
GetActivityStatistic
GetActivityByEntityStatistic
GetAttributeStatistic
GetCostStatistic
GetEntityStatistic
GetResourceStatistic
GetResourceByActivityStatistic
GetTimeStampStatistic
GetTotalCostStatistic
The value of the statistic can be obtained for a specific replication, or the average or sum of replications
can be obtained. The value of a specific replication can only be obtained if that replication has been
run or is in the process of running. For example, the value for replication 2 is not available if replication
1 is the replication currently running. Also, the average and sum of replications are not available if
only one replication is run. A value of -1 returns the average of replications, and a value of -2 returns
the sum of replications.
GetActivityStatistic
GetActivityStatistic returns the value of a statistic for an Activity that has Collect Activity
Statistics selected either globally or on the Activity properties. (See “Default Performance Measures”
on page 186.) The syntax is
GetActivityStatistic("Activity Name", "Statistic", "Value Type",
Replication);
where Activity Name is the name of the Activity or Process, and Statistic is the statistic type
desired. The key words for the statistics available are found in Appendix G. (See “Statistic
Types” on page 586.) Value Type can be "Avg", "StDev", "Min", "Max", "Count", or
"RunLength". Replication is the replication desired or the average or sum of replications.
Some examples:
SIMPROCESS User’s Manual
308
Accessing Statistics During Simulation
GetActivityStatistic("Process4", "tokenlevel", "Avg", 1) returns the
average number of Entities in Process4 for replication 1.
GetActivityStatistic("Process4", "tokendelay", "Max", 1) returns the
maximum Entity cycle time for Process4 for replication 1.
GetActivityStatistic("Sales", "tokenwaitdelay", "Avg", -1) returns the
average across replications of the Entity wait for Resources in the Activity "Sales".
GetActivityByEntityStatistics
GetActivityByEntityStatistic returns the value of a statistic for an Activity and that has
Collect Activity By Entity Statistics selected either globally or on the Activity properties. (See “Default
Performance Measures” on page 186.) The syntax is:
GetActivityByEntityStatistic("Activity Name", "Entity Name",
"Statistic", "Value Type", Replication);
where Activity Name is the name of the Activity or Process, Entity Name is the name of the
Entity, and Statistic is the statistic type desired. The key words for the statistics available are
found in Appendix G. (See “Statistic Types” on page 586.) All the statistic types for Activity
by Entity statistics start with "by". Value Type can be "Avg", "StDev", "Min", "Max", "Count",
or "RunLength". Replication is the replication desired or the average or sum of replications.
Some examples:
GetActivityByEntityStatistic("Process4", "Sales Calls",
"bytoken.delay", "Avg", -1) returns the average cycle time across replications of the Entity
"Sales Calls" in the Process "Process4".
GetActivityByEntityStatistic("Process4", "Sales Calls",
"bytokenin", "Max", 2) returns the number of "Sales Calls" Entities that entered the Process
"Process4" in replication 2. Although other Value Types are available, the maximum value is the value
of interest since the number of Entities entering are just counted.
GetAttributeStatistic
GetAttributeStatistic returns the value of an Attribute that is being monitored for statistics.
On the Attribute properties either Observation Based or Time-Weighted must be selected for Statistics
Types, and at least one of the Report Requests must be selected. (See “Globally Defining an Attribute
from the Menu” on page 243.) The value returned will be based on the Statistic Type selected on the
Attribute properties (Observation Based or Time-Weighted). The Attribute name must be unique among
SIMPROCESS User’s Manual
309
Accessing Statistics During Simulation
the user-defined Attributes that are being statistically monitored. The syntax is:
GetAttributeStatistic("Attribute Name", "Value Type", Replication);
where Attribute Name is the name of the Attribute. Value Type can be "Avg", "StDev", "Min",
"Max", "Count", or "RunLength". Replication is the replication desired or the average or sum
of replications.
Some examples:
GetAttributeStatistic("ProcessingTime", "Avg", 1) returns average value for
the Attribute "ProcessingTime" for replication 1.
GetAttributeStatistic("ProcessingTime", "Max", -1) returns maximum value
across replications (that is, the maximum of the averages for each replication) for the Attribute
"ProcessingTime".
GetCostStatistic
GetCostStatistic returns the Capacity or Absorption cost of a cost period. (See “Setting Up
Cost Periods” on page 179.) The syntax is:
GetCostStatistic("Period Name", "Cost Object 1", "Cost Object 2",
"Cost Type", "Value Type", Replication);
where Period Name is the name of the period, Cost Object 1 is the name of the first cost object,
Cost Object 2 is the name of the second cost object, and Cost Type is either "Capacity" or
"Absorption". Cost Object 1 can either be a Resource name or an Activity name. Cost Object
2 can either be an Activity name or an Entity name. Thus, the possible combinations of Cost
Object 1 and Cost Object 2 are "Resource Name, Activity Name", "Resource Name, Entity
Name", or "Activity Name, Entity Name". Value Type can be "Avg", "StDev", "Min", or
"Max" for Replication -1. If Replication is 1 or greater, the maximum value is returned no matter
what is entered for Value Type.
Some examples:
GetCostStatistic("Week1", "Sales Rep", "Sales", "Capacity", "Max",
-1) returns the maximum Resource by Activity capacity cost across replications for the cost period
"Week1". "Sales Rep" is a Resource, and "Sales" is an Activity.
GetCostStatistic("Week1", "Sales Rep", "Sales Calls", "Capacity",
"Min", -1) returns the minimum Resource by Entity capacity cost across replications for the cost
period "Week1". "Sales Rep" is a Resource, and "Sales Calls" is an Entity.
GetCostStatistic("Week1", "Sales", "Sales Calls", "Absorption",
SIMPROCESS User’s Manual
310
Accessing Statistics During Simulation
"Avg", 1) returns the Activity by Entity absorption cost for replication 1 for the cost period "Week1".
"Sales" is an Activity, and "Sales Calls" is an Entity. Since this is the value for a replication, the
maximum value is returned even though "Avg" is the Value Type.
GetEntityStatistic
GetEntityStatistic returns the value of a statistic for an Entity that has Collect Entity Statistics
selected either globally or on the Entity type properties. (See “Default Performance Measures” on
page 186.) The syntax is
GetEntityStatistic("Entity Name", "Statistic", "Value Type",
Replication);
where Entity Name is the name of the Entity, and Statistic is the statistic type desired. The key
words for the statistics available are found in Appendix G. (See “Statistic Types” on
page 586.) Value Type can be "Avg", "StDev", "Min", "Max", "Count", or "RunLength".
Replication is the replication desired or the average or sum of replications.
Some examples:
GetEntityStatistic("Sales Calls", "tokentotalborn", "Max", 1) returns
the total number of "Sales Calls" Entities that were generated in replication 1.
GetEntityStatistic("Sales Calls", "tokendelay", "Avg", -1) returns the
average "Sales Calls" cycle time across replications.
GetEntityStatistic("Sales Calls", "tokenholdlevel", "Max", 1) returns
the maximum number of "Sales Calls" Entities that were in a hold condition for replication 1.
GetResourceStatistic
GetResourceStatistic returns the value of a statistic for a Resource that has Collect Resource
Statistics selected either globally or on the Resource properties. (See “Default Performance Measures”
on page 186.) The syntax is:
GetResourceStatistic("Resource Name", "Statistic", "Value Type",
Replication);
where Resource Name is the name of the Resource, and Statistic is the statistic type desired.
The key words for the statistics available are found in Appendix G. (See “Statistic Types”
on page 586.) Value Type can be "Avg", "StDev", "Min", "Max", "Count", or "RunLength".
Replication is the replication desired or the average or sum of replications.
SIMPROCESS User’s Manual
311
Accessing Statistics During Simulation
Some examples:
GetResourceStatistic("Sales Rep", "resrcidle", "Avg", -1) returns the
average number of "Sales Rep" units idle across replications.
GetResourceStatistic("Sales Rep", "resrcbusy", "Max", 1) returns the
maximum number of "Sales Rep" units busy for replication 1.
GetResourceByActivityStatistic
GetResourceByActivityStatistic returns the value of a statistic for a Resource that has
Collect Resource By Activity Statistics selected either globally on the Resource properties. (See “Default
Performance Measures” on page 186.) The syntax is:
GetResourceByActivityStatistic("Resource Name", "Activity Name",
"Value Type", Replication);
where Resource Name is the name of the Resource, and Activity Name is the name of the
Activity. Value Type can be "Avg", "StDev", "Min", "Max", "Count", or "RunLength".
Replication is the replication desired or the average or sum of replications.
Some examples:
GetResourceByActivityStatistic("Sales Rep", "Sales", "Avg", -1) returns
the average number of "Sales Rep" units busy at Activity "Sales" across replications.
GetResourceByActivityStatistic("Sales Rep", "Sales", "Max", 1) returns
the maximum number of "Sales Rep" units busy at Activity "Sales" for replication 1.
GetTimeStampStatistic
GetTimeStampStatistic returns the value of a time stamp that has either Collect Statistics, RealTime Trace Plot, or Real-Time Histogram Plot selected on the time stamp definition. (See “Time
Stamps” on page 201.) The syntax is:
GetTimeStampStatistic("Start Key", "Stop Key", "Value Type",
Replication);
where Start Key is the starting key of the time stamp, and Stop Key is the stopping key of the
time stamp. Value Type can be "Avg", "StDev", "Min", "Max", "Count", or "RunLength".
Replication is the replication desired or the average or sum of replications.
Some examples:
SIMPROCESS User’s Manual
312
Accessing Statistics During Simulation
GetTimeStampStatistic("start", "stop", "Avg", -1) returns the average of the
time stamp with the start key "start" and stop key "stop" across replications.
GetTimeStampStatistic("start", "stop", "Count", 1) returns the number of
observations of the time stamp with the start key "start" and stop key "stop" for replication 1.
GetTotalCostStatistic
GetTotalCostStatistic returns the total Capacity or Absorption cost of a Resource, Entity,
or Activity. The syntax is:
GetTotalCostStatistic("Name", "Cost Type", "Value Type",
Replication);
where Name is the name of the Resource, Entity, or Activity. If the Name is "Total", the value
returned is for all Resources. Cost Type is "Capacity" or "Absorption". Value Type can be
"Avg", "StDev", "Min", or "Max" for Replication -1. If Replication is 1 or larger, the maximum
value is returned no matter what is entered for Value Type.
Some examples:
GetTotalCostStatistic("Sales Rep", "Absorption", "Max", 1) returns the total
absorption cost of the "Sales Rep" Resource for replication 1.
GetTotalCostStatistic("Customer", "Capacity", "Max", 1) returns the total
capacity cost of the "Customer" Entity for replication 1.
GetTotalCostStatistic("Total", "Absorption", "Max", 1) returns the total
absorption cost of all Resources for replication 1.
GetTotalCostStatistic("Total", "Capacity", "Avg", -1) returns the average
total capacity cost of all Resources across replications.
Statistic Errors
If the statistic requested is not found, a run time error will occur. This will occur if a statistic is requested
for which no statistics collection was defined. In the following example no statistics were collected
for the Entity "Sales Calls".
SIMPROCESS User’s Manual
313
Accessing Statistics During Simulation
Another common error is to request the average of replication statistics when only one replication was
run or when the first replication is running. The average of replication can be requested during the
simulation of replication 2 or higher, or after all replications have been completed. In the following
example the average of replications (-1) was requested during the simulation of replication 1.
Requesting the statistic for a replication that is not currently running or has not yet run will not cause
an error. The value zero will be returned.
SIMPROCESS User’s Manual
314
Creating and Controlling Plots With Expressions
Creating and Controlling Plots With Expressions
There are five System Methods for plotting listed in “SIMPROCESS System Methods” on page 521:
CreatePlot, AddPlotLegend, ClearPlot, DisplayPlot, and PlotValue. These
methods give the modeler complete control over plots. As with all other plots, plots created through
expressions are saved automatically in the SPUser/plots directory. The code examples show
below and the two plots at the end of this section are from the SIMPROCESS demonstration model
SplitJoin.spm. Also, ExpressionPlots.spm is in the ExpressionDemos directory.
CreatePlot
This method creates a Trace or a Histogram plot. The syntax is
Model.ObjectAttribute := CreatePlot(Type, Title, X Axis Label
(Optional), Y Axis Label (Optional); where Type is "Trace" or "Histogram".
This method returns the created plot to an Attribute with a Mode of Object. (See “Creating a User
Defined Attribute” on page 242.) All parameters must be of type STRING. Even though the axis labels
are optional, there must be an X Axis Label if there is a Y Axis Label. Use "" for the X Axis
Label to only label the Y axis. Note that this method does not cause the plot to display. Just as with
plots defined from the Report menu, Expression Plots can be populated before being visible. Unlike
menu defined trace plots, the X axis cannot be a date axis.
Model.ProcessTimeTrace := CreatePlot("Trace", "Entity Processing Time
Trace", "Replication", "Time in Minutes");
Model.ProcessTimeHistogram := CreatePlot("Histogram", "Entity
Processing Time Histogram", "Time in Minutes", "Number");
AddPlotLegend
This method adds a legend to a plot. The syntax is
AddPlotLegend(Model.ObjectAttribute, Dataset, Label, Color
(Optional));
The first parameter is the Object Attribute that points to the appropriate plot. Dataset is an INTEGER
(beginning with 0) that represents the set of data to which this legend applies.Thus, multiple data sets
can be plotted on the same graph. Label is a STRING and is the text of the legend. If used, Color
must be a STRING, and the Color must be one of the ones listed in the “SIMPROCESS Color Table”
on page 576. If Color is not used, the plot will automatically assign a color to the legend and data
SIMPROCESS User’s Manual
315
Creating and Controlling Plots With Expressions
set. Note that legends will appear on the plot in the order in which the AddPlotLegend methods
are executed.
AddPlotLegend(Model.ProcessTimeTrace, 0, "Orders", "Blue");
AddPlotLegend(Model.ProcessTimeTrace, 1, "Invoice", "Green");
AddPlotLegend(Model.ProcessTimeHistogram, 0, "Orders", "Blue");
AddPlotLegend(Model.ProcessTimeHistogram, 1, "Invoice", "Green");
ClearPlot
This method removes all data from a plot. The syntax is
ClearPlot(Model.ObjectAttribute); where Model.ObjectAttribute is the Object
Attribute that points to the appropriate plot.
DisplayPlot
This method causes a plot to be visible. The syntax is
DisplayPlot(Model.ObjectAttribute);
The parameter is the Object Attribute that points to the appropriate plot. There is no error if the method
is executed and the plot is already visible. Plots can also be displayed by using the Report menu (Report/
Display Real-Time Plots) or the Display Plots button on the tool bar.
DisplayPlot(Model.ProcessTimeTrace);
DisplayPlot(Model.ProcessTimeHistogram);
PlotValue
The method adds a data point to a plot. The syntax is
PlotValue(Model.ObjectAttribute, Dataset, X Value, Y Value (Trace
only));
The first parameter is the Object Attribute that points to the appropriate plot. Dataset is an INTEGER
(beginning with 0) that represents the set of data to which this data point belongs. X Value and Y
Value can be INTEGER or REAL. Both values are required for Trace plots. Only the X Value is
used with Histogram plots.
SIMPROCESS User’s Manual
316
Creating and Controlling Plots With Expressions
PlotValue(Model.ProcessTimeTrace, 0, Replication, OrderTime);
PlotValue(Model.ProcessTimeTrace, 1, Replication, InvoiceTime);
PlotValue(Model.ProcessTimeHistogram, 0, OrderTime);
PlotValue(Model.ProcessTimeHistogram, 1, InvoiceTime);
SIMPROCESS User’s Manual
317
Summary
Summary
This chapter described how Attributes are used in SIMPROCESS, and introduced Expression
processing with a step-by-step example. The following was discussed:
•
Attributes are variables of model elements whose value can change during a simulation
run.
•
System Attributes are those built in to SIMPROCESS. User Defined Attributes are custom-defined by users.
•
•
Object Attributes identify the model element whose Attribute is being referenced.
•
Expressions are user-written procedures which are invoked by SIMPROCESS at various
events during a simulation run. An introduction to the basics of this language begins on
page 254.
•
•
Object Attributes are used in Expressions to qualify Attribute references.
Globally-defined user Attributes are created for every model element of the same class
(Activities, Resources, etc.).
Locally-defined Attributes apply only to a single type of a model element.
Numerous System Methods are available to add functions to Expressions.
SIMPROCESS User’s Manual
318
CHAPTER 11
More Advanced Model Building
This chapter discusses the advanced schedules of the Generate activity and Resource downtime. Most
real world scenarios do not operate at the same schedule 24 hours per day, 365 days per year. Thus,
the ability to vary entity generation and the availability of resources is critical.
SIMPROCESS User’s Manual
319
Defining a More Complex Generate Activity
Defining a More Complex Generate Activity
A Generate Activity generates different types of Entities, or it can vary the schedule of entity generation
for a single entity type.
Specifying the Active Period of Entity Release
The period that the entity release schedule is in effect can be limited by specifying Release Start and
End dates. To do this, click on the Start/End tab and specify the Start and End dates.
If Start and End dates are specified, the Generate Activity will not produce Entities outside of that time
period.
The Start and End dates work in conjunction with the Start Date and End Date of a simulation run.
So keep in mind that, if the simulation run dates are entirely outside of the period defined for the
Generate release schedule, no Entities are generated during that simulation.
If a Generation Start date is not specified, SIMPROCESS sets the Start time to correspond to simulation
start time. Similarly, if Generation End date is blank, it defaults to the simulation end time. So leaving
the Generation Start/End fields blank ensures that the schedule is in effect for the entire simulation run.
Defining Schedules for a Generate Activity
The Generate schedule identifies the entity-generation pattern defined for an Activity. When a new
schedule item is defined, it is added to the Schedule list box:
Each Schedule identifies an entity generation pattern of a specific type:
•
Periodic: A periodic schedule generates a specified quantity of Entities at the end of a specified
time period
•
•
Calendar: Generates Entities according to a calendar schedule: daily, weekly, monthly, etc.
•
•
Weekly: A schedule that allows generation intervals for every day of the week. This schedule
differs from a Calendar Weekly schedule. See description below for details.
Cyclical:
File:
A detailed sequence of when Entities are generated
A schedule defined in an external file
SIMPROCESS User’s Manual
320
Defining a More Complex Generate Activity
•
•
Spreadsheet:
A schedule defined in an external spreadsheet
External: Generates Entities based on inputs from an external source. External schedules are
a plug-in capability that can be licensed separately from CACI.
Schedules are processed in parallel. If there are two schedules that overlap in time, SIMPROCESS
processes both simultaneously.
Click on Add to define a new schedule, or Edit to change the definition of the item highlighted in the
schedules list box. When adding a new schedule, first identify the type of entity generation pattern
by selecting from the Schedule Type combo box.
Copy duplicates the definition of the item highlighted in the Schedule list box. Use this when two or
more similar schedules are needed.
Remove
deletes the highlighted schedule.
Adding a Periodic Schedule
The Periodic schedule defines a constant or statistical distribution of entity generation events per
period:
The Periodic Schedule dialog contains the following items:
Schedule: Assign a meaningful name to the entity generation schedule. The default name assigned
by SIMPROCESS is the same as the schedule type; in this case, Periodic1.
Entity specifies the type of entity to be generated by this schedule. Use default tells SIMPROCESS
to generate the type of entity indicated in the Generate Activity Properties dialog. To specify a
different type, click on the pull-down arrow for a list of entity types to choose from.
Quantity is the number of Entities to be produced at each entity generation by this schedule. Again,
use default refers back to the value in the Generate Activity Properties dialog. See page
SIMPROCESS User’s Manual
75 of the
321
Defining a More Complex Generate Activity
SIMPROCESS User’s Manual for additional details on this field.
Interval defines
Start/End
the time between entity-generation events for this schedule.
defines the effective period for this schedule.
The times in the Start and End fields apply just to this schedule. The Start and End dates for the schedule
must be within the Start and End dates specified on the Generate Activity Properties dialog. If a date
is not entered for either Start or End, the corresponding value (if any) in the Generate Activity Properties
applies.
Count Limit sets the maximum number of Entities that can be generated by this schedule. A Count Limit
value of 0 indicates that there is no limit.
If the Count Limit is reached, the Generate Activity may stop generating Entities for this schedule. This
depends on the setting of the Both must be reached and Generation End fields.
Both must be reached specifies that both the Count Limit and Release End date must be attained in order
to terminate entity generation for this schedule. If the Both must be reached field is not marked, then
reaching either Generation End or Count Limit terminates the schedule.
Adding a Calendar Schedule
To add a schedule that generates Entities based on the calendar, select Calendar under Schedule Type
on the Generate Activity Properties dialog, and then click on Add:
The following types of entity-generation schedules can be specified in the Calendar Schedule dialog:
•
•
Yearly
- Entities are generated once every year, on a particular date
Monthly
- Entities are generated on a specific day in each month (e.g., 1st of the month)
SIMPROCESS User’s Manual
322
Defining a More Complex Generate Activity
•
•
•
•
Weekly - A certain time of day, on the specified day of the week (e.g., Monday, Tuesday...)
Daily
- Every day, generated at the specified time
Hourly
- Every hour, generated at the specified time
Date - A specific date and time. This event will occur only once, at the specified date and time.
The Calendar Schedule dialog changes in appearance depending on the Type of schedule selected:
•
•
If Calendar Type is Weekly, a list of the days of the week is added to the dialog.
The heading above the Date and Time field changes to prompt for the information required
for the Type schedule selected.
For example, if a Daily entity generation schedule is selected, a time of day must be entered in the Date
field.
and Time
Any information that does not apply to a Daily schedule, such as the date and year, is ignored.
As with all schedules, Start/End can be used to further define the effective period for a Calendar
generation schedule.
Adding a Weekly Schedule
A Weekly schedule is similar to a Periodic schedule in that the schedule defines a constant or statistical
distribution of entity generation events. The difference is that the Weekly schedule allows the entity
generation events to be restricted to certain days of the week and certain time periods of the day. Note
that this Weekly schedule is different from a Calendar Weekly schedule. A Calendar Weekly schedule
only generates a certain quantity of entities once a week on a specified day and time. This Weekly
schedule generates multiple times based on a periodic interval restricted to certain days and times. To
add a Weekly schedule, select Weekly under Schedule Type on the Generate Activity Properties dialog,
and then click on Add.
See the Periodic schedule definition (page 321) for information on Schedule, Entity, Quantity, Interval,
Time Unit, and Start/End.
Use the Weekly Schedule portion to select each Day of Week for which the Entity, Quantity, and Interval
apply. When a Day of Week is selected, the Start Time and End Time for that day activate. Enter the Start
Time and End Time for entity generation for that Day of Week. If both Start Time and End Time show
00:00:00, entity generation will occur for the complete day (24 hours). If End Time shows 23:59:59,
it is assumed that 00:00:00 for the next day is intended, and the final second will be added to the entity
generation period.
If the Generate at start of first interval check box is selected, an entity will be generated at the Start Time
SIMPROCESS User’s Manual
323
Defining a More Complex Generate Activity
of each active Day of Week. If the check box is not selected, a random value based on the Interval and
will be added to the Start Time for the first entity generation of each active Day of Week.
Time Unit
Defining Cyclical Schedules
Use the cyclical schedule to define a detailed sequence of entity generation cycles. For example, a week
day-by-day, or a year month-by-month could be described. A unique period such as the holiday rush
leading up to Christmas could be defined, where entity generation behavior differs markedly from the
rest of the year.
A cyclical schedule is defined as a series of cycles. Each cycle describes a different entity generation
sequence. In a sense, the cycle series is like a schedule of its own. But unlike the schedules defined
for the Generate Activity as a whole, cycle events are processed sequentially, not in parallel. Since
one cycle follows another, order is important. Cycles can be repeated as many times as is needed.
The following types of cycles can be defined:
•
•
Periodic.
A constant or statistical distribution defining the time interval between events
Calendar. Entity generation events scheduled at intervals based on the calendar, i.e., weekly,
monthly, etc.
•
Single Event.
A one-time entity generation event
SIMPROCESS User’s Manual
324
Defining a More Complex Generate Activity
•
•
No Event.
A period where no Entities are generated
Cyclical. A cycle within a cycle; that is, a more detailed breakdown within a schedule (e.g.,
the various periods within a single day — breakfast, meeting, coffee break, lunch — within
a workweek described day-by-day).
Cycles are added to and modified from the Cyclical Schedule dialog.
The Sequence of Events dialog lists the cycle events defined for this cyclical schedule. The events are
listed in the order in which SIMPROCESS will execute them. When a cycle is added, SIMPROCESS
places it at the end of the list. The pattern can be rearranged using the Move command.
For example, here is a list of cycles defined out of sequence:
To move the April cycle to the end of the list, highlight April and click on the Move button three times.
SIMPROCESS User’s Manual
325
Defining a More Complex Generate Activity
Each click of Move shifts the item down a row.
Cycles can be moved up in the list by checking the Upwards option before clicking the Move button.
tells SIMPROCESS how many times to repeat execution of the pattern of cycles.
If Infinite is checked, SIMPROCESS will keep repeating the cycle pattern until Generation End is
reached.
Repeat Sequence
Note about Repeat Sequence
A value of 0 in the Repeat Sequence field tells SIMPROCESS
to run through the list a single time, without repeating it. A
value of 1 results in two passes through the Sequence of Events:
the initial run-through and one repetition.
Do not confuse the number of repetitions with the number of
passes through the list.
Refer to page 322 for a description of the Start/End option.
Defining a Periodic Cycle
A periodic cycle defines a constant or statistical distribution of entity generation events. To define a
periodic cycle in a cyclical schedule, select Periodic from the list of Schedule types, and then click on
Add:
SIMPROCESS User’s Manual
326
Defining a More Complex Generate Activity
Defining a periodic cycle is similar to defining a periodic schedule (see page 321). The major difference
is that duration of the cycle is not defined in terms of start and end dates. That is because the start time
is under the control of the cyclical schedule of which the cycle is a part:
Duration is how long this cycle is in effect. A number can be entered or a value selected from the pull-
down list for this field. Time Units specifies the time unit of the Duration.
The starting time of the event is determined by the following factors:
•
•
•
The Generation Start date of the cyclical schedule
The position of this cycle in the Schedule of Events in the Cyclical Schedule detail dialog
The Duration of the cycles that precede this one.
Count Limit sets
a maximum number of Entities that may be generated during this cycle. A value of
0 indicates no limit.
The Both must be reached checkbox, if marked, specifies that both the Duration and Count Limit must
be reached before the cycle completes.
Note that selecting Both must be reached can result in a cycle of unknown duration. This happens if
the Count Limit is not reached before the end of the Duration period. In that event, the cycle continues
until either the Count Limit is attained, or the Generate Activity Generation End is reached.
Repeat Event tells SIMPROCESS how many times to repeat execution of this cycle. If Infinite is selected,
SIMPROCESS will keep repeating the cycle until the schedule’s Generation End date is reached.
•
The Entity, Quantity, and Interval fields are used the same way they are in the Periodic Schedule
detail dialog (see page 321).
Defining a Calendar Cycle
A calendar cycle defines entity generation events that repeat on either a daily, weekly, monthly, or
yearly basis:
SIMPROCESS User’s Manual
327
Defining a More Complex Generate Activity
The dialog above shows a calendar cycle representing four days leading up to a festive holiday, when
people are rushing to buy gifts for their loved ones. It’s a daily schedule, beginning at 9 a.m. Note that
there is no duration on calendar events. They will operate as long as possible. For the example above,
since it is a Daily schedule, it will generate every day at 9 o’clock. Thus, any events listed after the
Daily event in the Cyclical schedule will not execute, since the Daily event will keep generating.
As with the periodic cycle, the start time of a calendrical event is determined by the cyclical schedule
in which the cycle is defined. However, entity generation is not triggered until the time that is indicated
in the Date and Time field. If the trigger point is not reached while the cycle is in effect, no Entities
are generated. For a further explanation, see “SIMPROCESS’ Scheduling of Event Cycles” on
page 328.
The Date and Time needed depends on the Calendar Type schedule selected:
•
Yearly.
•
Monthly. Specify a day of the month and time of day, e.g., the first of the month, at noon. Entity
Enter a date and time of day, but do not specify a year. Entity generation begins if
the simulation reaches the specified date and time during this cycle.
generation begins if the simulation reaches the specified day and time while the cycle is in
effect.
•
Weekly. Select a day of the week (from a list that appears when Weekly is checked off) and
a time of day. Entity generation begins if the simulation reaches that day and time during the
cycle.
•
Daily. Specify a time of day. Entities are released if the simulation reaches this time of day
while the cycle is in effect.
•
Hourly. Specify the minutes and seconds of an hour. Entities are released if the simulation
reaches this time of day while the cycle is in effect.
•
Date. Specify a specific date and time. Entities are released if the simulation reaches this date
and time while the cycle is in effect.
SIMPROCESS’ Scheduling of Event Cycles
Calendar cycles must be carefully placed within the Sequence of Events. If the trigger time specified
in the Date and Time field has already passed when SIMPROCESS invokes a cycle, entity generation
may not occur.
For example, assume a cyclical schedule with a Generation Start date of January 1, 2004, and a
Generation End date of March 31, 2004. The schedule contains the following Schedule of Events cycles:
•
•
A periodic cycle event beginning on January 1, with a duration of 48 hours.
A calendar cycle which is triggered monthly, on the 2nd of the month.
The simulation begins at midnight, January 1. The periodic cycle starts right away and lasts for 48
SIMPROCESS User’s Manual
328
Defining a More Complex Generate Activity
hours. At this point it is midnight, January 3rd, and the calendar cycle is implemented. What happens
during this period?
No Entities are generated by the calendrical event for January. Here is why:
1. On January 3rd of simulation time, SIMPROCESS acts on the calendrical cycle. It checks the
Date and Time value (which is set to the 2nd of the month, at midnight) and compares it to the
current date. SIMPROCESS determines that the trigger date has already passed and bypasses
entity generation. The next possible trigger point is on February 2nd.
2. The calendar cycle continues until the end of the simulation or until the end of the active
period for the Cyclical schedule.
Note that the Calendar event maintains control of the Cyclical schedule since there is no duration for
the Calendar event.
Defining a Single Event Cycle
A Single Event cycle describes a one-time entity generation event:
A single event has the same parameters as a calendar cycle, except that when the event begins cannot
be specified. A single event’s starting date and time is dependent on the cycles that precede it in the
pattern of cycles. Once the event is active, the generation occurs at the end of the duration.
Defining Inactive Time Periods
The No Event cycle defines a period of time during which no Entities are generated (for example, a
holiday or weekend). The period of inActivity begins at whatever time SIMPROCESS invokes the
No Event cycle.
SIMPROCESS User’s Manual
329
Defining a More Complex Generate Activity
Defining Specific Entity Generation Events in a File
Entity generation events can be specified in an event file. An event file is created with a text editor
or some other means independent of SIMPROCESS (such as a user written program). With an event
file, a simulation can be run using data captured outside of SIMPROCESS.
For example, most mail order businesses use computer systems to track customer sales information.
This information is stored in some kind of database. This information can be extracted from the database
and a series of entity generation events defined that precisely matches customer activity for an actual
day, week, month, etc. (Note that the database can also be read directly by SIMPROCESS. See
“Interfacing With A Database” on page 296.)
Each record in an event file defines one entity generation event. To learn how to define entity generation
events, see Appendix G–External Event Files, on page 577.
Use the External File schedule to identify an event input file to SIMPROCESS:
To identify the event file, click on the Browse button to the right of the Event File box. Use the resulting
dialog to find and select the file.
The Read Event File button causes SIMPROCESS to read the event file, checking for syntax errors and
building a list of the entity types and attributes referred to in the file. The Read Event File button must
be clicked to complete the definition of the event file.
Refer to page 322 for a description of the Start/End option.
Identifying Entity Types to be Generated
An event file can contain records referring to many different entity types. An event record can even
refer to a type of entity that has not yet been defined in the model and to entity instance attributes that
have not been defined in the model. Which entity types SIMPROCESS should generate during
SIMPROCESS User’s Manual
330
Defining a More Complex Generate Activity
simulation can be specified precisely.
Select the Generate Entities option that indicates which of the entity types referenced in the event file
are to be generated:
•
Defined in the model tells SIMPROCESS to generate Entities for every event record that
specifies an entity type already defined in the model.
•
Selected in the list tells SIMPROCESS to generate Entities only for the types highlighted in
the entity type list.
•
If the event file refers to an entity type that is not defined in the model, it flags the type name.
For example:
GQL Add(Type)
•
Selecting this type will cause SIMPROCESS to add the entity type to the model.
•
If the entity in the event file refers to entity instance attributes that have not been defined in
the model, this is flagged as well. For example:
BC Add(Type, Attributes);
•
Note that attributes are tied to Entities. Entity instance attributes cannot be added without
adding the entity type.
To select the entity types to be used:
•
Highlight the listed type name. To highlight several types, press and hold the Ctrl key while
clicking on each item.
•
To deselect a type, click on it again while pressing the Ctrl key.
Saving Events
The option Save events in model determines whether the event file is needed for simulation. The option
defaults to not selected. Not being selected means the event file will be read at simulation time. Thus,
the file is required to run the simulation. If the option is selected, then the events are saved as a part
of the model, and the file is not needed for simulation. However, saving events as a part of the model
could significantly increase the size of the model file and increase the amount of time needed to load
the model. If events are saved, the Read Event File button must be exercised if the event file changes.
Otherwise, the simulation will not run with the events from the new file. Note that if the events are
SIMPROCESS User’s Manual
331
Defining a More Complex Generate Activity
not saved, and the event file changes, the events for the simulation will change. But, doing this without
intentionally reading the event file using the Read Event File button assumes that the Entities and
attributes used in the new file are the same as the previous file.
Adding a Spreadsheet Schedule
The Spreadsheet schedule allows full or partial generation events to be read from a spreadsheet.
The Spreadsheet schedule is essentially a Periodic schedule modified to allow spreadsheet entries to
override the Entity, Quantity, and Interval. These fields operate as on a Periodic schedule unless
overridden by the check boxes below.
The File Name field contains the name of the spreadsheet file. The spreadsheet can be a Workbook file
or an XML Spreadsheet. If no path is included, the file is assumed to be in the model’s directory. (It
is recommended that the file be located in the model’s directory. If the model and its directory are
SIMPROCESS User’s Manual
332
Defining a More Complex Generate Activity
moved, the File Name field will not need to be changed.) There are three options for overriding the
defaults:
•
•
•
Use Spreadsheet for Entity
Use Spreadsheet for Quantity
Use Spreadsheet for Interval
Selecting any option causes the Sheet, First Row, and Column fields for that option to activate. The Use
Spreadsheet for Interval option also has a check box (Column contains Date/Time) that designates whether
the column contains interarrival times or date and time information (default). All options assume the
information is in a column starting at a particular row. No empty cells are allowed. For any option,
if an empty cell is encountered in the designated column, the schedule stops operation.
Enter the appropriate Worksheet name in the Sheet field. First Row is the starting row for the events.
The row number must be an INTEGER and must be greater than or equal to one. The Column field
contains the column number of the data. As with the row number, the column number must be an
INTEGER greater than or equal to 1. So if the data is in column A starting at row 1, First Row would
be 1 and Column would be 1. Note that the First Row and Column fields contain the distribution list.
Thus, evaluated values can be used as long as the above criteria are met.
overrides the Entity field. Only Entity names defined in the model should
be in the spreadsheet. If a value read does not correspond to an Entity defined in the model, a runtime
error will occur. Entity names are case sensitive.
Use Spreadsheet for Entity
Use Spreadsheet for Quantity overrides the Quantity field. The values in the designated column should
be numeric. If the value read is not an INTEGER, the value will be rounded to the nearest INTEGER.
overrides the Interval field. If the values in the designated column are
interarrival times, make sure Column contains Date/Time is not selected. Also, the Time Unit selected
for the default Interval field applies to interarrival times read from a spreadsheet. If the values in the
designated column are date and time values, the Time Unit field is ignored. Note that if the column
contains date and time information, the column is assumed to be sorted in ascending order. An out
of order date and time will cause the schedule to stop.
Use Spreadsheet for Interval
In the example below, arrivals.xls contains the complete generation event information since
all three options are selected. All information is on the same Worksheet (Entity Arrivals), and all options
start on the same row. In the spreadsheet excerpt below, the Generation Date contains no time
information. This means the event will occur at midnight of the specified date. Time information must
be included if generation at midnight is not acceptable (such as 1/4/2005 08:00:00).
SIMPROCESS User’s Manual
333
Defining a More Complex Generate Activity
Note below that the values for each field (Sheet, First Row, and Column) can be different for each option.
Typically Column will be different across options unless different Worksheets are used.
Refer to page 322 for a description of the Start/End option.
SIMPROCESS User’s Manual
334
Defining a More Complex Generate Activity
Adding an External Schedule
An external schedule allows a remote application to cause the generation of Entities within a
SIMPROCESS model. This is a plug-in capability that can be purchased separately from CACI. Typical
uses for external schedules include connecting decision support or operational systems to a
SIMPROCESS simulation model to see how a model is affected by the randomness of real work
applications in use rather than just randomness from statistical distribution functions. Other uses may
include custom training software that allows students to interact with the simulation based on things
they see occurring in the model – hence, influencing the remaining simulation.
An external schedule changes the normal operation of a simulation. If SIMPROCESS detects an
external schedule within a model (and the appropriate license has been purchased), then the ending
date and time specified in the Run Settings (page 109) is no longer active. Normally, if there are no
more simulation events to process, then the end simulation event (which is based on the ending date
and time specified in the Run Settings) is executed. When an external schedule is present and there
are no more simulation events to process, the simulation suspends execution until an external schedule
is signaled to generate Entities. Note that simulation time does not advance while simulation processing
is suspended.
There are three ways to stop a simulation that contains an external schedule. The first is to manually
stop the simulation using the Stop button, the F9 key, or Simulate/Stop. The second way is to route
Entities to a Dispose Activity that has a maximum entity count set (page 80). When the maximum has
been reached, the simulation will stop. The final way is to call the stopSimulation method of
SPServerFactory (page 338).
Three actions must be accomplished before the start of the simulation in order to use an external
schedule. The last two can be done before SIMPROCESS is started and can remain operational even
though SIMPROCESS is closed and reopened.
•
•
•
Create the external schedule in a Generate Activity
Start the Java RMI Registry
Start SPServer.
External Schedule Setup
Use the External schedule dialog to set the default Entity and Quantity.
SIMPROCESS User’s Manual
335
Defining a More Complex Generate Activity
The Entity and Quantity specified on the dialog can be overridden by the external application. Multiple
external schedules can be specified in a single generate Activity or in different generate Activities.
Java RMI Registry
The Java RMI Registry must be started before SPServer or the simulation is started. This is because
Java RMI is the protocol used to communicate between the external application and SPServer, and
between SPServer and SIMPROCESS. The RMI Registry program (rmiregistry) is located in
the Java Runtime Environment (JRE) included with SIMPROCESS. To start the RMI Registry locally,
select Tools/Remote/Start RMI Registry. Note that once the RMI Registry has been started, it will remain
active until SIMPROCESS is closed. Alternatively, a batch file or UNIX shell script can be constructed
in the SIMPROCESS directory, because the RMI Registry program is required to have in its classpath
the locations of files referenced by server processes. Here are some examples of what should be
contained in those files:
In a Windows batch file:
set CLASSPATH=SPSYSTEM\simprocess.jar;SPSYSTEM\SPRemote.jar
rmiregistry
In a UNIX shell script using the Bourne shell or a derivative:
CLASSPATH=SPSYSTEM/simprocess.jar:SPSYSTEM/SPRemote.jar
export CLASSPATH
rmiregistry
In a UNIX shell script using the C shell or a derivative:
setenv CLASSPATH SPSYSTEM/simprocess.jar:SPSYSTEM/SPRemote.jar
rmiregistry
Sample batch files and scripts are located in the SPUser\SampleFiles directory. SPUser is
located in the SIMPROCESS installation directory. The sample batch and script files are intended to
be run from the SIMPROCESS installation directory.
SIMPROCESS User’s Manual
336
Defining a More Complex Generate Activity
SPServer
SPServer instantiates a single object called SPServerFactory. SPServerFactory creates instances of
a server for each simulation that has an external schedule. SPServerFactory keeps track of which server
instance is associated with which simulation. Thus, the user only needs to interface with
SPServerFactory through a set of public methods. The user is responsible for creating the interface
to SPServerFactory. If RMI Registry is running on the same system as SIMPROCESS, select Tools/
Remote/Start SPServer to start SPServer. To start SPServer from a command line in the directory in
which SIMPROCESS was installed, type the command jre/bin/java -classpath
SPSYSTEM/simprocess.jar:SPSYSTEM/SPRemote.jar
com.caci.remote.SPServer (use backslashes and semicolons on Windows). Once the
command has been executed, SPServerFactory is available through the Java RMI Registry using its
bound name of "SPServer."
To run RMI Registry and SPServer on a host other than the host on which SIMPROCESS is running,
and/or to specify a TCP port other than the default (1099), make the appropriate changes in the Run
Settings. The sample files to start RMI Registry and SPServer can be copied from
SPUser\SampleFiles to the appropriate system.
Running The Simulation
With the above steps complete, the simulation can be started. The simulation must be started before
the external application attempts to communicate with SIMPROCESS. If not, an error will occur and
the simulation will be terminated.
SIMPROCESS User’s Manual
337
Defining a More Complex Generate Activity
SPServerFactory API
When the simulation is running, the external or remote application can begin communicating with
SIMPROCESS. In order to do this, the application must obtain a reference to SPServerFactory.
However, since SPServerFactory is remote to the application, a "Stub" representation of
SPServerFactory must be used instead. Stub classes are provided by RMI and serve as references to
the methods of SPServerFactory that are available remotely. Because SPServerFactory was created
according to RMI conventions, it implements a Java Interface containing the methods that may be
invoked by the remote application. Therefore, the usual way to refer to it is by using the name of that
Interface, SPServerFactoryInterface. That is, cast the item returned from the RMI Registry to the name
of the Interface. The code fragment below is from an example remote application and shows the
traditional way to refer to SPServerFactory.
import com.caci.remote.*;
import java.rmi.*;
import java.rmi.server.*;
public class ExternalApp {
public static void main(String args[]) {
SPServerFactoryInterface spServer = null;
boolean goodEvent = false;
try {
spServer =
(SPServerFactoryInterface)Naming.lookup("rmi://localhost/SPServer");
}
catch (Exception e) {
e.printStackTrace(System.out);
}
The name localhost can be replaced with any valid entry that will resolve to the system on which
SPServerFactory is running (including an actual Internet Protocol address). Note that the
Naming.lookup method throws a NotBoundException and a MalformedURLException
so this command must be within a try block.
SIMPROCESS User’s Manual
338
Defining a More Complex Generate Activity
The class com.caci.remote.SPServerFactoryInterface has these public methods for
communication with SIMPROCESS models:
public double getSimTime(String modelName)
throws RemoteException;
public boolean generateEntity(
String modelName, String generate,
String schedule, double time, int quantity)
throws RemoteException;
public boolean stopSimulation(String modelName)
throws RemoteException;
getSimTime returns a double representing the current simulation time. The time unit of this
number is the simulation time unit specified in the Run Settings. Its single parameter, modelName,
is the name of the simulation model (the same as its filename without the .spm extension).
generateEntity returns a boolean indicating success or failure. Its parameters are as follows:
•
modelName is the name of the simulation model (the same as its filename without the .spm
extension)
•
•
•
•
•
generate is the name of the Generate Activity
schedule is the name of the External schedule within the Generate Activity
entity is the name of the Entity to create
time is the simulation time at which the generation event should occur
quantity is the number of Entities to generate for this generation event
The parameters entity and quantity can default to the Entity and Quantity specified on the external
schedule dialog. A value of null or "" for entity will cause the default to be used. A value of
0 for quantity causes the default quantity to be used. The time parameter can default to the current
simulation time by passing a value of -1.
stopSimulation returns a boolean indicating success or failure. modelName is the only
parameter.
All methods throw a RemoteException.
SIMPROCESS User’s Manual
339
Defining a More Complex Generate Activity
External Application Example
The code below is a simple example of an external application communicating with SIMPROCESS.
In this example, Remote is the name of the model (Remote.spm). The for loop runs from 1 to 10.
For 1 and 2, the generateEntity method specifies all the parameters except quantity. The
generateEntity method for 3, 4, and 5 specifies all the parameters. The generateEntity
method for 6 through 10 only specifies the model, generate, and schedule parameters. The
remaining parameters are set for defaults. The generateEntity method after the for loop calls
the StopSim schedule. This schedule is set to generate a StopSim entity, which enters a Dispose Activity
with a maximum entity count of 1, thus stopping the simulation. See Chapter 5 of the SIMPROCESS
Getting Started Manual for instructions on running this example. The code (ExternalApp.java)
is in the SPUser\SampleFiles directory. Also, in the SPUser\SampleFiles directory is
ExternalApp2.java. This application is exactly the same as ExternalApp.java, but it uses
stopSimulation to end the simulation.
package com.caci.demo;
import com.caci.remote.*;
import java.rmi.*;
import java.rmi.server.*;
public class ExternalApp {
public static void main(String args[]) {
SPServerFactoryInterface spServer = null;
boolean goodEvent = false;
try {
spServer =
(SPServerFactoryInterface)Naming.lookup("rmi://localhost/SPServer");
}
catch (Exception e) {
e.printStackTrace(System.out);
}
try {
if (spServer != null) {
for (int i = 1; i < 11; i++) {
double time = spServer.getSimTime("Remote");
time = time + 10.0;
if (i < 3) {
goodEvent = spServer.generateEntity("Remote",
SIMPROCESS User’s Manual
340
Defining a More Complex Generate Activity
"Generate1", "External1", "Entity9", time, 0);
}
else if (i < 6) {
goodEvent = spServer.generateEntity("Remote",
"Generate1", "External1", "Entity6", time, 2);
}
else {
goodEvent = spServer.generateEntity("Remote",
"Generate1", "External1", null, -1, 0);
} // end of inner if
if (!goodEvent) {
System.out.println("Generate event failed");
}
try {
Thread.sleep(2000);
}
catch (Exception e) { }
} // end of for loop
goodEvent = spServer.generateEntity("Remote",
"Generate1", "StopSim", null, -1, 0);
} // end of outer if
} // end of try block
catch (RemoteException re) {
re.printStackTrace(System.out);
}
} // end of main
} // end of ExternalApp
External Schedule Errors
If the call to getSimTime is not successful, a -1 will be returned. If the call to generateEntity
is not successful, false will be returned. Error messages from SPServerFactory or one of the server
instances will be in the file server.log in the SIMPROCESS directory. If the error occurred within
SIMPROCESS, the error messages will be in simprocess.log or simprocess.err in the
SPSYSTEM directory.
SIMPROCESS User’s Manual
341
Defining a More Complex Generate Activity
Generate Activity Summary
The Generate Activity generates the Entities that are processed in a SIMPROCESS simulation:
The number of Entities generated at each generation event and the frequency of entity generation events
may be expressed as either constant numbers or statistical distributions.
Schedules of discrete entity generation events can be defined. Schedules are classified as:
•
•
•
•
•
•
•
Periodic: A constant or statistical distribution of generation events per time unit.
Calendar: Daily, weekly, monthly, etc., events.
Weekly: Schedule for a complete week.
Cyclical: A detailed sequence of generation events.
File: A schedule defined in an external file.
Spreadsheet: A schedule defined in an external spreadsheet.
External: A schedule that receives generation signals from an external application.
Cyclical schedules are further broken down into cycles, each of which describes a different entity
generation event. Cycle events are processed sequentially. This differs from other Generate schedules,
which are processed in parallel.
SIMPROCESS User’s Manual
342
Resource Downtime
Resource Downtime
Resource Downtime determines when a resource is unavailable. Resource Downtime can be defined
locally or globally. A Resource can have multiple global and one local Resource Downtime. Each
global Resource Downtime for a particular Resource and the local Resource Downtime for the
Resource operate independently. Thus, each can have different Start and End dates and times, and each
can have different Schedules.
Local Resource Downtime
Local Resource Downtime is defined on the Downtime tab of the Resource properties dialog. Downtime
defined on the Downtime tab of a Resource properties dialog will only apply to the Resource currently
being edited.
The global Resource Downtimes can be accessed while defining a local Resource Downtime. There
is a Global Downtimes button on the Downtime tab of the Resource Properties dialog that displays a dialog
that lists the global Resource Downtimes defined in the model. The global Resource Downtimes that
are applied to the Resource are selected and can be modified. The global Resource Downtimes can
be edited by selecting the Edit Downtimes button.
SIMPROCESS User’s Manual
343
Resource Downtime
Global Resource Downtime
Global Resource Downtimes can be applied to any Resource in the model. They are defined by selecting
the menu item Define/Resource Downtimes....
SIMPROCESS comes with three predefined Resource Downtime templates that are listed in the Type
combo box on the Resource Downtime list dialog:
•
•
Empty - Default Resource Downtime, with no Downtime scheduled.
•
Standard Shift - Includes a Downtime schedule that causes a Resource to only be available
from 8 a.m. to noon and 1-5 p.m.
Night Shift - Includes a Downtime schedule that causes a Resource to only be available from
11 p.m. to 3 a.m. and from 4 a.m. to 8 a.m. Monday through Friday nights.
The Add Template button on the Resource Downtime list dialog creates a Resource Downtime template
that can be saved in a Library. When the Library is loaded the Resource Downtime templates in the
SIMPROCESS User’s Manual
344
Resource Downtime
Library are added to the Type list. See “Adding Resource Downtime Templates,” beginning on
page 232 for more information on creating Resource Downtime templates.
Selecting Add brings up a global Resource Downtime dialog.
The Downtime’s Schedules must be defined, and the Resources can be selected that will use this
Downtime. Global Resource Downtime properties include a list of the Resources defined in the model.
Apply the global Resource Downtime to Resources by selecting the appropriate Resources in the list.
Control click to select multiple Resources or click Select All to select all the Resources.
SIMPROCESS User’s Manual
345
Resource Downtime
Selecting the New Resource button displays the dialog that manages the Resources of the model.
Note that when a Resource is edited from the Resource Downtime Properties dialog, the Global
Downtimes button on the Downtime tab is disabled. This is because the global Resource Downtime list
is already open. Note that the Global Downtimes button will also be disabled when defining a Resource
template.
SIMPROCESS User’s Manual
346
Resource Downtime
Defining Downtime Schedules of Resources
Global and local Resource Downtimes have the same format. Both consist of Start and End dates and
times and a list of Schedules. All schedules in the Schedule list are active only between the times
specified in the Start and End fields. If no times are specified, they will default to the Start and End
of the model. It is recommended, unless the modeling scenario requires specific dates, that the Start
and End are left empty. If the Start and End of the model are changed, then the Start and End of resource
downtimes are changed without having to re-enter the dates and times.
Dialog Field Definitions
•
Start specifies the earliest time that the resource’s downtime schedules are in effect. This field
uses a MM/DD/YY HH:MM:SS:MSS:USS:NSS format. The millisecond, microsecond, and
nanosecond portions may be left blank.
•
End is the time beyond which the downtime schedules are not applicable. The same date/time
format as Start is used. After this time, the resource will not go down.
•
The Schedules list identifies the downtime periods defined for this resource. When a new
downtime period is defined, it is added to this list.
Next to the Add button for the Schedule list box is a combo box containing the available downtime schedule types. There are three basic schedule types: Periodic, Calendar, and Usage. Calendar and Usage downtime schedules have variations.
A Periodic schedule of downtime is one that occurs at intervals of time. The interval may be fixed (every
n time units) or random (sampled from a statistical distribution).
SIMPROCESS User’s Manual
347
Resource Downtime
The Calendar schedules are calendar-based, with downtime occurring on particular dates or days of
the week, time of day, etc. Types are:
Yearly
- Every year, on a particular date and time.
Monthly
- A specific day in each month (e.g., 1st of the month).
Weekly - A certain time of day, on the specified day of the week (e.g., Monday, Tuesday...)
Daily
- Every day, beginning at the specified time.
Hourly
Date
- Every hour, beginning at n minutes past the hour.
- A specific date and time.
The Weekly schedule allows downtime to be defined for every day of the week.
There are two types of Usage downtime: Unit Based and Time Based. A Unit-Based schedule is based
on the number of units of the resource that have been used. The amount of time the units were used
is not considered. The Time-Based schedule considers the amount of time the resource has been busy.
When adding a new downtime schedule or editing an existing one, a dialog will display that contains
the parameters for that downtime schedule type.
The Downtime Schedule dialog changes in appearance depending on the Schedule Type selected:
•
If Schedule Type is periodic, the downtime occurs at intervals of time indicated in the
Time Between Downtimes field. If the Schedule Type is calendar, the downtime occurs at
the time specified.
•
For Time Between Downtimes in a Periodic schedule, specify a statistical distribution or
constant. For a Calendar schedule, specify a date and/or time.
•
If Schedule Type is Weekly, a list of the days of the week appears. Select a day from this list.
SIMPROCESS User’s Manual
348
Resource Downtime
•
Downtime
•
is the name assigned to the downtime period. This name appears in the
list box.
Schedule Name
Time Between Downtimes
defines the time at which the resource becomes unavailable.
For Periodic schedules, this field is labeled Time Between Downtimes and contains either a
statistical distribution or a constant. If a distribution is specified, the resource will be
unavailable at random intervals based on the distribution sampling. If a constant is specified,
the resource enters a period of Downtime every n time units. For example, to model a dayshift
that works from 9 am to 5 pm and is off the rest of the day, specify 24 in this field and select
Hours for the Time Unit. This means that every 24 hours (i.e., every day at 5 pm) the resource
becomes unavailable.
For Usage schedules, this field is labeled Usage Before Downtime and contains either a
statistical distribution or a constant. Except for the first values, values from statistical
distributions are obtained at the end of each downtime. If Unit Based is selected for Usage
Type, Time Unit will be disabled. This is because time is not considered for Unit-Based
downtime. However, units are considered for Time-Based downtime. For example, if two units
of a resource are in use for the same one-hour period, then the amount of time the resource
was in use is two hours (one hour for each unit).
For all other schedules, this field is labeled Date and Time or Time and contains a date and/
or time. Date is specified as a 2-digit month, 2-digit day, and 4-digit year. Time-of-day ranges
from 0 to 2400 hours. Downtime of the resource begins at the time specified.
•
Number of Units Down is the amount of capacity units to be made unavailable. This value can
be variable. For instance, if all the capacity of the resource is to go down and an attribute was
used for resource capacity, use that same attribute here. That way, when capacity changes,
SIMPROCESS User’s Manual
349
Resource Downtime
the units down will change as well. Alternatively, using Evl(Capacity) for the Number
of Units Down accomplishes the same thing. If the schedule is a global Downtime schedule
that will be used with more than one Resource, always use Evl(Capacity) since the
Resource capacity can vary from Resource to Resource. See “Evaluate (Evl) Function” on
page 263 for a discussion of Evl, and see “System Attributes” on page 512 for a description
of the Resource System Attribute Capacity. IMPORTANT: The Number of Units Down
should not be larger than the number of units defined for the Resource.
•
Downtime Duration is the length of time that the resource is unavailable. In the above daytime
shift example 16 would be specified in this field. Duration Units is the time unit that applies
to the Downtime Duration.
•
Planned specifies that the period of unavailability is planned. For example, a vacation may
be planned, whereas sick time is not planned. If unchecked, then the statistics for downtime
display as Unplanned downtime.
•
Downtime Options are used to set the rules for starting downtime (see below). Downtime Options
are not available for Usage downtimes. This is because the downtime is based on usage.
Therefore, the check for the start of downtime does not occur until the resource is released
(Start Downtime when Resource is Idle option).
•
Start Downtime when Resource is Idle
•
Interrupt Activities signals SIMPROCESS to interrupt the processing of any Activities that
are currently using this Resource. What happens to the Entities that are processing at an
Activity that is interrupted is determined by the resource usage dialog of the Activity. (See
“Adding Resource Requirements to Activities” on page 152.) If Release Entities In Process
at Start of Downtime is not selected at the Activities, Entities using the resource at these
Activities have their remaining processing time saved and are placed at the head of the wait
queue for the resource. The entity does not leave the Activity and will remain there until all
of its processing has completed. (Note that the Get Resource and Free Resource expressions
for the Activities interrupted and the resource going down are not executed when the resource
is released and re-obtained due to downtime.) When Release Entities In Process at Start of
Downtime is selected, the entity is released; thus, any other resources obtained at the Activity
are released. When an entity’s processing is interrupted due to resource downtime, the entity
instance expression Interrupt Processing for that entity is executed. When the entity re-obtains
the resources so processing can continue, the entity’s Resume Processing entity instance
expression is executed. If the Release Entities In Process at Start of Downtime has been selected
at the Activity, then the Resume Processing entity instance expression will not be executed
since the entity leaves the Activity. If Interrupt Activities is not selected, the selected units of
the resource will not go down until the resource has been released. Interrupt Activities also
applies to Connectors with delays. Connectors cannot acquire Resources, but Entities
is the default downtime option. This option specifies
that Resource downtime will not start while the Resource is in use. As soon as a unit of the
Resource has been released (and the downtime period has not passed), that unit is placed in
a down state for the remaining period of the downtime. If the Resource is idle, then downtime
starts immediately.
SIMPROCESS User’s Manual
350
Resource Downtime
traversing a Connector can have Resources obtained at a Get Resource Activity. Interrupt
Activities applies as described above for Get Resource Activities. If animation is on, Entities
will pause on a Connector with a delay if a Resource carried by the Entity goes down due
to Interrupt Activities.
•
Release All Resources is only enabled if Interrupt Activities has been selected. This option only
applies if more than one Resource is in use by an Entity when a Resource interrupts the
processing of Activities at downtime. If Release All Resources is selected, when the Resource
goes down, all Resources in use at that Activity are released. The Resource that is scheduled
to go down is placed in a down state, and the other resources are available for another Entity
to use. Note that this applies only to Resources assigned at the Activity that is interrupted.
If a resource was obtained at another Activity, such as a Get Resource Activity, no Resources
will be released. Those Resources will remain in a busy state during the time the Resource
that is down remains down. Thus, Release All Resources only applies when all the Resources
in use at an Activity were obtained at the Activity. If Release All Resources is not selected,
none of the other Resources in use at the Activity will be released. They will remain in a busy
state while the Resource that went down remains down. Note that the Release Entities In
Process at Start of Downtime option on the Activity resource usage dialog overrides the Release
All Resources option. If the Release Entities In Process at Start of Downtime option is selected,
the Entity is released from the Activity at the start of the downtime, causing the release of
all other Resources in use by the entity at that Activity.
•
Start Downtime when Resource Queue Empty does not allow a Resource to go down until all
Entities waiting for that resource have been serviced. For example, if there are three Entities
waiting for a Resource because that Resource is busy, and downtime is scheduled to start,
the Resource downtime will not begin until all three Entities have obtained the Resource and
processed. Note that it is possible for a Resource to never go down if the time required to
process the remaining Entities is greater than the Downtime Duration.
SIMPROCESS User’s Manual
351
Resource Downtime
Note about Release All Resources
Care should be used when selecting this option. If more than one
resource is being used at the Activity and one of these resources
that has the Interrupt Activities option and Release All Resources
option turned on goes down, several actions occur:
• All resources being used by the entity that were obtained at the
Activity are released. This allows the resource going down to
go down, and the remaining resources are available for another
entity to use.
•
The entity is placed at the head of the wait queue for each
resource.
•
When the resource is available again, the entity attempts to get
all the needed resources. If all are available, the entity will
continue processing with the remaining time. If the current
Activity is the only Activity where the resources that did not go
down are used, then all the resources should be reacquired
immediately. If not, then it is possible that the resources that did
not go down were obtained by an entity at another Activity and
are not available. Thus, the entity must wait until the other
resources are released.
Creating a Downtime Schedule
To demonstrate the creation of a downtime schedule, some of the periods during which a sales clerk
is not available for work will be defined. Note that this is a local Resource Downtime schedule. If
multiple resources followed the same downtime schedule, then the Resource Downtime should be
defined globally. This downtime will account for:
•
•
•
Daily off-hours (the 16 hours of each 24-hour day that a person is not scheduled to work)
Weekends
Sick days.
A complete model would also need to account for lunch hours, vacation time, and unplanned time off
(jury duty, personal days, acts of nature, etc.).
For this example, assume that sales clerks operate in two shifts. The first shift, composed of 3 clerks,
works from 9 to 5. The second shift, consisting of 2 clerks, works from 2 to 10.
SIMPROCESS User’s Manual
352
Resource Downtime
1.
If the Resource dialog is not already displayed, click on the Define menu bar item, and then
select Resources... Select Clerks from the list of resources, and then click on Edit.
Click on Downtime.
2.
If necessary, set the Start and End dates. The Start and End dates are used in conjunction
with the Start Date and End Date of a simulation run (see “Run Settings” on page 88). Normally Start and End remain empty. When empty, the downtimes will apply to the whole
simulation period. For example, if the simulation is scheduled to run for the year 2004,
and the downtime should apply only to the month of January, then a Start of 1/1/2004 and
an End of 2/1/2004 should be entered. Keep in mind that if the simulation run dates are
entirely outside of the period defined for the downtime schedule, the downtime schedule
will not apply to that simulation.
3. Define the daily hours during which Shift 1 workers do not work. Their weekday work
shift is from 9 to 5, so they are unavailable from 5:00 p.m. to 9:00 a.m. the following day:
Schedule Name
can be anything. For this example it is OffShift1.
For Schedule Type, select Calendar and then select Add.
Select Daily for Type.
For Time (the starting time of the downtime period), enter 17 under HH (1700 hours; 5
p.m.), and 0 under MM and SS. Milliseconds, Microseconds, and Nanoseconds may be
left blank.
In the Number of Units Down field, enter the number 3. This is the number of clerks on
Shift 1.
SIMPROCESS User’s Manual
353
Resource Downtime
Remember that the resource Units of Clerks is 5, so 3 of the 5 will be unavailable during the
period being identified.
is 16.0, the number of hours (since the Duration Units is set to
between the end of one work day and the beginning of the next.
Downtime Duration
Hours)
Unavailability occurs at regularly scheduled times, so select Planned.
Leave Interrupt Activities unselected since the clerks finish their current tasks before
going down.
Click on OK when the definition is complete; OffShift1 is added to the Schedule list.
4. Define the off-shift period for the two Shift 2 workers. Add another daily downtime schedule. Change Time to 22:00, Number of Units Down to 2, and name the schedule OffShift2.
Then click on OK.
5. Define downtime periods to account for the weekend. Begin with Shift 1:
For Schedule Name, call it WeekendShift1.
Schedule Type
is Calendar. The Type is Weekly. A weekend occurs once every week.
When adding a Weekly schedule, a list box with the days of the week appears on the dialog.
Day of Week
is Saturday.
For Date and Time, enter 9 under HH and 0 under MM and SS. Again, Milliseconds,
Microseconds, and Nanoseconds may be left blank.
If a typical weekend begins after work on Friday, remember that the time between 5 p.m.
Friday and 9 a.m. Saturday was accounted for in the OffShift1 period.
SIMPROCESS User’s Manual
354
Resource Downtime
In the Number of Units Down, enter the number 3. This is the number of clerks on Shift 1.
Downtime Duration
is 48.0.
Select the Planned check box.
Click on OK when finished.
6. Add the weekend Downtime period for Shift 2. Change Downtime to 14:00, Number of Units
Down to 2, and name the schedule WeekendShift2.
7. Finally, time unavailable due to illness will be defined. Illness is more complex to model than
weekends or overnights, because it occurs randomly. Random downtime is handled by
specifying a frequency distribution instead of a fixed interval of time. Frequency distributions
will be introduced here to complete the example.
Defining a Random Downtime
Illness is unplanned. Employees are going to get sick, but when it will happen, who it will happen to,
or how long they will be out is unknown. However, reasonable estimates can be made based on past
experience.
To define the Downtime schedule for sick days:
1.
Add a Periodic Schedule Type.
A Periodic schedule is used to describe events that occur at varying intervals of time.
SIMPROCESS User’s Manual
355
Resource Downtime
2.
Time between Downtimes
describes the interval period.
Assume that, in a typical month, one of the five employees comprising the Clerks group
will be out sick for a period of time. Moreover, assume that while a month is typical, the
time between bouts of illness can be as little as three days or as much as a year. To reflect
this, specify a triangular distribution:
Click on the arrow next to the Time Between Downtimes field to display a list of statistical
distributions.
Scroll through the list to the default definition for Triangular distributions. It reads:
Tri(0.0,5.0,10,0)
There are three parameters in this definition: Minimum value, most frequent value (Mode),
and Maximum value. Values are in the Time Unit selected.
Select Tri... from the list.
Click on the box to the right of the arrowhead next to the Time Between Downtimes field.
This displays a dialog for defining the parameters of the distribution:
The following assumptions have been made:
Typically, there is a clerk out sick every 28 days. This is the most likely estimate.
The minimum period between illnesses is 3 days.
The maximum period between illnesses is 1 year (365 days).
SIMPROCESS User’s Manual
356
Resource Downtime
Click on OK.
3.
Set Time Unit to Days.
4.
Set Units Down to 1.
The Units (number of clerks) of this resource is 5. The frequency of downtime applies to one
clerk at a time, not all five.
5.
Downtime Duration
is another variable, random event.
For this model, assume that a clerk is unavailable for at least 24 hours (one sick day), and
no more than 10 days at a time, with most absences lasting two days. Following the procedure
described in step 2, define a triangular distribution with these parameters:
6. Select Days for Duration Unit.
7. Set the Schedule Name to SickTime.
8. The downtime is not planned, so leave the Planned check box blank.
9.
Leave Interrupt Activities unselected.
10. Click on OK to add the definition to the Schedule list.
Click on OK to accept the entire Downtime Schedule.
Defining a Weekly Downtime
The Weekly Downtime schedule is good for resources where availability is based on a schedule. An
employee work schedule is a good example. The Weekly Schedule can be use to schedule the
unavailability of the employee. Consider a Resource that represents an employee that works 0800 to
SIMPROCESS User’s Manual
357
Resource Downtime
1700 Monday through Friday. Thus, the employee resource would be unavailable on weekends and
mornings and evening of weekdays. Two Weekly schedules would set the appropriate downtime.
Below is a Global Resource Downtime that shows two Weekly schedules.
The first schedule, Mornings & Weekends, contains the downtime for each weekday morning and the
weekend. Each Day of Week is selected in this schedule. The second schedule, Evenings, contains the
downtime for each weekday evening. Only the weekdays are selected for this schedule. Note that
Saturday and Sunday on the Mornings & Weekends schedule, and each weekday on the Evenings
schedule has 23:59:59 as the End Time. When 23:59:59 is encountered in the End Time field, the last
second is added so the downtime continues to midnight of the following day. If both Start Time and
End Time contain 00:00:00, then a full 24 hour day is assumed.
See “Defining Downtime Schedules of Resources” on page 347 for information on Number of Units
Down, Planned, and Downtime Options.
SIMPROCESS User’s Manual
358
Resource Downtime
SIMPROCESS User’s Manual
359
Resource Downtime
Defining a Usage Downtime
Sometimes a resource should be unavailable after use. As an example, consider the scenario where
the resource is a rental car. When the rental car is released after use, the resource must be unavailable
for some time to represent the time required to clean, maintain, and refuel the car. A Unit Based Usage
downtime schedule can model this scenario.
To define the Downtime schedule for rental car usage:
1.
Add a Usage Schedule Type.
2. Select Unit Based for Usage Type.
3. Usage Before Downtime sets the number of units that must be used before downtime
occurs. The arrow next to the Usage Before Downtimes field displays a list of statistical distributions. No change is needed since the default of 1.0 is correct. This means every unit of
the rental car resource will go down for a period of time when released.
4. Set Number of Units Down to 1.0.
5. Select the Normal distribution (Nor) for Downtime Duration. The Downtime Duration represents the time required to prepare the rental car for another use. Enter 1.5 for the Mean and
0.5 for the Std Dev.
6. Leave the Duration Units at the default value (Hours).
Modifying a Downtime Schedule
Removing existing Schedule items from a Downtime Schedule is simple: open the global or local
Downtime Schedule, highlight the Schedule item to delete, and click on Remove.
To change a Schedule item, select it from the Schedule list, click on Edit, and then modify the parameters
on the Downtime Schedule dialog. Click on OK to accept the changes.
SIMPROCESS User’s Manual
360
Resource Downtime
The Add button updates the Schedule list box to include the schedule just defined.
The OK button finalizes the changes made to the Downtime Schedule.
The Cancel button exits the Downtime Schedule dialog without accepting any schedule changes made.
SIMPROCESS User’s Manual
361
Event Logs
Event Logs
Time Stamps and Recorders are event logs supported in SIMPROCESS.
Time Stamping is a facility that SIMPROCESS offers for monitoring times between any two events.
For example, start to finish time. The three steps for using Time Stamps are:
•
•
•
Defining Time Stamps
Adding Entry/Exit Event Logs to Processes/Activities
Viewing Time Stamp Reports
Defining Time Stamps
A Time Stamp can be thought of as a label or key that contains the current simulation time. This key
is added to an entity by an Event Log when it either enters or leaves a Process or Activity. Pairs of
keys can be specified and Entity cycle times can be computed between them.
Time Stamping can be performed upon entry (and/or) exit from an Activity. Time Stamp specifications
can be defined between two stamp keys, enabling the monitoring of cycle time & counts between two
Time Stamps.
1.
Select Time Stamps… from the Define pull-down menu.
2.
Select Add to define Time Stamp requirements.
3.
Define Start and Stop keys, select the whether or not to Collect Statistics (results available
in Standard Report), and select plot options (Real-Time Trace Plot, Real-Time Histogram
Plot).
4.
The Set Plot Properties button brings up a plot properties dialog for each plot selected. See
“Setting Plot Properties” on page 202.
5.
Define as many Start and End keys as desired. Press the Close button when finished.
Entry and Exit Event Logs to Processes/Activities
Once Time Stamps have been defined, specify the Process or Activity where they will be attached to
the Entity. The Time Stamp can be added to the Entity upon entry into and/or exit from the Process/
Activity. Time stamps are then added to Entities that traverse this process during simulation execution.
To add a time stamp:
1. A Time Stamp must first be defined using the procedures starting on page 362.
2. Using an Activities/Process Properties dialog, select the Event Logs tab.
SIMPROCESS User’s Manual
362
Event Logs
3. Using the Type combo box, select Time Stamp and press the Add button. The Time Stamp
Properties dialog appears, as shown below.
4. Select either one or more individual Entities by using the Add< button. Check the All Entities box to stamp every entity in the model.
5. Choose either the On Entry or On Exit check boxes for the Time Stamp.
6. Select a Time Stamp Key in the combo box which contains the predefined time stamp labels.
7. Press the OK command button and notice the Time Stamp report name in the Event Logs list box.
Passing Time Stamps Between Entities
When an entity enters a Clone, Split, or Transform Activity, a new instance of an entity type leaves
that Activity. The Original entity, when it leaves a Clone or Split Activity, will continue to carry Time
Stamps that were defined upstream on the entity. The Clone Entities will not, by default, carry those
Time Stamps defined on the Original entity. Clone Entities can also inherit the Time Stamps of the
Original entity.
On the Properties dialog of the Clone Activity, simply click on the Copy Time Stamps check box. This
will cause each instance of the Clone Entities to carry the Time Stamp information inherited from the
Original entity.
To specify that the Clone Entities resulting from a Split Activity inherit Time Stamp information from
the Original entity, edit the Properties of the connector(s) emanating from the Clone pad. Now, click
on the Copy Attributes button. This will open the Copy Entity Fields and Attributes dialog. This dialog
contains the same Copy Time Stamps check box described above.
SIMPROCESS User’s Manual
363
Event Logs
The Properties dialog of the Transform Activity has a Copy Attributes tab that works the same as the
dialog from the Copy Attributes button on the Split connector.
When an entity carrying a Time Stamp is Batched or Assembled, the output entity will not be aware
of the Time Stamp. The output entity must be unbatched in order to register the endpoint of the Time
Stamp (to do this for an Assembled entity, turn on the Batch Component Entities check box on the
Properties dialog of the Assemble Activity).
Differences Between Time Stamps and Recorder Objects
Time Stamps measure time delays during a simulation. How much time an entity spends at one or more
Processes/Activities is captured using Time Stamp keys.
Recorder Objects measure arrival/departure rates at Processes/Activities by recording how many
Entities arrive/depart a Process/Activity over time. The time between arrivals and departures can also
be calculated using Recorders.
Recorders
In addition to Time Stamps, Recorders will write the arrival or departure time of an entity at a Process/
Activity into a file called recorder.txt. The file can be examined after the simulation to observe
the actual times a specific Entity arrived or departed from specific Processes/Activities.
1.
Using an Activities/Process Properties dialog, press the Event Logs tab. The Event Logs tab
lists the currently defined Time Stamps and Recorder objects (either On Entry or On Exit).
2. Using the Type combo box, select Recorder and choose the Add button. The Recorder Properties
dialog appears, as shown below.
SIMPROCESS User’s Manual
364
Event Logs
3.
Choose to record arrival times (On Entry) or departing times (On Exit) of the Entities in this
Process/Activity.
4.
Select the Entities to record. If the All Entities check box above the list box is selected, all
Entities in the list box will be recorded
5.
Choose OK to leave the dialog when finished entering data, confirming the current selections.
The Cancel button rejects the current dialog selections.
6.
The Event Logs tab shows the defined Recorders (either On Entry or On Exit) along with current
Time Stamps.
SIMPROCESS User’s Manual
365
Part C
Advanced SIMPROCESS Tools
The chapters in this section describe the advanced tools and the database included with SIMPROCESS Professional.
SIMPROCESS User’s Manual
366
CHAPTER 12
Advanced Data Analysis
SIMPROCESS comes with two data analysis tools that extend the ability to conduct statistical data
analysis: ModelFit and ExpertFit.
ModelFit provides automated fitting of distributions from sample data. It is used with the
SIMPROCESS Auto Fits feature (see “Auto Fits Distributions,” beginning on page 101).
The ExpertFit tool:
•
•
•
•
•
•
Increases the accuracy of experiments
Decreases the time to find the solution to the problem
Provides a statistical software tool tailored to the statistical simulation environment
Provides a unique graphical user interface
Performs data analysis
Models random processes
SIMPROCESS User’s Manual
367
ExpertFit is used to analyze data and construct a data model of the random process that generated the
data. An introduction to the statistical background for data analysis and data modeling is provided in
the following section, “An Introduction to Data Analysis and Modeling.”
SIMPROCESS User’s Manual
368
An Introduction to Data Analysis and Modeling
An Introduction to Data Analysis and Modeling
Introduction
Probability distributions are a way of describing the random variations that occur in the real world.
Although the variations are called random, there are different degrees of randomness, and the different
distributions correspond to how the variations occur. Consequently, different distributions are used
for different purposes.
Probability distributions are represented by probability density functions. Probability density functions
show how likely a certain value is. The more likely the value, the larger the probability density function
at that point. The total probability at all points should sum to 100%, so the area under a probability
density function is equal to one.
Cumulative density functions give the probability of selecting a number at or below that value. For
example, if the cumulative density function value at 1.7 was equal to .75, then 75% of the time, selecting
from that distribution would give a number less than 1.7. The value of a cumulative density function
at a point is the area under the corresponding probability density curve to the left of that value. Since
the total area under the probability density function curve is equal to one, a move towards more positive
values in a cumulative density function approaches one.
Knowledge of all these details is not needed to effectively model a situation. Knowing which
distribution best fits the data is most important. The curve fitting capabilities of ModelFit and ExpertFit
make it easy to find the correct distribution for data.
In addition, standard distributions can be examined visually for different combinations of input
parameters.
Standard Statistical Indicators
There are several statistical indicators that can tell a lot about the distribution of random values. Consult
an introductory statistics textbook for detailed discussions of these indicators. This section simply gives
their meanings and some of their implications. More definitions can be found in the “Statistical Tools
Glossary,” beginning on page 505 at the end of this manual.
The mean is the most important characteristic of a data sample. Always try to get a good value for
the mean (from actual data, if possible) if the scenario represents a time to complete some task or the
number of arrivals in a certain time period.
The mode is the most likely value in a set of data. Consider the following list of numbers:
SIMPROCESS User’s Manual
369
An Introduction to Data Analysis and Modeling
2, 3, 3, 3, 9, 10
The mode for this set of data is 3, since it occurs most frequently. The mean for this set of data is 5.
If a distribution is symmetric about the mean, and singly-peaked, then the mode and the mean will
be equal. In this case, the distribution contains a couple of large values which shift the mean away
from the mode.
As discussed later, the mode is an important parameter for specifying a triangular distribution.
The standard deviation is a simple measure of the spread in the data. It is calculated by finding the
mean, summing the squares of all the differences between the mean and the data points, taking the
square root of this value, and then dividing by the square root of the number of data points. Loosely,
it is the average difference from the mean. Why are the square and square root are taken? Because
the result would be zero if just the differences were summed!
The standard deviation is a measure of how much spread there is in the data. If the standard deviation
is large, there is a wide variation in the data. If it is small, the data are tightly clustered around the mean.
The standard deviation is a necessary piece of information for many standard distributions. The
variance is the standard deviation squared.
Most of the parameters for continuous distributions can be classified, on the basis of their physical
or geometric interpretation, as being one of three basic types: location, scale, or shape parameters. The
following discussion is taken from the book Simulation Modeling and Analysis (Third Edition) by Law
and Kelton (2000).
A location parameter l specifies an abscissa (x axis) location point of a distribution's range of
values; usually, l is the midpoint (e.g., the mean of a normal distribution) or lower endpoint (e.g.,
location for a Pearson type V distribution) of the distribution’s range. As l changes, the associated
distribution merely shifts left or right without otherwise changing. Also, if the distribution of the
random variable X has a location parameter of 0, then the distribution of the random variable Y
= X + l has a location parameter of l.
A scale parameter b determines the scale (or unit) of measurement of the values in the range of
the distribution. (The standard deviation is a scale parameter for the normal distribution.) A change
in b compresses or expands the associated distribution without altering its basic form. Also, if
the random variable X has a scale parameter of 1, the distribution of the random variable Y = bX
has a scale parameter of b.
A shape parameter a determines, distinct from location and scale, the basic form or shape of a
distribution with the general family of distributions of interest. A change in a generally alters a
distribution's properties (e.g., skewness) more fundamentally than a change in location or scale.
Some distributions (e.g., exponential and normal) do not have a shape parameter, while others
(e.g., beta and Pearson type VI) may have two.
A probability density function is a representation of a statistical distribution. The probability density
SIMPROCESS User’s Manual
370
An Introduction to Data Analysis and Modeling
function is large for likely values sampled from a distribution and is small for unlikely values. The
maximum value for the probability density function is equal to the mode for that distribution. The area
under the probability density function curve within a certain range of values gives the probability of
sampling from that distribution and getting a number within that range. Of course, the total area under
the curve must be equal to one, since a number from the distribution must be less than or equal to one.
A confidence interval is the range of values a certain percentage of the population would be expected
to fall into if the sample were drawn from a normal distribution. Plus or minus one standard deviation
corresponds to about a 68% confidence interval; plus or minus two standard deviations corresponds
to about a 95% confidence interval; and plus or minus three standard deviations corresponds to about
a 99.7% confidence interval.
SIMPROCESS User’s Manual
371
Why Statistical Simulation Experiments?
Why Statistical Simulation Experiments?
Mean-Value Analysis
Mean-value analysis is a simple, although often quite useful, approach to modeling. The basic
philosophy is to model processes by their average output.
For example, suppose there is a station that can process five parts per hour, and on average four parts
arrive every hour. Mean-value analysis shows that the station should be able to handle the expected load.
However, in the real world there might be some hours the station may process only three parts, and
other hours it may process seven. Likewise, there may not be a perfectly steady flow of four parts into
the station every hour. Sometimes there may be more and sometimes less.
This statistical nature of the real world will lead to a diminished throughput, for there will be times
when the station is idle, and other times when it is backed up, disrupting the flow to and from it in
the rest of the factory. This is the limitation of mean-value analysis, and the reason that simulation
is necessary for accurate predictions.
The Importance of Experimental Data
It is very important to have experimental data as the basis of a model. This may seem like a paradox:
If I am modeling something that does not exist, where will I get the experimental data?
This is not as big a problem as it sounds. The individual components of a similar existing system will
probably be close enough to ones in the proposed system to be useful in the model. The data do not
have to be exhaustive, any data is much better than no data.
In fact, a good test of the model building process is to build a model of an existing system and check
how closely the model and the system match up. This can often be a key to convincing others of the
validity of the simulation modeling approach.
SIMPROCESS User’s Manual
372
SIMPROCESS Statistical Distributions
SIMPROCESS Statistical Distributions
The following table contains the statistical distributions available in SIMPROCESS. Other
distributions can be created from these using the Define Distributions function. See “Statistical
Distributions” on page 477 for descriptions of each distribution.
Beta Distribution
Bet(shape1, shape2, minimum, maximum, stream)
Binomial Distribution
Bin(trials, probability, stream)
Erlang Distribution
Erl(mean, shape, stream)
Exponential Distribution
Exp(mean, stream)
Gamma Distribution
Gam(mean, shape, stream)
Geometric Distribution
Geo(probability, stream)
Hyper Exponential Distribution
Hex(mean1, mean2, probability1,
stream)
Inverse Gaussian Distribution
InG(location, scale, shape, stream)
Inverted Weibull Distribution
InW(location, scale, shape, stream)
Uniform Integer Distribution
Int(minimum, maximum, stream)
Johnson SB Distribution
JSB(minimum, maximum, shape1,
shape2, stream)
Johnson SU Distribution
JSU(location, scale, shape1, shape2,
stream)
Log-Logistic Distribution
LLg(location, scale, shape, stream)
Log-Laplace Distribution
LLp(location, scale, shape, stream)
Lognormal Distribution
Log(mean, standard deviation,
stream)
Negative Binomial Distribution
NgB(s, probability, stream)
Normal Distribution (non-negative)
Nor(mean, standard deviation,
stream)
Normal Distribution (unbounded)
Nrm(mean, standard deviation,
stream)
Pareto Distribution
Par(location, shape, stream)
Poisson Distribution
Poi(mean, stream)
SIMPROCESS User’s Manual
373
SIMPROCESS Statistical Distributions
Pearson Type V Distribution
PT5(location, scale, shape, stream)
Pearson Type VI Distribution
PT6(location, scale, shape1, shape2,
stream)
Random Walk Distribution
RnW(location, scale, shape, stream)
Triangular Distribution
Tri(minimum, mode, maximum)
Uniform Distribution
Uni(minimum, maximum, stream)
Weibull Distribution
Wei(shape, scale, stream)
SIMPROCESS User’s Manual
374
CHAPTER 13
SIMPROCESS Database
The Windows version of SIMPROCESS includes a Microsoft Access 2000 database
(SimProcDB.mdb) designed to hold simulation results from simulation runs. This database includes
predefined queries, graphs (forms), and reports, each of which can be modified to tailor the database
for output analysis. The procedures for connecting the database to SIMPROCESS using ODBC are
explained in the Getting Started Manual. (An Access 97 database is available upon request.)
SIMPROCESS can use other non-Access SQL databases by making appropriate entries in the
sProcDB.properties file provided by the installer. This file is installed on both Windows and
non-Windows systems and is pre configured for use with the Access database described above.
Additional information is included in this chapter to aid in using a non-Access SQL database patterned
after the Access database (SimProcDB.mdb) to hold simulation results.
Note that the discussion in this chapter is only concerned with storing simulation results in
SimProcDB.mdb or in a user-created SQL database patterned after SimProcDB.mdb. There are
expression statements that allow SIMPROCESS to read from or write to any SQL database. See
“Interfacing With A Database” on page 296 for more information.
SIMPROCESS User’s Manual
375
Committing Results to the Database
Committing Results to the Database
To commit simulation results to the database, select Commit to Database from the Report menu. The
menu item will not be enabled until a simulation run is complete (either terminating normally or user
terminated). If the database is not found, an error dialog will appear. If this occurs, recheck the database
connection through the ODBC control panel if using the Access database, or recheck the values in
the sProcDB.properties file. Normally, the Commit To Database dialog will appear. A design
name and scenario name must be entered. The design and scenario comments are optional. What
constitutes a design will be discussed in the next section.
Once the information has been entered, click on Commit. At this point SIMPROCESS verifies that the
design name and scenario name are allowable. If so, the results are stored in the database. When
finished, the status bar shows Commit Complete.
SIMPROCESS User’s Manual
376
System, Design, and Scenario
System, Design, and Scenario
Three tables in the database control the results placed there: System, Design, and Scenario. The System
table is the highest level table and contains the model name. Therefore, the database is designed to
hold results from more than one model. If a record is deleted from the System table, all records related
to that model are deleted from the Access database. (In order for this to be true in another SQL database,
the appropriate relationships and/or constraints must be established when the database is created.) The
Design table holds data from different versions of the same model. A model design consists of the
following:
•
•
•
•
•
•
•
•
•
•
•
•
Number of entity types
Entity type names
Number of resources
Resource names
Resource costs
Number of Activities, Processes, and Process alternatives
Names of Activities, Processes, and Process alternatives
Activity/Process structure
Start and End date
Start and End time
Number of replications
Output time units.
If any of the above change, then a new design name is required. For instance, assume results have been
committed to the database with a design name of Design 1. After that a Process alternative is added
to the model and the model is run again. If the same design name as before is used, SIMPROCESS
will prompt for a new design name because the number and names of Process alternatives have changed.
Note that there will be no prompt for a new design name if a different alternative is run that was already
in the model. If another alternative is run, the design name or scenario name can be changed. When
a design is deleted from the Design table, all records associated with that design are removed from
the Access database. (In order for this to be true in another SQL database, appropriate relationships
and/or constraints must be established when the database is created.) Therefore, to reuse a design name
for the same model name (and there has been a design change), first delete the design.
SIMPROCESS User’s Manual
377
System, Design, and Scenario
A scenario is used to track various runs of the same system (model) and design. For example, one run
might have a certain resource level at 3 while another run has the same resource level at 4.
Differentiating those runs in the database is done through the scenario name. The scenario comment
field is a good place to document the important settings for that scenario. Again, if a scenario is deleted,
all records associated with that scenario will be deleted from the Access database. (As before, in order
for this to be true in another SQL database, appropriate relationships and/or constraints must be
established when the database is created.)
In the Access database, the Manage Results form should be used to delete results for a Model (System),
Design, or Scenario. DO NOT modify the tables directly. Using the Manage Results form ensures the
tables do not become corrupted. This form can be run from the Forms tab in Access. Also, when using
Launch Database Application from the Report menu, the Manage Results form launches automatically.
If the form is blank, then there are no run results in the database.
The Launch Database Application menu item is only enabled on Windows systems. It will be enabled
even if the sProcDB.properties file is configured for a non-Access database.
IMPORTANT: It is good practice to regularly compact the Access database, particularly after deleting
records. This can be done from the Tools menu of Access by choosing Database Utilities.
SIMPROCESS User’s Manual
378
Database Table Relationships
Database Table Relationships
Select Relationships... from the Tools menu in Access to view all the tables and the relationships between
them in the Access database.This is helpful in understanding how the queries were constructed.
Because other database tools may or may not support constraints and relationships in the same way
as Access, it will be up to the user to create comparable mechanisms there if desired.
SIMPROCESS User’s Manual
379
Database Queries
Database Queries
The predefined queries in the SIMPROCESS Access database are designed to offer the same
information provided in the Standard Report. (See “Standard Report” on page 186.) The queries can
be used as-is or copied and modified. The queries are not restricted by system, design, or scenario.
So when the Entity Cycle Time query is run, all entity cycle times without restriction will be displayed.
Copying a query and restricting its search is one example of tailoring a query for analysis.
All of the queries were created in Access’ Design View rather than SQL. Shown below is the Design
View of the Entity Count query.
Even though the whole criteria cannot be seen, note that the StatType field from the Statistics table is
restricted by “Total Entities generated” or “Entities remaining in system” or “Total Entities disposed.”
SIMPROCESS User’s Manual
380
Database Queries
These are the statistics types that make up Entity Count. Other fields could be restricted as well. For
instance, the SystemName field from the System table could be restricted so only one model’s results
would be available. In the example below the query to the demonstration model CallCenter is restricted
by placing “CallCenter” in the Criteria row of the query under SystemName.
The queries that generate results across replications were developed using the queries that give results
by replication. So if the Entity Count query is restricted to CallCenter, then the Entity Count Across
Replications query will also be restricted to CallCenter. Looking at the Design View for Entity Count
Across Replications, the only data source for the query is the Entity Count query.
The average, standard deviation, minimum, and maximum were determined by selecting the
appropriate statistic in the Total row for the field from the Entity Count query that was to be summarized
across replications. This was accomplished by not including the Replication field from the Entity Count
query.
SIMPROCESS User’s Manual
381
Forms (Graphs) and Reports
Forms (Graphs) and Reports
The Forms tab contains the predefined graphs plus the Manage Results form. These graphs are based
on the predefined queries. Therefore, the Entity Count Across Replications form (or graph) is based on
the Entity Count Across Replications query. In order to restrict the graph to only certain records, go to
the original query (in this case Entity Count since Entity Count Across Replications is based on it) and
restrict it.
The Reports tab contains the predefined reports. Like the graphs, the reports are based on the predefined
queries. Therefore, the Entity Count report is based on the Entity Count query. In order to restrict the
report to only certain records, go to the original query (in this case Entity Count) and restrict it.
SIMPROCESS User’s Manual
382
Forms (Graphs) and Reports
When using a non-Access SQL database, the predefined queries, graphs and reports described in this
chapter may serve as a basis for developing SQL statements for retrieving and analyzing database
contents. Those using SIMPROCESS on non-Windows systems where the SimProcDB.mdb file is
not installed may obtain a copy for reference at the SIMPROCESS web site, or contact SIMPROCESS
Technical Support for assistance.
SIMPROCESS User’s Manual
383
Launch Database Application
Launch Database Application
This menu item on the Report menu (only enabled on Windows systems) brings up a dialog that selects
the database and database application to use. SimProcDB.mdb and Microsoft Access are the defaults.
(The remaining portion of these instructions assume MS Access is the database application.) If the
database field is blank, then Access will start and prompt to open a database. If only a database is in
the field (with no path), SIMPROCESS assumes the database is in the SPUser directory. If this is
not the case, Access will start and prompt for a database. When the database desired is not in SPUser,
enter the full path, and Access will open with that database.
If SimProcDB.mdb is entered in the database name field, the Manage Results form will launch
automatically when the database opens. If other actions are desired, simply close the form and continue.
Always use the Manage Results form to delete records from SimProcDB. If the tables are edited directly,
they could become corrupted and run results placed in the database would be lost. The Manage Results
form can be launched from the Forms tab. Copies of SimProcDB.mdb may be used for results. However,
the Manage Results form will not launch automatically.
SIMPROCESS User’s Manual
384
SIMPROCESS and Other Databases
SIMPROCESS and Other Databases
Most of this chapter assumes the use of the Microsoft Access database with SIMPROCESS. Those
not using Windows will be compelled to use another database, and Windows users may wish to have
the flexibility to do so. This section will provide information which those users must know to employ
another database for analyzing results.
To store results in any database, SIMPROCESS must have the file sProcDB.properties in the
SPUser directory. The one provided by the installer is configured for use with the Access database.
Also included there are two example files which can aid in using another SQL database:
• mysql.sProcDB.properties
• simprocessdb.sql
The mysql.sProcDB.properties file is an example of what needs to be put into the
sProcDB.properties file in order to use MySQL, a popular open source database, with
SIMPROCESS. It contains two required properties and others that are commented.
• jdbc.drivers - This property must provide the fully qualified name of a Java class which is
•
•
•
a JDBC driver compatible with the database to be used. The one in this example is from the
MySQL Connector/J driver, available with MySQL at www.mysql.com. The driver must be
in the SIMPROCESS classpath at runtime, so the JAR file containing it should be placed into
the jre/lib/ext directory under the SIMPROCESS installation directory (see “Java Extension Mechanism,” beginning on page 603 for more information).
jdbc.url - This property identifies a specific database and is used to connect to it via the driver named above. Details on the possible forms and values of this property will be documented
with available Java JDBC drivers. It is important to note, however, that SIMPROCESS will assume that any value beginning with "jdbc:odbc" is the Access database. The example in this
file shows using a MySQL database named "simprocess" on the local system.
jdbc.username - This property is disabled in the example. If the database configuration requires a user name, remove the "#" to enable the property and give it an appropriate value.
jdbc.password - This property is disabled in the example. If the database configuration requires a user password, remove the "#" to enable the property and give it an appropriate value.
The simprocessdb.sql file is an example of Data Definition Language (DDL) for creating a
database in MySQL that is suitable for use with SIMPROCESS. The file contains necessary DDL
statements to drop and create a database named "simprocess" and then to create each of the tables needed
for storing simulation results, some of which require insertion of static data. While the Access database
contains some tables and/or columns with spaces in their names, this DDL uses underscore characters
instead. When the value of the jdbc.url property does not begin with "jdbc:odbc", SIMPROCESS
will use these names to allow support for the widest range of SQL databases. Other features, such as
foreign keys, referential integrity, cascading deletes, etc., are not supported by all databases, a fact
which should be considered in the management of any selected SQL database.
SIMPROCESS User’s Manual
385
SIMPROCESS and Other Databases
The DDL statements in this example name the database tables and columns using the same case that
SIMPROCESS uses in its internal SQL statements, though not all databases will require or respect
case. For instance, testing showed that MySQL server 3.23.52 insisted that table names in SQL
statements match the case used in the DDL, while MySQL server 4.0.14-standard allowed the use of
all lower case names irrespective of the DDL used.
The included MySQL examples were tested with SIMPROCESS in the following environments:
• SIMPROCESS on Linux, MySQL server 3.23.52 on the same Linux host
• SIMPROCESS on Windows, MySQL server 3.23.52 on a Linux host via LAN
• SIMPROCESS on Windows, MySQL server 4.0.14-standard on a Mac OS X host via LAN
SIMPROCESS users are encouraged to send information to the SIMPROCESS Technical Support
team about their own experiences with other non-Access SQL databases. Reports of good (or bad)
JDBC drivers for various databases are welcomed. Please send compressed example files similar to
these to [email protected]. When sending such reports and/or examples, please be sure and
provide as much detail as possible about any special circumstances, platforms involved, etc., and
indicate whether it’s all right to share any samples with others.
SIMPROCESS User’s Manual
386
CHAPTER 14
Experiment Manager
The Experiment Manager sets up model runs that SIMPROCESS will run automatically and,
optionally, after each run, place the results in the database. This is accomplished by defining
experiments in SIMPROCESS, which are stored in Experiments.xml in the SPUser directory.
SIMPROCESS reads the information from Experiments.xml, loads the appropriate model, runs
the model, then (optionally) commits the results to the database.
The four items on the Experiment menu control the operation of the Experiment Manager.
•
•
•
•
Define Experiments
Run All Experiments
Run Selected Experiments
Run Specific Experiment
SIMPROCESS User’s Manual
387
Defining Experiments
Defining Experiments
An experiment can have multiple models, a model can have multiple designs, a design can have
multiple scenarios, and a scenario can (optionally) have multiple Model Parameters (page 242) and
Process Alternatives (page 84). Selecting Define Experiments/Using SIMPROCESS... brings up a dialog
experiment information is entered.
If no experiments have been defined, everything is disabled except the Experiment combo box. If there
are already experiments defined, the first experiment appears in the Experiment combo box, and all
appropriate items are active. To add to or modify an experiment already defined, select an experiment
from the Experiment combo box. There may be a slight delay when a predefined experiment is selected.
This is because the first model for the experiment must be loaded and then processed.
Entering Experiment Information
There are five fields that require entries for each experiment: Experiment, Selected, Display Error
Alerts, Turn Off Animation, and Commit Results To Database. This shows an example experiment
called Purchasing. Type the name in the Experiment combo box, then press Enter. If not already
active, entering an experiment name causes the remaining items on the Experiment Setup tab and the
Model Setup tab to activate.
SIMPROCESS User’s Manual
388
Defining Experiments
Once the experiment has been named, then check or uncheck Selected. The default is checked.
is used as an option for running experiments. Display Error Alerts defaults to unchecked. If
unchecked, then SIMPROCESS will run the experiment without stopping to notify of errors. This
means SIMPROCESS will run every combination of model, design, and scenario that it can. Those
with errors will be skipped over. If Display Error Alerts is checked, when SIMPROCESS encounters
an error when running the experiment, an error dialog will display that will stop the experiment
until the error has been acknowledged by the user. Turn Off Animation defaults to checked. If
checked, all models in the experiment will run with animation turned off. Commit Results To Database defaults to checked as well. When selected, the results from each run will be placed in the
SIMPROCESS database. Multiple experiments can be entered. Although not necessary, it is recommended that model, design, and scenario information be entered before adding another experiment.
Selected
Entering Model Information
The next tab is Model Setup. This tab is active when an experiment name is entered or selected on
the Experiment Setup tab. To select a model, click the Add Model button. This brings up a file
chooser dialog. The complete path and the name of the model selected is added to the Model combo
box. All models added are part of the experiment that was selected on the Experiment Setup tab.
Although multiple models can be entered before entering design and scenario information, it is
recommended that all the design and scenario information (along with parameter and process
information, if needed) be entered before entering the next model. If the selected model is moved
after being added to an experiment, the model and all associated experiment information (design,
scenario, etc.) will be deleted from the experiment the next time Define Experiments/Using
SIMPROCESS User’s Manual
389
Defining Experiments
SIMPROCESS...
is selected.
Entering Design Information
The Design Setup tab is active when a model is selected in the Model combo box on the Model Setup
tab. At least one design name is required for each model. The Design Comment and Number of Reps
fields are optional. If no value (integer only) is entered for Number of Reps, the last saved model
value will be used for each scenario in this design unless there was a previous design for the same
model. One design called “5 Reps” is entered for the model C:\Program Files\SIMPROCESS\models\Demos\Purchasing.spm.
SIMPROCESS User’s Manual
390
Defining Experiments
Entering Scenario Information
The Scenario Setup tab is active when a design is selected in the Design combo box on the Design Setup
tab. At least one scenario must be entered for each design. If creating a new scenario, a name for the
scenario must be entered in the Scenario combo box. The Scenario Comment field is optional. At this
point no more information is required to run a scenario.
Publishing the results of this scenario run to HTML is optional. If Publish Model To HTML is selected,
a value for Publish Directory must be entered. The Publish Directory is the destination directory for the
HTML output. The name of the directory created for the HTML files is the model name with any spaces
replaced by underscores. If a directory with this name already exists within the selected destination
directory, either select another destination directory, or rename, move, or delete the existing directory.
For instance, in the example below, the directory of the model Purchasing.spm was selected as
the destination directory. This means the publish process will create a directory named Purchasing
within the Purchasing directory. If a directory named Purchasing already existed in
C:\Program File\SIMPROCESS\models\Demos\Purchasing, an error would occur. So
for this example, the HTML files will go in the C:\Program
Files\SIMPROCESS\models\Demos\Purchasing\Purchasing directory. Thus, if
multiple runs of the same model are to be published, a unique destination directory will need to be
assigned for each scenario. Usually, if used at all, only one scenario for each model is published to
HTML.
Setting Model Parameter values and Process Alternatives is optional. If these are not set, then the last
saved value for each Model Parameter and Process Alternative are used. Model Parameters are set on
the Parameter Setup tab, and Process Alternatives are set on the Process Setup tab. These tabs are part
SIMPROCESS User’s Manual
391
Defining Experiments
of the Scenario Setup tab.
Entering Model Parameter Information
The Parameter Setup tab is used to enter Model Parameter values. The attributes for the selected
model that have been designated as Model Parameters appear in the table. When a Model Parameter
is selected, its description (comment from the attribute definition), mode (Integer, Real, or String),
and default value are displayed in the text fields below the table. Once selected, the value can be
changed by typing into the field on the table. Values entered that do not match the mode will not be
accepted. The Reset button will reset the selected Model Parameter to its default value. The Reset All
button resets all Model Parameters to their default values. In this example there are three Model
attributes that can be changed for a scenario. (When changing selected scenarios, there may be a
slight lag for the Model Parameter values to update. This is due to the processing required to update
the values.)
SIMPROCESS User’s Manual
392
Defining Experiments
NOTE
If no Model Parameter information is entered for a scenario,
then the model will run with the last saved values for the
Model Parameters. If a parameter has been changed for a
scenario, and the next scenario uses the same model (that is,
a new model is not loaded), then the Model Parameter will
have the same value as the previous scenario. It will not reset
to its default value.
Entering Process Alternative Information
The Process Setup tab is used to set the active alternatives for processes that have more than one
alternative. The panel on the left displays the processes in the selected model that have more than
one alternative. (Since processes are displayed by name, it is recommended that process names not
be duplicated within a model.) Once a process is selected, the alternatives for that process will
appear in the panel on the right. If an alternative has already been selected, that alternative will be
highlighted. If no alternative is highlighted then the model will run with the alternative that was
active during the last save of the model. Select the alternative to be active for the current scenario.
SIMPROCESS User’s Manual
393
Defining Experiments
In this example the Centralized, Functional alternative for the Purchasing process will be active
for the current scenario.
NOTE
If no process/alternative information is entered for a
scenario, then the model will run with the last saved active
alternative for each process. If an alternative has been
changed for a scenario, and the next scenario uses the same
model (that is, a new model is not loaded), then the active
alternative for a process will be the same as the previous
scenario unless a different alternative is specified in the
Experiment Manager.
Undo Delete Button
The Undo Delete button is active whenever an experiment, model, design, or scenario has been deleted.
The button remains active until used or until the scope of the deleted item has been lost. An experiment
can be restored any time before another delete occurs. A model can be restored as long as the experiment
to which it belongs remains the selected experiment. A design can be restored as long as the experiment
and model to which it belongs remain selected. Finally, a scenario can be restored as long as the
experiment, model, and design to which it belongs remain selected.
SIMPROCESS User’s Manual
394
Running Experiments
Running Experiments
Once the experiments have been defined, run the experiments. This section discusses starting
experiments, the operation of experiments, how to interact with experiments, and how to generate
standard reports from experiments.
Starting Experiments
There are three options for running experiments.
•
•
•
Run All Experiments
Run Selected Experiments
Run Specific Experiment
Run All Experiments
The menu item Run All Experiments causes SIMPROCESS to attempt to run every experiment defined.
This option ignores the Selected field.
Run Selected Experiments
When this menu item is selected, SIMPROCESS attempts to run the experiments in which the Selected
field is checked.
Run Specific Experiment
This menu item specifies one experiment to run. When selected, enter the experiment name in the
dialog.
If no match occurs, an error message appears stating the experiment could not be found in the database.
Case does matter when selecting a specific experiment. The case and spelling must match.
SIMPROCESS User’s Manual
395
Running Experiments
SIMPROCESS User’s Manual
396
Experiment Operation
Experiment Operation
The Experiment Manager operates as follows when running experiments:
Once an experiment begins, SIMPROCESS begins a sequence of steps. Each step occurs if the
previous completes successfully. The steps to running experiments are:
1. Load Experiments.xml.
2. Prompt to save current work if necessary.
3. Enter a loop with sub loops.
Find Experiment.
Find Model.
Find Design.
Find Scenario.
Find Parameters.
Find Process Alternatives.
Load Model.
Verify Design.
Run Model.
Commit results to database.
End loop.
End loop.
End loop.
End loop.
4. Display status message on success of experiments.
Experiment Trace
During experiment execution, the Experiment Manager displays a trace showing the steps that have
been completed and the current step. The trace includes the date, time, and a message.
SIMPROCESS User’s Manual
397
Experiment Operation
It is important to examine the Experiment Manager trace, since it will give the complete status of the
experiments. The above example shows the experiment, alert dialog status (see below), model, design,
and scenario. Also, it shows the Process Alternatives that were active and the values of the Model
Parameters for the scenario.
Experiment Errors
As explained in the instructions for defining experiments, when the Display Error Alerts field is not
selected, interactive error messages are suppressed. However, error messages will appear in the
Experiment Manager trace. The Experiment Manager trace shows which experiments completed
successfully and which encountered errors. Especially important are the messages that show errors
with the Model Parameters.
When the Display Error Alerts field is selected, error dialogs will appear that pause the Experiment until
the error is acknowledged.
SIMPROCESS User’s Manual
398
Experiment Operation
Also, after the error displays, if there are more experiments to be run, a dialog appears with the
option to stop all experiment runs.
If experiments are to be run overnight, it is recommended that the Display Error Alerts field not be
selected for every experiment that is to be run. That way SIMPROCESS will run every combination
of Experiment, Model, Design, and Scenario that it can. Otherwise, if an error occurs, processing stops
until the error is acknowledged.
Interacting With Experiments
A model run by the Experiment Manager can be interacted with in the same manner as a model that
was user initiated. This means the animation can be turned on or off, the animation settings can be
changed, the model can be navigated, etc.
Experiments can be stopped early by stopping a model run. An experiment cannot be stopped while
loading experiment information, loading a model, or committing results to the database. If the Display
Error Alerts field is selected, there will be an option to stop completely. Otherwise every run must be
stopped to stop all experiment, model, design, and scenario combinations.
Generating Standard Reports From Experiments
If selected, the Experiment Manager automatically commits the run results to the database. If an ASCII
version of the Standard Report is needed, go to Define Global Statistics Collection on the Report menu.
Select Generate Standard Report after run. This will create a file in the model’s directory that will contain
the report for every replication, the sum of the replications, and the average of the replications.
SIMPROCESS User’s Manual
399
Experiment Operation
SIMPROCESS User’s Manual
400
CHAPTER 15
OptQuest for SIMPROCESS
In today's highly competitive global environment, people are faced with many difficult decisions, such
as allocating financial resources, building facilities, managing inventories, determining product mix
strategies, and more. Modeling a decision problem in SIMPROCESS discovers what performance
measures can be expected using a certain strategy.
A strategy can be defined as a certain set of values for the model parameters. Other words for strategy
include scenario and solution. Note that “solution” refers to the model parameter values (inputs to the
simulation), not the resulting values of the performance measures.
Suppose the goal was to find the best strategy (without using OptQuest). Model parameter values for
a strategy being considered would have to be entered into SIMPROCESS and the results analyzed.
Then, this process would have to be repeated for every strategy under consideration. (Experiment
Manager automates running models with various values for model parameters. See “Experiment
Manager” on page 387.) Often, it would not be clear how to adjust the model parameters from one
simulation to the next. This type of search is tedious and, in problems with thousands or millions of
potential alternatives, impractical.
OptQuest enhances SIMPROCESS by automating the search for an optimal strategy.
Note that OptQuest for SIMPROCESS is licensed separately from SIMPROCESS.
SIMPROCESS User’s Manual
401
Overview of OptQuest for SIMPROCESS
Overview of OptQuest for SIMPROCESS
Since OptQuest is an optimization tool, it is attempting to minimize or maximize the value of a
performance measure based on limits (constraints, upper bounds, and lower bounds). OptQuest
automatically runs SIMPROCESS models varying the values for the model parameters searching for
optimum results within the specified limits.
When the optimization runs:
OptQuest feeds a potential solution into SIMPROCESS model by setting the decision variable
(model parameter) values.
SIMPROCESS runs one simulation (which may include multiple replications) to evaluate the
solution.
OptQuest takes the resulting response values from SIMPROCESS.
OptQuest analyzes the results of the simulation and uses its intelligent search procedures to generate a new potential solution, which it then sends to SIMPROCESS.
OptQuest repeats this process. Its ultimate goal is to find the solution that optimizes (maximizes or
minimizes) the value of the model’s objective.
Elements of an OptQuest Optimization
Optimizations consist of an objective (minimize or maximize), decision variables, and constraints
(constraints are optional).
Objective: An expression that represents the model's objective, such as minimizing queues or
maximizing profits.
Decision Variables: Variables that can be meaningfully manipulated to affect the performance of a
simulated system. The model parameters in SIMPROCESS are called decision variables in OptQuest.
Constraints: Relationships among decision variables and output variables. For example, a constraint
might ensure that the total amount of money allocated among various investments cannot exceed a
specified amount, or the processing time of a system cannot be greater than a certain value.
There can be bounds (upper and lower) on the decision variables and performance measure constraints
(statistics).
Using OptQuest: An Overview
Follow these steps to use OptQuest.
SIMPROCESS User’s Manual
402
Overview of OptQuest for SIMPROCESS
Create a simulation model, or open a simulation model.
Prepare the model for optimization. This includes creating and assigning model parameters,
establishing a performance measure to optimize, making sure the model is complete, verifying and
validating the model, and making sure the model runs with no errors.
Set up the optimization, or select previous optimization settings (Tools/OptQuest menu). The following
steps apply to creating a new optimization. Previously defined optimization settings can be modified
or deleted.
a. Define the objective.
b. Select the decision variables.
c. Define constraints.
d. Set process alternatives.
e. Select optimization options.
Run the optimization. When Start is selected, the model is saved, and the OptQuest interface appears.
From this interface the user can monitor the optimization, stop the optimization, and create reports
once complete. Also, if selected, OptQuest will prompt for more iterations when approaching the
maximum iteration.
Interpret the results.
SIMPROCESS User’s Manual
403
Optimization Setup
Optimization Setup
Preparing for Optimization
In order to use OptQuest with a model, the model must have model parameters of type Integer and/
or Real. Model parameters are user controlled values that typically set some of the initial conditions
of a simulation. For instance, if Truck is a resource in the model, a model parameter could be used
to set the number of the resource Truck available. In the Inventory demonstration model (see
SIMPROCESS Getting Started Manual) reorder levels are controlled by model parameters. When a
model is run that has model parameters, a dialog appears that allows values of the model parameters
to be changed before the run begins. The image below shows the model parameter dialog from the
Purchasing demonstration model. There are three model parameters: NumProdAPersonnel,
NumProdBPersonnel, and NumProdCPersonnel. All three of these are Model Attributes and
their Mode is Integer. These model parameters set the number of units of the resources
ProductAPersonnel, ProductBPersonnel, and ProductCPersonnel.
SIMPROCESS User’s Manual
404
Optimization Setup
Since OptQuest uses the Integer and Real model parameters as decision variables, when OptQuest runs
the model as part of the optimization, it sets the values of the model parameters for each run.
Another requirement for optimization is an objective. Therefore there must be a performance measure
in the model to maximize or minimize. This performance measure could be one of the standard statistics
collected by SIMPROCESS or a specialized statistic, which could consist of a linear or non-linear
combination of various standard statistics. Again, referring to the Purchasing demonstration model,
the objective is to minimize the capacity cost of all the resources. Since capacity cost is collected
automatically, this statistic does not have to be created. However, in the Inventory demonstration
model, the objective is to minimize inventory and minimize the cycle time of an order. Since only one
value can be optimized, these performance measures must be combined into one. In the Inventory
demonstration model there is a linear combination of the two performance measures. This combination
is in the End Simulation expression of the Model Expressions (Define/Model Expressions).
Model.OrderTime := GetEntityStatistic("Order", "tokendelay", "Avg",
Replication);
Model.FinishedProduct := GetResourceStatistic("FinProduct",
"resrcidle", "Avg", Replication);
Model.InventoryPlusOrderTime := Model.FinishedProduct + (5.0 *
Model.OrderTime);
When combining performance measures the Expression language will be needed to retrieve statistics
collected during the simulation. (See “Accessing Statistics During Simulation” on page 308.) The
example above shows values being assigned to three Model Attributes: OrderTime,
FinishedProduct, and InventoryPlusOrderTime. OrderTime is assigned the average
cycle time for the entity Order. FinishedProduct is assigned the average number of units idle
of the resource FinProduct. InventoryPlusOrderTime is a linear combination of the two, and
statistics are collected for that attribute. Thus, the Model Attribute InventoryPlusOrderTime
is the value to minimize. Note that the System Attribute Replication is used to get the value from
the appropriate replication of the simulation.
Standard or specialized statistics can also be used as constraints in OptQuest. Therefore, if performance
measures need to be used as constraints, make sure the appropriate statistics are being collected. For
example, the values being assigned to OrderTime and FinishedProduct are also constraints
in the Inventory demonstration model.
The final steps in preparing a model for optimization apply whether or not OptQuest is intended to
be used. Make sure the model is complete. That is, all required fields in properties dialogs have been
defined (especially if portions of the model have come from other models), and all activities and
processes are connected. Run the model for several replications to ensure there are no errors. Determine
the appropriate number of replications needed to achieve statistical significance. Finally, and most
importantly, make sure the model accurately reflects the system being modeled.
SIMPROCESS User’s Manual
405
Optimization Setup
Defining An Optimization
Optimizations can only be defined for the currently active model in SIMPROCESS. Thus, if the model
to optimize is not loaded, load it; or if already loaded, make sure the model to optimize is the active
model.
Select Tools/OptQuest. (If OptQuest is not enabled, contact the SIMPROCESS Sales Manager to
purchase a license for OptQuest for SIMPROCESS.) This brings up the OptQuest for SIMPROCESS
setup dialog.
If no optimizations have been created for the model, Select Optimization Settings will be empty. The
first step in defining an optimization is to give it a name. Enter a name in Select Optimization Settings.
If there are already other optimization settings defined, entering a new name creates a new setting.
To switch between settings, simply select the desired setting from Select Optimization Settings.
Once a name has been entered, continue defining the optimization. There are five tabs on the dialog:
Objective, Decision Variables, Constraints, Process Alternatives, and Run Options. The tabs can be edited
in any order.
Objective
The Objective tab sets whether to Minimize or Maximize and the value to optimize. The buttons on the
right are used to select the value to optimize. Entity, Resource, Activity, Connector, Time Stamp, or Model
Attribute values can be optimized. For the Purchasing demonstration model, the objective is to minimize
the capacity cost of all the resources. So Minimize was selected, then the Resource button was selected
SIMPROCESS User’s Manual
406
Optimization Setup
to choose the appropriate value to minimize.
On the left are all the resources defined in the model, plus an additional item named All Resources.
When an item is selected on the left, the possible values are displayed on the right. In this example,
All Resources is selected on the left and Capacity Cost on the right. When OK is selected, All
Resources:Capacity Cost appears in Value to Optimize. (In the Inventory model, the Value to Optimize
is Model.InventoryPlusOrderTime:Value.)
There are four options for the Value to Optimize: Avg (Average), StDev (Standard Deviation), Min
(Minimum), and Max (Maximum). For this example, the average capacity cost for all the resources
is needed. Since stochastic (random) simulation models should be run for more than one replication,
the capacity cost of all resources for each replication is averaged.
Note about Min and Max: Min or Max should only be used when the constraints should bring
convergence. For instance, if minimizing the maximum wait time was the goal, Max should be chosen
for the Value to Optimize. Doing that, though, assumes there are constraints that would limit the
maximum.
Decision Variables
The Decision Variables tab contains a table similar to the table on the Model Parameters dialog. This
table lists all the model parameters in the model (no matter what Mode). However, only those model
parameters whose Mode is Integer or Real are decision variables. The Starting Value is the value
OptQuest will use on the first iteration. If new values are not entered, the Starting Value is the default
value of the model parameter assigned at the time the attribute was defined. The last column of the
SIMPROCESS User’s Manual
407
Optimization Setup
table, Include, determines which decision variables OptQuest will modify during the optimization. The
remaining columns, Lower Bound, Upper Bound, and Step Size apply only to model parameters whose
Mode is Integer or Real. If the model parameter is not one of those modes, N/A will be entered in
appropriate cell. Also, if the Mode is Real, N/A will be entered in the Step Size column of that row.
If Lower Bound is left blank, negative infinity is assumed. Likewise, if Upper Bound is left blank, infinity
is assumed. The Reset and Reset All buttons work as on the Model Parameters dialog. These buttons
only apply to the Starting Value column.
Constraints
The Constraints tab is where constraints are defined. (Constraints are not required for an optimization,
but are usually used in an optimization.) Two types of constraints can be defined. The first type is a
constraint on a performance measure of the model. The Entity, Resource, Activity, Connector, Time Stamp,
and Model Attributes buttons work as on the Objective tab. These buttons allow performance measures
to be selected for constraint. Unlike the Objective, though, which can only be one performance measure,
more than one performance measure constraints can be added to the optimization. Also, on performance
measure constraints, there is an Upper Bound and/or a Lower Bound. (Note: If there are no bounds for
a performance measure, do not include it as a constraint.) In the Purchasing model there is a Model
Attribute named TotalWait. This attribute represents the total amount of time all entity types
(Product A, Product B, and Product C) wait for resources. The code below is from the End Simulation
expression of the Model Expressions (Define/Model Expressions).
aWait, bWait, cWait : REAL;
aWait := GetEntityStatistic("Product A", "tokenwaitdelay", "Avg",
Replication);
bWait := GetEntityStatistic("Product B", "tokenwaitdelay", "Avg",
Replication);
SIMPROCESS User’s Manual
408
Optimization Setup
cWait := GetEntityStatistic("Product C", "tokenwaitdelay", "Avg",
Replication);
Model.TotalWait := aWait + bWait + cWait;
The local variables aWait, bWait, and cWait contain the average wait time for Product A, Product
B, and Product C respectively. The Model Attribute TotalWait contains the sum of all the waits.
Selecting the Model Attributes button brings up the list of the Model Attributes in the Purchasing model.
TotalWait was selected, then Value was selected.
Performance measure constraints appear as the objective except an Upper Bound field, a Lower Bound
field, and a Delete Constraint button are added.
As with the decision variables, a blank Lower Bound assumes negative infinity, and a blank Upper Bound
assumes infinity. Once a performance measure constraint has been added, only the Upper Bound, Lower
SIMPROCESS User’s Manual
409
Optimization Setup
Bound, and type of statistic can be edited. If the type of value chosen needs to be changed, the constraint
must be deleted and recreated.
The second type of constraint is an expression constraint. An expression constraint defines
mathematical relationships between decision variables. The Expression button is used to create
expression constraints. This button displays a dialog that lists the decision variables on the left and
the allowed mathematical operators and functions on the right. The example below shows the
Purchasing model. Note that the decision variable names must be the fully qualified SIMPROCESS
attribute name. That is, the type of the attribute (Model, Entity, etc.) must be included.
A name must be entered for the constraint in the Name field. Names for expression constraints within
the same optimization setting must be unique. The expression can be typed directly into the Expression
text area, or by clicking on the decision variable or mathematical operator or function. The syntax is
the same as used in the SIMPROCESS Expression language. Some mathematical functions allowed
by OptQuest are not allowed in the SIMPROCESS Expression language, therefore all of the functions
allowed by OptQuest are listed in the following table along with descriptions.
Expression Constraint Functions
Function
Description
ABS(x)
Returns the absolute value of x.
SIMPROCESS User’s Manual
410
Optimization Setup
Expression Constraint Functions
Function
Description
ACOS(x)
Returns the arccosine of x in the range 0
to n radians. x is between -1 and 1.
ASIN(x)
Returns the arcsine of x in the range –n/2
to n/2 radians. x is between -1 and 1.
ATAN(x)
Returns the arctangent of x in the range
of –p/2 to p/2 radians. If x is 0, atan
returns 0.
ATAN2(x, y)
Returns the arctangent of y/x in the
range –pi to pi radians. If both parameters of ATAN2 are 0, the function returns
0.
CEIL(x)
Returns the smallest whole number
greater than or equal to x.
COS(x)
Returns the cosine of x, where x is an
angle in radians.
COSH(x)
Returns the hyperbolic cosine of x,
where x is an angle in radians.
DtoR(x)
Converts degrees to radians.
e
Mathematical constant e, approximately
equal to 2.718.
EXP(x)
Returns e raised to the x power.
FLOOR(x)
Returns the largest whole number less
than or equal to x.
FMOD(x, y)
Returns the remainder of x / y.
LN(x)
Returns the base e logarithm of x.
SIMPROCESS User’s Manual
411
Optimization Setup
Expression Constraint Functions
Function
Description
LOG10(x)
Returns the base 10 logarithm of x.
MAXOF(x, y)
Returns the larger of two numbers.
(Note: Unlike the SIMPROCESS
MAXOF, only two parameters are
allowed.)
MINOF(x, y)
Returns the smaller of two numbers.
(Note: Unlike the SIMPROCESS
MINOF, only two parameters are
allowed.)
PI
Mathematical constant pi, approximately
equal to 3.14159.
POWER(x, y)
Returns x raised to the y power.
RAND
Returns a random number between 0 and
1 inclusive.
RtoD(x)
Converts radians to degrees.
SIN(x)
Returns the sine of x, where x is an angle
in radians.
SINH(x)
Returns the hyperbolic sine of x, where x
is an angle in radians.
SQRT(x)
Returns the square root of x.
TAN(x)
Returns the tangent of x, where x is an
angle in radians.
TANH(x)
Returns the hyperbolic tangent of x, an
angle in radians.
The optimization setup for the Purchasing model is highly constrained. This is because of the three
SIMPROCESS User’s Manual
412
Optimization Setup
expression constraints. The first constraint is named Resources = 10. This constraint requires that the
sum of the decision variables (model parameters) must equal 10. Since these decision variables set
the number of units of each resource type, the name Resources = 10 was assigned. The dialog has a
Validate button. This button allows validation of the syntax of the expression constraint before selecting
OK.
There are two other expression constraints in the Purchasing model, A <= B and B <= C. These constraints
state that the number of units of the resource ProductAPersonnel must be less than or equal to the number
of units of the resource ProductBPersonnel, and the number of units of the resource ProductBPersonnel
must be less than or equal to the number of units of ProductCPersonnel. Scrolling down on the
Constraints tab brings all three expression constraints into view.
SIMPROCESS User’s Manual
413
Optimization Setup
Expression constraints can be modified from the Constraints tab by clicking in the text area and
changing as necessary. However, expression constraint validation is not available. To use validation,
the constraint must be deleted and recreated.
Process Alternatives
The Process Alternatives tab displays all processes in the model that have more than one alternative.
When a process is selected on the left, the alternatives for that process are displayed on the right. This
allows the alternative to be selected that will be active for the optimization. If no alternative is selected
for a process, the alternative that was active the last time the model was saved will be active for the
optimization. In the Purchasing model, the Purchasing process is the only process that has more than
one alternative, thus, it is the only process listed on the left. The Purchasing process’ three alternatives
are listed on the right.
Run Options
The Run Options tab sets the number of replications for each simulation and the optimization stopping
criteria. Unless the model is discrete, it is recommended that each simulation be run for more than one
replication. The number of replications needed should be determined before setting up the
optimization. If no value is entered, each simulation run will run with the number of replications last
saved in the model. If a value is entered, that value will be reflected in the Number of Replications in
the Run Settings of the model the next time the model is opened after the optimization. In the Purchasing
model, the Number of Replications per Simulation is set to 2. This was set to a small number for
demonstration purposes only. Only two replications and the tight constraints cause the Purchasing
optimization to run quickly.
Apart from user intervention, the length of the optimization is controlled by two options: Maximum
Iterations and Automatic Stop. At least one of the stopping criteria must be selected. Both options can
SIMPROCESS User’s Manual
414
Optimization Setup
be selected. If both are selected, the criteria that is satisfied first will stop the optimization. Maximum
Iterations is the maximum number of iterations OptQuest will attempt before stopping the optimization.
The value must be an integer greater than zero. When Automatic Stop is selected, the optimization stops
when the value of the objective stops improving. Precision determines when two objective values are
considered equal. The default is 0.0001.
Saving Optimization Settings
Selecting OK will close the dialog and add the defined optimization settings to the model. The model
must be saved for the optimization settings to persist. Selecting Start will close the dialog, add the
defined optimization settings to the model, and save the model. Thus, performing another save is not
necessary. Cancel closes the dialog and discards any changes.
SIMPROCESS User’s Manual
415
Running an Optimization
Running an Optimization
To run an optimization, if the optimization settings dialog is not already displayed, select OptQuest
from the Tools menu. Once the optimization settings dialog has appeared, either define an optimization
or select a previously defined optimization. Select the Start button. At that point a dialog will appear
asking for confimation before saving the model and starting the optimization. If No is selected, the
operation is canceled. If Yes is selected, the dialog closes, the model is saved and closed, and the
optimization starts.
OptQuest for SIMPROCESS Interface
An OptQuest for SIMPROCESS optimization runs in a separate Java Virtual Machine (JVM) and uses
a separate interface from SIMPROCESS. Therefore, once an optimization has started, SIMPROCESS
can continue to be used without affecting the optimization. This means multiple optimizations can run
simultaneously. However, that may not be practical, since running an optimization is very CPU
intensive (since it is running a simulation, which monopolizes the CPU), and, depending on the size
of the model, memory intensive. Also, it may not be practical to run a simulation with SIMPROCESS
while an optimization is running for the same reasons. Running multiple optimizations and/or
simulations will often perform better on non-Windows systems.
The OptQuest for SIMPROCESS interface primarily consists of text, tables, and a graph to monitor
the optimization. There is a button to stop the optimization, and there are reporting options on the File
menu once the optimization is complete.
When the interface appears, all status objects are empty except for the Optimization Status field, which
displays Initializing. The tables show the status of the objective value, the decision variables, the
performance measure constraints, and the expression constraints. The objective value table and the
decision variables table will always appear. The performance measure constraints table and the
expression constraints table will only appear if those types of constraints exist. The graph plots the
best objective value based on whether or not the best is feasible. The example below is from the
Purchasing model.
SIMPROCESS User’s Manual
416
Running an Optimization
Status Text
The following status text is displayed:
•
•
Model Name
- name of the model being optimized
Optimization Setting
- the name of the optimization setting selected when the optimization
was started
•
•
•
•
•
Objective
- Minimize or Maximize
Objective Value
- the performance measure selected for optimization
Optimization Status - Initializing, Running Iteration n, Complete, Stopping Optimization,
User Terminated, or Error
Maximum Iterations
Automatic Stop
- number of iterations or Off
- On or Off
SIMPROCESS User’s Manual
417
Running an Optimization
Optimization Status
•
•
•
•
Initializing
descriptions:
- Optimization is in setup stage
Running Iteration n
- Optimization is running the nth iteration
Optimal Solution Found
- Optimization completed normally with no errors
Stopping Optimization - Optimization is in the process
of stopping because user selected Stop
button
•
•
User Terminated
Error
- Optimization stopped by user
- Optimization stopped due to error.
Status Tables
The objective value table lists the Best Value and the Current Value for the Iteration, whether the best
and current values are Feasible, and the best and current Objective Value.
The decision variables table lists the decision variables (Parameters) included in the optimization. The
Lower Bound, Best Value, Current Value, and Upper Bound are displayed.
The performance measure constraints table lists the performance measures identified as constraints
for the optimization. The Lower Bound, Best Value, Current Value, and Upper Bound are displayed.
The expression constraint table lists the expression constraints defined for the optimization. The name,
not the expression itself, is displayed in the Expression Constraint column. The other columns are Best
LHS, Current LHS, Operator, Best RHS, and Current RHS. LHS stands for Left Hand Side, and RHS stands
for Right Hand Side. These columns show the best and current values for both sides of each expression
constraint. The Operator column shows the comparison operator between both sides of each expression
constraint.
SIMPROCESS User’s Manual
418
Running an Optimization
Objective Graph
The graph of the objective value plots the best objective value for each iteration. Infeasible values are
plotted with dots in red, and feasible values are plotted in blue with Xs. In the example below from
the Purchasing model, the first three values were infeasible and the remaining feasible. Remember,
once the best value is feasible, the best value will not be infeasible again. To zoom in on a portion of
the graph, click and drag over the portion of the graph to enlarge. The buttons above the graph do the
following:
•
•
•
•
Print the plot.
Reset the X and Y ranges to their original (empty plot starting) values.
Set the plot format.
Rescale the plot to fit the data. Used after zooming to return to full view of plot.
Maximum Iterations Prompt
When a maximum number of iterations has been set for the optimization, the checkbox Prompt for more
iterations is enabled. This checkbox defaults to selected. When selected, the optimization prompts for
more iterations at the end of the next to the last iteration. For instance, if the maximum iterations is
set to 100, at the end of iteration 99 the optimization will prompt for a new maximum for the iterations.
A new maximum must be entered, not the number of additional iterations. So, for this example, the
SIMPROCESS User’s Manual
419
Running an Optimization
number entered must be 101 or larger (150 entered). If Prompt for more iterations remains selected,
the optimization will prompt again when the iteration is one less than the maximum (149 in this
example). Deselect this option to have the optimization complete without interruption.
Optimization Solution Options
The OptQuest for SIMPROCESS interface shows the current status of the optimization while it is
running. Once the optimization is complete, the interface only shows the best values. The example
below is from the Purchasing model.
SIMPROCESS User’s Manual
420
Running an Optimization
The File menu contains other options for examining solutions, and it has an option for applying the
best solution to the model. Help is also accessed from the File menu.
View Report
View Report brings
up a dialog similar to the Standard Report dialog. With this dialog the report can
SIMPROCESS User’s Manual
421
Running an Optimization
be displayed in a text editor or in a spreadsheet.
The report lists the name of the model, the start date/time and end date/time of the optimization, the
optimization settings, and the best values for the objective, decision variables, and constraints.
Create HTML Report
This option creates the same report as View Report. However, since it is an HTML file, the objective
graph is included as well.
Print Graph
This option sends the objective graph to the selected printer.
Apply Best Values to Model
Apply Best Values to Model assigns the best values from the decision variables to the model parameters
in the model. Thus, when the model is reopened in SIMPROCESS, and run is selected, the run values
for the model parameters reflect the best values from the optimization. Also, if OptQuest is selected
again, the starting values for the decision variables are the best values from the optimization.
SIMPROCESS User’s Manual
422
Tips and Suggestions
Tips and Suggestions
Search Methodology
There are many factors that influence the performance of OptQuest. For example, consider two
optimization methods, A and B, applied to a problem with the objective of maximizing expected
returns. When evaluating the performance of each method, consider which method satisfies the
following criteria:
• Finds a solution with a larger expected return
• Jumps to the range of high-quality solutions faster
Below is the Performance Graph for the two hypothetical methods.
The figure above shows that, although both methods find solutions with a similar expected profit after
10 minutes of searching, method A jumps to the range of high-quality solutions faster than B. For the
criteria listed above, method A performs better than method B.
OptQuest will obtain performance profiles similar to method A. OptQuest's search methodology is
very aggressive and attempts to immediately find high-quality solutions, causing large improvements,
(with respect to the initial solution), early in the search. This is critical when OptQuest can perform
only a limited number of simulations.
However, several factors affect OptQuest's performance, and the importance of these factors varies
from one situation to another. This section reviews these factors and offers tips and suggestions on
how to achieve maximum performance.
Factors that affect search performance
Any heuristic method for solving problems cannot guarantee that it will find the optimal solution. It
SIMPROCESS User’s Manual
423
Tips and Suggestions
might only find a solution that is close to the optimal solution, usually referred to as the best solution;
this is why maximizing performance is critical.
The following is a list of relevant factors that directly affect search performance. Each factor is
explained in sections after the list.
•
•
•
•
•
•
•
•
•
Number of decision variables
Initial values
Decision variable bounds
Complexity of the objective
Constraints
Feasibility
Number of replications and simulations
Simulation accuracy
Simulation speed
Number of Decision Variables
The number of decision variables greatly affects OptQuest's performance. OptQuest has no physical
limit on the number of decision variables that can be used in any given problem. However, the
performance might deteriorate if more than 100 decision variables are used.
Also, as the number of decision variables increases, more simulations are needed to find high-quality
solutions. General guidelines for the minimum number of simulations required for a given number
of decision variables in a problem are:
Decision Variables
Minimum number of simulations
Less than 10
100
Between 10 and 20
500
Between 20 and 50
2,000
Between 50 and 100
5,000
For very large numbers of decision variables, try this procedure:
•
•
•
•
Decrease the number of replication per simulation, at least initially
Run the optimization to get an approximate solution
Set the suggested values to the approximate solution
Further restrict the bounds on the decision variables
SIMPROCESS User’s Manual
424
Tips and Suggestions
• Increase the number of replications to increase accuracy
• Rerun the optimization
One option is to de-select certain decision variables and optimize the rest. If an optimization has already
been run, there might be information available about which decision variables have the least effect
on the objective function. When one or more decision variables is de-selected and the optimization
is rerun, the search focuses on the remaining, more important, decision variables.
Initial Values
The initial values are the values listed as the Starting Values of the Decision Variables tab. Initial values
are important because the closer they are to the optimal value, the faster OptQuest can find the optimal
solution. If the initial values are constraint-infeasible, they are ignored.
For potentially large models with many decision variables, it might be helpful to first run a simplified
version of the optimization to find initial values for the full-blown model. For example, expected values
could be used for some of the random variables in the model.
Decision Variable Bounds
OptQuest's performance can be significantly improved by selecting meaningful bounds for the decision
variables. Suppose, for example, that the bounds for three decision variables (X, Y, and Z) are:
0 <= X <= 100
0 <= Y <= 100
0 <= Z <= 100
And in addition to the bounds, there is the following constraint:
10*X + 12*Y + 20*Z <= 200
Although the optimization model is correct, the decision variables bounds are not meaningful. A better
set of bounds for these decision variables would be:
0 <= X <= 20
0 <= Y <= 16.667
0 <= Z <= 10
These bounds take into consideration the values of the coefficients and the constraint limit to determine
the maximum value for each decision variable. The new "tighter" bounds result in a more efficient
search for the optimal values of the decision variables. However, this efficiency comes at the expense
of missing the optimal solution if it lies outside the specified bounds.
SIMPROCESS User’s Manual
425
Tips and Suggestions
Complexity of the Objective
A complex objective has a highly nonlinear surface with many local minimum and maximum points.
OptQuest is designed to find global solutions for all types of objectives, especially complex objectives.
However, for more complex objectives, generally it is required to run more simulations to find highquality global solutions.
Since only one value can be optimized, complex objectives must be defined within the model
expressions. (See “Customizing a Model with Attributes and Expressions” on page 237.)
Constraints
Constraints can be used to restrict the values of decision variables (model parameters) by defining
relationships among the decision variables; constraints can also restrict the value of output variables
(performance measures).
If a constraint is defined using only decision variables, OptQuest can eliminate sets of decision variables
values that are constraint-infeasible before it runs the simulation. Limiting the optimization by defining
constraints on decision variables is extremely time-effective.
If a constraint contains a performance measure, a simulation must be run to determine whether the
suggested solution satisfies the constraint.
The search process benefits from the use of constraints on decision variables and tight bounds on
decision variables. However, performance generally suffers when performance measure constraints
are included in the optimization model for two reasons:
•
Performance measure constraints are very time-consuming to evaluate, since OptQuest
must run an entire simulation before determining whether the results are constraint-infeasible.
•
To avoid running constraint-infeasible simulations, OptQuest must identify the characteristics of solutions likely to be constraint-feasible; this makes the search more complex and
requires more time.
Even though performance measure constraints can greatly decrease the number of feasible simulations
performed during an optimization, performance measure constraints can focus the search to effectively
rule out undesirable solutions.
If there are lots of performance measure constraints that OptQuest can't easily satisfy, consider
combining the output constraints into one multi-objective function.
Feasibility
OptQuest makes finding a feasible solution its highest priority. Once it finds a feasible solution, it then
SIMPROCESS User’s Manual
426
Tips and Suggestions
concentrates on finding better solutions.
The fact that a particular solution may be infeasible does not imply that the problem itself is infeasible.
However, infeasible problems do exist. For example, suppose that in a Job Shop problem a foreman
insists on finding an optimal configuration with the following constraints:
drills + grinders <= 4
drills + grinders >= 5
Clearly, there is no combination that will satisfy both of these constraints.
Or, for this same example, suppose the bounds for a decision variable were:
3 <= saws <= 5
And a constraint was:
saws <= 2
This also results in an infeasible problem. OptQuest will display an error message and terminate
infeasible optimizations.
Infeasible problems can be made feasible by fixing the inconsistencies of the relationships modeled
by the constraints. OptQuest detects optimization models that are constraint-infeasible and reports
them.
If a model is constraint-feasible, OptQuest will always find a feasible solution and search for the optimal
solution (i.e., the best solution that satisfies all constraints).
Number of Replications and Simulations
When OptQuest runs an optimization, it runs a simulation to evaluate each set of decision variable
(model parameter) values. Therefore, the quality of the optimization results depends on the number
of simulations (iterations) and the number of replications per simulation.
For a set period of time, the number of replications per simulation is inversely related to the number
of simulations; as one increases, the other decreases. Decreasing the number of replications can help
increase the number of simulations.
The more simulations OptQuest can run, the more sets of values it can evaluate, and the more likely
OptQuest is to find a solution close to the optimal solution.
Simulation Accuracy
There are two factors that affect simulation accuracy:
• Number of replications per simulation
SIMPROCESS User’s Manual
427
Tips and Suggestions
• Noisiness of the objective
Number of replications per simulation
For sufficient accuracy, the number of replications per simulation must be set to the minimum number
necessary to obtain a reliable estimate of the objective function being optimized; this minimum number
is typically found with empirical testing.
Objective noisiness
Noisiness can also affect the accuracy of OptQuest results.
The objective on the left has significant amounts of noise caused by the probability distributions used
to model the problem’s uncertainty. For these types of objectives, OptQuest might have trouble
discerning the minimum or maximum value. Noisy functions can be detected by watching for best
solutions that seem to "bounce around" from one set of values to completely different sets of values.
To help solve this problem, increase the number of replications per simulation. On the right, the
objective appears smooth due to the relative certainty in the model assumptions. In these cases,
OptQuest should quickly converge to the best solution.
Simulation Speed
Some suggestions for increasing speed include:
•
•
•
•
Reduce the size of the model (or the time horizon of the simulation).
Increase the system's RAM memory.
Reduce the number of uncertain elements in the simulation.
Close other applications.
SIMPROCESS User’s Manual
428
OptQuest Demonstration Models
OptQuest Demonstration Models
Two of the demonstration models that come with SIMPROCESS have been set up for optimization:
the Purchasing model (Purchasing.spm) and the Inventory model (Inventory.spm).
Purchasing Model
This model was used throughout this chapter to describe how to set up and run an OptQuest
optimization. Thus, an extended description will not be given here. The model is described in Chapter
5 of the SIMPROCESS Getting Started Manual. The optimization set up for this model should not be
considered a true optimization scenario. The constraints are very tight, and the number of replications
per simulation is only two. This was done so the example would run within a minute or two. The value
of this model is in learning how to create decision variables and constraints.
Inventory Model
This model was developed for the purpose of finding optimal values. The model is described in
Chapter 5 of the SIMPROCESS Getting Started Manual. Briefly, the Inventory model demonstrates
an Inventory Pull and Manufacturing system. The process is characterized by the Reorder Points
and Reorder Quantities defined for each resource in the supply chain. There are four steps in the
supply chain: Warehouse, Assembly, Component1 Vendor and Component2 Vendor, and the Raw
Material Vendors. Inventory is pulled only when it is needed (there is insufficient stock to fill the
order or the Reorder Point has been reached). There are 10 Model Attributes in the model that have
been designated as model parameters.
•
•
•
•
•
•
•
•
•
•
Comp1ReOrderPt - Component Vendor 1 (Comp1 resource) Reorder Point
Comp1ReOrderQty - Component Vendor 1 (Comp1 resource) Reorder Quantity
Comp2ReOrderPt - Component Vendor 2 (Comp2 resource) Reorder Point
Comp2ReOrderQty - Component Vendor 2 (Comp2 resource) Reorder Quantity
FinProdReOrderPt - Finished Product (FinProduct resource) Reorder Point
FinProdReOrderQty - Finished Product (FinProduct resource) Reorder Quantity
Raw1ReOrderPt - Raw Material Vendor 1 (Raw1 resource) Reorder Point
Raw1ReOrderQty - Raw Material Vendor 1 (Raw1 resource) Reorder Quantity
Raw2ReOrderPt - Raw Material Vendor 2 (Raw2 resource) Reorder Point
Raw2ReOrderQty - Raw Material Vendor 2 (Raw2 resource) Reorder Quantity
The goal is to minimize the amount of inventory held without impacting the customer negatively
(increase order cycle time). This can be done by finding the optimal Reorder Points and Quantities
SIMPROCESS User’s Manual
429
OptQuest Demonstration Models
for each node in the supply chain. Using OptQuest the optimal Reorder Points and Reorder Quantities
can be found. Thus, the decision variables for the optimization are the model parameters, and the default
values for the attributes are the Starting Values for the decision variables. (See “Decision Variables”
on page 407.)
The objective is twofold: minimize inventory (FinProduct resource) and minimize the amount of time
it takes to fill a customer order. See “Preparing for Optimization,” beginning on page 404 for a
discussion on how these dual objectives are combined into one objective.
The performance measure for the amount of inventory and the performance measure for the amount
of time it takes to fill a customer order are used as performance measure constraints. These values are
obtained using the GetResourceStatistic and GetEntityStatistic expression
statements in the End Simulation expression for the model (Define/Model Expressions). These values
are assigned to Model Attributes, which are used as constraints.
The number of replications per simulation is set to 1, the maximum number of iterations is 150, and
the automatic stop feature is turned on with a precision of 0.1. Note that the number of replications
is set to 1 to reduce the time required to run the optimization. In normal usage, the number of replications
would be greater than one.
This optimization takes from 20 minutes to a few hours to run, depending on system memory and
processor speed.
SIMPROCESS User’s Manual
430
CHAPTER 16
SIMPROCESS Dashboards
SIMPROCESS Dashboards are collections of dynamic graphs that can be displayed locally or remotely
by a Dashboard Server. The graphs contained by Dashboards can be of the same type or of differing
types.
Dashboards are defined independent of SIMPROCESS models. Thus, a Dashboard can be used with
multiple models, or multiple models may use a single Dashboard. To use a Dashboard with a model,
the Dashboard must be Assigned to a model. The Assign process links the Dashboard to the model,
indicates the location of the Dashboard Server for display (host or IP address and port), and sets the
values that will be displayed on the graphs defined for that Dashboard.
During a simulation, Dashboards can only be displayed by using a Dashboard Server. A copy of the
Dashboard file must be located with the Dashboard Server.
SIMPROCESS User’s Manual
431
Defining Dashboards
Defining Dashboards
Dashboards are defined independent of SIMPROCESS models. Thus, no model needs to be open to
define a Dashboard. The Report menu contains a Dashboard item with a submenu that has two items:
Define... and Assign.... Selecting Define... brings up the SIMPROCESS Dashboard graphical user
interface (GUI).
The Dashboard GUI is similar to the SIMPROCESS GUI. The primary differences are that only one
Dashboard can be open at a time, and the Dashboard GUI initially opens with an empty Dashboard
named Dashboard1.
Dashboard Layout
The Dashboard layout is similar to the layout of a SIMPROCESS model in that its size can be set (Layout/
Size menu item), and its background color can be set (Layout/Background Color menu item). Selecting
Layout/Size
brings up the following dialog.
SIMPROCESS User’s Manual
432
Defining Dashboards
Each Dashboard has a size denoted by a gray line in the editor window. This size, measured in pixels,
will be used by the Dashboard Server to build a window in which to display the Dashboard and its
Graphs. The width and height values must be at least 300 pixels each but are otherwise unlimited in
size. However, when determining the size, consideration should be given to the size of the display on
which the server will run when a Dashboard is displayed. The Snap button will automatically adjust
the width and height values to the smallest values required to contain all Graphs currently in the
Dashboard. Snap will not resize the layout to smaller than 300 x 300 pixels.
Selecting Layout/Background Color sets the color of the layout to the color displayed on the color button
on the System Toolbar. The arrow to the right of the color button brings up a color chooser to select
the desired color.
Dashboard Graphs
The Graph Toolbar on the left contains the graph types that can be added to the layout. The types of
graphs that can be displayed on a Dashboard are
•
•
•
•
•
•
Line Graph
Bar Graph (Horizontal or Vertical, 2D or 3D)
Meter
Thermometer
Pie Chart (2D or 3D)
Text Label
The Line Graph displays one or more X-Y series where the X axis represents
simulation time. The Bar Graph displays one or more values. The
Thermometer and Meter display one value each. The Pie Chart displays two
or more values. The Text Label can be static, or it can display one value
dynamically.
Note that the values to be displayed are not assigned while defining
Dashboards. The properties that can be set while defining are appearance and
SIMPROCESS User’s Manual
433
Defining Dashboards
location related properties. The properties set while defining a Dashboard are considered to be the
default properties of the Dashboard. Most appearance properties (not location) can be changed when
using a Dashboard with a model.
Adding a Graph
Selecting a graph on the Graph Toolbar causes a new panel that represents a graph of that type to appear
in the center of the layout. The graph itself does not appear on the layout. Once on the layout, the graph
panel can be moved and resized. Also, actual properties of the graph represented by the graph panel
can be set. The new graph panel is automatically selected. A graph that is selected has a red border
around it. Multiple graphs can be selected by holding down the Control key when clicking on graph
panels. Multiple graph panels can also be selected by clicking and dragging a selection rectangle around
the desired panels.
Moving a Graph
To move a graph, click on the graph panel and drag while holding down the mouse button. Multiple
graph panels can be moved simultaneously by selecting multiple graphs before moving. The same type
grid that is available for creating SIMPROCESS models is available for Dashboards on the Layout
SIMPROCESS User’s Manual
434
Defining Dashboards
menu. However, due to the size of the graph panels, movement can be difficult with the grid turned on.
Resizing a Graph
The default size of a graph panel (other than Text Label, which is 250 x 100 pixels) is 250 x 250 pixels.
A graph panel can be resized by clicking on the edge of a graph panel and dragging. Also, a specific
size can be set by selecting Edit/Resize from the menu or by right mouse clicking on the graph panel
and choosing Edit/Resize. Multiple graph panels can be resized simultaneously by selecting multiple
graphs before resizing.
Aligning and Distributing Graphs
When two or more graph panels are selected, they can be aligned using the Layout/Align menu item
or by right clicking on a selected graph panel and choosing the appropriate align item. When three
or more graph panels are selected, they can be distributed horizontally, vertically, or circularly using
the Layout/Distribute menu item or by right clicking on a selected graph panel and choosing the
appropriate distribute item. The image below shows a Dashboard with a Line Graph and a Bar Graph
that have been moved from the center, resized to 350 x 350 pixels, and aligned.
SIMPROCESS User’s Manual
435
Defining Dashboards
Editing Graph Properties
The default properties for graphs can be edited by double clicking a graph panel, selecting a panel and
choosing Edit/Properties from the menu, selecting a panel and clicking the properties button on the
System Toolbar, or by right clicking and choosing Properties. Properties common to all graphs are
Name and Background. The Name is used to identify the graph to the Dashboard and must be unique.
Background sets the color of the background of the graph. A specific color can be selected from the
Background Color list, or Use Layout Background Color can be selected. Use Layout Background Color
sets the background color of the graph to background color of the layout. Note that Name and
Background cannot be changed when a Dashboard is assigned to a model.
Line Graph Properties
Title, X Axis, Y Axis, and Use Date Axis for X Axis are additional properties for the Line Graph. These
default properties can be overridden when the Dashboard is assigned to a model.
•
•
•
•
Title
- default title for the Line Graph
X Axis
- label for the x axis
Y Axis
- label for the y axis
Use Date Axis for X Axis
- if selected, the x axis displays times and dates instead of a number
Bar Graph Properties
Title, X Axis, Y Axis, Dimension Type, and Bar Orientation are additional properties for the Bar Graph.
These default properties can be overridden when the Dashboard is assigned to a model.
•
•
•
•
Title
- default title for the Bar Graph
X Axis
- label for the x axis
Y Axis
- label for the y axis
Dimension Type
- 2 Dimensional or 3 Dimensional
SIMPROCESS User’s Manual
436
Defining Dashboards
•
Bar Orientation
- Horizontal or Vertical
Meter and Thermometer Properties
The Meter and Thermometer have similar properties. Both have a Title, a Range with optional subranges,
and a Value Color. The differences are in the other color options. The Meter has a Needle Color and a
Meter Color option. The Thermometer has a Mercury Color option.
•
•
•
•
•
•
•
•
Title
•
•
•
•
•
•
Lower Normal Bound
- default lower bound for the Normal subrange
Upper Normal Bound
- default upper bound for the Normal subrange
- default title for the Meter or Thermometer
Mercury Color
Needle Color
- default color for the mercury in the Thermometer
- default color for the needle on the Meter
Meter Color
- default color for the Meter
Value Color
- default color for the current value of the Meter or Thermometer
Lower Bound
- default lower bound for the Meter or Thermometer
Upper Bound
- default upper bound for the Meter or Thermometer
- if selected, lower bounds, upper bounds, and colors for three subranges
(Normal, Warning, and Critical) can be set. If subranges are used for the Thermometer, the
colors selected for the subranges override the Mercury Color setting.
Use Subranges
Normal Color
- default color for the Normal subrange
Lower Warning Bound
- default lower bound for the Warning subrange
Upper Warning Bound
- default upper bound for the Warning subrange
Warning Color
- default color for the Warning subrange
SIMPROCESS User’s Manual
437
Defining Dashboards
•
•
•
Lower Critical Bound
- default lower bound for the Critical subrange
Upper Critical Bound
- default upper bound for the Critical subrange
Critical Color
- default color for the Critical subrange
Pie Chart Properties
Title and Dimension Type are additional properties for the Pie Chart. These default properties can be
overridden when the Dashboard is assigned to a model.
•
•
Title
- default title for the Pie Chart
Dimension Type
- 2 Dimensional or 3 Dimensional
SIMPROCESS User’s Manual
438
Defining Dashboards
Text Label Properties
Text Label properties include Label and Font Attributes, which include Font Name, Size, Color, Bold,
and Italic.
•
•
•
•
•
•
Label
- default text that is displayed
Font Name
Size
- default font for label
- default font size for label
Color
- default font color for label
Bold
- default selection for bold
Italic
- default selection for italic
SIMPROCESS User’s Manual
439
Defining Dashboards
Dashboard Menus
File Menu
New places a new Dashboard in the work area displayed in the window. If the current Dashboard has
been changed, SIMPROCESS will prompt to save its contents to a file before clearing it in favor of
a new Dashboard in the work area.
Open prompts for the selection of a Dashboard file (having the extension “.spd”), which will be read
and displayed in the work area. If the current Dashboard has been changed, SIMPROCESS will prompt
to save its contents to a file before clearing it in favor of a new Dashboard created from the selected file.
Save saves the current work area into its Dashboard file. If no file has yet been associated with it, this
behaves the same as Save As.
Save As saves the current Dashboard to a new file. If an existing file is selected, SIMPROCESS will
question whether to overwrite that file.
will be enabled when the Dashboard in the work area contains one or more Graphs. It will
open a separate window with the specified layout size (Layout/Size) containing actual sample graphs
configured with the properties set in each graph panel. This is how the actual Dashboard will look when
shown by a Dashboard Server.
Preview
Close closes the SIMPROCESS Dashboards window. If the current Dashboard has been changed,
SIMPROCESS will prompt to save those changes.
Edit Menu
Cut is enabled only if one or more Graphs are selected (as indicated by a red border). Cut removes the
selected Graphs from the layout and places them onto the clipboard, where they may later be pasted
back into the current or a different Dashboard.
Copy is enabled only if one or more Graphs are selected (as indicated by a red border). Copy places
a copy of the selected Graphs onto the clipboard, where they may later be pasted back into the current
or a different Dashboard.
Paste is enabled only if one or more Graphs has been placed (via Cut or Copy) onto the clipboard. Paste
places Graphs from the clipboard onto the layout. The clipboard's contents remain intact until changed
by a subsequent Cut or Copy action.
Duplicate is enabled only if one or more Graphs are selected (as indicated by a red border). Duplicate
acts as though Copy was selected followed by Paste. That is, it copies all selected Graphs onto the
clipboard and then immediately pastes them back into the current layout.
Clear is enabled only if one or more Graphs are selected (as indicated by a red border). Clear removes
SIMPROCESS User’s Manual
440
Defining Dashboards
the selected Graphs from the layout and does not place them onto the clipboard.
Select All is enabled only if one or more Graphs appear on the layout. Select All selects all Graphs on
the layout and displays red borders to indicate their selected status.
Resize is enabled only if one or more Graphs are selected (as indicated by a red border). Resize presents
a Resize dialog where the width and height of the selected Graphs are specified in pixels. If more than
one Graph is selected, the size entered will be applied to all of them. Individual Graphs may also be
resized by selecting them and moving the mouse cursor over a portion of the border, then dragging
when the cursor changes to indicate the direction of the resizing operation.
Properties is enabled only if one or more Graphs are selected (as indicated by a red border). Properties
presents a Graph Properties dialog for each selected Graph in turn. Properties can also be edited by
double-clicking any Graph, clicking the properties button on the System Toolbar, or right clicking and
choosing Properties.
Layout Menu
Size is always enabled since a Dashboard is considered to be open in the work area at all times. Size
displays the Dashboard Layout Size dialog.
is always enabled since a Dashboard is considered to be open in the work area at
all times. Background Color sets the background color of the Dashboard layout to the currently selected
color on the Dashboard Color button on the System Toolbar.
Background Color
Align is enabled only if two or more Graphs are selected (as indicated by a red border). Align presents
a dialog with Top, Bottom, Left, Right, Center (Vertical) and Center (Horizontal). Selected Graphs will
be repositioned so that they align as directed. Alignment can also be set by right clicking on a selected
Graph.
Distribute is enabled only if three or more Graphs are selected (as indicated by a red border). Distribute
presents a dialog with Vertically, Horizontally and Circular. Selected Graphs will be repositioned so that
they are distributed within the available space (the layout size) as directed, much like the equivalent
function in the SIMPROCESS model editor. Selected Graphs can also be distributed by right clicking
on a selected Graph.
Snap to Grid, Grid Lines, Grid Spacing, and Grid Color work like their counterparts in the SIMPROCESS
model editor. They allow the optional use of grid lines to help in placement of Graphs in a Dashboard.
However, due to the size of graph panels, movement is difficult with grid lines turned on.
SIMPROCESS User’s Manual
441
Assigning Dashboards
Assigning Dashboards
To assign a Dashboard to a model, select Dashboard/Assign... from the Report menu. For the Assign...
menu item to be active, a SIMPROCESS model must be open, and the Dashboard GUI must be closed.
Assign... brings up a list of the Dashboards assigned to the model. Use the File... button to update the
Dashboard file’s location if the Dashboard was developed on a different system or moved to a location
other than where it was located when originally assigned.
Adding a Dashboard Assignment
Dashboards are assigned to a model by using the Add... button on the Dashboard list dialog. The New
Assigned Dashboard Dialog has four fields: Dashboard Name, Server Address, Server Port, and
Dashboard File. The Dashboard Name defaults to “Dashboard” plus an internally assigned number. This
name can be changed to something more meaningful. The Server Address defaults to localhost (which
refers to the same machine on which SIMPROCESS is running), and Server Port defaults to 5555. If
not using localhost for the Server Address, the Server Address must be a fully qualified server name
or an Internet Protocol (IP) address. Use the Browse button to locate the Dashboard File that is to be
displayed. (TIP: Whenever practical, the file should be in the same directory with the SIMPROCESS
model, or in a directory below the one where the SIMPROCESS model resides. This allows the stored
reference to be relative, so that moving both the SIMPROCESS model and the Dashboard file to a
new location where their relative positions are unchanged will still maintain a correct reference.) Note
that Add... does not complete the assignment of a Dashboard to a model. The Graphs must be edited
as described below to customize the way they appear and plot values to them.
SIMPROCESS User’s Manual
442
Assigning Dashboards
Editing and Removing a Dashboard Assignment
Selecting a Dashboard assignment in the list causes the Edit and Remove buttons to activate.
Remove removes the Dashboard assignment from the model. A Dashboard assignment that has been
removed can be restored with the Undo button. Edit displays a Dashboard Edit dialog that allows
customization of the Dashboard for the model and assignment of plot values to any of the graphs on
the Dashboard. The File button presents a dialog that allows selecting the Dashboard file for the selected
Dashboard assignment and should normally only be needed if its location has changed.
The properties dialog contains three fields that can be edited: Dashboard Name, Server Address, and
Server Port. Below those fields is a view of the Dashboard that was assigned to the model. The example
below contains a Text Label, Line Graph, and Meter.
SIMPROCESS User’s Manual
443
Assigning Dashboards
Selecting a Graph causes the Edit button to activate. Edit displays a dialog with the default properties
of the Graph. The Graph properties can also be accessed by double clicking the Graph. These properties
(other than Name and Background) can be customized for the model. Also, the values to be plotted are
added to the Graph.
Customizing Properties
Editing the Text Label brings up the dialog below. The left side of the dialog contains the same
properties that are editable when defining Dashboards. Note that Name and Background cannot be
changed. Any changes made in this dialog will override the default properties in the Dashboard file
when the Dashboard is displayed. The properties of the other Graphs are customized in the same
manner. The right side of the dialog contains the value to display. Since the right side is empty, this
Text Label is a static label. Although Text Labels can display one value dynamically, they are best
used as static labels. (Important Note: If you are planning to have multiple models referring to the
same Dashboard while it is displayed, you can prevent any Graphs your model does not use from
receiving an initialization message at simulation time which could change their appearance at the
SIMPROCESS User’s Manual
444
Assigning Dashboards
Dashboard Server. For a Text Label, make sure the Label value is empty and do not select any plot
values. For all other Graphs, do not select any plot values.) Adding values to Graphs is discussed below.
Adding Values to a Graph
Values are added to a graph using the buttons under the Select Plot Values heading (Entity, Resource,
Activity, Connector, Time Stamp, and Model Attribute). The procedure for adding values is the same as
for Custom Plots. See “Adding Values To Custom Plot,” beginning on page 209 for detailed
instructions on adding values. The Line Graph, Bar Graph, and Pie Chart can plot multiple values.
The Meter, Thermometer, and Text Label can only plot one value. The Line Graph, Bar Graph, and
Pie Chart also allow the text and color of the legend to be set. The Thermometer allows the text of
the legend to be set, but not the color. This is because the color is set in the Thermometer properties.
The procedure for setting legends is the same as for Custom Plots. See “Setting Legends,” beginning
on page 218 for detailed instructions on setting legends. The images below show the properties of the
Line Graph with the legend setting below that.
SIMPROCESS User’s Manual
445
Assigning Dashboards
SIMPROCESS User’s Manual
446
Displaying Dashboards
Displaying Dashboards
Dashboards are displayed by a Dashboard Server. A directory named dashboardserver is located
in the SIMPROCESS directory. A copy of the contents of this directory must be located on each system
that is to run a Dashboard Server. Within the dashboardserver directory is a directory named
dashboards. A copy of the Dashboard files (.spd files) assigned to the model must be placed in
the dashboards directory used by a Dashboard Server for it to be displayed. To use a directory other
than dashboards, modify the server.properties file to reference the alternate directory. The
port for the Dashboard Server can also be changed in this file. Multiple Dashboard Servers on the same
system can use the same dashboards directory, but they must have different ports. Note: There is
one exception to this last item. Multiple Dashboard Servers on one system may listen on the same port
if subscribing to multicast groups, even if all subscribe to the same one.
If there are multiple Dashboard assignments in the model with different server addresses and/or ports,
a Dashboard Server must be started on each Server Address and Server Port referenced (or subscribe
to the multicast group). If the Server Address for any assigned Dashboards is localhost, a Dashboard
Server can be started from SIMPROCESS by selecting Tools/Remote/Start Local Dashboard Server. On
Windows, the server.bat file can be used to start a Dashboard Server. The server.sh file is
for Linux systems, though it will also work on other Unix systems. Note that these files specify a path
to the JRE installed with SIMPROCESS. If the system does not have a version 1.5 or later JRE, the
JRE installed with SIMPROCESS (in the jre directory) can be copied if it has the same or a compatible
operating system, or a JRE can be downloaded from java.sun.com for most platforms, or from the
appropriate vendor for others. The Dashboard Server must be initialized before the simulation begins.
When started, the Dashboard Server window appears.
SIMPROCESS User’s Manual
447
Displaying Dashboards
When the simulation is started, the Dashboards assigned to the model will initialize if there are any
plot values assigned to any Graphs (for a Text Label, it must also have a Label value as noted above).
Note that the Dashboard Server window may need to be the active (i.e., frontmost) window for the
Dashboard windows to appear if running on the same Windows system as SIMPROCESS. If the
Dashboard files referenced by the model are not located in the dashboards directory on the server,
no Dashboard window will appear, and error messages will be displayed in the Dashboard Server
window.
SIMPROCESS User’s Manual
448
Displaying Dashboards
Note that it is possible for messages to not be received by the Dashboard Server, or to be received out
of order. To minimize this risk (and improve performance), it is suggested that Dashboards not display
a large (more than 10) number of values on a large number of Graphs (more than 4). For example,
one Line Graph can plot multiple values (no limit as far as the Line Graph is concerned). However,
this means that messages for 10 different values must be received by the Dashboard Server.
Alternatively, there could be 10 Meters which each take one value. Again, 10 different values must
be received by the Dashboard, and the Dashboard must update 10 different Graphs. If possible, keep
the number of values to 10 or less on 4 or less Graphs. Also, it is suggested that the simulation be run
with the animation turned on. This slows down the simulation. Simulations that are run with the
animation off run extremely fast, so that messages sent to Dashboards could very well arrive faster
than the Dashboard Server can handle them (resulting in packet losses). It’s usually not necessary to
turn on entity movement (although that helps). Turning on Activity Counts normally slows the
simulation enough to minimize loss of messages to the Dashboard Server. Running a Dashboard Server
across a network can sometimes impose sufficient delay to reduce the chances of message overload
as well. This is the recommended way to use Dashboards. These suggestions may or may not be
applicable to your environment, depending on a wide range of factors. You should experiment in your
own environment as needed.
The image below shows the Truck Status Dashboard during a run. Note that a Dashboard window
cannot be closed. Closing the Dashboard Server’s main window closes all associated Dashboard
SIMPROCESS User’s Manual
449
Displaying Dashboards
windows and shuts down the server.
SIMPROCESS User’s Manual
450
Appendices
SIMPROCESS User’s Manual
451
APPENDIX A
Importing Version 2.2.1 Models
Version 2.2.1 or 2.2.2 models cannot be opened using File/Open. Earlier version models must be
imported to version 4. This is done using File/Import/Version 2.2.1 Model... Model versions earlier than
2.2.1 cannot be imported. These models must be saved in 2.2.1 or 2.2.2 before they can be imported
into version 4. However, it is recommended that models be saved in 2.2.3 before importing.
SIMPROCESS 2.2.3 is a special Student version (Import Utility) that is designed to prepare models
for import to version 4. The 2.2.3 Student version can load and save models from versions of
SIMPROCESS earlier than 2.2.1. The special Student version of SIMPROCESS 2.2.3 is available at
www.simprocess.com.
Earlier version models must be imported because the structure of SIMPROCESS and the structure
of a SIMPROCESS model file has changed. Version 3 and higher model files are XML files. Thus,
they can be read by any XML parser.
SIMPROCESS User’s Manual
452
Appendix A - Importing Version 2.2.1 Models
Import Procedures
To import a model select File/Import/Version 2.2.1 Model... and choose the model to import.
If the file selected is a version 3 or higher file, it will open. However, if the file is pre-2.2.1, an error
dialog will appear.
SIMPROCESS User’s Manual
453
Appendix A - Importing Version 2.2.1 Models
Preparing Your Model For Import
The import procedure reads a 2.2.1, 2.2.2, or 2.2.3 model file and converts the information to XML
that can be read by SIMPROCESS version 4 or higher. However, due to limitations in 2.2.1 and 2.2.2
files, some preparation may be required. For larger models, it is recommended that they be opened
and saved in 2.2.3. Without being saved in 2.2.3, importing the properties of an Activity, Connector,
Pad, etc. from earlier version models depends upon the name of that item. Therefore, if there are
duplicate names at the same level, errors will occur, and the conversion will not be complete. Depending
on the version of your model, there are three or four primary steps in preparing your model for import.
The first item only applies to models that have not been saved in 2.2.3.
•
•
•
•
Make sure there are no duplicate names at the same level (2.2.1 and 2.2.2 only).
Make sure certain special characters are not in names.
Make sure all required fields are complete.
Make sure all special graphics are imported before importing the model.
Duplicate Names (2.2.1 and 2.2.2)
When checking the names, be concerned with names that are at the same level of hierarchy. First, make
sure no Activities or Processes have the same name (this should have already been enforced by
SIMPROCESS 2.2.*). Second, make sure no Connectors or Pads have the same name as another
Connector or Activity/Process. Pads cannot have duplicate names on the same Activity or Process,
but they can have duplicate names across Activities/Processes. A Pad cannot have the same name as
an Activity or Connector. Finally, make sure everything (Activity, Process, Connector, or Pad) has a
name. Version 2.2.2 and earlier will allow you to have Connectors without names. Notice in the example
below there are duplicate Connector names. One set of these names will need to be changed for the
model to import correctly. A simple solution would be to add a 1 to each Connector name on the right.
Note that once the model has been imported the names can be changed back to the original.
The next example shows a Process with a Pad that has the same name. The Process Send Queue has
a Pad named Send Queue. This will cause errors during import.
SIMPROCESS User’s Manual
454
Appendix A - Importing Version 2.2.1 Models
Special Characters
Names of Activities, Processes, Connectors, or Pads cannot have single quotes. These characters will
cause errors in the XML parser. For instance, the name Can’t Process will cause errors. Other characters
to avoid are <, >, and /. In general, spaces are not a problem. However, extra spaces will be ignored.
Therefore, Process_1 (one space between Process and 1) is the same as Process__1 (two or more spaces
between Process and 1).
Required Fields
Some Activities have required fields. For instance the Generate Activity needs an entity to generate.
Notice the Generate Properties Dialog below. If no entities have been defined in the model, and, thus,
the Entity field in the Generate is blank, errors will occur. This same type of error could be caused
by Assemble, Batch, and Transform Activities not having an entity type selected. Also, a Branch
Activity with no attribute selected when branching by attribute has been set could cause errors during
import.
SIMPROCESS User’s Manual
455
Appendix A - Importing Version 2.2.1 Models
Graphics
If bitmaps were imported for the model, gif, jpeg, or png versions of these bitmaps must be
imported before importing the model.
SIMPROCESS User’s Manual
456
Appendix A - Importing Version 2.2.1 Models
Graphical Import Results
If there are no errors, all properties will import. However, the screens will look different. This is because
version 3.0 or higher uses a different coordinate system from earlier SIMPROCESS versions. There
are several areas that will be quite noticeably different.
•
•
•
•
•
Activity/Process location
Activity/Process size
Connectors not connected to Pads
Specially drawn Connectors not correct
Text Blocks, Static labels, and Dynamic labels smaller
Activity/Process Location
The drawing area for earlier versions of SIMPROCESS was a square. The drawing area for version
3 is a rectangle and is related to your screen size (typically 1024 x 768). Thus, Activities and Processes
will be in positions relative to where they were in 2.2.1 or 2.2.2. The change from a square area to a
rectangular area will cause some Activities or Processes to be out of place. The two images below
demonstrate this. The first is from a 2.2.2 version model. The second is after importing to version 4.
Notice that the two delay Activities may be higher or lower in relation to the Process Pads in the imported
model.
SIMPROCESS User’s Manual
457
Appendix A - Importing Version 2.2.1 Models
Connectors And Pads
Connectors may not be attached to the Pads. This is due to the changing size of the icons. This is easily
fixed by slightly moving one of the Activities or Processes. The images below demonstrate this. The
first shows the model as imported. Notice that the Connectors do not connect with the Pads. The second
image shows that, after a slight movement of one of the Processes, the Connectors jump into place.
SIMPROCESS User’s Manual
458
Appendix A - Importing Version 2.2.1 Models
Another issue is a change in Pad rules for version 3 and higher. A Connector cannot go from the output
Pad of an Activity or Process to an input Pad of the same Activity or Process. This rule is in place
to help prevent infinite loops. Thus, if a 2.2.2 model had a Connector from an output Pad of a Process
to an input Pad of the same Process, that Connector will not be in the imported model. This is easily
fixed by placing another Activity (like a Merge) between the two, or having the loop occur within the
Process. In the example below the Re-scan Connector in the 2.2.2 model is not allowed in 3.0 or higher.
The solution is to have the loop within the Process.
SIMPROCESS User’s Manual
459
Appendix A - Importing Version 2.2.1 Models
Also, Pads may be arranged differently. Pads will be on the correct side of an Activity or Process, but
they may be in a different order. Notice that the Pads on the right side of the Process Pending Queue
are swapped. The first image is from the 2.2.2 model, and the second is from the imported model. Pads
on other Activities like the Clone, Split, Assemble, and Gate may be swapped as well.
Specially Drawn Connectors
Connectors are drawn by clicking on the output Pad of one Activity and then clicking on the input
Pad of another Activity. These Connectors will default to a bent Connector. Special paths for
SIMPROCESS User’s Manual
460
Appendix A - Importing Version 2.2.1 Models
Connectors are created by clicking on the layout. Every click point creates a right angle. In the 2.2.2
example below, this is how the feedback loop is created (blue Connector).
Notice that in the imported model the feedback Connector from Branch3 to Delay2 overlays the
Connector from Delay2 to Branch3. This is because the Connector from Branch3 to Delay2 took the
default path. Thus, this Connector will need to be deleted and redrawn. Converting Connectors using
the vertices of the corners created strange results due to the change in coordinate systems. Using the
default Connector between Activities means only special Connectors need to be redrawn.
SIMPROCESS User’s Manual
461
Appendix A - Importing Version 2.2.1 Models
Text Blocks, Static Labels, and Dynamic Labels
Text blocks are labels that can display on Processes or Activities. In earlier versions of SIMPROCESS,
the font used for text blocks was a vector font. The font would scale as the Process or Activity was
resized. In SIMPROCESS 3 and higher, the text blocks were improved to allow the font attributes (font
type, color, size, and style) to be set. This requires using the fonts native to your system. Therefore,
the font will not scale as a Process or Activity is resized. During conversion, the default font attributes
are used. The default font attributes may not fit the Process or Activity, or the default font attributes
may be too small for the Process or Activity. The model below is a 2.2.2 model. The image that follows
shows the imported model. Notice that for the outer two Processes the text blocks are too large and
for the Process in the middle the text block is too small. Also, notice the location difference of the center
Process. For the Processes where the text block is too large, either the Process can be sized larger or
the text block can be sized smaller. The third image shows the corrections. The two outer Processes
were sized larger. The font size was set larger for the text block for the center Process, and the font
style was set to bold. Finally, the Align option on the Edit menu was used to line up the Processes.
SIMPROCESS User’s Manual
462
Appendix A - Importing Version 2.2.1 Models
Static and dynamic labels can experience the same results during conversion. Although, labels do not
overlay a Process or Activity like a text block, the imported labels may be smaller than desired. Again,
this is due to vector fonts being eliminated. To change a label, just open up the properties and change
the font attributes.
SIMPROCESS User’s Manual
463
Appendix A - Importing Version 2.2.1 Models
Properties Import Results
If the model has been prepared properly, there should be no errors during the import. If errors do occur,
an error dialog will appear.
If the error dialog appears, open the simprocess.log file in the SIMPROCESS/SPSYSTEM
directory. This file will contain more detailed error messages. The first error listed is the one to focus
on. Normally, the error messages that follow the first one result from the first error.
The image below shows the top level of the 2.2.2 demo model Wafer.spm. This model will be used
as an example for diagnosing errors in properties.
As an example, an import of the 2.2.2 demo model Wafer.spm produced the following error in
simprocess.log: Error in Activity properties of Activity Inspect1 in imported model Wafer. This
error means the problem occurred somewhere close to the Activity named Inspect1. In the image below,
notice the graphics of the imported model. The layout shows that the text block is missing from the
Process Layer2. Also, the Pads are not in the proper place for Layer2. This indicates that the error
occurred in the Process Layer1 since no properties for Layer2 were imported.
SIMPROCESS User’s Manual
464
Appendix A - Importing Version 2.2.1 Models
To solve this, open the model in SIMPROCESS 2.2.2. or 2.2.1. If you do not know exactly where the
Activity named is, you can use the Find Activity feature of the Activity Browser to find it.
Notice that there is a Connector named Inspect1, as well as the Activity named Inspect1. This is the
cause of the problem. Changing the name of the Connector or the Activity is the solution. In this
particular model, this same Activity/Connector combination is in Layer2 and needs to be changed there
as well. (This error caused by duplicate names will not occur with models saved in 2.2.3.)
Import Troubleshooting
The table below gives sample error messages from the simprocess.log file along with possible causes.
SIMPROCESS User’s Manual
465
Appendix A - Importing Version 2.2.1 Models
If the error message gives a specific Activity type (such as Assemble, Batch, etc.) there is usually
something missing from the properties for that Activity. The errors listed below are the most common.
The last four are not specific to a particular Activity type.
If errors persist, contact SIMPROCESS Technical Support at [email protected] for
assistance.
TABLE 1. Import
Errors and Causes
Error
Cause
Error in schedules for Generate
Generate1 in imported model
Feedback
Entity field is blank in a Generate schedule
Error in Activity properties of
Activity Inspect1 in imported
model Wafer
A Connector or Pad has the same
name as the Activity listed (2.2.1
and 2.2.2 only).
Error in Dummy Connector > in
imported model Wafer
A Connector is missing a name
(2.2.1 and 2.2.2 only).
SPDOM.selectSingleNode
exception javax.xml.transform.TransformerException:
misquoted literal... expected single quote!
A name has a single quote.
Error in Connector Rejects in
imported model Wafer
Two Connectors have the same
name (2.2.1 and 2.2.2 only).
SIMPROCESS User’s Manual
466
Appendix A - Importing Version 2.2.1 Models
Importing Document Files
Versions of SIMPROCESS prior to 3 stored model documentation in files in the model folder. These
files will not import automatically. The document feature has been improved in version 3 and higher.
No longer is the documentation stored in separate files. In version 3 and higher it is part of the model
file. For the documentation to be part of the model, the text must be RTF. The files in earlier version
models are ASCII if NotePad was used to create the text or some other format if another text editor
(such as MS Word) was used. To import these files they must first be saved as RTF. This is easily
done in MS Word. There is also shareware available on the internet that will convert ASCII files to
RTF (http://www.jafsoft.com/asctortf). The names of the files converted to RTF are
not important to SIMPROCESS. Once the files are RTF, simply click the Document button on the item
for import. There is a Document button on all Activity, Process, entity, and resource properties dialogs.
Also, there is Model Documentation on the Define menu.
Clicking the Document button brings up an RTF editor.
From the File menu choose Read from File... This allows you to read in the RTF document files which
makes the file a part of your model file.
This must be done for every documentation file that was created for your 2.2.* model. All of these
files will be located in the model’s folder and will have the extension .doc.
SIMPROCESS User’s Manual
467
APPENDIX B
Activity Summary Table
Assemble
Assign
Required Parameters
Non-standard Options
Receives 2 or more entities
and assembles them into a
single entity for release.
Component Entity
Resources
Assembled Entity
Delay
Assigns values to entity
attributes.
Entity Attributes
Batch Components
Resources
Delay
Set Entity Priority
Batch
Branch
Stores entities until a condition is met, then releases
them as one, while retaining
their individual identity.
Quantity to Batch
Resources
Min Batch Size
Delay
Routes entities to different
paths in the model network.
Branch Type
Max Hold Time
Batch Entity Type
SIMPROCESS User’s Manual
Resources
Delay
468
Appendix B - SIMPROCESS Activity Summary
Clone
Clones entities.
Required Parameters
Non-standard Options
Number of Entities
Resources
Delay
Delay
General-purpose activity.
Dispose
Disposes of entities.
Free
Resource
Releases resources obtained
by Get Resource activities.
Release actions
Release all allocated
resources
Gate
Accumulates entities until a
condition is met, then
releases a specified number
of them.
Threshold Release ON/OFF
Resources
Threshold Release Quantity
(if Threshold Release ON)
Delay
Generates entities.
Entity type
Start and End dates)
Quantity
Schedule Type
Interval
Schedule Items
Generate
Delay Time
Resources
Maximum entity Count
Batch released entities
Trigger Release Quantity (if
Trigger Release ON)
Get
Resource
Obtains resources to be held
during several activities.
Resources
Join
Reunites entities divided at a
Split activity.
Family Name
Tag attached to allocation
Batch family members
Resources
Delay
Merge
Merges entities and routes
them in a single stream.
Replenish
Resource
Adds units to consumable
resources.
Replenish actions (Resource
and Units)
Split
Divides one entity into several to model the division of
processing among several
activities.
Family name
Synchronize Coordinates the release of
Copy Priority
Resources
Delay
Number of Pads
various entities.
SIMPROCESS User’s Manual
Resources
Delay
469
Appendix B - SIMPROCESS Activity Summary
Required Parameters
Transfer
Send or Receive
Transfers entities from one
portion of a model to another Local or Remote
without a connector, or transConnection or Protocol
fers an entity to another SIMPROCESS model.
Transform
Transforms arriving entities
from one type to another, and
releases one or more of the
new type.
Unbatch
Non-standard Options
Most standard options are
not available
Number of Output Entities
Copy Attributes
Output Entity type
Resource
Separates a batched entity
into its constituent parts.
Delay
Resource
Delay
Retain Batched Entity
Unbatch Nested Batches
SIMPROCESS User’s Manual
470
APPENDIX C
SIMPROCESS File Structure
The SIMPROCESS installation program creates a directory called SIMPROCESS (unless a different name is chosen during installation). In this directory there are a number of important files and
up to nine subdirectories. The primary subdirectories are the System Directory (SPSYSTEM), the
User Working Directory (SPUser), and the models directory. This appendix briefly describes
the structures and contents of the directories. The basic directory structure is listed below. Note that
the dispatcher directory only exists if the SIMPROCESS Dispatcher is installed.
SIMPROCESS installation directory
SPSYSTEM
xfit (Windows only)
SPUser
document
SampleFiles
models
Demos
ExpressionDemos
metamodel
endorsed
jre
ext
dashboardserver
timeserver
SIMPROCESS User’s Manual
471
APPENDIX C - SIMPROCESS File Structure
dispatcher (optional)
Installation Directory
ReadMe.txt
installvariables.properties
SIMPROCESS_InstallLog.log
.com.zerog.registry.xml
SIMPROCESS.ico
InstallScript.iap_xml
Uninstall SIMPROCESS.exe
Uninstall SIMPROCESS
(
(
(
(
(
(
(
(
Uninstall SIMPROCESS.lax
uninstaller.jar
Dispatcher.exe
(
(
(
Dispatcher
(
Dispatcher.lax
(
lax.jar
SPRunSimulation.exe
SPRunSimulation
SPRunSimulation.lax
SIMPROCESS.exe
SIMPROCESS
SIMPROCESS.lax
MetamodelEditor.exe
MetamodelEditor
MetamodelEditor.lax
MetamodelEditor.ico
java2rei.dll
lmutil.exe
lmutil
hostid.txt
hostid.bat
hostid.sh
License.htm
Import Procedures.pdf
(
(
(
(
(
(
(
(
(
(
(
(
(
(
(
(
(
(
(
ReadMe file with summary of changes )
Installer settings )
Installation log )
Installer file )
SIMPROCESS icon - Windows only )
Installation file )
Uninstaller application - Windows only )
Uninstaller application - non-Windows systems )
Uninstaller application settings file )
Uninstaller file )
Optional Dispatcher application - Windows
only )
Optional Dispatcher application - non-Windows systems )
Optional Dispatcher application settings
file )
Installer file )
SIMPROCESS with no GUI - Windows only )
SIMPROCESS with no GUI - non-Windows )
Application settings file )
SIMPROCESS executable - Windows only )
SIMPROCESS executable - non-Windows )
Application settings file )
Metamodel Editor executable - Windows only )
Metamodel Editor executable - non-Windows )
Application settings file )
Metamodel Editor icon - Windows only )
Rose Java interface library - Windows only )
Licensing file - Windows only )
Licensing file - non-Windows )
Licensing file )
Licensing file - Windows only )
Licensing file - non-Windows )
SIMPROCESS License agreement )
Documentation for importing 2.2.1 models )
SIMPROCESS User’s Manual
472
APPENDIX C - SIMPROCESS File Structure
SPSYSTEM Directory
InstallSettings.win.xml ( defaults for some preference settings - Windows
only )
InstallSettings.lnx.xml ( defaults for some preference settings - Linux
only )
jh.jar
( SIMPROCESS executable jar file )
plot.jar
( SIMPROCESS executable jar file )
simprocess.jar
( SIMPROCESS executable jar file )
SPHelp.jar
( SIMPROCESS executable jar file )
SPRemote.jar
( SIMPROCESS executable jar file )
xalan-j.jar
( SIMPROCESS executable jar file )
OptQuest.jar
( SIMPROCESS executable jar file )
java2rei.jar
( SIMPROCESS executable jar file - Windows only)
jcommon.jar
( SIMPROCESS executable jar file )
jfreechart.jar
( SIMPROCESS executable jar file )
jakarta-poi.jar
( SIMPROCESS executable jar file )
modelfit.jar
( SIMPROCESS executable jar file )
jcalendar.jar
( SIMPROCESS executable jar file )
commons-io.jar
( SIMPROCESS executable jar file )
metamodel.jar
( SIMPROCESS executable jar file )
xbean.jar
( SIMPROCESS executable jar file )
simprocess.err
( SIMPROCESS application error messages; created and/
or emptied when SIMPROCESS is run )
simprocess.log
( SIMPROCESS application messages; created and/or emptied when SIMPROCESS is run )
optQuest.log
( OptQuest for SIMPROCESS application messages )
optQuest.err
( OptQuest for SIMPROCESS application error messages )
GetStart.pdf
( documentation file )
SPUser.pdf
( documentation file )
Metamodel.pdf
( documentation file )
RoseExists.dll
( SIMPROCESS Rose library - Windows only )
license.dll
( SIMPROCESS license library - Windows only)
libLinux.so
( SIMPROCESS license library - Linux only )
license.dat
( license file obtained from CACI )
xfit Subdirectory
This directory only exists on Windows systems and contains the files necessary to run the ExpertFit
application.
SPUser Directory
sProcDB.properties
( database connection properties - required to use
the SIMPROCESS database )
mysql.sProcDB.properties( sample database connection properties for use
SIMPROCESS User’s Manual
473
APPENDIX C - SIMPROCESS File Structure
with a MySQL database; may serve as a template for other database tools )
SimProcDB.mdb
( MS Access database - Windows only )
simprocessdb.sql
( sample DDL statements to create a "simprocess"
database in MySQL for storing Experiment results; may serve as a template
for other database tools )
UserPreferences.xml
( created on first run, user preferences stored
here )
UserFiles.jar
( created when importing application graphics and
icons, or when saving Libraries )
Experiments.xml
(created when experiments are defined or imported)
document Subdirectory
This directory is used to customize headings for Activity, Entity, Connector, Resource, and model
documentation (Document button on properties dialogs). The directory is empty initially. The
headings are customized with the use of text files that have the extension .txt. Each line of a file
is considered a heading. For instance, the lines
Activity Name:
Resources Used:
in a file would be considered two separate headings. The contents of the .txt files completely
replace the default headings.
Listed below are the names that can be used for the .txt files.
•
•
•
•
•
•
Activity.txt - changes the headings for all Activities
process.txt - changes the headings for processes
Entity.txt - changes the headings for Entity types
Resource.txt - changes the headings for Resources
Connector.txt - changes the headings for Connectors
model.txt - changes the headings for the Model Description... (Define menu).
The file Activity.txt changes the headings for all Activities. To change the documentation
headings for a specific Activity, name the file the same name as the type of the Activity along with
the .txt extension. Some examples are delay.txt, replenishResource.txt, assemble.txt, and getResource.txt. Notice that the type of the Activity must be spelled out
completely with no spaces in the file name.
Not all files are required. If only the document headings for Entity types need to be changed, then
Entity.txt is the only file that needs to exist.
SIMPROCESS User’s Manual
474
APPENDIX C - SIMPROCESS File Structure
There are sample files in the SampleFiles/document directory.
SampleFiles Subdirectory
This directory contains the source code for the files in the com.caci.demo package in SPRemote.jar. Also, sample batch files and scripts that start the Java RMI Registry, SPServer, and
SPPlotServer are included, which can be copied and used as templates if desired. There is a documents subdirectory that contains sample files for modifying document headings.
models Directory
SIMPROCESS defaults to this directory as its starting point when saving or opening models.
Demos Subdirectory
This directory contains demonstration and reference models. See Chapter 5 of the SIMPROCESS
Getting Started Manual for a discussion of each model.
ExpressionDemos Subdirectory
This directory contains models that demonstrate some advanced features of SIMPROCESS available through the SIMPROCESS Expression Language. SIMPROCESS Expression Demo
Models.pdf, which is located in this directory, has a brief explanation of each model.
metamodel Directory
Directory containing SIMPROCESS metamodels. Metamodels must be saved to or opened from
this directory.
endorsed Directory
saaj-api.jar
saaj-impl.jar
jaxrpc-api.jar
jaxrpc-impl.jar
jaxrpc-spi.jar
activation.jar
sjsxp.jar
mail.jar
relaxngDatatype.jar
xsdlib.jar
jsr173_api.jar
(
(
(
(
(
(
(
(
(
(
(
SIMPROCESS
SIMPROCESS
SIMPROCESS
SIMPROCESS
SIMPROCESS
SIMPROCESS
SIMPROCESS
SIMPROCESS
SIMPROCESS
SIMPROCESS
SIMPROCESS
executable
executable
executable
executable
executable
executable
executable
executable
executable
executable
executable
SIMPROCESS User’s Manual
jar
jar
jar
jar
jar
jar
jar
jar
jar
jar
jar
file
file
file
file
file
file
file
file
file
file
file
)
)
)
)
)
)
)
)
)
)
)
475
APPENDIX C - SIMPROCESS File Structure
FastInfoSet.jar
( SIMPROCESS executable jar file )
jre Directory
This directory contains the Java Runtime Environment referenced by the SIMPROCESS program.
ext Directory
This directory is a secondary location for adding external Java classes to SIMPROCESS. The preferred location is the classes directory within a model’s directory (see “Model-Specific Java
Additions,” beginning on page 604 and “Method ExternalCall:,” beginning on page 567 for more
information).
dashboardserver Directory
This directory contains the files required to run a Dashboard Server. (See “Displaying Dashboards”
on page 447.)
timeserver Directory
This directory contains the files required to run the SIMPROCESS TimeServer. See “Time Server,”
beginning on page 113 and SIMPROCESS TimeServer.pdf in this directory for more information
on the TimeServer.
dispatcher Directory
This directory is only created if SIMPROCESS and Dispatcher is selected during installation. The files
are for using SIMPROCESS with a Web service. See SIMPROCESS Dispatcher.pdf for more
information.
SIMPROCESS User’s Manual
476
APPENDIX D
Statistical Distributions
The following pages give a brief description of the standard statistical distributions available in
SIMPROCESS, as well as their required parameters.
Most of the parameters for continuous distributions can be classified, on the basis of their physical
or geometric interpretation, as being one of three basic types: location, scale, or shape parameters. The
following discussion is taken from the book Simulation Modeling and Analysis (Third Edition) by Law
and Kelton (2000).
A location parameter l specifies an abscissa (x axis) location point of a distribution's range of values;
usually, l is the midpoint (e.g., the mean of a normal distribution) or lower endpoint (e.g., location
for a Pearson type V distribution) of the distribution’s range. As l changes, the associated distribution
merely shifts left or right without otherwise changing. Also, if the distribution of the random variable
X has a location parameter of 0, then the distribution of the random variable Y = X + l has a location
parameter of l.
A scale parameter b determines the scale (or unit) of measurement of the values in the range of the
distribution. (The standard deviation is a scale parameter for the normal distribution.) A change in b
compresses or expands the associated distribution without altering its basic form. Also, if the random
variable X has a scale parameter of 1, the distribution of the random variable Y = bX has a scale parameter
of b.
A shape parameter a determines, distinct from location and scale, the basic form or shape of a
distribution with the general family of distributions of interest. A change in a generally alters a
distribution's properties (e.g., skewness) more fundamentally than a change in location or scale. Some
SIMPROCESS User’s Manual
477
Appendix D - Statistical Distributions
distributions (e.g., exponential and normal) do not have a shape parameter, while others (e.g., beta
and Pearson type VI) may have two.
The last parameter of each distribution is the stream number.This is the random-number stream that
will be used to general random values from the distribution. Possible values for stream are 1, 2, …,
215, with 1 being the default.
SIMPROCESS User’s Manual
478
Appendix D - Statistical Distributions
Uniform Distribution
Probability density function and cumulative density function for a uniform distribution with minimum = 3
and maximum = 7.
Syntax: Uni(minimum, maximum, stream)
The uniform distribution (continuous) is equally likely to take on any real number in the finite interval
[minimum, maximum] (minimum >= 0.0 and maximum > minimum). The real numbers produced
by a random-number generator (appear to) have a uniform distribution on the interval [0, 1].
SIMPROCESS User’s Manual
479
Appendix D - Statistical Distributions
Normal Distribution
Probability density function and cumulative density function for normal distribution function with mean =
10, standard deviation = 1. There are two normal distributions in SIMPROCESS. One only returns non-negative values (zero or higher), and the other will return negative values. For both it is required that standard
deviation > 0.0.
Syntax: Nor(mean, standard deviation, stream) - returns only non-negative values
This distribution is similar to the classical normal distribution, but if a negative value is generated,
it is rejected and new values are generated until a non-negative value is generated. In general, this
distribution will not be a good model for the time required to perform some task, since task-time
distributions are almost always skewed to the right.
Syntax: Nrm(mean, standard deviation, stream) - unbounded
This is the classical normal distribution, which is found in most statistics books. It takes on real values
between minus infinity and plus infinity. The density function is the familiar "bell-shaped" curve, which
is symmetric about the mean. The probability that a value is between the mean minus 2 standard
deviations and the mean plus two standard deviations is approximately 0.95. This distribution should
not be used to model the time required to perform some task, since the normal distribution can take
on negative values. Furthermore, as stated above, the distribution of the time to perform some task
is almost always skewed to the right, rather than being symmetric.
SIMPROCESS User’s Manual
480
Appendix D - Statistical Distributions
Triangular Distribution
Probability density function and cumulative density function for a triangular distribution with minimum = 2,
mode = 6, and maximum = 8.
Syntax: Tri(minimum, mode, maximum, stream)
The triangular distribution (continuous) is typically used as a rough model for the time required to
perform some task when no real-world data are available. A triangular distribution takes on values
in the finite interval [minimum, maximum] (minimum >= 0.0, mode > minimum, and maximum
> mode), with values near the mode being most likely to occur. Subjective estimates of the three
parameters are obtained from subject-matter experts. The mean of a triangular distribution is only equal
to the mode when the distribution is symmetric.
SIMPROCESS User’s Manual
481
Appendix D - Statistical Distributions
Exponential Distribution
Probability density function and cumulative density function for an exponential distribution with mean = 1.
Syntax: Exp(mean, stream)
The exponential distribution (continuous) is commonly used to model interarrival times of customers
to some system when the arrival rate is approximately constant over the time period of interest. It is
also sometimes used to model the time to failure of a piece of equipment. The mean of an exponential
distribution is a scale parameter and must be greater than 0.0. An exponential distribution with mean
= m is a gamma distribution with mean = m and shape = 1. An exponential distribution with mean
= m is a Weibull distribution with shape = 1 and scale = m. If interarrival times of customers have
an exponential distribution with mean = m, then the number of arrivals in any time interval of length
t has a Poisson distribution (discrete) with mean = t/m.
SIMPROCESS User’s Manual
482
Appendix D - Statistical Distributions
Gamma Distribution
Probability density curve and cumulative density function for a gamma distribution with mean = 2 and shape
= 5.
Syntax: Gam(mean, shape, stream)
The gamma distribution (continuous) could be used to model the time required to perform some task.
If a gamma distribution has parameters mean = m and shape = a, then b = m/a is a scale parameter.
A gamma distribution with mean = m and shape = 1 is an exponential distribution with mean = m.
When shape is a positive integer, the gamma distribution is an Erlang distribution. Parameter
restrictions are mean >= 0.0 and 0.0 < shape < 100.0.
SIMPROCESS User’s Manual
483
Appendix D - Statistical Distributions
Beta Distribution
Probability density function and cumulative density function for a beta distribution with shape1 = 1.5,
shape2 = 5.0, minimum = 0.0, and maximum = 1.0.
Syntax: Bet(shape1, shape2, minimum, maximum, stream)
The beta distribution (continuous) could be used to model the time required to perform some task when
the possible values are restricted to the finite interval [minimum, maximum] (minimum >= 0.0,
maximum >= 1.0, and maximum > minimum). Parameter restrictions for shape1 and shape2 are
shape1 >= 0.0 and shape2 > 0.0. The density function is skewed to the left, symmetric, or skewed
to the right if shape1 > shape2, shape1 = shape2, or shape1 < shape2, respectively. A beta distribution
with shape1 = shape2 = 1 is a uniform distribution with the interval [0, 1].
SIMPROCESS User’s Manual
484
Appendix D - Statistical Distributions
Erlang Distribution
Probability density function and cumulative density function for an Erlang distribution with mean = 1 and
shape = 3.
Syntax: Erl(mean, shape, stream)
The Erlang distribution (continuous) could be used to model the time required to perform some task.
If an Erlang distribution has parameters mean = m and shape = a, then b = m/a is a scale parameter.
An Erlang distribution is just a gamma distribution whose shape parameter is a positive integer. The
sum of k exponential random variables with mean = m is an Erlang distribution with mean = km and
shape = k. Parameter restrictions are mean >= 0.0 and 0.0 < shape < 100.0.
SIMPROCESS User’s Manual
485
Appendix D - Statistical Distributions
Weibull Distribution
Probability density function and cumulative density function for a Weibull distribution with shape = 3 and
scale = 1.
Syntax: Wei(shape, scale, stream)
The Weibull distribution (continuous) could be used to model the time required to perform some task.
It is also sometimes used to model the time to failure of a piece of equipment. A Weibull distribution
with parameters shape = 1 and scale = b is an exponential distribution with mean = b. The Weibull
distribution is skewed to the left when shape > 3.6. Parameter restrictions are shape >= 0.0 and scale
> 0.0.
SIMPROCESS User’s Manual
486
Appendix D - Statistical Distributions
Lognormal Distribution
Probability density function and cumulative density function for a lognormal distribution with mean = 2 and
standard deviation = 1.
Syntax: Log(mean, standard deviation, stream)
The lognormal distribution could be used to model the time required to perform some task when "large"
values sometimes occur. It is always skewed to the right and it has a longer right tail than the gamma
or Weibull distributions. The lognormal distribution is closely related to the classical normal
distribution - see the book Simulation Modeling and Analysis (Third Edition) by Law and Kelton (2000)
for details. Furthermore, the parameters of the lognormal distribution, namely, mean and standard
deviation, correspond to the lognormal distribution and are not the mean and standard deviation of
the corresponding normal distribution. Parameter restrictions are mean > 0.0 and standard deviation
> 0.0.
SIMPROCESS User’s Manual
487
Appendix D - Statistical Distributions
Poisson Distribution
Poisson distribution with mean = 2.
Syntax: Poi(mean, stream)
The Poisson distribution (discrete) with mean = m is the distribution of the number of customers that
arrive to some system in any time interval of length 1 when the interarrival times have an exponential
distribution (continuous) with mean = 1/m. Mean must be greater than 0.0.
SIMPROCESS User’s Manual
488
Appendix D - Statistical Distributions
Hyper Exponential Distribution
Hyper exponential distribution with mean1 = 5, mean2 = 10, and probability1 = 0.5.
Syntax: Hex(mean1, mean2, probability1, stream)
The hyper exponential distribution (continuous) is a mixture of two exponential distributions.
Specifically, a hyper exponential distribution with parameters mean1, mean2, and probability1 takes
on values from an exponential distribution with parameter mean1 with a probability of probability1
and takes on values from an exponential distribution with parameter mean2 with a probability of 1
- probability1. A hyper exponential distribution with probability1 = 1 is an exponential distribution
with parameter mean1. Parameter restrictions are mean1 >= 0.0, mean2 > 0.0, and 0.0 <= probability1
<= 1.0.
SIMPROCESS User’s Manual
489
Appendix D - Statistical Distributions
Uniform Integer Distribution
Probability density function and cumulative density function for uniform integer distribution with minimum
= 7 and maximum = 16.
Syntax: Int(minimum, maximum, stream)
An uniform integer distribution (discrete) is equally likely to take on any integer in the finite interval
[minimum, maximum], where minimum and maximum are integers with minimum >= 0 and
minimum < maximum.
SIMPROCESS User’s Manual
490
Appendix D - Statistical Distributions
Geometric Distribution
Probability density function and cumulative density function for a geometric distribution with probability =
0.5.
Syntax: Geo(probability, stream)
The geometric distribution (discrete) with probability = p can be thought of as the distribution of the
number of failures before the first success in a sequence of independent Bernoulli trials, where success
occurs on each trial with a probability of p and failure occurs on each trial with a probability of 1 - p.
SIMPROCESS User’s Manual
491
Appendix D - Statistical Distributions
Pareto Distribution
Probability density function and cumulative density function for a Pareto distribution with location = 1 and
shape = 2.
Syntax: Par(location, shape, stream)
The Pareto distribution (continuous) could be used to the model interarrival times of customers (e.g.,
messages) when the traffic is bursty. The mean and variance are finite only if shape > 2. Parameter
restrictions are location >= 0.0 and shape > 0.0.
SIMPROCESS User’s Manual
492
Appendix D - Statistical Distributions
Binomial Distribution
Probability density function and cumulative density function for a binomial distribution with trials = 5 and
probability = 0.5.
Syntax: Bin(trials, probability, stream)
The binomial distribution (discrete) with parameters trials = t (a positive integer) and probability =
p can be thought of as the distribution of the number of successes in t independent Bernoulli trials,
where success occurs on each trial with a probability of p and failure occurs on each trial with a
probability of 1 - p. A binomial distribution with trials = 1 is called a Bernoulli distribution with
probability = p.
SIMPROCESS User’s Manual
493
Appendix D - Statistical Distributions
Negative Binomial Distribution
Probability density function and cumulative density function for a negative binomial distribution with s = 5
and probability = 0.5.
Syntax: NgB(s, probability, stream)
The negative binomial distribution (discrete) with parameters s (> 0.0) and probability = p can be
thought of as the distribution of the number of failures before the sth success in a sequence of
independent Bernoulli trials, where success occurs on each trial with a probability of p and failure occurs
on each trial with a probability of 1 - p. A negative binomial distribution with parameters s = 1 and
probability = p is a geometric distribution with probability = p.
SIMPROCESS User’s Manual
494
Appendix D - Statistical Distributions
Inverse Gaussian Distribution
Probability density function and cumulative density function for an inverse Gaussian distribution with location = 0, scale = 1, and shape = 4.
Syntax: InG(location, scale, shape, stream)
The inverse Gaussian distribution (continuous) could be used to model the time required to perform
some task. Parameter restrictions are scale > 0.0 and shape > 0.0.
SIMPROCESS User’s Manual
495
Appendix D - Statistical Distributions
Inverted Weibull
Probability density function and cumulative density function for an inverted Weibull distribution with location = 0, scale = 1, and shape = 2.
Syntax: InW(location, scale, shape, stream)
The inverted Weibull distribution (continuous) could be used to model the time required to perform
some task. The mean and variance are finite only if shape > 2. If the random variable X has an inverted
Weibull distribution with location = 0, scale = b, and shape = a, then Y = 1/X has a Weibull distribution
with scale = 1/b and shape = a. (The location parameter is 0.) Parameter restrictions are scale > 0.0
and shape > 0.0.
SIMPROCESS User’s Manual
496
Appendix D - Statistical Distributions
Johnson SB Distribution
Probability density function and cumulative density function for a Johnson SB distribution with minimum =
0, maximum = 1, shape1 = 2, and shape2 = 2.
Syntax: JSB(minimum, maximum, shape1, shape2, stream)
The Johnson SB distribution (continuous) could be used to model the time required to perform some
task when the possible values are restricted to the finite interval [minimum, maximum]. The density
function is skewed to the left, symmetric, or skewed to the right if shape1 > 0, shape1 = 0, or shape1
< 0, respectively. The Johnson SB distribution is closely related to the classical normal distribution
- see the book Simulation Modeling and Analysis (Third Edition) by Law and Kelton (2000) for details.
Parameter restrictions are shape2 > 0.0 and maximum > minimum.
SIMPROCESS User’s Manual
497
Appendix D - Statistical Distributions
Johnson SU Distribution
Probability density function and cumulative density function for a Johnson SU distribution with location = 0,
scale = 1, shape1 = -2, and shape2 = 2.
Syntax: JSU(location, scale, shape1, shape2, stream)
The Johnson SU distribution (continuous) could be used to model a random variable that can take on
any value between minus infinity and plus infinity. The density function is skewed to the left,
symmetric, or skewed to the right if shape1 > 0, shape1 = 0, or shape1 < 0, respectively. The Johnson
SU distribution is closely related to the classical normal distribution - see the book Simulation Modeling
and Analysis (Third Edition) by Law and Kelton (2000) for details. Parameter restrictions are scale
> 0.0 and shape2 > 0.0.
SIMPROCESS User’s Manual
498
Appendix D - Statistical Distributions
Log-Logistic Distribution
Probability density function and cumulative density function for a Log-Logistic distribution with location =
0, scale = 1, and shape = 3.
Syntax: LLg(location, scale, shape, stream)
The log-logistic distribution (continuous) could be used to model the time required to perform some
task. The mean and variance are finite only if shape > 2. Parameter restrictions are scale > 0.0 and
shape > 0.0.
SIMPROCESS User’s Manual
499
Appendix D - Statistical Distributions
Log-Laplace Distribution
Probability density function and cumulative density function for a log-Laplace distribution with location =
0, scale = 1, and shape = 2.
Syntax: LLp(location, scale, shape, stream)
The log-Laplace distribution (continuous) could be used to model the time required to perform some
task. The mean and variance are finite only if shape > 2. Parameter restrictions are scale > 0.0 and
shape > 0.0.
SIMPROCESS User’s Manual
500
Appendix D - Statistical Distributions
Pearson Type V Distribution
Probability density function and cumulative density function for a Pearson type V distribution with location
= 0, scale = 1, and shape = 2.
Syntax: PT5(location, scale, shape, stream)
The Pearson type V distribution (continuous) could be used to model the time required to perform some
task. The mean and variance are finite only if shape > 2. The Pearson type V distribution is closely
related to the gamma distribution - see the book Simulation Modeling and Analysis (Third Edition)
by Law and Kelton (2000) for details. Parameter restrictions are scale > 0.0 and shape > 0.0.
SIMPROCESS User’s Manual
501
Appendix D - Statistical Distributions
Pearson Type VI Distribution
Probability density function and cumulative density function for a Pearson type VI distribution with location
= 0, scale = 1, shape1 = 3, and shape2 = 4.
Syntax: PT6(location, scale, shape1, shape2, stream)
The Pearson type VI distribution (continuous) could be used to model the time required to perform
some task. The density function can take on a wide variety of shapes because it has two shape parameters
shape1 and shape2. The mean and variance are finite only if shape2 > 2.The Pearson type VI
distribution is closely related to the beta distribution - see the book Simulation Modeling and Analysis
(Third Edition) by Law and Kelton (2000) for details. Parameter restrictions are scale > 0.0 and shape1
> 0.0.
SIMPROCESS User’s Manual
502
Appendix D - Statistical Distributions
Random Walk Distribution
Probability density function and cumulative density function for a random walk distribution with location =
0, scale = 1, and shape = 3.
Syntax: RnW(location, scale, shape, stream)
The random walk distribution (continuous) could be used to model the time required to perform some
task. Parameter restrictions are scale > 0.0 and shape > 0.0.
SIMPROCESS User’s Manual
503
Appendix D - Statistical Distributions
Empirical Distribution
Empirical distributions are not found on the SIMPROCESS distribution list. An empirical distribution
can only be created by an Auto Fit distribution. (See “Auto Fits Distributions” on page 101.) Thus,
the name of the Auto Fit distribution appears on the SIMPROCESS distribution list, not the empirical
distribution itself.
Empirical distributions consist of pairs of cumulative probability and value and can be discrete or
continuous. This is the same format as Tabular Distributions. (See “Tabular Distributions” on page 99.)
SIMPROCESS User’s Manual
504
APPENDIX E
Statistical Tools Glossary
Absolute Deviation
The average deviation of the data set from the mean. It is computed using the absolute value of the
difference between a data point and the mean, rather than squared differences used in computing the
variance.
Alpha
The probability that an estimate of a parameter does not contain the true value. In statistics, this is
referred to as Type I error.
Alternate Hypothesis
The complement of the null hypothesis.
Cdf
Cumulative distribution function.
SIMPROCESS User’s Manual
505
Appendix E - Statistical Tools Glossary
χ2 goodness of fit test
A goodness of fit test that uses an χ2 statistic to evaluate the goodness of fit. The χ2 goodness of fit test
creates an empirical distribution for the data. The empirical distribution used is a histogram. The height
of each bin of the histogram is equal to the number of points in the data set that fall between the lower
and upper bounds of the bin. The χ2 statistic is computed as the sum of squared differences of the values
observed for each bin of the histogram to the number of observations expected from the probability
distribution over the same range as the bin.
Confidence Interval
An interval that contains the true value of a parameter with a given probability.
Continuous Domain
A domain whose variables can take on any value in an interval (real numbers). Integer domains are
sometimes interpreted as continuous domains with the implicit assumption that the integers represent
an underlying continuous domain.
Data Set
A vector (or equivalently, an array or column) of data points that are the realization of a random process.
Degrees of Freedom
The number of independent elements in a statistical computation. The degrees of freedom must be
known to compute the probability of a test statistic such as the χ2 statistic.
Dof
Acronym for degrees of freedom.
Enumeration Domain
A domain whose range is the set of elements in the enumeration.
SIMPROCESS User’s Manual
506
Appendix E - Statistical Tools Glossary
Goodness of fit test
A statistical test used to determine the probability that an observed data set came from a probability
distribution. The null hypothesis is that the data set is drawn from the probability distribution. The alternate
hypothesis is that the data set is not drawn from the probability distribution. A test statistic is computed to
evaluate the hypothesis. If the probability of observing the test statistic is small (less than alpha), the fit is
rejected.
IID
Identically and independently distributed. In simulation, identical means that observations are made
from a hypothesized distribution of values that does not change over simulated time. Independent
means that observations of one replication are not correlated with other observations, i.e., if one
observation has a value of X, then the next observation is probably close to X.
Image Editor
An editor that contains graphs, tables, or text for viewing the results of a statistical analysis.
Integer-valued Domain
A domain whose range is the set of integer numbers.
KS
Acronym for Kolmogorov-Smirnov.
KS goodness of fit test
A goodness of fit test that uses the D statistic to evaluate the goodness of fit. The KS goodness of fit
test creates an empirical distribution for the data. The empirical distribution assigns a probability of
1/N to each data point where N is number of data points in the data set. The D statistic is computed
as the maximum difference between the cumulative distribution function of the empirical distribution
and the cumulative distribution function of the probability distribution being tested.
SIMPROCESS User’s Manual
507
Appendix E - Statistical Tools Glossary
Kurtosis
Characterizes the relative peakedness or flatness of a distribution relative to the normal distribution.
A data set with positive kurtosis has a sharper peak than a normal distribution, while a data set with
negative kurtosis has a flatter peak than the normal distribution.
Maximum Likelihood Estimate
A statistical technique for estimating the parameters of a hypothesized distribution of a data set.
Mean
Average value of a data set.
MLE
Acronym for maximum likelihood estimate.
Mode
The mode of a probability distribution is the value of X where it takes on its maximum value. If the
distribution is multiply-peaked, there may not be a unique mode.
Model Element
A named object in the simulation model that has one or more simulation input variables that can be
designated as factors for an experiment. The model elements include Activities, Resources, and Entity
types.
Pdf
Probability density function.
Performance Measure.
An output statistic that quantifies some behavior of the model.
SIMPROCESS User’s Manual
508
Appendix E - Statistical Tools Glossary
Percentiles
In a data set ranked by value of the data points, a percentile refers to the data point at the relative position
by rank of the data point in the data set. For example, in a data set of a hundred points, the 75th percentile
(75%) point is the data point that is in the 75th position when ranked by value.
Quartile Range
Difference between the 25th percentile value and 75th percentile value of the data set.
Range
Difference between the minimum and maximum values of a data set.
Real-valued Domain
A domain whose range is the set of real numbers.
Residuals
The differences between the actual values observed and the expected values as computed by a statistical
test.
Sample Domain
A domain whose range is the set of probability distributions supported by SIMPROCESS.
Skewness
Characterizes the degree of asymmetry of a distribution around its mean. A data set with positive
skewness has a long tail to the right of its mean. A data set with negative skewness has a long tail to
the left of its mean.
SIMPROCESS User’s Manual
509
Appendix E - Statistical Tools Glossary
Standard Deviation
Square root of the variance.
Standard Error
A measure of the spread of the data set about the mean. Typically, standard error is the one sigma error
about the mean of the data set computed as the standard deviation divided by the square root of the
number of data points.
Variance
Variability of data set about the mean.
SIMPROCESS User’s Manual
510
APPENDIX F
SIMPROCESS System Attributes and Methods
Chapter 10 discussed user defined attributes. SIMPROCESS also includes numerous predefined
System Attributes and Methods. Each are listed along with a description. Also, there are examples
for several of the System Methods.
SIMPROCESS User’s Manual
511
Appendix F - SIMPROCESS System Attributes and Methods
System Attributes
This section lists all the SIMPROCESS system attributes in a table.
SIMPROCESS System Attributes
Model Elements
Attribute Namea
Get/
Set
System Levelb
Model
Get
OBJECT
Reference of the Model being simulated.
Self
Get
OBJECT
Reference of the Model Element
itself.
Background
Get
BOOLEAN
TRUE if the model is being simulated
without the GUI.
Replication
Get
INTEGER
Current replication number.
Name
Get
STRING
Name of the Entity.
Priority
Both
INTEGER
Default priority for Entity instances
of this type.
NumberIn
Get
INTEGER
Number of Entity instances of this
type currently in the system.
NumberCreated
Get
INTEGER
Number of Entity instances generated
for this type.
NumberDisposed
Get
INTEGER
Number of disposed Entity instances
of this type.
NumberWaiting
Get
INTEGER
Number of Entity instances of this
type waiting for resources
NumberOnHold
Get
INTEGER
Number of Entity instances of this
type holding for condition
Interrupt
Both
BOOLEAN
Determines whether Entity instances
of this type will interrupt the
processing of a lower priority Entity.
Name
Get
STRING
Name of this Entity.
Entity Type
Entity (instance)
Attribute
Type
SIMPROCESS User’s Manual
Description
512
Appendix F - SIMPROCESS System Attributes and Methods
SIMPROCESS System Attributes
Model Elements
Attribute Namea
Get/
Set
Attribute
Type
Activity
Get
OBJECT
Reference of Activity this Entity
instance resides in.
AcceptTime
Get
REAL
Time Entity enters an Activity or Process.
ActivityTime
Get
REAL
Total time Entity was in an Activity,
whether waiting, on hold, or processing. Does not apply to Processes.
BatchSize
Get
INTEGER
Number of Entity instances in this
Entity’s batch.
CreateTime
Get
REAL
Time the Entity instance was created.
EndWait
Both
BOOLEAN
TRUE if Entity wait for Resources
was interrupted by MaxWait time.
EnterTime
Get
REAL
Time the Entity instance entered the
current Activity.
HasParent
Get
BOOLEAN
TRUE if the Entity instance was created by a Split Activity.
LastDelay
Get
REAL
Last processing delay time at an
Activity.
MaxWait
Both
REAL
Maximum time Entity will wait for
Resource allocation. Default is 0.0
(unlimited).
NumberIn
Get
INTEGER
Number of Entity instances of the
same type currently in the system.
NumberCreated
Get
INTEGER
Number of Entity instances of the
same type has generated.
NumberDisposed
Get
INTEGER
Number of Entity instances of the
same type has disposed.
NumberWaiting
Get
INTEGER
Number of Entity instances of the
same type waiting for resources
NumberOnHold
Get
INTEGER
Number of Entity instances of the
same type holding for condition
SIMPROCESS User’s Manual
Description
513
Appendix F - SIMPROCESS System Attributes and Methods
SIMPROCESS System Attributes
Model Elements
Resource
Attribute Namea
Get/
Set
Attribute
Type
Parent
Get
OBJECT
Returns the Parent Entity instance of
this Entity instance. An Entity
instance only has a Parent when it
was created by a Split Activity. The
original Entity instance entering the
Split Activity is the Parent.
Priority
Both
INTEGER
Priority of this Entity instance.
ReleaseTime
Get
REAL
Time Entity is released from an
Activity or Process.
SequenceNum
Get
INTEGER
A unique number given to each Entity
as it is created.
Type
Get
OBJECT
Entity Type reference of this Entity
instance.
Interrupt
Both
BOOLEAN
Determines whether this Entity
instance will interrupt the processing
of a lower priority Entity.
Name
Get
STRING
Name of the Resource.
Activity
Get
OBJECT
Reference of Activity currently trying
to assign or free this Resource (if
any).
Capacity
Get
REAL
Resource capacity.
Entity
Get
OBJECT
Reference of current Entity instance
being processed by the Activity
trying to assign this Resource (if any).
LastDowntime
Get
REAL
Duration of most recently initiated
downtime.
NumberWaiting
Get
INTEGER
Number of Entities waiting for this
Resource.
StartDowntime
Get
REAL
Time most recently initiated downtime started.
SIMPROCESS User’s Manual
Description
514
Appendix F - SIMPROCESS System Attributes and Methods
SIMPROCESS System Attributes
Model Elements
Connector
Activity’s Group
I
Activity’s Group
II
Attribute Namea
Get/
Set
Attribute
Type
UnitsBusy
Get
REAL
Number of units of the Resource in
busy state.
UnitsDown
Get
REAL
Number of units of the Resource not
available because of the application
of a downtime.
UnitsIdle
Get
REAL
Number of units of the Resource in
idle state.
Name
Get
STRING
Name of the Connector.
NumberAccepted
Get
INTEGER
Number of Entities so far entered the
Connector.
NumberReleased
Get
INTEGER
Number of Entities exited the Connector.
NumberIn
Get
INTEGER
Number of Entities currently on the
Connector.
LastDelay
Get
REAL
The value most recently initiated
delay.
NextDelay
Set
REAL
Change the value of the next delay
ONLY.
AllFutureDelays
Set
REAL
Change the value of all future delays
henceforth.
Name
Get
STRING
Name of the Activity.
Parent
Get
OBJECT
Reference of this Activity’s parent
process.
Entity
Get
OBJECT
Reference of the current Entity.
Sibling(name:
STRING)
Get
OBJECT
It returns the reference to the Activity
or process with the specified name in
the same hierarchical level.
NumberAccepted
Get
INTEGER
Number of Entities so far entered this
Activity.
SIMPROCESS User’s Manual
Description
515
Appendix F - SIMPROCESS System Attributes and Methods
SIMPROCESS System Attributes
Model Elements
Activity’s Group
III
Assemble
Assign
Attribute Namea
Get/
Set
NumberReleased
Get
INTEGER
Number of Entities exited this Activity.
NumberIn
Get
INTEGER
Number of Entities currently at this
Activity.
LastDelay
Get
REAL
The value of the most recently initiated delay.
NextDelay
Set
REAL
Change the value of the next delay
ONLY.
AllFutureDelays
Set
REAL
Change the value of all future delays
henceforth.
Description
ActivatedByNoMatch
Get
BOOLEAN
Checks if the expression is activated
by an Entity exiting through the
NoMatch Pad.
ActivatedByTrigger
Get
BOOLEAN
Checks if the expression is activated
by an Entity entering from the Trigger Pad.
AssembleEntityType
Both
OBJECT
Type of Entity to create when an
Assemble occurs.
BatchEntities
Both
BOOLEAN
Value for whether to batch component Entities with assembled Entity.
NumberWaiting
Get
INTEGER
Number of Entities at this activity
waiting for resources.
NumberOnHold
Get
INTEGER
Number of Entities at this activity
holding for condition.
Get
INTEGER
Number of Entities at this activity
waiting for resources
Group I, II, & III
Group I, II, & III
NumberWaiting
Batch
Attribute
Type
Group I, II, & III
SIMPROCESS User’s Manual
516
Appendix F - SIMPROCESS System Attributes and Methods
SIMPROCESS System Attributes
Model Elements
Branch
Clone
Delay
Attribute Namea
Get/
Set
BatchEntityType
Both
OBJECT
Type of Entity to create when a Batch
occurs.
MaxBatchSize
Both
INTEGER
Number of Entities to batch.
MinBatchSize
Both
INTEGER
Number of Entities must be in a batch
before it can be released.
MaxWaitTime
Both
REAL
Time to wait before releasing undersize batch.
NumberWaiting
Get
INTEGER
Number of Entities at this activity
waiting for resources
NumberOnHold
Get
INTEGER
Number of Entities at this activity
holding for condition
Description
BranchName
Set
STRING
Name of the Connector to be taken by
the next Entity.
NumberWaiting
Get
INTEGER
Number of Entities at this activity
waiting for resources
NumOutEntities
Both
INTEGER
Number of Entities to output per Connector.
NumberWaiting
Get
INTEGER
Number of Entities at this activity
waiting for resources
Get
INTEGER
Number of Entities at this activity
waiting for resources
MaxCount
Both
INTEGER
Number of Entities disposed to signal
End Simulation event.
NumberDisposed
Get
INTEGER
Number of Entities so far disposed at
this Activity.
Group I, II, & III
Group I, II, & III
Group I, II, & III
NumberWaiting
Dispose
Attribute
Type
Group I & II
SIMPROCESS User’s Manual
517
Appendix F - SIMPROCESS System Attributes and Methods
SIMPROCESS System Attributes
Model Elements
Attribute Namea
Free Resource
Group I & II
Gate
Group I, II, & III
Generate
Attribute
Type
Description
ActivatedByTrigger
Get
BOOLEAN
Checks if the expression is activated
by an Entity entering from the Trigger Pad.
AutoRelCount
Both
INTEGER
Number of Entities for threshold
release.
AutoRelease
Both
BOOLEAN
Whether threshold release is on.
BatchEntities
Both
BOOLEAN
Value for whether to batch released
Entities
BatchEntityType
Both
OBJECT
Type of Entity to create when a Batch
occurs.
LastRelCount
Get
INTEGER
Number of Entities released in the
previous threshold/trigger release.
TrigNextRelCount
Both
INTEGER
Value of the trigger release quantity
at the next trigger.
TrigFutureRelCount
Set
INTEGER
Change the trigger release quantity
for all future triggered release henceforth.
NumberWaiting
Get
INTEGER
Number of Entities at this activity
waiting for resources
NumberOnHold
Get
INTEGER
Number of Entities at this activity
holding for condition
Get
INTEGER
Number of Entities generated at this
Activity.
Get
INTEGER
Number of Entities at this activity
waiting for resources
Group I
NumberGenerated
Get Resource
Get/
Set
Group I & II
NumberWaiting
SIMPROCESS User’s Manual
518
Appendix F - SIMPROCESS System Attributes and Methods
SIMPROCESS System Attributes
Model Elements
Attribute Namea
Join
Group I, II, & III
Get/
Set
Attribute
Type
BatchEntities
Both
BOOLEAN
Value for whether to batch family
members with original Entity
NumberWaiting
Get
INTEGER
Number of Entities at this activity
waiting for resources
NumberOnHold
Get
INTEGER
Number of Entities at this activity
holding for condition
Get
OBJECT
For hierarchical processes ONLY. It
returns the reference to the child
Activity or process with the specified
name.
Get
INTEGER
Number of Entities at this activity
waiting for resources
NumberWaiting
Get
INTEGER
Number of Entities at this activity
waiting for resources
NumberOnHold
Get
INTEGER
Number of Entities at this activity
holding for condition
NumOutEntities
Both
INTEGER
Number of output Entities.
NumberWaiting
Get
INTEGER
Number of Entities at this activity
waiting for resources
TransformEntityType
Both
OBJECT
Type of Entity to create when a
Transform occurs.
Merge
Group I & II
Process
Group I & II
Child(name :
STRING)
Replenish
Resource
Group I & II
Split
Group I, II, & III
NumberWaiting
Synchronize
Transform
Description
Group I, II, & III
Group I, II, & III
SIMPROCESS User’s Manual
519
Appendix F - SIMPROCESS System Attributes and Methods
SIMPROCESS System Attributes
Model Elements
Attribute Namea
Unbatch
Group I, II, & III
Get/
Set
Attribute
Type
Description
NumberWaiting
Get
INTEGER
Number of Entities at this activity
waiting for resources
RetainBatchedEntities
Both
BOOLEAN
Value of Retain Batched Entities
UnbatchNestedBatches
Both
BOOLEAN
Value of Unbatch Nested Batches
a. System attributes’ names must be input as shown. They are case sensitive.
b. Attributes in this category can be referenced in any expression.
SIMPROCESS User’s Manual
520
Appendix F - SIMPROCESS System Attributes and Methods
SIMPROCESS System Methods
SIMPROCESS System Methods
Method Namea
Arguments
Return
Description
ABS
X: INTEGER or REAL
INTEGER or
REAL
Returns the absolute value of X.
The type (INTEGER or REAL)
of the returned value will be the
same type as the argument.
ActivateGenerate
Generate Name: STRING
NONE
If not already started, starts the
generation of Entities by the
specified generate activity.
ACOS
X: REAL
REAL
Returns the ACOSine of X.
AddPlotLegend
Plot: OJBECT
Dataset: INTEGER
Label: STRING
Color (Optional): STRING
NONE
Adds a legend to a plot created
through expressions (CreatePlot
system method). Datasets are
numbered beginning with 0. The
Label of the legend must be
specified. Specifying the Color is
optional.
Alert
MasterEditorb,
Message: STRING
NONE
Display a message in the Alert dialog and wait for the user to close
this dialog.
ASIN
X: REAL
REAL
Returns the ASine of X.
ATAN
X: REAL
REAL
Returns the ATANgent of X.
ATAN2
Y: REAL, X: REAL
REAL
Returns the ATANgent of X and
Y.
SIMPROCESS User’s Manual
521
Appendix F - SIMPROCESS System Attributes and Methods
SIMPROCESS System Methods
Method Namea
Arguments
Return
Description
Attribute
AttributeName: STRING
OBJECT
Returns the reference to the specified Attribute. AttributeName
follows the same convention as
specifying Attributes in Expressions. That is, qualifiers (Entity,
Entity.Type, and Model) might
be required before the Attribute
name (such as Entity.StartTime).
The object owning the Attribute
can be specified by including a
colon (:) and the name of the object in AttributeName. For example Attribute(“Time:Dispose1”)
would return the Attribute named
Time from the Activity Dispose1.
The object reference can be an
Entity Type, Resource, or Activity. Note that using the object
name is the only way to retrieve
Resource Attributes.
Beep
MasterEditorb
NONE
Makes a beep sound.
BINARYTOINT
BinaryValue: STRING
INTEGER
Returns the integer value of a binary string.
CEIL
X: REAL
INTEGER
Returns the smallest integer not
less than X.
SIMPROCESS User’s Manual
522
Appendix F - SIMPROCESS System Attributes and Methods
SIMPROCESS System Methods
Method Namea
Arguments
Return
Description
ChangeColor
ActName: STRING,
Color: STRING
NONE
Changes the color of the specified Activity. Entity references
are no longer allowed. The keywords Self, Activity, and Parent
or the name of an activity is allowed for ActName. Note that a
keyword must be input as a
STRING (such as “Self”). The
Color can be any of the 65 colors
listed in the SIMPROCESS Color
Table at the end of this appendix.
To clear a color setting enter
“Clear” for the Color.
ClearMap
Map: OBJECT
NONE
Clears all values from the specified map.
ClearPlot
Plot: OBJECT
NONE
Clears the specified plot.
CloseDatabase
Database Connection: OBJECT
NONE
Closes the specified database
connection.
CloseFile
File Stream: OBJECT
NONE
Closes the specified file.
CloseSpreadsheet
File Stream: OBJECT
NONE
Closes the specified spreadsheet
file.
Confirm
MasterEditorb,
Message: STRING
BOOLEAN
Displays a message in the Confirm dialog and waits for the user
to respond; OK returns TRUE,
CANCEL returns FALSE.
Connector
ConnectorName: STRING
OBJECT
Returns the reference to the specified Connector.
COS
X: REAL
REAL
Returns the COSine of X.
SIMPROCESS User’s Manual
523
Appendix F - SIMPROCESS System Attributes and Methods
SIMPROCESS System Methods
Method Namea
CreateArray
Arguments
Type: STRING
Dimension1: INTEGER
Dimension2: INTEGER
DimensionN: INTEGER
SIMPROCESS User’s Manual
Return
Description
OBJECT
Returns an array of the specified
type (“REAL”, “INTEGER”,
“BOOLEAN”, “STRING”, or
“ANYOBJ”) with the specified
dimensions. For example, CreateArray(“REAL”, 2, 2), returns
a 2 x 2 array for REAL numbers.
Arrays of type REAL and INTEGER are initialized to zero.
Arrays of type BOOLEAN are
initialized to FALSE. Arrays of
type STRING or ANYOBJ are
not initialized, thus, attempting
to retrieve a value from an array
element that has no value will
result in an error.
524
Appendix F - SIMPROCESS System Attributes and Methods
SIMPROCESS System Methods
Method Namea
CreateAttribute
Arguments
Name: STRING;
Type: STRING;
Owner: STRING;
Mode: STRING;
DefaultValue: INTEGER,
REAL, BOOLEAN, or
STRING
ArraySize (Optional): INTEGER
DoNotReset (Optional):
BOOLEAN
StatType (Optional): STRING
SIMPROCESS User’s Manual
Return
NONE
Description
Creates an Attribute. This
method can only be used in the
Start Run Expression (Define/
Model Expressions). Name
should be a unique name that
contains no spaces or special
characters. An error will occur if
an Attribute with the same Name
and same Type already exists.
Allowable Type values are
Entity, Entity.Type, Resource,
Activity, or Model. Owner
should either be Global or the
name of the Attribute owner. The
Attribute owner can be an Entity
Type, Resource, or Activity.
Mode can be INTEGER, REAL,
BOOLEAN, STRING, or
OBJECT. The DefaultValue
should match the designated
Mode. If OBJECT is the Mode,
“Null” should be entered for the
DefaultValue. The remaining
parameters are optional. They
can be included in any order and
not all have to be used. ArraySize sets the array dimension of
the Attribute. A value of 0 indicates that the Attribute will not
be an array Attribute. If
DoNotReset is TRUE, the
Attribute will not be reset
between replications. This
parameter only applies to global
Attributes. It will be ignored for
local Attributes. StatType can be
Observation, TimeWeighted, or
None. This parameter is ignored
for Entity Attributes.
525
Appendix F - SIMPROCESS System Attributes and Methods
SIMPROCESS System Methods
Method Namea
Arguments
Return
Description
CreateEntityType
Name: STRING
Icon: STRING
Priority: INTEGER
Preempt: BOOLEAN
Entity Stats: BOOLEAN
NONE
Creates an Entity Type. This
method can only be used in the
Start Run Expression (Define/
Model Expressions). An error will
occur if an Entity Type with the
same name already exists in the
model. “Default” can be used for
the Icon parameter. Priority must
be between 1 and 100 inclusive.
Preempt sets the “Premept
Lower Priority Entities” property, and Entity Stats sets the
“Collect Entity Statistics” property.
CreateMap
Type: STRING
OBJECT
Returns a map of the specified
type ("REAL", "INTEGER",
"BOOLEAN", "STRING", or
"ANYOBJ"). Maps are not initialized to default values.
CreatePlot
Type: STRING
Title: STRING
X Axis Label (Optional):
STRING
Y Axis Label (Optional):
STRING
OBJECT
Creates plot and returns the Plot
object to an Attribute of type
Object. The Type can be Trace or
Histogram. The Type and the
Title are required. The axis labels
are optional, but to have a Y
Axis Label, there must be an X
Axis Label. AddPlotLegend is
used to add legends to the Plot.
PlotValue plots a new point. DisplayPlot causes the plot to be visible, and ClearPlot clears the plot
of all data.
SIMPROCESS User’s Manual
526
Appendix F - SIMPROCESS System Attributes and Methods
SIMPROCESS System Methods
Method Namea
Arguments
Return
Description
CreateResource
Name: STRING
Units: REAL
Fractional: BOOLEAN
Consumable: BOOLEAN
Resource Stats: BOOLEAN
Resource by Activity Stats:
BOOLEAN
NONE
Creates a Resource. This method
can only be used in the Start
Run Expression (Define/Model
Expressions). An error will occur
if a Resource with the same
name already exists in the model.
DateTime
None
STRING
Returns the current date and time
of the simulation in
MM/DD/YYYY
HH:MM:SS:MSEC:USEC:NSEC
format.
DayOfWeek
None
STRING
Returns the current day of the
week (Monday, Tuesday, etc.).
DecreaseCapacity
Resource Name: STRING
Units: INTEGER or REAL
NONE
Decreases the capacity of a Resource by the units specified.
DisplayPlot
Plot: OBJECT
NONE
Displays the specified plot. A
Plot can also be displayed by using the Menu (Report/Display
Real-Time Plots) or by using the
Display Plots button on the tool
bar.
DrawIntegerSample
Statistical Distribution:
STRING
INTEGER
Draws a sample of type integer
from the specified statistical distribution.
DrawRealSample
Statistical Distribution:
STRING
REAL
Draws a sample of type real from
the specified statistical distribution.
SIMPROCESS User’s Manual
527
Appendix F - SIMPROCESS System Attributes and Methods
SIMPROCESS System Methods
Method Namea
ElapsedTime
Arguments
Units (Optional): STRING
Start: STRING
End: STRING
Return
REAL
Description
Returns the amount of time
between the Start value and End
value. The Units is optional and
can be any valid time unit (“Seconds,” “Minutes,” etc.). If omitted, the value returned is in the
units set by Simulation Time Unit
in Run Settings. Start and End
use the format MM/DD/YYYY
HH:MM:SS:MSEC:USEC:NSEC.
The formats MM/DD/YY and
YYYY-MM-DD can also be used
for the date portion of Start and
End. The DateTime function can
be used for Start or End.
EntityExists
Gate: OBJECT
SequenceNum: INTEGER
INTEGER
Checks the specified Gate activity (obtained using the Gate System Method) for an Entity with
the specified SequenceNum.
Returns the position number of
the Entity in the Gate. This can
be used with the GetEntity System Method to return a reference
to the Entity. If the Entity is not
being held in the Gate activity, 0
is returned.
EXP
X: REAL
REAL
Returns e raised to the power of
X.
SIMPROCESS User’s Manual
528
Appendix F - SIMPROCESS System Attributes and Methods
SIMPROCESS System Methods
Method Namea
Arguments
Return
Description
ExternalCall
Class Name: STRING
Method Name: STRING
Method Parameters (as required by external method):
INTEGER, REAL, STRING,
BOOLEAN, OBJECT
BOOLEAN,
REAL,
INTEGER,
STRING,
or OBJECT
Executes a method of an external
Java class. Assumes the class is in
the appropriate package structure
in a classes directory within
the model’s directory or in a
properly constructed jar file in
the same location. (See “SIMPROCESS and External Java
Classes,” beginning on page 602
for other options.) Errors in the
calls will result in an aborted simulation.
Note: To use this call you must
have purchased the External Application Interface plug-in license
from CACI.
FireTrigger
Activity Name: STRING
NONE
Fires the trigger of the specified
Gate or Assemble Activity.
FLOAT
Number: INTEGER
REAL
Converts the argument to REAL.
FLOOR
X: REAL
INTEGER
Returns the largest integer not
greater than X.
FreeResource
Resource Name: STRING
Tag (Optional): STRING
Consume (Optional): BOOLEAN
NONE
Creates a free Resource request
for an Activity.
Function
Function Name: STRING
REAL
Returns the value of a Userdefined Function.
Gate
Gate Name: STRING
OBJECT
Returns a reference to the specified Gate activity.
SIMPROCESS User’s Manual
529
Appendix F - SIMPROCESS System Attributes and Methods
SIMPROCESS System Methods
Method Namea
Arguments
Return
Description
GenerateEntity
Generate Name: STRING
Entity Name (Optional):
STRING
Quantity (Optional): INTEGER
Time (Optional): REAL
NONE
Generates Entities from the specified Generate Activity. If Entity
Name is not specified, the default
defined for Entity Type in the
specified Generate Activity is
used. If Quantity is not specified,
the default Quantity in the designated Generate Activity is used.
If Time is not specified, the
action occurs at the current simulation time. Time is in the Simulation Time Units set in the Run
Settings. Each of the optional
parameters can be specified
without including any of the
other optional parameters.
GetActivityStatistic
Activity Name: STRING
Statistic: STRING
Value Type: STRING
Replication: INTEGER
REAL
Returns the value of the
requested Activity Name statistic.
Statistic is one of the statistics
types for Activities listed in the
Labels column of the table in
Appendix H. (See “Statistic
Types” on page 586.) Value Type
is either “Avg,” “StDev,” “Min,”
“Max,” “Count,” or “RunLength.” A Replication of -1
returns the average of replications, and a Replication of -2
returns the sum of replications.
SIMPROCESS User’s Manual
530
Appendix F - SIMPROCESS System Attributes and Methods
SIMPROCESS System Methods
Method Namea
Arguments
Return
Description
GetActivityByEntityStatistic
Activity Name: STRING
Entity Name: STRING
Statistic: STRING
Value Type: STRING
Replication: INTEGER
REAL
Returns the value of the
requested Activity Name and
Entity Name statistic. Statistic is
one of the statistics types for
Activities listed in the Labels
column of the table in Appendix
H. (See “Statistic Types” on
page 586.) Value Type is either
“Avg,” “StDev,” “Min,” “Max,”
“Count,” or “RunLength.” The
value for Replication cannot be
larger than the current replication
simulating. A Replication of -1
returns the average of replications, and a Replication of -2
returns the sum of replications.
GetArrayValue
Array: OBJECT
Index1: INTEGER
Index2: INTEGER
IndexN: INTEGER
REAL,
INTEGER,
BOOLEAN,
STRING,
or
OBJECT
Returns from the designated
array the value at the specified
indices. Note that the array indices are zero based. Attempting to
get a value from an element of a
STRING or ANYOBJ array that
has had no value assigned will
result in an error.
SIMPROCESS User’s Manual
531
Appendix F - SIMPROCESS System Attributes and Methods
SIMPROCESS System Methods
Method Namea
Arguments
Return
Description
GetAttributeStatistic
Attribute Name: STRING
Value Type: STRING
Replication: INTEGER
REAL
Returns the value of the
requested Attribute Name.
Attribute Name must be unique
among the attributes that are
being statistically monitored.
Value Type is either “Avg,”
“StDev,” “Min,” “Max,”
“Count,” or “RunLength.” A
Replication of -1 returns the average of replications, and a Replication of -2 returns the sum of
replications.
GetConnectorStatistic
Connector Name: STRING
Statistic: STRING
Value Type: STRING
Replication: INTEGER
REAL
Returns the value of the
requested Connector Name statistic. Statistic is one of the statistics types for Connectors listed in
the Labels column of the table in
Appendix H. (See “Statistic
Types” on page 586.) Value Type
is either “Avg,” “StDev,” “Min,”
“Max,” “Count,” or “RunLength.” A Replication of -1
returns the average of replications, and a Replication of -2
returns the sum of replications.
SIMPROCESS User’s Manual
532
Appendix F - SIMPROCESS System Attributes and Methods
SIMPROCESS System Methods
Method Namea
GetConnectorByEntityStatistic
Arguments
Connector Name: STRING
Entity Name: STRING
Statistic: STRING
Value Type: STRING
Replication: INTEGER
SIMPROCESS User’s Manual
Return
REAL
Description
Returns the value of the
requested Connector Name and
Entity Name statistic. Statistic is
one of the statistics types for
Connectors listed in the Labels
column of the table in Appendix
H. (See “Statistic Types” on
page 586.) Value Type is either
“Avg,” “StDev,” “Min,” “Max,”
“Count,” or “RunLength.” The
value for Replication cannot be
larger than the current replication
simulating. A Replication of -1
returns the average of replications, and a Replication of -2
returns the sum of replications.
533
Appendix F - SIMPROCESS System Attributes and Methods
SIMPROCESS System Methods
Method Namea
GetCostStatistic
Arguments
Period Name: STRING
Cost Object 1: STRING
Cost Object 2: STRING
Cost Type: STRING
Value Type: STRING
Replication: INTEGER
SIMPROCESS User’s Manual
Return
REAL
Description
Returns the value of the
requested Period Name, Cost
Object 1, and Cost Object 2. Cost
Object 1 can be the name of a
Resource or an Activity. Cost
Object 2 can be the name of an
Activity or an Entity. Thus, the
combination of Cost Object 1 and
Cost Object 2 can be “Resource
and Entity,” “Resource and
Activity,” or “Activity and
Entity.” Cost Type options are
“Capacity” or “Absorption”.
Value Type is either “Avg,”
“StDev,” “Min,” or “Max” for
Replication -1. If Replication is 1
or greater, the maximum value is
returned no matter what is
entered for Value Type. A Replication of -1 returns the average of
replications, and a Replication of
-2 returns the sum of replications.
534
Appendix F - SIMPROCESS System Attributes and Methods
SIMPROCESS System Methods
Method Namea
Arguments
Return
Description
GetEntity
Gate, Resource, or Entity:
OBJECT
Index: INTEGER
OBJECT
Returns a reference to the Entity
being held at the specified Gate
Activity, waiting for the specified Resource, or being held as
part of the specified Entity’s
batch. Index indicates the position in the appropriate queue and
must be greater than or equal to 1
and less than or equal to the
number of Entities being held at
the Gate activity (obtained by
using Gate System Attribute
NumberOnHold), less than or
equal to the number of Entities
waiting for the Resource
(obtained by using Resource
System Attribute NumberWaiting), or less than or equal to the
number of Entities in the batch
(obtained by using the Batch
System Attribute BatchSize).
GetEntityStatistic
Entity Name: STRING
Statistic: STRING
Value Type: STRING
Replication: INTEGER
REAL
Returns the value of the
requested Entity Name statistic.
Statistic is one of the statistics
types for Entities listed in the
Labels column of the table in
Appendix H. (See “Statistic
Types” on page 586.) Value Type
is either “Avg,” “StDev,” “Min,”
“Max,” “Count,” or “RunLength.” A Replication of -1
returns the average of replications, and a Replication of -2
returns the sum of replications.
SIMPROCESS User’s Manual
535
Appendix F - SIMPROCESS System Attributes and Methods
SIMPROCESS System Methods
Method Namea
Arguments
Return
Description
GetFromMap
Map: ANYOBJ
Key: INTEGER, REAL,
BOOLEAN, STRING,
ANYOBJ
INTEGER,
REAL,
BOOLEAN,
STRING,
ANYOBJ
Returns from the designated map
the value referenced by the specified key.
GetMapKey
Map: ANYOBJ
Index: INTEGER;
INTEGER,
REAL,
BOOLEAN,
STRING,
ANYOBJ
Returns from the designated map
the key specified by the index.
GetMapSize
Map: ANYOBJ
INTEGER
Returns the number of objects in
the specified map.
GetNext
Result Set Name: STRING
BOOLEAN
Used to advance to the next row
of a Result Set. Returns TRUE if
the Result Set has more values.
GetResource
Resource Name: STRING
Units: STRING, INTEGER,
or REAL
Tag (Optional): STRING
NONE
Creates a get Resource request
for an Activity.
SIMPROCESS User’s Manual
536
Appendix F - SIMPROCESS System Attributes and Methods
SIMPROCESS System Methods
Method Namea
Arguments
Return
Description
GetResourceStatistic
Resource Name: STRING
Statistic: STRING
Value Type: STRING
Replication: INTEGER
REAL
Returns the value of the
requested Resource Name statistic. Statistic is one of the statistics types for Resources listed in
the Labels column of the table in
Appendix H. (See “Statistic
Types” on page 586.) Value Type
is either “Avg,” “StDev,” “Min,”
“Max,” “Count,” or “RunLength.” A Replication of -1
returns the average of replications, and a Replication of -2
returns the sum of replications.
GetResourceByActivityStatistic
Resource Name: STRING
ActivityName: STRING
Value Type: STRING
Replication: INTEGER
REAL
Returns the value of the
requested Resource Name and
Activity Name statistic. Value Type
is either “Avg,” “StDev,” “Min,”
“Max,” “Count,” or “RunLength.” A Replication of -1
returns the average of replications, and a Replication of -2
returns the sum of replications.
GetResult
Result Set Name: STRING
Database Field: STRING
INTEGER,
REAL,
BOOLEAN,
STRING
Returns a value from a Result
Set. Type of value returned is
dependent on the type of values
in the requested field of the
Result Set.
SIMPROCESS User’s Manual
537
Appendix F - SIMPROCESS System Attributes and Methods
SIMPROCESS System Methods
Method Namea
Arguments
Return
Description
GetTimeStampStatistic
Start Key: STRING
StopKey: STRING
Value Type: STRING
Replication: INTEGER
REAL
Returns the value of the Time
Stamp with Start Key and Stop
Key. Value Type is either “Avg,”
“StDev,” “Min,” “Max,”
“Count,” or “RunLength.” A
Replication of -1 returns the average of replications, and a Replication of -2 returns the sum of
replications.
GetTotalCostStatistic
Name: STRING
Cost Type: STRING
Value Type: STRING
Replication: INTEGER
REAL
Returns the total cost for the
requested Resource, Entity, or
Activity Name. If Name is
“Total,” then the total cost of all
Resources is returned. Cost Type
is either “Capacity” or “Absorption.” Value Type is either “Avg,”
“StDev,” “Min,” or “Max” for
Replication -1. If Replication is 1
or greater, the maximum value is
returned no matter what is
entered for Value Type. A Replication of -1 returns the average of
replications, and a Replication of
-2 returns the sum of replications.
HALT
Message (Optional): STRING
NONE
If used with no parameters, it
ends the current replication and
simulation continues with next
replication. If parameters are
used, the simulation is stopped
with an error condition. A dialog
appears that contains the contents of the parameter.
SIMPROCESS User’s Manual
538
Appendix F - SIMPROCESS System Attributes and Methods
SIMPROCESS System Methods
Method Namea
Arguments
Return
Description
IncreaseCapacity
Resource Name: STRING
Units: INTEGER or REAL
NONE
Increases the capacity of a Resource by the units specified.
INTTOBINARY
number: INTEGER
STRING
Converts a non-negative integer
number to a binary string.
INTTOSTR
number: INTEGER
STRING
Converts an integer number to a
string.
LN
X: REAL
REAL
Returns the Natural Log of X.
LOG10
X: REAL
REAL
Returns the base 10 Log of X.
MAXOF
list of numbers: REAL/INTEGER
(all the numbers in list must
be of the same type)
REAL or
INTEGER
Returns the maximum number in
the given list. Return type is the
same as the input list.
MINOF
list of numbers: REAL/INTEGER
(all the numbers in list must
be of the same type)
REAL or
INTEGER
Returns the minimum number in
the given list. Return type is the
same as the input list.
OpenDatabase
Database DSN: STRING or
Properties File: STRING
UserName (Optional):
STRING
Password (Optional): STRING
OBJECT
Creates a connection to the database specified by the DSN. The
DSN for the database is specified
in the ODBC control panel in
Windows. The UserName and
Password are optional. However,
if UserName is used, Password
must also be used. When not using Windows, the Properties File
is the name of the file that specifies the URL and protocol to use.
SIMPROCESS User’s Manual
539
Appendix F - SIMPROCESS System Attributes and Methods
SIMPROCESS System Methods
Method Namea
Arguments
Return
Description
OpenFile
Mode: STRING
File Name: STRING
OBJECT
Open the specified file and return
the file stream object. Mode can
be “input” or “output.” The File
Name String can contain path
names if the user wants to explicitly tell SIMPROCESS where the
file resides. If path separators
(e.g., \ in Windows, / on other
systems) are used, the program
assumes the user is providing a
complete and valid file path. If
no path separators are detected in
the file name, the Model’s folder
is where the files will reside. Note
that double backslashes (\\) must
be used in Windows file paths instead of a single backslash.
OpenSpreadsheet
Mode: STRING
File Name: STRING
OBJECT
Open the specified spreadsheet
file and return the file stream object. Mode can be “input” or “output.” The File Name String can
contain path names if the user
wants to explicitly tell SIMPROCESS where the file resides. If
path separators (e.g., / on other
systems or \ in Windows) are
used, the program assumes the
user is providing a complete and
valid file path. If no path separators are detected in the file name,
the Model’s folder is where the
files will reside. Note that double
backslashes (\\) must be used in
file paths instead of a single backslash.
SIMPROCESS User’s Manual
540
Appendix F - SIMPROCESS System Attributes and Methods
SIMPROCESS System Methods
Method Namea
Arguments
Return
Description
OUTPUT
Takes zero or more arguments
separated by commas. Type
can be REAL, BOOLEAN,
INTEGER, or STRING
NONE
Display the specified arguments
in the Output dialog. Functions
(including nested functions) that
result in any of the argument
types can be used in the OUTPUT statement.
PlotValue
Plot: OBJECT
Dataset: INTEGER
X Value: INTEGER or REAL
Y Value (Trace only): INTEGER or REAL
NONE
Adds a data point to the specified
Dataset of the plot. Datasets are
numbered beginning with 0.
Trace plots require an X Value
and a Y Value. Histogram plots
only use the X Value.
POSITION
String1: STRING
String2: STRING
INTEGER
This method returns the starting
position of String2 in String1. If
String2 is not completely contained in String1, it returns 0.
POWER
X: REAL, Y REAL
REAL
Returns X raised to the power of
Y.
PutInMap
Map: ANYOBJ
Key: INTEGER, REAL,
BOOLEAN, STRING,
ANYOBJ
Value: INTEGER, REAL,
BOOLEAN, STRING,
ANYOBJ
NONE
Places the value in the specified
map using the key as reference.
READ
INTEGER, REAL, STRING,
or BOOLEAN
INTEGER,
REAL,
STRING,
or BOOLEAN.
Reads a single variable into an
identifier from a dialog prompt.
The name of the identifier will be
presented in the dialog for the
user, and the value entered will
be validated (i.e., INTEGER type
must be an integer value).
SIMPROCESS User’s Manual
541
Appendix F - SIMPROCESS System Attributes and Methods
SIMPROCESS System Methods
Method Namea
Arguments
Return
Description
ReadFromDatabase
Database Connection: OBJECT
Result Set Name: STRING
SQL Statement: STRING
NONE
Reads values based on the SQL
Statement from the database
specified by the connection. The
values are placed in a Result Set
with the given Result Set Name.
The Result Set Name should be
unique for each ReadFromDatabase unless a Result Set is to be
replaced.
ReadFromFile
File Stream: OBJECT
List of variables
NONE
Read values for the listed variables from the input file associated with the specified File Stream.
ReadFromSpreadsheet
File Stream: OBJECT
Sheet Name: STRING
Row: INTEGER
Column: INTEGER
Variable: STRING, INTEGER, REAL, or BOOLEAN
NONE
Read a value from the specified
sheet, row, and column of the input spreadsheet file associated
with the specified File Stream.
The value is assigned to Variable.
REALTOSTR
number: REAL
precision: INTEGER (Optional)
STRING
Converts a real number to a
string. If a precision is specified,
the number is rounded to the
specified precision. Trailing zeroes are added if the decimal part
of the number is less than the
specified precision.
ReleaseEntity
Gate: OBJECT
SequenceNum: INTEGER
BOOLEAN
Causes the release of the Entity
with the specified SequenceNum
from the specified Gate. (The
Gate parameter is obtained using
the Gate System Method.) Returns TRUE if the Entity was released, FALSE otherwise.
SIMPROCESS User’s Manual
542
Appendix F - SIMPROCESS System Attributes and Methods
SIMPROCESS System Methods
Method Namea
Arguments
Return
Description
RemoteCall
Server URL: STRING
Server Name: STRING
Method Name: STRING
Method Parameters (as required by remote method): INTEGER, REAL, STRING,
BOOLEAN
BOOLEAN
Executes a method of a remote
application. Assumes a Java RMI
server has been registered with
the objects and methods being
called. Errors in the calls will result in an aborted simulation.
Note: To use this call you must
have purchased the External Application Interface plug-in license
from CACI.
RemoveFromMap
Map: ANYOBJ
Key: INTEGER, REAL,
BOOLEAN, STRING,
ANYOBJ
INTEGER, REAL,
BOOLEAN,
STRING,
ANYOBJ
Removes and returns from the
designated map the value referenced by the specified key.
REPLACE
String1: STRING
position1, position2: INTEGER
String2: STRING
STRING
Returns a string that is in String1
with part of String1 from position
1 to position 2 replaced with
String2.
Resource
ResourceName: STRING
OBJECT
Returns the reference to the specified Resource.
ROUND
number: REAL
INTEGER
Rounds the argument and returns
the closest integer value.
SIMPROCESS User’s Manual
543
Appendix F - SIMPROCESS System Attributes and Methods
SIMPROCESS System Methods
Method Namea
Arguments
Return
Description
SetActivityExpression
ActivityName: STRING
ExpressionType: STRING
Expression: STRING
NONE
Applies SIMPROCESS Expression code in the specified Expression parameter to the specified
Activity. This method can only
be used in the Start Run Expression (Define/Model Expressions). ExpressionType is case
sensitive must be valid for the
type of Activity specified. The
Expression parameter should be
the complete Expression code in
a single STRING or the complete
file name with no path of the file
that contains the Expression
code. If the Expression parameter
is a file, the file must located in
the model’s directory.
SetArrayValue
Array: OBJECT
Index1: INTEGER
Index2: INTEGER
IndexN: INTEGER
Value: REAL, INTEGER,
BOOLEAN, STRING, or OBJECT
NONE
Sets the value at the specified indices of the specified array. Note
that the indices are zero based.
SIMPROCESS User’s Manual
544
Appendix F - SIMPROCESS System Attributes and Methods
SIMPROCESS System Methods
Method Namea
SetEntityExpression
Arguments
EntityTypeName: STRING
ExpressionType: STRING
Expression: STRING
SIMPROCESS User’s Manual
Return
NONE
Description
Applies SIMPROCESS Expression code in the specified Expression parameter to the specified
Entity Type. This method can
only be used in the Start Run
Expression (Define/Model Expressions). ExpressionType is case
sensitive and must be a valid Entity Instance Expression type
(Initialize Entity, Accept Entity, Interrupt
Processing, Resume Processing, Release Entity,
or Dispose of Entity). The
Expression parameter should be
the complete Expression code in
a single STRING or the complete
file name with no path of the file
that contains the Expression
code. If the Expression parameter
is a file, the file must located in
the model’s directory.
545
Appendix F - SIMPROCESS System Attributes and Methods
SIMPROCESS System Methods
Method Namea
Arguments
Return
Description
SetEntityTypeExpression
EntityTypeName: STRING
ExpressionType: STRING
Expression: STRING
NONE
Applies SIMPROCESS Expression code in the specified Expression parameter to the specified
Entity Type. This method can
only be used in the Start Run
Expression (Define/Model Expressions). ExpressionType is case
sensitive and must be a valid Entity Type Expression type
(Start Simulation, Start
Trial, Initialize Entity, Dispose of Entity,
End Trial, or End Simulation). The Expression parameter should be the complete
Expression code in a single
STRING or the complete file
name with no path of the file that
contains the Expression code. If
the Expression parameter is a file,
the file must located in the model’s directory.
SetResourceCost
ResourceName: STRING
Cost: REAL
CostType: STRING
TimeUnit: STRING
NONE
Sets one of the costs of the specified Resource. CostType can be
PerEntity, PerUnit, PerTimeUnit,
or Fixed. If PerTimeUnit is the
CostType, then TimeUnit must
be one of the valid SIMPROCESS time units (Hours, Minutes, etc.). If Fixed is the
CostType, then the TimeUnit
must be Weekly, Montly, Quarterly, Half-Yearly, or Yearly.
TimeUnit is not required if the
CostType is PerEntity or PerUnit.
Note that if the Resource is consumable, then only PerEntity and
PerUnit are valid CostTypes.
SIMPROCESS User’s Manual
546
Appendix F - SIMPROCESS System Attributes and Methods
SIMPROCESS System Methods
Method Namea
Arguments
Return
Description
SetResourceDowntime
ResourceName: STRING
DowntimeName: STRING
NONE
Applies a global Resource Downtime (Define/Resource Downtimes) to the specified Resource.
This method can only be used in
the Start Run Expression (Define/Model Expressions).
SetResourceExpression
ResourceName: STRING
ExpressionType: STRING
Expression: STRING
NONE
Applies SIMPROCESS Expression code in the specified Expression parameter to the specified
Resource. This method can only
be used in the Start Run Expression (Define/Model Expressions). ExpressionType is case
sensitive and must be a valid Resource Expression type (Start
Simulation, Start Trial,
Get Resource, Free Resource, Start Downtime,
End Downtime, End Trial,
or End Simulation). The Expression parameter should be the
complete Expression code in a
single STRING or the complete
file name with no path of the file
that contains the Expression
code. If the Expression parameter
is a file, the file must located in
the model’s directory.
ShowSystemAttributesc
None
NONE
Display all the System-Defined
Attributes of the calling element
and any related elements that are
within scope (i.e., if this function
is called on the Activity expression, then the system attributes
for any Entity or Resource elements will also be included) in
the Output dialog.
SIMPROCESS User’s Manual
547
Appendix F - SIMPROCESS System Attributes and Methods
SIMPROCESS System Methods
Method Namea
Arguments
Return
Description
ShowUserAttributesc
None
NONE
Display all the User-Defined
Attributes evaluated for the calling elements and any related elements that are within scope (i.e.,
if this function is called on the
Activity expression, then the
user-defined attributes for any
Entity or Resource elements will
also be included) in the Output
dialog.
SimTime
Timeunit (Optional): STRING
Valid time units are - Years,
Months, Weeks, Days, Hours,
Minutes, Seconds,
Milliseconds, Microseconds,
Nanoseconds. Time unit
strings are case sensitive.
REAL
Return current simulation time in
time units specified. If no
parameter is provided, time unit
defaults to the Simulation Time
Unit set in the Run Settings.
SIN
X: REAL
REAL
Returns the Sine of X.
SOAPCall
ContinueOnError: BOOLEAN
or STRING
Endpoint URL: STRING
Service Name: STRING
Service Port Type Name:
STRING
Body namespace URI:
STRING
Method namespace URI:
STRING
SOAP action URI: STRING
Method to invoke: STRING
Parameters (Optional):
Parameter Name : STRING
Parameter Value: STRING,
BOOLEAN, INTEGER,
REAL
STRING
Invokes methods (or operations)
on Web services. See “Method
SOAPCall” on page 571 for
more information.
SIMPROCESS User’s Manual
548
Appendix F - SIMPROCESS System Attributes and Methods
SIMPROCESS System Methods
Method Namea
Arguments
Return
Description
SQRT
X: REAL
REAL
Returns the square root of X.
STATUS
Same as OUTPUT
NONE
Display the specified arguments
in status bar.
StopSimulation
NONE
NONE
Completely stops a running simulation. Any remaining replications are not simulated.
STRLEN
inString: STRING
INTEGER
Returns the length of the string,
inString.
STRTOINT
inString: STRING
INTEGER
Converts a string consisting only
of numbers with no decimal in
the string to an integer.
STRTOREAL
inString: STRING
REAL
Converts a string of numbers including a decimal to a real.
SUBSTR
position1, position2: INTEGER
String: STRING
STRING
Returns the substring of String
from position1 to position2, inclusive.
SystemTime
None
REAL
Returns the current system time
in milliseconds as the difference
between the current time and
midnight, 1 Jan 1970 UTC.
TAN
X: REAL
REAL
Returns the TANgent of X.
TimeOfDay
Timeunit (Optional): STRING
Valid time units are - Years,
Months, Weeks, Days, Hours,
Minutes, Seconds,
Milliseconds, Microseconds,
Nanoseconds. Time unit
strings are case sensitive.
REAL
Returns the current time of day in
the requested time unit. If no
parameter is provided, time unit
defaults to the Simulation Time
Unit set in the Run Settings.
TRUNC
number: REAL
INTEGER
Returns the integer part of the
number
SIMPROCESS User’s Manual
549
Appendix F - SIMPROCESS System Attributes and Methods
SIMPROCESS System Methods
Method Namea
Arguments
UpdateDashboardLabel
Dashboard Name: STRING
Host or IP Address: STRING
Port: INTEGER
TextLabel Name: STRING
Value: INTEGER, REAL,
STRING or BOOLEAN
NONE
Update the specified TextLabel
with the given value.
UpdateDynamicLabel
MasterEditorb
Label Name: STRING
Label ID: INTEGER
Font Color: STRING
Value: Same as Label’s Mode
NONE
Update the specified dynamic label with the given value.
WriteToDatabase
Database Connection: OBJECT
SQL Statement: STRING
NONE
Used to modify tables of the database specified by the connection.
The SQL Statement should be of
type INSERT, DELETE, or UPDATE.
WriteToFile
File Stream: OBJECT
list of variables
NONE
Write the values of the listed variables to the output file specified
by the File Stream.
WriteToSpreadsheet
File Stream: OBJECT
Sheet Name: STRING
Row: INTEGER
Column: INTEGER
Variable: STRING, REAL,
INTEGER, or BOOLEAN
NONE
Writes the value of Variable to
the specified sheet, row, and column of the output spreadsheet
file specified by the File Stream.
Return
Description
a. System methods’ names must be input as shown. They are case sensitive.
b. This argument (i.e., MasterEditor) must be the first argument inside the parentheses of this method. It is required by
the method and must be input as shown. It is case sensitive.
c. Since this method does not require any argument, do not include empty parentheses when using this method.
SIMPROCESS User’s Manual
550
Appendix F - SIMPROCESS System Attributes and Methods
System Method Examples
Many of the System Methods described here are demonstrated with models in the
ExpressionDemos directory. Included in that directory is SIMPROCESS Expression Demo
Models, which describes each model. If this directory is not part of the SIMPROCESS/models
directory, it can be downloaded at www.simprocess.com.
Method Alert and Beep:
For example, to display a message and sound alarm when an Entity enters an Activity, put the following
lines in the Activity’s Accept Entity event:
Beep(MasterEditor);
Alert(MasterEditor, “Press OK to continue!”);
Method Confirm, DrawRealSample, MINOF, MAXOF, and REALTOSTR:
This example demonstrates the syntax and usage of the listed methods. It draws a number from a
Uniform distribution whose minimum and maximum parameters are results from an Exponential
distribution with a mean of 30. The result is displayed in a message box with OK and Cancel buttons.
Pressing OK will continue this process again, while Cancel will end the process.
fContinue : BOOLEAN;
value1, value2, maxval, minval : REAL;
fContinue := TRUE;
WHILE fContinue
value1 := DrawRealSample(“Exp(30.0)”);
value2 := DrawRealSample(“Exp(30.0)”);
maxval := MAXOF(value1, value2);
minval := MINOF(value1, value2);
value1 := DrawRealSample(“Uni(“+REALTOSTR(minval)+”,” +REALTOSTR(maxval)+”)”);
Beep(MasterEditor);
fContinue := Confirm(MasterEditor, “The value is “+ REALTOSTR(value1));
END WHILE;
SIMPROCESS User’s Manual
551
Appendix F - SIMPROCESS System Attributes and Methods
Method ChangeColor:
This method changes the color of a non-bitmap icon. Currently, Activity icon “RectangleIcon,” and
Process icon “DefaultIcon” can change color. The “SIMPROCESS Color Table,” beginning on
page 576 contains the 65 colors available in SIMPROCESS. The name of an Activity or Process can
be specified, or “Self”, “Parent”, or “Activity” can be used to designate the Activity or Process. Note
that in earlier versions of SIMPROCESS (pre 4.1), “Self”, “Parent”, and “Activity” did not require
quotes. Earlier version models using those keywords must be modified to include quotes for use with
SIMPROCESS 4.1 or later versions. If an Activity or Process name is used, SIMPROCESS will attempt
to change the color of every Activity or Process that matches the input name. To clear a color setting,
enter “Clear” for the color.
The following changes the color of the Activity Delay4 to Red.
ChangeColor(“Delay4”, “Red”);
The following changes the color of the current Activity or Process to Blue.
ChangeColor(“Self”, “Blue”);
The following changes the color of the parent Process of the current Activity or Process to Yellow.
ChangeColor(“Parent”, “Yellow”);
The following clears the color setting of the Activity.
ChangeColor(“Sales Process”, “Clear”);
The ability to change colors of Entities is no longer supported. For example, the following code will
now produce an error.
ChangeColor(Entity, “Brown”);
To change the color of the Activity icon to green if there is no Entity in it, in the Activity’s Release
Entity event add:
IF (NumberIn = 0)
ChangeColor(“Self”, “Green”);
END IF;
SIMPROCESS User’s Manual
552
Appendix F - SIMPROCESS System Attributes and Methods
Method ShowSystemAttributes and
ShowUserAttributes:
These methods display all the system-defined and user-defined attributes with their current values of
the calling element in the standard output window. For example, to display the system-defined
attributes of an Activity when an Entity enters, in the Activity’s Accept Entity event put:
ShowSystemAttributes;
All the system-defined attributes and values are listed in the standard output window. In addition, any
related elements' system attributes or user-defined attributes will be listed in the output window as
well. For example, if the ShowUserAttributes method is called from the expression script in an Activity
event (such as Accept Entity), the Entity that is within scope will also have its user-defined attributes
listed. The same goes for Resources being assigned.
Model level user-defined attributes are listed no matter what elements are within scope.
Method SimTime:
This method returns the current simulation time in hours unless a time unit parameter is provided. The
return value is REAL type. For example:
Entity.StartTime := SimTime; { StartTime is a REAL global
Entity instance attribute of type REAL. }
The allowable time units are provided as a string parameter and are case sensitive. The allowable
time units are: Years, Months, Weeks, Days, Hours, Minutes, Seconds, Milliseconds, Microseconds, Nanoseconds. An example using the time units is as follows:
Mytimeunit : STRING;
Mytimeunit:="Weeks";
OUTPUT("My time unit in weeks = ",
SimTime(Mytimeunit);
OUTPUT("My time unit in months = ",
SimTime("Months");
Method OUTPUT and STATUS:
To display a message in the standard output window:
SIMPROCESS User’s Manual
553
Appendix F - SIMPROCESS System Attributes and Methods
OUTPUT(“Number of orders currently held in Gate10 is : “, NumberIn);
realnum : REAL;
OUTPUT(“The String value of realnum = “,
REALTOSTR(realnum));
Or, to display it in the status bar:
STATUS(“Number of orders currently held in Gate10 is : “, NumberIn);
where the expressions above are placed on the Activity, Gate10.
Method UpdateDashboardLabel:
To use this method, you need to assign a Dashboard to your model which contains a TextLabel. To
assign Dashboards, refer to “Assigning Dashboards,” beginning on page 442.
Five arguments are required for this method. The first is Dashboard Name. This is the name used
when you assigned the Dashboard to your model. You may also use the name of the Dashboard’s file
(without any path and without the “.spd” extension), although this is not recommended since it
negatively impacts performance. The second argument is the Host or IP Address where a
Dashboard Server is expected to be receiving messages for the assigned Dashboard. This value must
match the one entered when the Dashboard was assigned. It is important to note that SIMPROCESS
compares the values and not their meanings. While localhost and 127.0.0.1 refer to the same
system (i.e., they have the same meaning), they are not the same values to SIMPROCESS. The third
argument is the port on which a Dashboard Server is expected to be receiving messages for the
assigned Dashboard. This value must also match the one entered when the Dashboard was assigned.
The fourth argument is the name of a Graph on the assigned Dashboard of type TextLabel. The name
is an uneditable field displayed on the properties dialog for the TextLabel when assigning a Dashboard
and will be unique for that Dashboard. The fifth argument is the value to be displayed on the TextLabel.
It can be of type INTEGER, REAL, STRING or BOOLEAN.
For example, the Call Center model has assigned the Call Status.spd Dashboard file using
the name Call Status. The assigned Dashboard designated a Server Address of localhost
and port 5555. This Dashboard contains a TextLabel by the name of TextLabel4. During
simulation, you want to display the number of Entities generated at a Generate Activity. In the Release
Entity expression of the selected Generate Activity add the following line:
UpdateDashboardLabel(“Call Status”, “localhost”, 5555,
“TextLabel4”, NumberGenerated);
SIMPROCESS User’s Manual
554
Appendix F - SIMPROCESS System Attributes and Methods
While this statement may be used with any TextLabel on any assigned Dashboard, it is best used with
those that have no Plot Values assigned to it. In that way, you may be certain that the value you place
on the TextLabel via this statement will remain unchanged until a subsequent statement updates it.
Method UpdateDynamicLabel:
To use this method, you need to define a dynamic label in the work area first. To define a dynamic
label, refer to “Dynamic Labels,” beginning on page 294.
Five arguments are required for this method. The first one is MasterEditor. This is the key word
that must be there and input as shown. The next two arguments are the Name and ID of the dynamic
label defined in the Background Text Properties dialog. The fourth argument is the color to be used in
displaying this label. The last argument is the value to be displayed. It can be a constant or an attribute,
but the data type must match the Mode defined in Background Text Properties.
For example, you want to display the number of Entities generated at a Generate Activity. Assume
you have already defined a dynamic label with the name “total,” ID of 0, and data type of INTEGER.
In the Release Entity event of the Generate Activity add the following line:
UpdateDynamicLabel(MasterEditor, “total”, 0, “DarkBlue”, NumberGenerated);
The first parameter of this method must be MasterEditor and input as shown.
Methods OpenFile, CloseFile, ReadFromFile, and WriteToFile:
OpenFile opens the file specified in the Filename field for either input or output. The mode must
be either “input” or “output” (not case-sensitive). “Input” opens a file to read, while “output” opens
a file to write. Any other specifications will lead to an error message. Both arguments are STRING
type, i.e., they must be surrounded by quotation marks. OpenFile returns an Object type value which
is required in CloseFile, ReadFromFile, and WriteToFile methods.
OpenFile(Mode, Filename) : OBJECT;
By default, SIMPROCESS will look for either input or output files in the directory of the active model.
Either file can be placed elsewhere as long as the path is specified in the OpenFile statement. Note
that double backslashes (\\) must be used instead of single backslashes (\) in Windows file paths.
The following example opens a file (myoutput.dat) for output. First, define a Model Attribute
MyOutStream that is type Object. If the file is to be opened in the Start Run Expression, make
sure that Do Not Reset Before Each Replication is selected on the attribute properties dialog. If the file
is opened in the Start Simulation or Start Trial expression, the file will be opened each replication.
Type the following statement in one of the expressions.
SIMPROCESS User’s Manual
555
Appendix F - SIMPROCESS System Attributes and Methods
Model.MyOutStream := OpenFile(“Output”, “myoutput.dat”);
The next example opens a file (myinput.dat) for input and keeps the return value in the model
attribute MyInStream.
Model.MyInStream := OpenFile(“input”, “myinput.dat”);
ReadFromFile reads the specified numbers of values from a file that is open for input. The first
argument is the input stream, from a previous OpenFile call (the file must be open for input). From
the previous example, the model attribute, Model.MyInStream would be the input stream.
Following the stream argument is a list of variables whose values are going to be read in from the file.
ReadFromFile(Input Stream, List of
variables);
In the input file, values should be separated by one or more white spaces (i.e., space, tab, or new line
characters). There is also a pre-defined special delimiter “|” in SIMPROCESS. You can use “|” to
separate values. This delimiter is very useful to separate values (strings) that contain any white space.
You can surround the whole string with a pair of “|”s, and ReadFromFile will read in whatever
is in between as one value.
The input file can contain comments. Any characters that follow double forward slashes (//) will be
ignored.
The type of value to be read in is dependent on the specified variable type. A mismatch will cause
an error. The following table shows the valid types for different value types. Integer and real are any
valid numerical values. ReadFromFile will either truncate a real value to integer for an Integer type
variable, or float an integer value to real for a Real type variable. String is a sequence of characters.
If spaces are included, surround the whole string with “|”. Boolean can only be either TRUE or FALSE.
Any other value will cause an error. Boolean values are not case sensitive.
Value Types in File
Variable Types
Integer
Integer
Real
String
Boolean
OK
Truncated
Error
Error
Real
FLOATed
OK
Error
Error
String
OK
OK
OK
OK
Boolean
Error
Error
Error
OK
Object
Error
Error
Error
Error
SIMPROCESS User’s Manual
556
Appendix F - SIMPROCESS System Attributes and Methods
Example:
The input file contains:
|This is a test for ReadFromFile.|
123
67.89
TRUE
The expression reads as:
StrVal
: STRING;
IntVal
: INTEGER;
RealVal : REAL;
BoolVal : BOOLEAN;
ReadFromFile(Model.MyInStream, StrVal, IntVal);
ReadFromFile(Model.MyInStream, RealVal, BoolVal);
The expression will read in the following:
StrVal has the value “This is a test for ReadFromFile.”.
IntVal has the value 123.
RealVal has the value 67.89.
BoolVal has the value TRUE.
WriteToFile writes the values of the specified variables to a file that is open for output. The first
argument is the output stream, that is the returned value from a previously OpenFile call (must be
open for output). Following the stream argument is a list of variables whose values are going to be
written to a file.
WriteToFile(Output Stream, List of variables);
The output values will be written to the file consecutively. Any kind of format or spacing has to be
output explicitly by the user. There are two special characters that can be used in formatting outputs:
“^” will write a tab to the file, while “/” will advance to a new line. For these to work correctly, they
must be written individually and be surrounded by “”.
For example:
Following the prior example of ReadFromFile, an expression has:
WriteToFile(Model.MyOutStream, StrVal, “/”, IntVal, “^”);
WriteToFile(Model.MyOutStream, RealVal, “^”, BoolVal);
Write to the file as:
SIMPROCESS User’s Manual
557
Appendix F - SIMPROCESS System Attributes and Methods
This is a test for ReadFromFile.
123
67.89
TRUE
CloseFile closes the file the IOStream pointed to.
CloseFile(IOStream);
For example:
CloseFile(Model.MyOutStream);
CloseFile(Model.MyInStream);
Close the files myoutput.dat and myinput.dat, respectively.
Typically, you will place CloseFile in the End Trial Expression, especially if you put OpenFile
in the Start Trial Expression.
Method READ:
READ prompts the user for a single variable input. The variable must be a locally-defined variable (i.e.,
a system attribute or a user-defined attribute such as a Model, Activity, Resource, or Entity attribute
cannot be referenced directly). Example:
MyInteger : INTEGER;
MyREAL : REAL;
READ MyInteger;
READ MyREAL;
The above example will provide an input prompt requesting the user to input an integer value for
MyInteger, and the next read statement will prompt the user to input a REAL value for MyREAL.
Type checking is done on the values entered so the user should make sure the values are compatible
(i.e., don't enter “hello dolly” when prompted to enter an integer). If the value is not compatible, an
error exception is thrown and the simulation stops.
The prompts for the above example would look as follows:
SIMPROCESS User’s Manual
558
Appendix F - SIMPROCESS System Attributes and Methods
Method HALT:
HALT terminates the current replication or simulation. When used with no parameters, the current
replication is ended and the next replication begins. This is similar to using the Maximum Entity Count
on the Dispose Activity. HALT with parameters terminates the simulation in an error condition. The
value of the parameters are displayed in an error dialog.
This statement is useful for debugging and stopping simulations at certain conditions in the model when
developing a complex model. You may prefer the use of OUTPUT and ALERT statements to notify
you of happenings in the model, but the HALT is there if you need it. Example:
HALT; (ends current replication)
HALT(“Encountered error in Delay5”); (terminates simulation)
Method RemoteCall:
RemoteCall is a plug-in capability that can be licensed separately from CACI to allow users to make
calls to external applications from within the expression scripts of a SIMPROCESS model. This feature
is a powerful way to make calls to user applications (either custom developed or commercial products)
based on how the business process model and workflow is planned. An example of this might be a
model that represents a “To Be” business process flow for Human Resources where you intend to use
a commercially available human Resources product such as Peoplesoft, Lawson, or Oracle. Based on
SIMPROCESS User’s Manual
559
Appendix F - SIMPROCESS System Attributes and Methods
specific Activities in the model execution, you could make expression script calls to a user-written
server that would “feed” the commercial application as a prototype to see if the product will align with
the desired business process needs. The server program could “feed” the application either from native
calls to the product or via other interface technologies such as XML. This capability will support
analysis using models between the business functions and the system transactions that are required
to support them.
The RemoteCall provides the mechanisms to make calls to a Java RMI server that has been registered
using the Java RMI Registry. It is the responsibility of the user to develop the RMI server program
and start the application. The expression script method simply has to have the name of the server
computer (could be the same computer that the model is running on or could be a separate server over
the network), the server object to be called, the remote method to call, and the parameter list that matches
the remote procedure in the user-written server.
Example:
mybool : BOOLEAN;
mybool:=RemoteCall(“rmi://localhost/”, “server-demo”, “putPlotData”, SimTime, Self.NumberAccepted);
In the example above, a remote server application (this one happens to be running on the same computer
as the model, hence the localhost URL address) called server-demo is looked up using the Java RMI
registry, and the putPlotData method is called with two parameters - SimTime and NumberAccepted,
where NumberAccepted is the number of Entities accepted in the Activity. (See “System Attributes”
on page 512.)
The following is a description of the server application showing the actual Java code needed to
implement this example. This text is not a complete reference to RMI programming, and we recommend
you reference any of the many Java-published materials on RMI (java.sun.com is a good place to start).
The following is a list of the source Java programs that demonstrate the RemoteCall interface. The
files are located in the SPUser/SampleFiles directory.
SPServerDemo.java - defines the server class and the methods that will be called from the
expression script. The Java code is as follows
package com.caci.demo;
import java.rmi.*;
import java.util.*;
import ptolemy.plot.*;
import ptolemy.plot.plotml.*;
SIMPROCESS User’s Manual
560
Appendix F - SIMPROCESS System Attributes and Methods
public interface SPServerDemo extends Remote
{
boolean putPlotData(double simtime, int totalEntities )
throws RemoteException;
boolean clearData()
throws RemoteException;
}
SPServerDemoImpl.java - defines the implementation code for the server class and
methods. This example instantiates a user-defined class that uses the Ptolemy plotting classes.
This plot is being presented on the screen to the user by the server program separate from the
SIMPROCESS simulation. The data being fed to the plot is coming from the simulation and the
RemoteCall parameters shown above. The Java code is as follows:
package com.caci.demo;
import java.rmi.*;
import java.rmi.server.*;
import java.util.*;
import ptolemy.plot.*;
import ptolemy.plot.plotml.*;
public class SPServerDemoImpl
extends UnicastRemoteObject
implements SPServerDemo
{
public SPServerDemoImpl()
throws RemoteException
SIMPROCESS User’s Manual
561
Appendix F - SIMPROCESS System Attributes and Methods
{
myplot = new SPPlotDemo("Number Entities", "Simulation Time
in Hours");
}
public boolean putPlotData(double simtime, int totalEntities )
throws RemoteException
{
myplot.putTicks(simtime, totalEntities);
return true;
}
public boolean clearData()
throws RemoteException
{
myplot.clearData();
return true;
}
private String name;
SPPlotDemo myplot;
}
SPServerDemoServer.java - defines the server binding to the RMI registry. This is
necessary for Java client code (such as the RemoteCall in SIMPROCESS) to do a lookup and find
the server by a name that was “binded” to the actual server class that is running on the remote
server. The Java code is as follows:
package com.caci.demo;
import java.rmi.*;
SIMPROCESS User’s Manual
562
Appendix F - SIMPROCESS System Attributes and Methods
import java.rmi.server.*;
import ptolemy.plot.*;
import ptolemy.plot.plotml.*;
public class SPServerDemoServer
{
public static void main(String args[])
{
try
{
System.out.println
("Constructing Server implementations...");
SPServerDemoImpl d1
= new SPServerDemoImpl();
System.out.println
("Binding server implementations to registry...");
Naming.rebind("serverdemo", d1);
System.out.println
("Waiting for invocations from clients...");
}
catch(Exception e)
{
System.out.println("Error: " + e);
}
}
}
SPPlotDemo.java - defines the plotting class that is instantiated in the
SPServerDemoImpl.java class. The Java code is as follows:
SIMPROCESS User’s Manual
563
Appendix F - SIMPROCESS System Attributes and Methods
package com.caci.demo;
import ptolemy.plot.*;
import java.awt.GridBagLayout;
import java.awt.GridBagConstraints;
import javax.swing.JFrame;
public class SPPlotDemo extends JFrame {
Plot myPlot = null;
boolean first = true;
SPPlotDemo(String yLabel, String xLabel) {
// Instantiate the plot.
myPlot = new Plot();
// Set the size of the toplevel window.
this.setSize(600, 600);
myPlot.setSize(550, 550);
myPlot.setButtons(true);
myPlot.setTitle("My Plot");
myPlot.setXLabel(xLabel);
myPlot.setYLabel(yLabel);
myPlot.setYRange(0.0, 1.0);
myPlot.setXRange(0.0, 20.0);
myPlot.setMarksStyle("none");
myPlot.setImpulses(false,1);
myPlot.setConnected(true,1);
myPlot.setBars(false);
SIMPROCESS User’s Manual
564
Appendix F - SIMPROCESS System Attributes and Methods
myPlot.setSize(350,300);
GridBagLayout gridbag = new GridBagLayout();
GridBagConstraints c = new GridBagConstraints();
getContentPane().setLayout(gridbag);
c.gridx = 0;
c.gridy = 0;
c.gridwidth = 1;
gridbag.setConstraints(myPlot, c);
getContentPane().add(myPlot);
show();
}
public void putTicks(double time, int num)
{
myPlot.addPoint(1, time, num, !first);
first = false;
myPlot.fillPlot();
}
public void clearData()
{
myPlot.clear(true);
myPlot.fillPlot();
}
}
You should reference your RMI programming documentation for details on how to compile and start
the server code as well as the RMI registry on a server computer. “Displaying Plots Remotely” on
SIMPROCESS User’s Manual
565
Appendix F - SIMPROCESS System Attributes and Methods
page 204 has examples on starting the RMI registry.
Once you have started the RMI registry and the SPServerDemoServer program, you can run the
demonstration model RemoteCall.spm to demonstrate this capability. (Chapter 5 of the SIMPROCESS
Getting Started Manual has instructions on running this example.) When you start the simulation, the
server program will put up a plot window and plot the values (SimTime and Number Accepted in this
example) on the plot window. The window will appear as follows on the server:
If the server is not running, your simulation will be stopped and you will receive a message dialog
stating that the server connection could not be made - similar to the following:
If your parameters don’t match in number and type, RMI Exceptions will occur and a message dialog
will be presented with the error. You will notice in this example that the putPlotData method expects
a Java double parameter and an int parameter. The following is a mapping of the SIMPROCESS data
SIMPROCESS User’s Manual
566
Appendix F - SIMPROCESS System Attributes and Methods
types that are allowed on the RemoteCall parameters and how they map to Java data types:
SIMPROCESS
Java
REAL
double
STRING
String
INTEGER
int
BOOLEAN
boolean
Method ExternalCall:
ExternalCall is a plug-in capability that can be licensed separately from CACI to allow users to
make calls to external Java classes from within the expression scripts of a SIMPROCESS model. When
calling an external Java class from an Expression using this statement, it may be necessary to add
compiled Java class files to the classpath used by SIMPROCESS. See “SIMPROCESS and External
Java Classes,” beginning on page 602 for information on how to add external Java classes to the
SIMPROCESS classpath.
Since ExternalCall is a function, a value will be returned. If the method called in the external
class does not return a value (return type is void), SIMPROCESS will return the value TRUE; thus,
the method should be assigned to a BOOLEAN local variable or attribute. Only valid SIMPROCESS
data types can be returned (STRING, BOOLEAN, INTEGER, REAL, ANYOBJ). (For types other
than ANYOBJ, see previous table in RemoteCall section for comparable Java data types. ANYOBJ
can be any valid Java class.)
Method names should be unique. That is, SIMPROCESS looks for the appropriate method by name
only. The number of parameters is not considered. Also, when getting a reference to the requested class,
SIMPROCESS will only use constructors with no parameters.
The ExternalCall function requires two parameters: class name and method name. Other parameters
after the first two are considered to be parameters for the method being called. SIMPROCESS
instantiates the class once per instance of ExternalCall in a model. The instantiated class persists
throughout the simulation. Thus, if the same instance of the class is needed for each invocation of
ExternalCall, an instance of the class must be instantiated and returned to an Attribute of type Object.
This Attribute can then be used as a parameter to static methods of the class. (See
ExternalCall.spm in the ExpressionDemos directory.)
Some examples:
STRING : MyString;
MyString := ExternalCall(“com.acme.stuff.MyClass”, “getString”);
SIMPROCESS User’s Manual
567
Appendix F - SIMPROCESS System Attributes and Methods
This example returns a string value. The “getString” method has no parameters.
REAL : number;
number := ExternalCall(“com.acme.stuff.MyClass”, “getSquare”,
100.0);
This example returns a REAL (double) value. The “getSquareRoot” method has one parameter
(double).
BOOLEAN : boolval;
boolval := ExternalCall(“com.acme.stuff.MyClass”,
“returnNothing”);
Note that the class name must include the package. Also, the method does not return a value (return
type is void), so the function must be assigned to a BOOLEAN variable. If multiple expressions have
ExternalCall methods that reference the same class, each expression will create its own instance of
the class. However, if the class is static, all expressions will share the same instance.
Method ActivateGenerate:
ActivateGenerate starts the generation of Entities by a Generate Activity. For this method to
work correctly, the Generate Activity must not be active. This is accomplished by setting the start date
(Start/End tab) to a date that is past the end date of the simulation. For instance, if the simulation is
scheduled to end on 1/1/2005, then the start date of the Generate Activity must be 1/1/2005 or later.
Note that this is the start date of the Generate Activity, not the start date of a particular schedule within
the Generate Activity. When the appropriate conditions are met in the simulation for the Generate
Activity to start, issue the command along with the name of the Generate Activity. It is important that
the name of the Generate Activity be unique.
ActivateGenerate(“Generate2”);
The ExpressionDemos directory has a sample model named ActivateGenerate.spm. If this
directory is not part of the SIMPROCESS/models directory, it can be downloaded at
www.simprocess.com.
Methods ReleaseEntity, Gate, GetEntity, EntityExists:
These methods are used in conjunction with Gate Activities. ReleaseEntity is used to release a
specific Entity that is being held at a Gate Activity. Gate returns a reference to a Gate Activity.
GetEntity returns a reference to an Entity being held in a Gate Activity. (GetEntity can also
be used to return a reference to an Entity waiting for a Resource or return a reference to an Entity held
in another Entity’s batch.) EntityExists checks for the presence of a specific Entity at a Gate
SIMPROCESS User’s Manual
568
Appendix F - SIMPROCESS System Attributes and Methods
Activity. For example:
gate : ANYOBJ;
entity : ANYOBJ;
i : INTEGER;
goodRelease : BOOLEAN;
gate := Gate(“Gate12”); {get reference to Gate activity}
FOR i := 1 TO gate.NumberOnHold
entity := GetEntity(gate, i); {get the entity at position i}
IF entity.Attribute2 > 100.0
{release the entities that match the condition}
goodRelease := ReleaseEntity(gate, entity.SequenceNum);
IF NOT goodRelease
{notify of entity not released}
OUTPUT(“Entity ”, entity.SequenceNum, “not released from Gate
”, gate.Name);
END IF;
END IF;
END FOR;
EntityExists can be used to find the index position of a specific entity. For example (using the
same Gate reference as the above example).
position : INTEGER;
{42 is the SequenceNum of the Entity desired}
position := EntityExists(gate, 42);
IF position > 0
entity := GetEntity(gate, position);
goodRelease := ReleaseEntity(gate, 42);
END IF;
The ExpressionDemos directory has a sample model named ReleaseEntity.spm. If this
directory is not part of the SIMPROCESS/models directory, it can be downloaded at
www.simprocess.com.
Methods CreateArray, GetArrayValue, SetArrayValue:
These methods are used to create and manipulate multi-dimensional arrays. CreateArray creates
a REAL, INTEGER, BOOLEAN, STRING, or ANYOBJ array. Arrays of type REAL and INTEGER
are initialized to zero. BOOLEAN arrays are initialized to FALSE. Arrays of type STRING and
SIMPROCESS User’s Manual
569
Appendix F - SIMPROCESS System Attributes and Methods
ANYOBJ are not initialized with any values. GetArrayValue retrieves a value from an array, and
SetArrayValue places a value in an array. (Note that if GetArrayValue is used with a STRING
or ANYOBJ array in which the requested element has not had a value assigned by SetArrayValue,
an error will occur.) An Attribute with a Mode of Object must be defined to create an array. For example,
assume there is a Model Attribute named TimeArray with Mode Object.
Model.TimeArray := CreateArray(“REAL”, 3, 2);
This creates a two dimensional array for REAL numbers. The first dimension has a length of 3, and
the second dimension has a length of 2. The type of array (REAL, INTEGER, etc.) must be entered
as a STRING. This array can contain the delay times for 6 routes (3 origin locations and 2 destination
locations). Use SetArrayValue to populate the array. Note that array indices are zero based. Also,
the type of the value passed to the array must match the type of the array.
i : INTEGER;
j : INTEGER;
value : REAL;
FOR i := 0 TO 2
FOR j := 0 TO 1
value := DrawRealSample(“Log(10, 1, 10)”);
SetArrayValue(Model.TimeArray, i, j, value);
END FOR;
END FOR;
Values are retrieved from an array using GetArrayValue. Assume the three origin locations are
represented by 0, 1, and 2, and the two destination locations are represented by 0 and 1. These are
assigned to the Entity Attributes Origin and Destination (local variables would also work).
Entity.Origin := DrawIntegerSample(“Int(0, 2, 11)”);
Entity.Destination := DrawIntegerSample(“Int(0, 1, 12)”);
Entity.DelayTime := GetArrayValue(Model.TimeArray, Entity.Origin,
Entity.Destination);
Since arrays can also be of type ANYOBJ, SIMPROCESS object references (such as Activities,
Entities, and Resources) can be stored in an array. For instance, a particular Activity stored in an array
could be referenced in any Expression since a Model Attribute can be used in any Expression. Assume
a CreateArray statement created a one dimensional ANYOBJ array assigned to the Model Attribute
ActivityArray.
myActivity : ANYOBJ;
myActivity := Sibling(“Delay12”);
SetArrayValue(Model.ActivityArray, 0, myActivity);
The ExpressionDemos directory has a sample model named CreateArray.spm. This directory
SIMPROCESS User’s Manual
570
Appendix F - SIMPROCESS System Attributes and Methods
can be downloaded at www.simprocess.com.
Method SOAPCall
The SOAPCall statement provides SIMPROCESS models with the ability to invoke methods (or
operations) on Web services. It supports Web services of the “RPC” style (see note 2 below) that use
the default SOAP encoding (see note 3) which is defined at http://schemas.xmlsoap.org/soap/
encoding. The only methods that can be invoked are those which return data of the type typically called
“xsd:string”, or a fully compatible type. For more on the primitive data types, see the W3C
Recommendation at http://www.w3.org/TR/xmlschema-2/.
The SOAPCall statement requires a minimum of 8 parameters. In addition, if the method (or operation)
being invoked requires parameters, the SOAPCall statement will need to be given names and values
for each. The following is a list of the SOAPCall parameters and a description of each, including where
to find them in a typical Web Services Description Language (WSDL) file.
• ContinueOnError: A Boolean value indicating whether the simulation should continue processing if an error occurs. If false, an error terminates the simulation; if true, an error will be
ignored. It's generally wise to use a false value at least until debugging has been completed.
The parameter used can be a BOOLEAN or a STRING, as defined in the SIMPROCESS
User's Manual. When a string is passed, any value (when converted to lowercase letters)
other than “true” will be considered false.
• Endpoint URL: A string containing the URL of the endpoint for the Web service to be
invoked.
• Service Name: A string containing the Service Name to be invoked, as given in the WSDL
file. In a typical WSDL file, there will be a <service> element (it may optionally be
namespace qualified; see note 1) near the end of the WSDL file with a “name” attribute that
will provide the value to use here.
• Service Port Type Name: A string containing the name of the service's port type. This will
appear in a <port> element that is a child of the <service> element above, and the “name”
attribute there will provide the service port name.
• Body namespace URI: A string containing the URI used for the body namespace. Note that
this is a URI, not a URL. A URI can be a URL, or it can be an identifier of another sort. It
could be a string such as “urn:foo”, or perhaps “dispatcher:wsdl” (as is the case in our DispatcherService WSDL file). In a typical WSDL file it can be found on the root element's
“targetNamespace” attribute, or the "xmlns:tns" attribute, often in both. Though every
WSDL will likely provide a value, it will not always be critical to successfully invoking the
service method, however. It's best to provide it just to be certain.
• Method namespace URI: A string containing the namespace URI of the method (operation)
to be invoked. The <port> element mentioned above (see the Service Port Type Name
parameter) will include a “binding” attribute providing a namespace qualified name for a
SIMPROCESS User’s Manual
571
Appendix F - SIMPROCESS System Attributes and Methods
binding (though most WSDL files will only have a single binding, service and port). The
namespace may or may not be relevant, but the binding name found there will appear in the
"name" attribute of a <binding> element (see notes 1 and 2). The child elements of the
<binding> element will be <operation> elements whose "name" attribute values correspond
to the available methods. Each <operation> element will have as children a <soap:operation> element (see the next parameter) as well as a pair of <input> and <output> elements.
The <input> and <output> elements (the information on both should be identical, so choose
one) each contain a <soap:body> child element. (See notes 3 and 4 for other important
information about the <soap:body> element.) This will contain a “namespace” attribute
whose value will be the method namespace URI to be used for this parameter to SOAPCall.
• SOAP Action URI: A string containing the SOAP Action URI. The <soap:operation> element described above contains a single attribute named “soapAction”. Its value will very
often be an empty string, though not always (see note 5). Whatever value is found in that
attribute should be provided for this parameter.
• Method (operation) to invoke: A string containing the name of the method (operation) to
invoke.
• Additional parameters (optional): If the method to be invoked requires passing parameters
(as most do), the remaining parameters provided to the SOAPCall statement must be in
matched pairs. Each pair must include a string containing the name of the parameter, and a
value to be passed for the named parameter at invocation.
a. Parameter name: Refer to the <binding> element mentioned above. It will contain a
“type” attribute providing the namespace qualified name for a "port type". This will refer
to a <portType> element with a “name” attribute whose value is the same. The child
elements of <portType> will be <operation> elements (one for each available operation)
containing two key pieces of information:
i. The value of the "name" attribute corresponds to the name of the method
(operation) to be invoked.
ii. The value of the “parameterOrder” attribute will list the names of all parameters
that must be passed (the values to be included here in the SOAPCall statement),
and the order in which they must appear.
b. Parameter types: Although SOAPCall can only invoke operations returning the
“xsd:string” (or fully equivalent) type as stated above, it can invoke operations whose
parameters are functionally compatible with the SIMPROCESS types INTEGER
(xsd:int), REAL (xsd:double), STRING (xsd:string) or BOOLEAN (xsd:boolean) as
defined in the SIMPROCESS User's Manual. Internally, SOAPCall checks the
parameters passed to ensure that they are of the allowable SIMPROCESS types. It then
assumes that the operation's named parameter is of the corresponding SOAP type. Only
testing the SOAPCall statement with a specific operation will determine whether it can
be used. (See note 6 for more information.)
SIMPROCESS User’s Manual
572
Appendix F - SIMPROCESS System Attributes and Methods
Notes:
1. Depending on the developer of a Web service and the toolset(s) used, the element names
appearing in a WSDL file may be qualified with a namespace. For instance, the structure of
a WSDL file is mandated by standard which is sometimes referred to via namespace, so that
all the elements in a WSDL file may be qualified, like <wsdl:definitions> or <wsdl:operation>.
When this approach is used, there will be a namespace reference in an attribute on the root
element of the WSDL file, such as xmlns:wsdl="http://schemas.xmlsoap.org/wsdl", indicating
the namespace prefix (e.g., “wsdl”) and the URI of the namespace. Much of the above
information is based on the assumption that WSDL file elements are not namespace qualified,
as is true of SIMPROCESS' DispatcherService.
2. A typical <binding> element (optionally namespace qualified; see note 1) will be immediately
followed by a <soap:binding> element with a “style” attribute. SOAPCall only works with
those having a value of “rpc” here; if the style is “document” the SOAPCall statement cannot
be used with this service.
3. The <soap:body> element within each <operation> element (optionally namespace qualified,
as per note 1) should contain an attribute named "use". This attribute should have a value of
“encoded”; if its value is “literal”, the SOAPCall statement cannot be used with this service.
4. The <soap:body> element within each <operation> element (optionally namespace qualified;
see note 1) should contain an attribute named “encodingStyle”. Its value should be http://
schemas.xmlsoap.org/soap/encoding/ which defines the standard encoding for SOAP 1.1. If
any other URL is used, it may not be possible to use SOAPCall with this service.
5. Many services will indicate that the SOAP Action URI is only meaningful if the transport is
HTTP. Because SIMPROCESS is a Java application, it uses HTTP transport automatically
in most environments, so this value should always match that found in the WSDL file. If it
isn't needed, the environment will transparently discard it.
6. There is no limit to the type of information that can be exchanged between client applications
and Web services using SOAP. There is, however, a practical limitation to how the SOAPCall
statement can be prepared in advance to interact with Web services chosen by SIMPROCESS
users. Internally, SIMPROCESS uses what is known as the Dynamic Invocation Interface to
build and invoke the call to a Web service operation. Other available approaches require prior
knowledge of the WSDL file and require generation and compilation of Java code to call it.
This simply isn't possible in a runtime environment. As a result, we've had to select the best
all around means of offering access to Web services via SOAP. In the future, as available tools
for runtime examination of WSDL files improve, perhaps SIMPROCESS will be able to
improve the SOAPCall statement to provide still greater capabilities.
SIMPROCESS User’s Manual
573
Appendix F - SIMPROCESS System Attributes and Methods
Methods CreateMap, PutInMap, GetFromMap, RemoveFromMap, ClearMap,
GetMapKey, GetMapSize:
These methods are used to create and manipulate hashmaps. CreateMap creates a hashmap that stores
REAL, INTEGER, BOOLEAN, STRING, or ANYOBJ values. PutInMap places a keyed value into
a hashmap. The key can be of type REAL, INTEGER, BOOLEAN, STRING, or ANYOBJ. The value
must match the type used in CreateMap. GetFromMap retrieves a value from a hashmap without removing
the value from the hashmap. RemoveFromMap retrieves a value from a hashmap and removes the value
and its key from the hashmap. ClearMap removes all values from the hashmap along with their associated
keys. GetMapSize and GetMapKey are usually used when iterating through a map. An Attribute with
a Mode of Object must be defined to create a hashmap. For example, assume there is a Model Attribute
named Map with Mode Object (with Do Not Reset Before Each Replication selected). The following
statement should go in the Start Run Expression of the Model Expressions.
Model.Map := CreateMap(“ANYOBJ”);
This creates a hashmap that will store any type of object. Use PutInMap to place values in the hashmap.
For instance assume that there are several activities that will need to be referenced throughout the model.
Certain decision points will required knowledge of how many entities are currently in these activities.
The following could go into the Start Simulation expression of each activity.
PutInMap(Model.Map, Name, Self);
This places each activity into the hashmap with the name of the activity as the key to the value (the
activity itself). Note that the keys must be unique. Thus, if two activities being placed into the hashmap
have identical names, only the last one placed in the hashmap will be there. The last one put in the
map will replace the previous entry.
Assume in the Accept Entity expression of a Branch Activity we need to determine the appropriate
path for the incoming Entity based on information from the Activities in the hashmap. In this example
there are two Activities in the hashmap: Call Wait Queue and Calls In Service.
GetFromMap can be used to retrieve each Activity and check each Activity’s status.
callWait : ANYOBJ;
callService : ANYOBJ;
callWait := GetFromMap(“Call Wait Queue”);
callService := GetFromMap(“Calls In Service”);
IF callWait.NumberIn > 100 AND callService.NumberIn > 25
Entity.Reject := TRUE;
END IF;
RemoveFromMap also returns the value stored in the hashmap, but it also removes the value from the
map. Thus if the statements below were used, the next entity entering the Branch Activity would get
an error since the Activities no longer exist in the hashmap.
callWait := RemoveFromMap(“Call Wait Queue”);
SIMPROCESS User’s Manual
574
Appendix F - SIMPROCESS System Attributes and Methods
callService := RemoveFromMap(“Calls In Service”);
RemoveFromMap should be used when the values in the hashmap are temporary in nature, such as
Entities. If temporary objects are placed into a hashmap, it is important that they be removed before
being disposed. If not, memory used by the temporary object will not be freed.
ClearMap should normally be used in the End Run expression. It ensures that unneeded memory is freed
at the end of the simulation.
ClearMap(Model.Map);
GetMapSize returns the number of objects in a hashmap. This number can be used to iterate through
the hashmap using GetMapKey in a FOR loop. The type (INTEGER, REAL, etc.) of the variable that
will contain the key returned by GetMapKey must match the type of the key returned. (Thus, it is
recommended that all the keys be of the same type for a particular hashmap.) The example below shows
iterating through a hashmap that contains Entities keyed by their SequenceNum. Items should not
be added to or removed from a hashmap when iterating through a hashmap.
size : INTEGER;
count : INTEGER;
key : INTEGER;
entity : ANYOBJ;
size := GetMapSize(Model.Map);
FOR count := 1 TO size
key := GetMapKey(Model.Map, count);
entity := GetFromMap(Model.Map, key);
{Alternatively, the above two lines could be replaced with
entity := GetFromMap(Model.Map, GetMapKey(Model.Map, count));}
IF entity.HoldTime > 200.0
entity.Reject := TRUE;
END IF;
END FOR;
SIMPROCESS User’s Manual
575
Appendix F - SIMPROCESS System Attributes and Methods
SIMPROCESS Color Table
0
Black (Default)
33
SandyBrown
1
White
34
Gold
2
Red
35
Goldenrod
3
Green
36
LightGrey
4
Blue
37
MediumGoldenrod
5
Yellow
38
DarkOliveGreen
6
Cyan
39
ForestGreen
7
Magenta
40
LimeGreen
8
DarkGrey
41
MediumForestGreen
9
Grey
42
MediumSpringGreen
10
DarkRed
43
PaleGreen
11
DarkGreen
44
SeaGreen
12
DarkBlue
45
YellowGreen
13
DarkYellow
46
DarkSlateGrey
14
DarkCyan
47
DimGrey
15
DarkMagenta
48
Khaki
16
Aquamarine
49
Maroon
17
MediumAquamarine
50
Orange
18
CadetBlue
51
Orchid
19
CornflowerBlue
52
DarkOrchid
20
DarkSlateBlue
53
Pink
21
LightBlue
54
Plum
22
LightSteelBlue
55
IndianRed
23
MediumBlue
56
OrangeRed
24
MediumSlateBlue
57
VioletRed
25
MidnightBlue
58
Sienna
26
NavyBlue
59
Tan
27
SkyBlue
60
Turquoise
28
SlateBlue
61
DarkTurquoise
29
SteelBlue
62
Violet
30
Coral
63
Wheat
31
Firebrick
64
GreenYellow
32
Brown
SIMPROCESS User’s Manual
576
APPENDIX G
External Event Files
The Generate activity offers a File schedule. This appendix describes the format for the event file
associated with the File schedule.
SIMPROCESS User’s Manual
577
Appendix G - External Events Files
General Rules for Event Files
External event files define entity generation events. If event files are referred to in a Generate activity,
SIMPROCESS reads the file at the beginning of a simulation run and schedules the generation of
Entities as defined in the file.
Each record (line) in an event file must adhere to certain syntax rules, which are defined in the following
section. Records must also adhere to these general rules:
•
Each record in the file defines one generation event. There is no way to continue a record
on the following line.
•
The keywords (ENTITY, QUANTITY, etc.) followed by a colon (:) or equals sign (=) must
not have any spaces between the colon or the equals sign and must not have any spaces between
the colon or equals sign and the value associated with the keyword.
•
•
The keywords and values are case sensitive.
Records must be ordered by entity create time. SIMPROCESS will not generate entities for
any event record whose entity create time is earlier than that of the previously processed event.
For example, in the following sequence of creation dates:
1.
01/02/2005
2.
01/04/2005
3.
09/11/2004
4.
10/30/2004
5.
01/12/2005
Records 1 and 2 are processed. Record 3 is bypassed, because its creation date is earlier than that of
record 2. Record 4 is also bypassed, because its date is earlier than that of record 2, the last record
for which entities were generated.
•
Entity create time must be the first field in the event record. The remaining keyword
parameters may be entered in any order.
•
The entity type you specify in an event record must be defined to the model before it can be
generated.
However, you can refer to a new type in the event file and select the Selected in the list option in the
dialog. SIMPROCESS will automatically add it to the model.
External File Schedule
•
Any literal values with imbedded blanks must be enclosed in quotation marks (" ") when
included in event records.
•
Real numbers must include a decimal point.
SIMPROCESS User’s Manual
578
Appendix G - External Events Files
•
Records beginning with an asterisk (*) are considered comments and are ignored by
SIMPROCESS.
SIMPROCESS User’s Manual
579
Appendix G - External Events Files
Event Record Description
In the following syntax diagram:
•
•
•
Items in BOLD face must be entered exactly as shown.
Items in italic face represent variables for which you must substitute a value.
Items enclosed in brackets ([]) are optional.
Syntax
[+]time [QUANTITY:value] [ENTITY: type] [ATTR: name=value...]
Parameters
+
Indicates that the ensuing value is to be added to the time of the last event processed.
time
The time at which entities are to be created for this event record. Specify either a specific date and
time or a relative value. Use the following format for a specific date and time:
mm/dd/yyyy hh:mm:ss
Where, for example, January 15, 2007, at noon is represented as:
01/15/2007 12:00:00
You can enter either real numbers or integers to indicate relative values: real numbers are assumed
to refer to hours, while integers refer to days. Forty-eight hours after the start of simulation is shown as:
48.0
Which is the same as two days after the start of the simulation:
2
Forty-eight hours after the previous entity generation event:
+48.0 or +48:00 or +2
SIMPROCESS User’s Manual
580
Appendix G - External Events Files
Notes on specifying event time:
•
You can omit seconds when specifying the time. SIMPROCESS assumes a zero for the
omitted parameter.
•
Do not specify a time in hh:mm without a date, unless you precede it with a plus sign (+).
Although SIMPROCESS will accept this value, its interpretation is unpredictable. For
example, acceptable formats are:
48 hours after the start of simulation
48.0
+48:00
•
48 hours after previous generation event
SIMPROCESS will accept a 2-digit value for the year, It assumes that values over 49 refer
to years in the 20th century, and values under 50 refer to the 21st century.
QUANTITY:value
The number of entities to generate at the entity generation event. Enter a number in place of value.
If QUANTITY is omitted, SIMPROCESS uses the default Quantity value in the Generate Activity
dialog.
Properties
ENTITY: type
The type of entity to generate.
For Type, enter an entity type name. If the name includes blanks, enclose the entire string in quotes.
If ENTITY is not specified, SIMPROCESS uses the default Entity value in the Generate Activity
dialog.
Properties
ATTR: name=value...
Assigns values to globally defined attributes for entity instances.
You can assign values to any number of attributes in the VARS argument.
The value you specify must be consistent with the data type defined for the attribute.
Note that if you specify an attribute name that has not been defined in your model, you can select the
Selected in the list option in the External File Schedule dialog. SIMPROCESS will add it to the model.
If a record contains any syntax error or undefined model element (without using Selected in the list
option), the entire event record is considered invalid and is bypassed.
SIMPROCESS User’s Manual
581
Appendix G - External Events Files
Examples
1. Generate GreenDot entities at 3 a.m. on January 1, 2005. Generate the number of entities defined in
the Generate Activity Properties dialog.
01/01/2005 03:00:00 ENTITY:GreenDot
2. Generate six RedDot entities 7 hours after the simulation begins.
7.0 QUANTITY:6 ENTITY:RedDot
3. Generate four RedDot entities 7 hours after the previous entity generation.
+7:00 QUANTITY:4 ENTITY:RedDot
4. Generate a Truck entity at 2 a.m. on January 3, 2005. Assign a value of 50,000 to user attribute Weight, and
the string "Yo, Heavy" to user attribute Tag:
01/03/2005 2:00 ENTITY:Truck ATTR:Weight=50000 Tag="Yo, Heavy"
5. Generate more Truck entities 4 hours after the previous event. Generate the number of entities defined in
the Generate Activity Properties dialog:
+4.0 ENTITY:Truck
6. Generate two RedDot entities at 4 a.m. on January 3, 2005:
01/03/2005 04:00:00 ENTITY:RedDot QUANTITY:2
Notes on the Examples
If the examples are processed during a simulation which begins at midnight, January 1, 2005, the events
occur at the following times:
1. January 1, 2005, 3:00 a.m.
2. January 1, 2005, 7:00 a.m.
3. January 1, 2005, 2:00 p.m. (14:00)
4. January 3, 2005, 2:00 a.m.
5. January 3, 2005, 6:00 a.m.
6. Never. The specified time is earlier than the time of the previous event, so the record is discarded.
SIMPROCESS User’s Manual
582
APPENDIX H
Simulation Results File
The Simulation Results file is generated from the File menu. Select File/Export/Simulation Results to
open the Save Statistics dialog. The Simulation Results file will, by default have a .xpt file extension
and be saved to the current model directory. This file is tab-delimited, and can be opened using a
text editor or spreadsheet.
The file will contain the complete statistical measures corresponding to the reports selected for the
current model. This file give you raw statistical data that is displayed in the Standard and Custom
Reports, in a standard format that can be opened by many different applications.
SIMPROCESS User’s Manual
583
Appendix H - Simulation Results File
Format of the Simulation Results File
Each line of the exported simulation results file is a statistic recorded for objects such as Entity Types,
Activities, or Resources. Each record contains the following fields or columns:
Owner Type
This is the type of the object that owns this statistic record. The four types are:
•
•
•
•
•
Entity: representing an Entity Type
Activity: representing an Activity
Resource: representing a Resource
TimeStamp: representing a Time Stamp
Attribute: representing an Attribute
Owner Name
This is the full hierarchical name of the specific object that owns this statistic record.
Name
This is the name of the specific object that owns this statistic record.
Stat Type
This is the type of statistic displayed. Contained in the third column from the left, the Stat Type is an
abbreviation for the name of the performance measure whose parameters follow to the right. See
“Statistic Types,” beginning on page 586 for a complete description of the types of statistics.
Replication
This number is the replication that the statistic was collected from. Any number, 1 or greater, refers
to a specific replication.
SIMPROCESS User’s Manual
584
Appendix H - Simulation Results File
If the replication number is 0, the statistics are sum of all replications. An -1 means that this statistic
is the average of all replications.
Minimum
This is the smallest value that has been recorded for this statistic.
Maximum
This is the largest value that has been recorded for this statistic.
Sum
It is the total of all observed values for the statistic (i.e. Xi), if this is observation based.
For time weighted, it is the total of each observed value multiplied by the time that this value has
persisted in (i.e. Xi * ΔT).
Sum of Squares
It is the summation of the square of each observed values (i.e. ∑(Xi2)), if this is observation based.
For time weighted, it is the summation of the square of each observed value multiplied by the time
that this value has persisted in (i.e. ∑(Xi*ΔT)2).
Count
This is the number of observations recorded when the statistic was collected.
Average
This is the average of the statistic.
SIMPROCESS User’s Manual
585
Appendix H - Simulation Results File
Std Deviation
This is the standard deviation of the statistic.
Statistic Types
The table below gives the descriptions of the statistic types within SIMPROCESS.
Labels
Type of
Statistics
Descriptions
Entities:
tokendelay
Observation
based
Total cycle time (i.e. sum
of wait, hold, and process)
tokenwaitdelay
Observation
based
Time waiting for available resource
tokenholddelay
Observation
based
Time waiting for condition to be reached
tokenprocessdelay
Observation
based
Time processing (i.e. at
specified duration)
tokentraveldelay
Observation
based
Time traveling across
connectors.
tokenlevel
Time-weighted
Number of entities in
system
tokenwaitlevel
Time-weighted
Number of entities waiting for available resource
tokenholdlevel
Time-weighted
Number of entities waiting for condition to be
reached
tokentravellevel
Time-weighted
Number of entities traveling across connectors.
tokenprocesslevel
Time-weighted
Number of entities in
process (i.e. at duration)
SIMPROCESS User’s Manual
586
Appendix H - Simulation Results File
Labels
Type of
Statistics
Descriptions
tokentotalborn
Only the last
value is
recorded
Number of entities being
generated
tokentotalalive
Only the last
value is
recorded
Number of entities still
residing in the system
tokentotalkilled
Only the last
value is
recorded
Number of entities
destroyed
UDV.delay
Observation
based
Statistic of the specified
attribute
UDV.level
Time-weighted
Statistic of the specified
attribute
resrccap
Time-weighted
Units of resources (i.e.
capacity)
resrcidle
Time-weighted
Units of idle resources
resrcbusy
Time-weighted
Units of busy resources
resrcmaintenance
Time-weighted
Units of resources not
available (Unplanned
Downtime)
resrcdown
Time-weighted
Units of resources not
available (Planned
Downtime)
resrcreserved
Time-weighted
Units of reserved
resources
Resources:
byactivitybusy.level Time-weighted
Units of busy resources
at the specified activity
Connectors:
SIMPROCESS User’s Manual
587
Appendix H - Simulation Results File
Labels
Type of
Statistics
Descriptions
tokentotalin
Only the last
value is
recorded
Number of entities
entered this connector
tokentotalhere
Only the last
value is
recorded
Number of entities still
residing in this connector
tokentotalout
Only the last
value is
recorded
Number of entities that
have left this connector
bytokenin
Only the last
value is
recorded
Number of entities of the
specified type that
entered the connector
bytokenhere
Only the last
value is
recorded
Number of entities of the
specified type still residing in the connector
bytokenout
Only the last
value is
recorded
Number of entities of the
specified type that have
left the connector
tokendelay
Observation
based
Total cycle time at this
connector
bytoken.delay
Observation
based
Total cycle time for the
specified entity type at
this connector
tokenlevel
Time-weighted
Number of entities in this
connector
bytoken.level
Time-weighted
Number of entities of the
specified type in this connector
Only the last
value is
recorded
Number of entities
entered this activity
Activities:
tokentotalin
SIMPROCESS User’s Manual
588
Appendix H - Simulation Results File
Labels
Type of
Statistics
Descriptions
tokentotalhere
Only the last
value is
recorded
Number of entities still
residing in this activity
tokentotalout
Only the last
value is
recorded
Number of entities that
have left this activity
tokentotalearlyout
Only the last
value is
recorded
Number of entities that
left the activity without
processing
bytokenin
Only the last
value is
recorded
Number of entities of the
specified type that
entered the activity
bytokenhere
Only the last
value is
recorded
Number of entities of the
specified type still residing in the activity
bytokenout
Only the last
value is
recorded
Number of entities of the
specified type that have
left the activity
bytokenoutearly
Only the last
value is
recorded
Number of entities of the
specified type that left
the activity without processing
tokendelay
Observation
based
Total cycle time (i.e. sum
of wait, hold, and process) at this activity
tokenwaitdelay
Observation
based
Time waiting for available resource at this
activity
tokenholddelay
Observation
based
Time waiting for condition to be reached at this
activity
SIMPROCESS User’s Manual
589
Appendix H - Simulation Results File
Labels
Type of
Statistics
Descriptions
tokenprocessdelay
Observation
based
Time processing entities
(i.e. in the specified durations) at this activity
bytoken.delay
Observation
based
Total cycle time (i.e. sum
of wait, hold, and process) for the specified
entity type at this activity
bytokenwait.delay
Observation
based
Time waiting for available resource for the
specified entity type at
this activity
bytokenhold.delay
Observation
based
Time waiting for condition to be reached for the
specified entity type at
this activity
bytokenprocess.delay Observation
based
Time processing entities
(i.e. in the specified durations) for the specified
entity type at this activity
tokenlevel
Time-weighted
Number of entities at this
activity
tokenwaitlevel
Time-weighted
Number of entities waiting for available resource
at this activity
tokenholdlevel
Time-weighted
Number of entities waiting for condition to be
reached at this activity
tokenprocesslevel
Time-weighted
Number of entities in
process (i.e.at duration)
at this activity
bytoken.level
Time-weighted
Number of entities of the
specified type at this
activity
SIMPROCESS User’s Manual
590
Appendix H - Simulation Results File
Labels
Type of
Statistics
Descriptions
bytokenwait.level
Time-weighted
Number of entities of the
specified type waiting for
available resource at this
activity
bytokenhold.level
Time-weighted
Number of entities of
specified type waiting for
condition to be reached at
this activity
bytokenprocess.level Time-weighted
Number of entities of the
specified type in process
(i.e.at duration) at this
activity
UDV.delay
Observation
based
Statistic of the specified
attribute
UDV.level
Time-weighted
Statistic of the specified
attribute
Observation
based
Time elapsed between
Time Stamps
Time Stamps:
tokendelay
SIMPROCESS User’s Manual
591
APPENDIX I
UML Interfaces
SIMPROCESS and Unified Modeling Language (UML) tools complement each other by bridging the
gap from business analysis to systems analysis. SIMPROCESS is used for the business process models,
and UML tools are used for the systems models. These tools work together in documenting the
operational architecture of a business. They communicate the content of the business requirements
and the systems requirements and designs by using both notations in combination.
UML-based tools such as Rational Rose focus on Systems Modeling to help define requirements, model
designs, and develop object-oriented code such as Java. Rational Rose is one of the leading tools on
the market for system modeling activities in a software development life cycle, but other capable tools
support the UML standard.
UML tools do not fully address the functional/business process modeling requirements. For example,
Use Cases and Activity Diagrams are the only views UML has for modeling any part of the business
process, but they still focus on the “system” needs in the models rather than the function or business
steps. For instance, Use Cases show Actors (usually people) interacting with objects (usually realized
as object oriented components such as Java classes). This helps to understand the system transactions
but does not model the full breadth of the business workflow or process. Activity diagrams similarly
model activity steps that can be used to model business flow diagrams but typically focus on objects
and transition of states between objects based on changes to the objects in a system transaction. Activity
diagrams do not provide the dimensions needed to do robust business process analysis such as dynamic
modeling, entity flow simulations, resource utilization, queueing theory, and cost based business
metrics.
SIMPROCESS User’s Manual
592
Appendix I - Exporting to UML
SIMPROCESS focuses on the functional and business work flow (including manual/physical
processes that have nothing to do with the system but need to be understood and modeled in order to
build a system to support the business properly) and not just on the system transactions. This is made
clear when looking at how activities such as delays, splits, joins, batching, unbatching, assembling,
etc., are described for behavior in a SIMPROCESS model. These are representative of business
activities that people do in carrying out their jobs regardless of what interaction they have with the
system. In addition, SIMPROCESS looks at the resources, entities, and workflow as a complete
dynamic model that allows visualization of how the business works both from manual steps and system
interaction. This is important in order to match up the business transactions with the system
transactions.
SIMPROCESS has a more functional and business view and focuses on activity based costing metrics,
throughput, bottlenecks, timing, re-work and other business performance metrics regardless of the
system that is supporting the business. This is why business and functional representatives prefer
SIMPROCESS for the business modeling - it speaks their language. SIMPROCESS focuses on the
business concerns and not all the system modeling notations and methods (which often confuses
functional people). The dynamic modeling capabilities for business metrics are non-existent in UML
modeling tools. This is appropriate since UML tools are system analysis, design, and development
tools, not process and workflow modeling tools.
There is a clear gap between business analysis and systems analysis. SIMPROCESS focuses on the
business analysis and UML tools focus on the systems analysis. Clearly, both are needed from business
requirements to systems requirements to system design to system development. They work hand in
hand and not in opposition to each other. This gap in business analysis and systems analysis is the basis
for the SIMPROCESS to UML interfaces. These interfaces use the complementary strengths of both
UML and SIMPROCESS to provide customers a complete toolset for business and systems modeling.
SIMPROCESS has two basic interfaces to UML. One is the ability to export a SIMPROCESS model
to a UML Activity Diagram. The export to Activity Diagrams is based on the standard UML XMI
specification and provides a transfer of the SIMPROCESS activities and connectors to UML activities
and transitions. In addition, SIMPROCESS Entities and Resources are exported as UML Classes (with
attributes included); however, the classes are not accompanied by a UML Class Diagram. The Activity
Diagram includes the Diagram information for Rational Rose only. The XMI activity information can
be imported into any UML tool other than Rational Rose that supports XMI by simply deleting the
Diagram information at the bottom of the XMI file that is created from the export process.
The other type of interface is an active link between activity nodes on a SIMPROCESS model and
Use Case Diagrams in a Rational Rose model. This interface requires a Microsoft Windows version
of SIMPROCESS and a licensed copy of Rational Rose.
Each type of interface is described in more detail in the following sections.
SIMPROCESS User’s Manual
593
Appendix I - Exporting to UML
Exporting to UML
This capability can be used by selecting File/Export/UML Activity Model from the SIMPROCESS menus.
It outputs the model to a UML compatible XML file. No dialog is displayed for this export operation.
The file is created in the model's directory with a .xml extension and is compatible with Rational
Rose, including diagram information. The XMI file may be compatible with other UML tools as well,
such as the ArgoUML open source tool, but diagram information intended for Rational Rose will not
be compatible with other UML tools.
To import the model into Rational Rose, Rational Rose must have the Import/Export XMI plug-in
installed. This plug-in can be obtained from the Rational Rose web site (www.rational.com). Once
it is installed, simply choose the Import UML Model from the Tools menu in Rational Rose.
In some cases, due to slight differences in the aspect ratio of the graphics in SIMPROCESS and the
Rational Rose tools, minor visual clean up of the imported Activity Diagram may be required.
The following is a simple SIMPROCESS model that is exported to UML:
The above SIMPROCESS model would look like the following in Rational Rose:
SIMPROCESS User’s Manual
594
Appendix I - Exporting to UML
SIMPROCESS User’s Manual
595
Appendix I - Exporting to UML
Rose Use Cases
SIMPROCESS provides the capability for the user to connect nodes (activities) on the SIMPROCESS
model directly to a Rose Use Case Diagram. This allows for a seamless flow from business process
modeling and simulation analysis in SIMPROCESS to systems models in Rose. Exported HTML views
of the SIMPROCESS models (page 23) are directly linked to Rational Rose exported HTML models.
This gives stakeholders a seamless wide area review of the business process models with Rose Use
Case models. SIMPROCESS models typically include both manual process steps (activities) and steps
that are automated with information technology. This capability ties the manual process steps and the
automated process steps (supported by Use Case links) together so that the system requirements are
in complete context with the business process.
This feature is licensed by CACI separately from SIMPROCESS and is only available with the
Windows version of SIMPROCESS. For this feature to be active, the additional license must be
purchased, and Rational Rose must be installed.
Rose Use Case links are added by selecting the Rose Use Case button on the Documentation tab on any
activity properties dialog. This button will only be enabled if the above criteria are met.
Clicking Rose Use Case brings up the following dialog. The path to a Rose model file can be entered
or the Browse button can be used to select a Rose model file. Once a Rose model has been selected,
a reference to it is stored in the SIMPROCESS model file for subsequent use (this reference will be
invalidated if the file is later moved or renamed). The connection to a Rose model remains until the
SIMPROCESS User’s Manual
596
Appendix I - Exporting to UML
model file name is cleared, and the OK button is clicked.
Once a Rose model is connected to the SIMPROCESS model, the Details button will connect
SIMPROCESS to a licensed copy of Rational Rose using the Rational Rose Automation capability.
If a successful connection and load of the Rose model is completed (this occurs in the background),
a window like the one shown below is presented listing all the Rose views and subordinate packages
that contain Use Case Diagrams. Note that if a package or view does not contain any Use Case Diagrams,
it is not included in the window since the SIMPROCESS connection is to Use Case Diagrams only.
Utilizing this window, a Use Case Diagram can be navigated to and selected to associate with the
SIMPROCESS activity node. Note that the structure in the dialog is a simple Tree structure that works
like other graphical file directory trees.
A single Use Case Diagram can be selected by clicking on it and then clicking the OK button. This
SIMPROCESS User’s Manual
597
Appendix I - Exporting to UML
action will assign that Use Case Diagram to the SIMPROCESS activity node. Optionally, the Show/
Hide Rose button can be selected to bring the Rose tool and model up on the screen so that it is available.
Once Rose is visible the Rose model can be modified as desired, and the Rose model can be saved.
However, any new Use Case Diagrams added will not automatically appear in the SIMPROCESS Use
Case List window until it is closed and reopened.
After a Use Case Diagram is selected and the OK button is clicked, the Use Case Diagram information
will be added into the SIMPROCESS dialog, as shown below. The Use Case Diagram name and fully
qualified name (which includes the entire package structure in Rose) are not directly editable. To clear
the Use Case Diagram connection, simply select and clear the Selected Rose Model File field in this
dialog and click OK. To change the Use Case Diagram Selected (the node to which SIMPROCESS is
connected), simply click on the Details button and choose another Rose Use Case Diagram from the
Use Case Diagram dialog as described above.
An important feature of this Use Case Diagram connection between SIMPROCESS and Rational Rose
is that when the Rose model is published to HTML and the SIMPROCESS model is published to HTML,
the SIMPROCESS HTML nodes will be automatically linked to the Rose Use Case Diagrams in the
HTML. For this feature to work, the Rose published model must be in a directory named rose within
the directory of the SIMPROCESS published model on the disk drive or web server. When navigating
the SIMPROCESS published HTML model, moving the mouse pointer over a SIMPROCESS activity
node that has been connected to a Rose Use Case Diagram as described in this section gets a Javascript
popup that links directly to the Rose published HTML Use Case Diagram automatically. This capability
is very useful for wide area review of business process models that have Use Case functional
requirements attached to certain nodes in the SIMPROCESS model. Hence, the business process
requirements and the system requirements are in context of each other using this technique.
SIMPROCESS User’s Manual
598
APPENDIX J
Running Models Without GUI
SIMPROCESS models can be run without the SIMPROCESS Graphical User Interface (GUI). There
are two executables in the SIMPROCESS directory: SIMPROCESS and SPRunSimulation (any
extensions are platform specific). The SIMPROCESS program starts the SIMPROCESS GUI, required
to build and edit models. This GUI is typically used to run models as well. However, SPRunSimulation
can be used to run a SIMPROCESS model without the GUI. A valid license.dat file is required
to run SIMPROCESS and SPRunSimulation. The same license file is used for both.
Since access to the GUI is not available, results of the run must be automatically output to the
SIMPROCESS database (see page 375), user created files, or a user created database. Statistics
collected during the run can be accessed using System Methods. (See “Accessing Statistics During
Simulation” on page 308.) The Standard Report can be generated automatically after the run by
selecting Generate Standard Report after run on the Statistics Collection dialog. (See “Generating
Standard Reports From Experiments” on page 399.)
To run a model with SPRunSimulation, either execute commands from a command prompt or create
a batch file or a shell script. The command must include SPRunSimulation and the complete path to
the model that is to be run, as shown in this example for Windows.
SPRunSimulation "C:\Program
Files\SIMPROCESS\models\Demos\Purchasing.spm"
The above is the simplest form for running a model without the GUI. However, model parameters (see
page 243) and process alternatives can be set as well as the number of replications. In addition, the
simulation results can be automatically placed in the SIMPROCESS database, and the model can be
SIMPROCESS User’s Manual
599
Appendix J - Running Models Without GUI
saved. These options can be set either on the command line or by using a properties file.
Available Options
The following options can be set on the command line or in a properties file. The format of the option
is always the name of the option followed with no spaces by an equals sign followed with no spaces
by the value.
•
•
•
•
•
Any global attribute designated as a model parameter - Model.NumResource1=2
•
Option to save the model after the parameters are set (thus, the next time the model is opened
in SIMPROCESS, the model parameters set by command line or properties file retain their
latest value) - Save=True (the absence of this option is equivalent to Save=False)
•
Can set the starting and/or ending date and time of the model. Absence of the time portion
indicates midnight. - Start=1/1/2005, End=1/1/2006 08:00:00.
Any process alternative - "Process name=Alternative name"
Number of replications - Replications=5
Design for committing the results to the SIMPROCESS database - "Design=My Design"
Scenario for committing the results to the SIMPROCESS database (must be used if Design
is used) - "Scenario=My Scenario"
Note: Design and Scenario should not be used on Linux since the SIMPROCESS database is an Access
database and is not available for Linux systems. Also, Design and Scenario should not be used on
Windows if the appropriate steps have not been taken to set up the database connection (See Chapter
2 of the SIMPROCESS Getting Started Manual.)
Setting Options on Command Line
Any parameters to be set must follow the model on the command line. For example
SPRunSimulation "C:\Program
Files\SIMPROCESS\models\Demos\Purchasing.spm"
Model.NumProdAPersonnel=6 Model.NumProdBPersonnel=4
"Purchasing=Centralized, Functional" Replications=2 "Design=2 Reps"
"Scenario=Scenario 1" Save=True
Parameters that have spaces must be in quotes. The order of the parameters following the model is
not important. If Design and Scenario are omitted, then the results are not committed to the database.
SIMPROCESS User’s Manual
600
Appendix J - Running Models Without GUI
Setting Options Using Properties File
The preferred method for setting parameters is to use a properties file. The file can have any name
as long as the extension is .properties. When using a properties file, the properties file name
follows the model on the command line.
SPRunSimulation "C:\Program
Files\SIMPROCESS\models\Demos\Purchasing.spm" "C:\Program
Files\SIMPROCESS\models\Demos\Purchasing\Purchasing.properties"
This example shows a file named Purchasing.properties that is in the directory of the
Purchasing.spm model. The following is an example of a properties file. Three model parameters are
set, one process alternative is set (Purchasing), the number of replications is set, and the Design and
Scenario are set. The order is not important. Do not include a Design and Scenario if the results of
the run should not be committed to the SIMPROCESS database.
Model.NumProdAPersonnel=6
Model.NumProdBPersonnel=4
Model.NumProdCPersonnel=4
Purchasing=Centralized, Functional
Scenario=s1
Design=New Design
Replications=2
SIMPROCESS User’s Manual
601
APPENDIX K
SIMPROCESS and External Java Classes
SIMPROCESS is a Java application. During execution, Java programs use the "classpath" to locate
individual classes. In order to use some of the SIMPROCESS special features that use external Java
classes, certain aspects of the classpath need to be understood.
There are three specific ways that the classpath can be used to support external Java classes in
SIMPROCESS.
•
•
•
Java Extension Mechanism
Model-Specific Java Additions
ext Directory
Please note that there are specific recommendations for when to use one over another, as not all of
them are equal.
SIMPROCESS User’s Manual
602
Appendix K- SIMPROCESS and External Java Classes
Java Extension Mechanism
The Java Extension Mechanism provides a way of adding things to the classpath without changes to
any files installed with SIMPROCESS. To use it, JAR files containing needed Java packages must
be placed where the Java Runtime Environment (JRE) will seek them when it needs to resolve a
reference. Since SIMPROCESS installs a JRE for its own use, that location will always be the jre/
lib/ext directory created by the installer.
Typical Use
The most common use of the Java Extension Mechanism is to support using databases other than
Microsoft Access with SIMPROCESS. See “SIMPROCESS and Other Databases” on page 385. In
the example cited there, database drivers for MySQL, a popular open source database, are required
in order for SIMPROCESS to use it, so one or more JAR files must be placed in this location.
Recommended Use
When third party Java packages are needed by SIMPROCESS, the JAR files containing them can be
placed in this location. However, it's recommended that this be done only when specifically necessary
and when the model-specific mechanism described in the next section is not appropriate. In particular,
database drivers must use this mechanism, as they are handled by SIMPROCESS itself. Therefore,
the database drivers will not be sought in model directories.
Warning on Potential File Loss
When adding JAR files to the jre/lib/ext directory of an installed copy of SIMPROCESS, it's
a good idea to keep copies of the original JAR files. When SIMPROCESS is uninstalled, the uninstaller
program will unconditionally remove the entire jre directory, thus removing any added JAR files.
In addition, every new release installer will install a jre directory. It's possible that this can result
in the loss of JAR files added here. So any such additions should be double-checked any time a new
installer is used.
SIMPROCESS User’s Manual
603
Appendix K- SIMPROCESS and External Java Classes
Model-Specific Java Additions
As of release 4.4, SIMPROCESS provides a new way to use added Java classes. Except in special
circumstances (e.g., database drivers), this is the preferred way of adding Java code to SIMPROCESS.
When a model is opened by SIMPROCESS its model directory is created, if not already present. To
use user-provided Java classes with the model, a new subdirectory named classes must be created
in the model directory. When simulating the model, the contents of this subdirectory will be included
in the classpath. The classes directory can contain:
•
Any number of JAR files containing packaged Java classes and related resources to which
the model may refer
•
Compiled Java classes in directories representing their package structure, along with any
related resources to which the classes may refer
•
Individual compiled Java class files considered to be in the "default package" (although this
is not recommended)
JAR files and class files can be used simultaneously with a model.
When to Use classes Subdirectory
The ExternalCall System Method supports the use of Java classes in this subdirectory (see
“Method ExternalCall:,” beginning on page 567) . Others may be added in the future. As recommended
above, the classes subdirectory should be used in preference to either of the other described
mechanisms (Java Extension Mechanism and ext Directory) except when specifically necessary or
impractical not to do so.
Why Use classes Subdirectory
Even if multiple models need to share the same set of classes and/or JAR files, this subdirectory should
be used in order to make model sharing easier. Since a model can carry its own background and icon
images (see “Importing Graphics Image Files,” beginning on page 168) and carry its own external Java
classes, the need for instructions on how to place class files and import images is eliminated. Instead,
the model file and its like-named directory can be packaged and sent as a single unit. The recipient
can then open the model and simulate without having to import background and icon images or place
external Java classes in specific locations.
SIMPROCESS User’s Manual
604
Appendix K- SIMPROCESS and External Java Classes
ext Directory
The ext directory (see “ext Directory,” beginning on page 476) is included in the SIMPROCESS
classpath. This means Java code placed here will be accessible to SIMPROCESS when appropriate.
The code should be compiled and its package directory structure copied into the ext directory. It
is possible to use code without package statements, in what Java refers to as the "default" package,
but this is not recommended and not "officially supported" by Sun, though it will work.
In SIMPROCESS releases through 4.3, this directory was the only means of using "loose" Java classes
(those not in a JAR file) with SIMPROCESS. Java classes placed here were typically used with the
ExternalCall System Method and other similar features. This directory is still supported for such
use, but it is recommended that it only be used when multiple models need to share the same classes
(not necessarily simultaneously) and when it's impractical to use the newer model-specific mechanism
described in the previous section. Note that only "loose" Java classes may be used in this directory.
To use Java classes contained a JAR file, use one of the other means described above.
SIMPROCESS User’s Manual
605
Index
A
activities
Activity Browser 35
aligning 48
Assemble 120–122
Assign 129–130, 250
Batch 122–123
See also Batch Activity
Batch, system attributes of 241
Branch 132–133
Clone ??–140, 140–141
Comment (dialog field) 72
commenting 72
connecting 65
creating from menu 52
defining resource requirements 152
definition of 19, 64
delay time, defining 71, 78–79
displaying name under icon 71
distributing 49
Document command 72
documenting 72
entity processing time 71
Free Resource 156–158
Gate 125–127
entity release policies 125
gating policies 125
Generate 320–342
Get Resource 155–156
grouping 50
Hide 51
Hide All Names 51
icons, choosing 72
icons, labeling 72
icons, showing name under 71
icons, types 72
interrupting 352
Join 141, 145–146
linking 65
Local Attributes 248
Merge 136
Name field 71
Properties dialog 70–74
removing from model 70
Replenish Resource 159–160
resources needed by, defining 71
Show All 51
Show All Names 51
Show Attached 51
Show Local Names 51
Split 141, 142–145
Synchronize 127–128
Text Block 73
time required to perform 78
Transfer 137–??
Transform 130–132
Unbatch 124–125
ungrouping 50
using activity attributes in an expression
variable resource usage 152
Activity Properties dialog fields 70–74
Activity-Based Costing 176–184
Cost Calculations 183
Cost Periods 179
Resource Costs 180–183
adding objects to a model 69–70
animation
changing during simulation 92
settings 92
Animation Settings 57–58, 89
Animation Speed 58, 90
Show Clock 57, 90
Show Counts 57, 90
Show Entities 58, 90
Update Dynamic Labels 58, 90
Assemble Activity 120–122
batch component entities 122
Assemble component entities pad 120
Assign Activity 129–130, 250
Entity Priority 129
User Defined Attributes 129
Attribute Value Initialization 269
SIMPROCESS User’s Manual
261
606
Index
Attributes 239
Model Parameter 245
Model Paramters 91
System 241
User Defined 242
Automatic saving 33
B
Background Color 48
Background Graphics 167
Background Text 163
Batch Activity 122–123
Batched Entity 123, 126
Maximum Batch Size 123
maximum number of entities 123
Maximum Wait Time 123
Minimum Batch Size 123
parent entity 123, 126
Batched Entity, of Batch activity 123, 126
Both must be reached, Generate schedule field
bottlenecks
sources of 65
Branch Activity 132–133
Branch Connectors 133
C
calendar dates
effect on simulation 89
calendar event. See events, calendar
calendar schedule 322
changing entity type 130
Clone Activity ??–140, 140–141
copy time stamps 141
number of copies 141
Comment field 70, 72
Commit to Database 376
Confidence Intervals 93, 186
Connectors
Hide All Names 52
Show All Names 52
Show Local Names 52
connectors
607
322
Auto Label 134
Branch Activities and 132
changing attributes 134
defined 65
names, displaying 66, 134
Properties dialog box 134
converting entities from one type to another 130
Count Limit, of entity release 322
Create Menu 52–53
Activities 52
Background Graphic 53
Background Text 53
Processes 53
cycle time
definition of 19
Dispose activity and 80
ending 80
reports 189, 196, 199
cyclical schedules 324–326, ??–330, ??–334
defining 324–326, ??–330, ??–334
See also sequence of events
types 324
D
Database
examples 301
interfacing with 296–302
setting up DSN 296
system methods 298, 303
database graphs 382
Database Queries 380
database reports 382
Date field in calendar events 328
Define Menu 53–56
Attributes 55
Distributions 54
Entities 53
Functions 55
Model Description 56
Resource Downtimes 54
Resources 53
SIMPROCESS User’s Manual
Index
Seeds 51
Templates 56
Time Stamps 55
Delay Activity 78, 78–79
Delay Duration
for Assemble activities 122
for Unbatch activities 124
Delay Time field 78
delay time, specifying 78–79
deleting objects 70
Display Error Alerts 398
Display Error Alerts Field 389
Displaying ABC Reports 184
Dispose Activity 80
Distribution
Beta 484
Erlang 485
Exponential 482
Gamma 483
Geometric 491
Hyperbolic 492
Lognormal 487
Normal 480
Poisson 488
Triangular 481
Uniform 479
Weibull 486
distributions
defining standard and tabular
viewing graphically 77
Document command
template for 72
Documentation
Model Description 56
printing 27
Downtimes
defining 54
Duplicate 29
Duration
for Assemble activities 122
Duration field 327
Dynamic Label
163
E
54
Edit
Activity Brower 35
Edit Menu 28–41
Clear 29
Copy 28
Cut 28
Duplicate 29
Model Search 38
Paste 29
Preferences 30
Properties 41
Resize 29
Select All 29
Undo 28
Entities
adding 81–83
assembling 120
branching on priority 133
branching on type of 133
changing type of (Transform Activity)
combining 120
coordinating release of 127
copying 83
cycle time 80
defined 64
defining 75, 81–83
deleting 83
destruction of 80, 124
disposal of 80, 124
duplicate (Clone Activity) 140
Generate activity and 75
icon, selecting 81, 82
input to Gate Activity 125
instance (defined) 81
parent entities 122, 123, 126
preempting lower priority 161
priority 81, 135
changing 129
SIMPROCESS User’s Manual
130
608
Index
in Assign Activity 129
of transformed entity 131
released by Gate Activity 125
removing 83
reports 188
Transform Activity and 130
type (defined) 81
using entity attributes in an expresssion 261
entities
cyclical generation 324
defining 53
generation 320
generation schedule in event file 330
none generated, reasons for 320
Recorder 364
Time Stamps vs. Recorder Objects 364
tracking arrival and departure times 364
Entities, accumulating 125
Entities, batching. See Batch Activity
Entities, limiting number in Dispose 80
entity count 189
Entity Related Activities 120
event cycles
Repeat Sequence 326
repeating 326
scheduling of 328–329
types 324–325
event files 330
all defined option 331
checking syntax of 330
entity types, selecting 331
identifying to SIMPROCESS 330
new entities specified in 331
Event Logs 362, 364
Recorders 364
Time Stamps 362
events
calendar 322–329
Date field 328
trigger point 328
changing sequence of 325–326
609
Count Limit 327
Duration 327
duration of 327
inactive periods 329
Move 325
moving 325
No event 329
number of times executed 326
Repeat Event 327
repeating 326
scheduling of 329
sequence of 325
single event 329
upwards option 326
Experiment Manager 387
Database Tables 388
Experiment Errors 398
Experiment Operation 397
Experiment Setup Form 388
Experiment Trace 397
Generating Standard Reports 399
Interacting With Experiments 399
Run All Experiments 395
Run Selected Experiments 395
Run Specific Experiment 395
Experiment Menu 60
Define Experiments 60
Run All Experiments 60
Run Selected Experiments 60
Run Specific Experiment 60
Experiments
Defining Experiments 388
Entering Design Information 390
Entering Experiment Information 388
Entering Model Information 389
Entering Model Parameter Information 392
Entering Process Alternative Information 393
Entering Scenario Information 391
Running Experiments 395
Starting Experiments 395
ExpertFit 61
SIMPROCESS User’s Manual
Index
Exporting
Activity List 24
Graphics Image File 23
Publish Model to HTML 27
Simulation Results 23
Ultimus Workflow 24
UML Activity Model 24
XPDL Model 24
Expressions 240, 254–275
Language Basics 254
Using Attributes in 261
external data, using 330
external files 330
F
File Menu 20–27
Close 20
Exit 27
Export 23
Import 21
New 20
Open 20
Print 27
Save 21
Save As 21
file, input to Generate activity
See event files
Free Resource Activity 156–158
Functions
defining 55
G
Gate Activity 125–127
entity release policies 125
gating policies 125
Threshold Release 127
Trigger Release Quantity 127
used as a buffer 125
Generate Activity 75–77, 320–342
active period of entity release 320
Both must be reached 322
calendar schedule, defining 322
complex, defining 320–342
Count Limit 322
cyclical schedule, defining 324–326, ??–330,
??–334
Daily schedule 323
Date schedule 323
Define Entity 75
defining 75–77
defining complex 320–342
entities generated 75–77, 321
entity release begin and end dates 320
events. See sequence of events
external event file 330
external schedule 335
Hourly schedule 323
inactive periods 329
Interval 76–77, 322
limiting number of entities generated 322
Monthly schedule item 322
periodic schedule, defining 321
Quantity 75
Release Begin 320
release dates and simulation dates 320
Release End 320
schedule
calendar 323
Daily 323
Date 323
defaults 321
file input 330
Hourly 323
number of entities at each release 321
Use default 321
Weekly 323
schedule items
adding 321
Both must be reached 322
copying 321
Count 321
Count Limit 322
defining 320–325
SIMPROCESS User’s Manual
610
Index
deleting 321
editing 321
entity categories 321
Interval 322
limiting number of entities 322
modifying 321
Monthly 322
periodic 321
removing 321
Yearly 322
Summary 342
time between entity generation events
322
Weekly schdedule 323
Yearly schedule item 322
Get Resource Activity 155–156
gif 168
Global Attributes
defining 243
graphics
importing 168
grid
color 50
grid lines 50
snap to grid 50
spacing 50
H
Help Menu 62
help, getting
help topics 62
online help 74
hierarchical models 63–64
hierarchy, ascending 92
hierarchy, descending 91
historical data
See also event files
historical data, using 330
Hold pad, of Gate activity 125
I
Icon dialog field
611
72
76–77,
Icon Manager 62
icons
activity icons 72
adding text to 72–73
entities, listing 82
labeling 72–73
showing object name under 71
Importing
Background 23
Icon 169
Version 2.2.1 Model 22
XPDL Model 22
Importing graphics 168
Initializing attribute values 269
interval between entity generations
Interval dialog field 76
76
J
Java RMI 336
Join Activity 141, 145–146
jpeg 168
jpg 168
L
Launch Database Application
Layout Menu 42–50
Align 48
Background Color 48
Bring To Front 50
Distribute 49
Distribute Pads 50
Grid Color 50
Grid Lines 50
Grid Spacing 50
Group 50
Send To Back 50
Snap To Grid 50
Swimlanes 43
Ungroup 50
Layout toolbar
contents 69
using 69–70
SIMPROCESS User’s Manual
378, 384
Index
Library
Concepts 224
Management 225
Library Manager 225
limiting entities in Dispose activity
Local Attributes
defining 248
O
80
M
Manage Results form 378, 384
Maximum Batch Size, of Batch activity 123
Maximum Entity Count, Dispose activity
parameter 80
Maximum Wait Time, of Batch activity 123
Merge Activity 136
Minimum Batch Size, of Batch activity 123
model
adding objects to 69–70
checking for errors 91
components 63–67
hierarchical structure 63–64, 67
removing objects from 70
selecting objects in 70
using Model Attributes in an expression 261
Verify Model 91
verifying 91
Model Attributes
defined 242
using in an expression 261
model design 377
Model Parameters 91, 245
Move command, events 325–326
moving down a level in hierarchy 91
moving up a level in hierarchy 92
N
Name (dialog field) 71
naming
activities 71
no entities generated, reasons
No Event schedule 329
320
objects
adding to draw space 69–70
deleting 70
removing from draw space 70
selecting several 70
OptQuest for SIMPROCESS 401, 431
Constraints 408
Decision Variables 407
Defining An Optimization 406
Objective 406
Preparing for Optimization 404
Process Alternatives 414
Run Options 414
Running an Optimization 416
Tips and Suggestions 423
Output Entity, Assemble activity 122
P
pads
Assemble and Release (Assemble Activity) 120
connecting levels in model hierarchy 86
defined 67
distributing 50
Hide All Names 52
Hold and Trigger pads (Gate Activity) 125
input pads 127
number of in Synchronize activity 127
Show All Names 52
Show Local Names 52
parent entities 122
parent entity 123, 126
PDF manuals 62
periodic schedule 321
png 168
Print
Layout 27
Model 27
Model Documentation 27
Process Documentation 27
priority
SIMPROCESS User’s Manual
612
Index
of transformed entity 131
priority, of entities 81, 129
branching on 133
probability
branching on 133
Probability distributions 369
Process Modeling 14
processes
and model hierarchy 64
creating from menu 53
defining 84
definition of 19, 63
sub-processes 85–87
activating 86
active 85, 86
alternatives 85
copying 86
deleting 86
modifying 86
Q
Queue
Gate activity 125
hold for condition 120
wait for resource 65, 120
R
random distributions
specifying 76–77
random number stream 77
rank method 121, 123, 126, 128
Real-Time Plots 189, 193, 197, 199
plot group 214
saving 206
Setting Plot Properties 202
zooming 208
Recorder Objects
output file (recorder.msg) 364
Recorders
Definition of 364
Release Begin 320, 322
Release End 320, 322
613
Release pad (of Assemble) 120
removing objects 70
Repeat Sequence, events 326
Replenish Resource Activity 159–160
Report Menu 59–60
Commit to Database 60
Define Custom Real-Time Plots 60
Define Global Statistics Collection 59
Define Real-Time Plots 59
Display Real-Time Plots 60
Display Standard Report 59
Launch Database Application 60
Launch Plot Application 60
Reports
ABC 184
activities 194–198
attributes 194
Costs 184
default 186
entities 188–192
resources 192–194
Standard 186
Resize 29
Resource Downtime
adding template 232
Resources 147–151
activities and 65
adding 84
adding template 149, 231
allocation policy 148
consumable 151
cost 151
defining 53, 84, 149
defining requirements for activities 152
definition of 20
downtime 151
Downtime Schedule 347–361
entities and 65
fractional usage 150
replenishing consumable 159
usage combinations 153
SIMPROCESS User’s Manual
Index
variable usage 152, 252
viewing by activity 51
Retain Batched Entity 124
Run Settings 57, 88, 109
Cost Periods 57
running a simulation 91
Running a Simulation with Model Parameters
Running an Optimization 416
91
S
scenario 378
Schedule of events 325
schedule, of Generate activity 320
Selected Field 389
sequence of events
Both must be reached 327
calendar 327
entity generation start time 328
entity generation, start of 328
start time 328
definition
periodic 326–327
Both must be reached 327
start time 327
Set Entity Priority To, on Assign activity 129
Set Entity User Attributes, on Assign activity 130
Show Name checkbox 71
Show Text checkbox 73
Simluation Output
displaying cost results 183
Simulate Menu 56–59
Animation On 59
Animation Settings 57
Change Model Parameters 58
Pause/Resume 58
Run 58
Run Settings 57
Stop 58
Verify Model 59
simulation
animation
options 92
settings 92
showing entities 81
changing animation options 92
duration of 80, 88
End Date 88
ending 80
length of, in calendar time 88
Max Count and 80
options, run time 88
Pause 92
pausing 92
restart after pause 92
resuming after pause 92
run dates 88
run time settings 88
running 88–93
Start Date 88
starting 91
stopping 80
stopping temporarily 92
Simulation (menu item) 92
Simulation Output
Display Standard Report 186
single event 329
Split Activity 141, 142–145
Spreadsheet
interfacing with 303–307
Standard Output Report 186
StatFit 367
Static Text 163
Statistical Distributions 477
statistical distributions 373
specifying 76–77
Statistical Output
Connector Statistics 198
Custom Plots 209
Define Global Statistics Collection
Define Real-Time Plots 59, 200
Display Standard Report 93
Displaying Real-Time Plots 203
SIMPROCESS User’s Manual
59
614
Index
Entity Statistics 188
Process/Activity Statistics 194
Resource Statisitcs 192
Simlation Results File 221
Statistical Simulation Experiment 372
Experimental Data 372
Mean-Value Analysis 372
Stream 77
Sub-Processes 85–87
definition of 19
See also processes, sub-processes
Swimlanes 43
Synchronize Activity 127–128
System Attributes 241
Tools Menu 61
Transfer Activity 137–??
Transform Activity 130–132
Number of Entities Output 130
Output Entity Type 131
Trigger
Assemble,
option
of
Assemble
activity 120, 122
Trigger pad, of Gate activity 125
trigger point, of calendar event 328
Trigger Release Quantity, of Gate activity 127
Triggered Release, Gate activity policy 125, 127
U
Unbatch Activity 124, 124–125
Unbatch Nested Batches 124
Use default 321
User Defined Attributes 242
and Assign Activity 129, 250
assigning values to 129, 250
Branch On 133
copying in Transform activity 131
globally defining 243–248
initializing values 269
locally defining 248
User Defined Distributions
Procedures 98
Two methods of creation 98
User Defined Functions 293
T
Tabular Distributions
Procedures 99
Template
defining 225
template, for Document file 72
Templates
adding 229
Defining and Editing Templates 225
editing 234
resource 231
resource downtime 232
structure 227
Terminology 19
Text Block 73
Show Text 73
Threshold Quantity, of Gate activity 127
Threshold Release, option of Gate activity
Time Stamps
Assembled Entities 363
assigning 362
Batched 363
Definition of 55, 362
passing to an output entity 363
Transformed Entities 363
Viewing Reports 363
615
V
127
Verify Model command
View function 77
View Menu 51–52
Activities Hide 51
Activity Names 51
Ascend 51
Connector Names 52
Descend 51
Go To Top 51
Pad Names 52
Refresh 52
Resources 51
SIMPROCESS User’s Manual
91
Index
View 1 to 1 52
Zoom In 52
Zoom Out 52
viewing higher levels 92
viewing lower levels 91
W
Window Menu
62
SIMPROCESS User’s Manual
616
Index
617
SIMPROCESS User’s Manual