1
STATISTICAL ANALYSIS TOOL USING ENTERPRISE JAVA BEANS AND
THE J2EE ARCHITECTURE
by
PADMAJA HAVALDAR
B.Sc., University of Goa, 1995
M.Sc., University of Goa, 1998
---------------------------------------------A REPORT
Submitted in partial fulfillment of the
requirements for the degree
MASTER OF SOFTWARE ENGINEERING
Department of Computing and Information Sciences
College of Engineering
Kansas State University
Manhattan, Kansas
2003
Approved by
Major Professor
Dr. Daniel Andresen
ABSTRACT
Statistical Analysis has been used to provide solutions to complex problems in such
diverse areas as communications, stability, finding patterns in data sets of variables and
other areas of interest. Although these problems previously lacked adequate mathematical
treatment, the results of statistical analysis have been significant both for explanation of a
pattern and also for prediction. Statistical analysis is a general scientific method and it
has applications in many areas of scientific research. The statistical analysis tool
developed provides such information about the department of statistics alumni at Kansas
State University.
This project consists of implementing a statistical analysis tool, which provides patterns
to explain research questions pertaining to the KSU statistics alumni. The project uses
statistical analysis methods like linear regression, correlation, hypothesis and chi-square
tests to provide the relationship between GPA of the alumni, his/her degree (MS/PhD),
the probability of getting a job being dependent on his/her citizenship and the dependence
of salaries on the degrees obtained. The object oriented design methodology and
programming techniques are applied to the development of the software tool. The project
applies the fundamentals of the J2EE architecture; and the Enterprise Java Beans
construct towards building a web based tool, which provides the registered user with the
ability to perform the aforementioned tests on the alumni data.
The main features of the project are an input data set of the KSU statistics alumni in
Oracle database, which provides the required information for the statistical analysis tests,
Internet access and easy-to-use interface to use the application, and instant graphical
representation and tabular summarization of the analysis results.
1
TABLE OF CONTENTS
TABLE OF CONTENTS .....................................…………………………1
LIST OF FIGURES......................................………………………………2
CHAPTER 1 – VISION DOCUMENT ............................……………….. 5
CHAPTERS 2 – PROJECT PLAN ................................. ……………… 24
CHAPTER 3 – ARCHITECTURE DESIGN.......................... ………… 36
CHAPTER 4 – COMPONENT DESIGN............................. …………….50
CHAPTER 5 – SOFTWARE QUALITY ASSURANCE ................... … 107
CHAPTER 6 – TEST PLAN .................................... ……………………115
CHAPTER 7 – ASSESSMENT EVALUATION ........................ ……….118
CHAPTER 8 – USER’S MANUAL ............................... ………………..140
CHAPTER 9 – PROJECT EVALUATION.......................... ……………147
CHAPTER 10 – FORMAL TECHNICAL INSPECTION………………154
REFERENCES .............................................. …………………………...159
2
LIST OF FIGURES
Figure 1 J2EE server--------------------------------------------------------------------------7
Figure 2 Overview of the Statistical Analysis Tool (SAT)------------------------------10
Figure 3 Use Case of Member Functions -------------------------------------------------20
Figure 4 Use Case of system administrator Functions ---------------------------------- 20
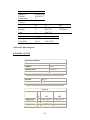
Figure 5 Gantt chart-------------------------------------------------------------------------- 25
Figure 6 Table of Function types----------------------------------------------------------- 28
Figure 7 Table of Unadjusted function points-------------------------------------------- 29
Figure 8 Table of complexity adjustment value ------------------------------------------ 30
Figure 9 - Table of COCOMO formulae --------------------------------------------------- 31
Figure 9 Object Model--- -------------------------------------------------------------------- 37
Figure 10 Servlet interaction ----------------------------------------------------------------53
Figure 11 Registration -----------------------------------------------------------------------66
Figure 12 Regression -----------------------------------------------------------------------72
Figure 13 Hypothesis -----------------------------------------------------------------------84
Figure 14 Correlation ----------------------------------------------------------------------93
Figure 15 Chi-Square ----------------------------------------------------------------------100
Figure 16 Table of Test data---------------------------------------------------------------- 121
Figure 17 Table of Test cases --------------------------------------------------------------123
Figure 18 Table of Hypothesis result -----------------------------------------------------126
3
Figure 19 Table of Regression Result ----------------------------------------------------128
Figure 20 Table 2 of Regression Results-------------------------------------------------127
Figure 21 Table of Chi-Square Results ---------------------------------------------------129
Figure 22 Phase I duration ------------------------------------------------------------------151
Figure 24 Phase II duration ----------------------------------------------------------------- 152
Figure 25 Phase III duration ---------------------------------------------------------------- 152
4
CHAPTER 1- VISION DOCUMENT
Introduction
In today's world, scientists and research professionals besides people from all wakes of
life, generate huge amounts of data in lots of different formats for different purposes. The
resulting volumes of data can no longer be analyzed by conventional techniques- hence
the need for statistical analysis tools.
The statistical analysis tool developed aims at providing graphical and tabular results to
research questions by performing the tests relevant to the questions.
The J2EE architecture with EJB provides the latest development method to implement
this tool, as it uses multi-tier architecture and provides methods to connect the tools and
software together. Besides, the project uses each analysis test as a session bean; hence the
expansion of the project is simplified by just adding a new separate session bean for a
new test. The number of research questions for these tests can be added easily into the
project as the infrastructure of the tests is already present and a simple modification in the
query to obtain relevant data from the database will serve the purpose. Thus using EJB
with J2EE architecture provides an appropriate technology for the implementation of this
project.
Java 2 Enterprise Edition (J2EE):
Architecture is defined as a basis to define the complete system, its structure, its
interfaces and intercommunication between the components of the system. The J2EE
5
architecture is multi-tiered and will basically be comprised of the following three main
layers:
•
Presentation layer (Front Layer): Web containers that host presentation and
possibly business logic components
•
Business layer (Middle Layer): Application containers that host business logic
components
•
Backend layer (Data layer): Databases or RDBMS of any kind, which will host
the data and the data access methods.
J2EE applications are made up of components which are self-contained functional
units that interact with other components .The J2EE specification defines the
following J2EE components:
•
Application clients, html code and applets are components that run on the client.
•
Java Servlet and Java Server Pages
(JSP
) technology components are Web
components that run on the server.
•
Enterprise JavaBeans
(EJB
) components (enterprise beans) are business
components that run on the server.
The Java application servers are based on the Java™ 2 Platform, Enterprise Edition
(J2EE™). This platform allows the users to completely focus on the implementation of
the business logic and not worry about the low level details, which are managed by J2EE.
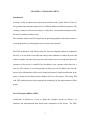
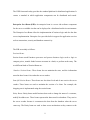
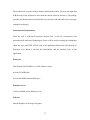
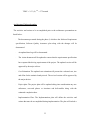
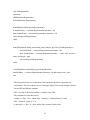
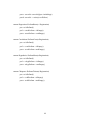
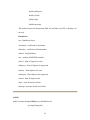
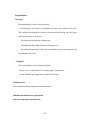
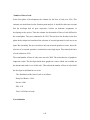
The J2EE server communications are summarized in the figure below:
6
Figure 1
J2EE Server
The client can communicate with the business tier either directly or through the web tier.
In the statistical analysis tool, the client will communicate through the web tier. The web
tier constitutes of either servlets or Java Server Pages. The business tier constitutes of the
business logic implementation. The Enterprise Java Beans, which comprise the business
tier, handle this responsibility.
Since it is based on the Java framework, the J2EE architecture is platform-independent
and component based which makes it easy to write J2EE applications as the business
logic is organized into reusable components and the developers can concentrate on
writing just the business logic rather than the low-level details while the J2EE platform
handles all the underlying services.
J2EE Containers provide the required interface between a component and the low level
functionalities specific to a platform that support the component. We need to assemble
the web tier components and business logic components into a J2EE application and
deploy then into containers.
7
Container settings customize the underlying support provided by the J2EE server, which
includes services such as security, transaction management, Java Naming and Directory
Interface
(JNDI) lookups, and remote connectivity.
J2EE components are packaged separately and bundled into a J2EE application for
deployment. A J2EE application is composed of one or more enterprise bean, web, or
application client component modules. A J2EE application with all of its modules is
delivered in an Enterprise ARchive (EAR) file.
The deployment process installs J2EE application components in the following types of
J2EE containers. The J2EE containers are described as follows:
•
An Enterprise JavaBeans (EJB) container manages the execution of all enterprise
beans for one J2EE application. Enterprise beans and their container run on the
J2EE server.
•
A web container manages the execution of all JSP page and servlet components
for one J2EE application. Web components and their container run on the J2EE
server.
•
An application client container manages the execution of all application client
components for one J2EE application. Application clients and their container run
on the client machine.
•
An applet container is the web browser and Java Plug-in combination running on
the client machine
8
The J2EE framework today provides the standard platform for distributed applications. It
creates a standard in which application components can be distributed and reused.
Enterprise Java Beans (EJB): An enterprise bean is a server side software component
for the server or middle tier that can be deployed in a distributed multi tier environment.
The Enterprise Java Beans allow the implementation of business logic and also the data
access implementation. Enterprise Java provides built-in support for application services
such as transactions, security and database connectivity
The EJB are mainly as follows:
Sessions Beans:
Session beans model business processes and process business logic such as logic to
compute prices, transfer funds between accounts in a bank, or perform order entry. The
two different kinds of Session Beans are:
Stateless Session Beans: These beans do not maintain the state, and the information
stored in these beans is lost when the server crashes.
State-full Session Beans: These beans are also short lived and do not survive the server
crashes. These beans are used to maintain the session of a client. For example, the
shopping cart is implemented using the session beans.
Entity Beans: Entity beans model business data such as change the name of a customer,
modify his address etc. These beans represent the data stored in a database. They survive
the server crashes because it reconstructs the data from the database when the server
comes up. The Entity beans are used as data access mechanism as they connect to the
9
database and manipulate or retrieve the data depending upon the user request.
The EJB architecture simplifies enterprise applications by basing them on reusable,
modular components. It provides a complete set of services to those components, and
handles many details of application behavior automatically.
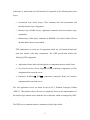
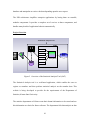
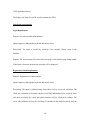
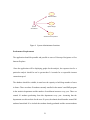
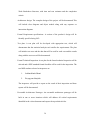
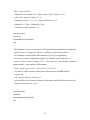
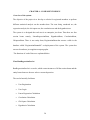
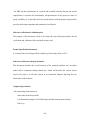
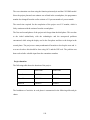
Project Overview
Statistical analysis Tool
EJB
Servlet
Session Beans
Data
Base
Entity Bean
XML
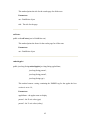
Figure 2 Overview of the Statistical Analysis Tool (SAT)
The Statistical Analysis tool is a web-based application, which enables the users to
register as members and then perform statistical analysis on the member data. This
website is being developed to provide for the requirements of the Department of
Statistics, Kansas State University.
The statistics department at K-State wants their alumni information to be stored and use
this information as a basis for future reference. The department feels that analysis on data
10
provided by the alumni will help them make decisions, which will benefit future statistics
students. The alumni data is present at the alumni center at Kansas State University. But
this information is of a confidential nature and all the information is not available. The
statistics department also needs some other information for analysis purposes, which the
k-state alumni center does not possess. The statistical analysis tool that is being
developed has provision for entering this new information that is needed.
The database will maintain the information about the alumni members and the user can
update this information online by logging into his/her account. The data of all the
members will be used as the basis for all the statistical analysis that will be provided on
the website. The website will allow four types of analysis to be done on the data; the
regression analysis, the chi-square test, the correlation test and the hypothesis test.
Oracle was chosen as the database, for the main reason that it is easily available to the
CIS students. The project deals with technologies like J2EE, Enterprise Java Beans etc
and the development of the website using the aforementioned technologies is the main
objective of the project. Hence the database part of the project was not chosen to be too
complicated.
The tool consists of one table in the database, which consists of the member data. The
table fields are: name, gpa, loginId, password, salary, degree, citizenship and join.
Purpose: To develop a website which will enable users to register and perform different
statistical analysis on the member data. The tool will essentially perform four kinds of
analysis namely, regression, correlation, hypothesis test, and chi-square test depending on
11
the research questions specified on the alumni website. The output will then be displayed
in the form of tables or graphs on the webpage.
Goal: The website in particular will be able to provide analysis for questions of the
nature of,
1. Correlation: Is there a relationship between the grade point average (GPA) of an
alumni member and the salary bracket that he currently belongs to.
2. Hypothesis testing: Is there a difference between the average salaries of the Master's
student and the average salaries of the PhD students at a 5% level of significance.
3. Linear Regression: Does higher GPA result in higher salaries for masters’ students
Does higher GPA result in higher salaries for PhD students
4. Chi-Square test: Is getting a job within 3 months of graduation independent of the
citizenship of the student at the Masters level?
Technology The application uses a three-tier application for the development of the web
site. The web site uses the J2EE server for deploying the Jar files, which contain the
EJB’s that provide the business logic.
The first tier or the client tier includes dynamic html web pages and applets that run on
the client. The web tier consists of the servlet for this project and the business logic tier
includes the Enterprise Java Beans for calculating the research questions. The EIS tier
consists of the oracle database.
12
The technologies that will be used in the project are: J2EE reference server as the
application server, Oracle as the database server, Enterprise JavaBeans: Entity beans and
session beans, XML & XSL, Java Servlets, Java Script, Java Applets and HTML.
Quality:
•
Scalability: The application will be completely scalable as it can be accessed by
using a browser (Internet Explorer and Netscape Navigator). Since the application
server used is J2EE, which is Java based, the application can be installed on
different platforms.
•
Reliability: The errors will be handled by using java exceptions in the java
programs (EJB’s and Servlets). The HTML will include java scripts to handle
error checks at the client side. Thus both client-side and server-side errors and
exceptions will be handled completely within the application. The testing process
will include a rigorous process of different types of inputs to the website to check
the reliability and rigidity of the application.
•
Security: There is no need for a highly secure system for the application. It
involves the basic security infrastructure of the normal login process for the
registered members. The members need to register into the application and then
login using the login and password that they provided.
13
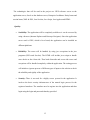
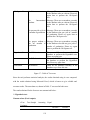
Risks:
1.
2.
3.
Risk
Mitigation Approach
Validity and integrity of each of the The research will be done in the
early part of the project to get
statistical analysis
all the information about the
The calculations that are needed are to be statistical analysis methods that
validated for performance of the right kind of need to be present on the
website. This will help in
analysis and in the right manner.
identifying the correct solution
in the early part of the project.
The live data from the alumni center may The data if not available, test
data will be used to demonstrate
not be possibly available.
and test the project.
There are some present issues with the alumni
foundation providing the data to the project.
The technologies will be
understood completely and their
The project involves use of many new need identified during the
specification
technologies and the need to understand and requirements
phase
and
also
during
the design
use them to meet the requirements.
phase so that the learning curve
is not too steep.
The learning curve
Constraints: The project mainly deals with the development of the website using J2EE
for the application server and EJB to develop the business logic needed for the project.
Thus the main constraints will deal with the learning curve to understand the
methodologies and then developing the application in the same. All the features need to
be implemented well. The implementation strategy will emphasize this focus on the
learning curve and the optimization of the features set.
14
Requirement specification
Product Perspective
The SAT is a web-based application and hence will require a browser like the Internet
Explorer 4.0 or Netscape 4.08. The application will be able to connect to remote
server and will have an oracle database server. It will use J2EE technology for its
development. The package is independent of any other application.
The J2EE application will be three-tier application with the client tier on the client
machine, the web tier and the business tier (business logic) on the J2EE server
machine and the database tier composed of the database. The business tier or the
business logic will be provided by Enterprise Java Beans and servlets and JSP pages
will provide the web tier.
Product functions
The members will be able to register online with a login name and password. This
information is verified with the information in the database and the member is
appended.
The members will be able to add, modify or delete the information provided by them
when they register.
The members will be able to select a research question to be analyzed and analysis
will be done and the results will be displayed in the form of a graph or table.
15
Depending on the research question; regression, hypothesis test, chi-square test or
correlation analysis will be performed.
User characteristics
Basic knowledge of using computers is adequate to use this application. Knowledge
of how to use a mouse or keyboard and Internet browser is necessary. The user
interface will be friendly enough to guide the user.
Constraints
Access to the web is required. As for the developer constraints, the alumni
information was not available for security reasons. Many assumptions about the data
had to be made. The learning curve was steep.
Assumptions and Dependencies
It is assumed that alumni data will be made available for the project in some phase of
its completion. Until the, test data will be used for providing the demo for the
presentations. It is assumed that the user is familiar with an Internet browser and also
familiar with handling the keyboard and mouse.
Since the application is a web based application there is a need for the Internet
browser. It will be assumed that the users will possess decent Internet connectivity.
Special Requirements
External interface Requirements
16
The member has to register using a form provided on the website. The user can input data
with the help of the keyboard or click with the mouse wherever necessary. The package
provides pull down menus from which the user can select and links and icons to navigate
among the web pages.
Infrastructure Requirements
Since the tool is web-based statistical analysis tool, it will use best-practice web
generation tools and tested technologies. Oracle will be used for storing the information
about the users and J2EE will be used as an application framework with the help of
Enterprise Java Beans to develop the functionality and the business logic of the
application.
Hardware
Intel Pentium III 300 MHz or 1.0 GHz Athlon or faster
At least 256 MB RAM
At least 200 MB freed hard disk space.
Database Server
Use the available oracle database server.
Software
Internet Explorer or Netscape Navigator
17
J2EE Application Server
The deploy tool from Sun will be used to maintain the EJB’s.
Functional requirements
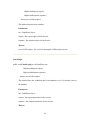
Login Requirement
Purpose: Provides member authentication
Inputs: Inputs are through the keyboard and mouse clicks.
Processing: The input is verified by checking if the member already exists in the
database.
Outputs: The correct input will result in the next page i.e the analysis page being loaded.
If the input is incorrect then an error message will be displayed.
Registration Form Requirement
Purpose: Registration of a non-member.
Inputs: Inputs are through the keyboard and mouse clicks.
Processing: The input is validated using client side as well as server side validation. The
client side validation will include checks for missing information in the required fields
and other text fields like email and phone numbers will be checked for validity. The
server side validation will involve checking if a member in the database already uses the
18
username entered. The appropriate error messages are displayed if the input is not
acceptable
Outputs: The member is directed to the main page on successful registration.
Analysis Requirement
Purpose: The research question is selected to perform analysis like regression.
Inputs: Input will be the research question selected by the user and consequently the data
that the user wants to use for the analysis.
Processing: Depending on the research question, the appropriate statistical analysis is
performed with the help of the EJB, which provide the middle layer in this three-tier
application. It can be regression analysis, correlation, hypothesis test or the chi square
test.
If an invalid input is entered, there will be appropriate error messages handled by using
java exceptions in the java programs (EJB’s and Servlets). The HTML will include java
scripts to handle error checks at the client side. Thus both client-side and server-side
errors and exceptions will be handled completely within the application. The SAT will
also undergo rigorous testing with various inputs to check whether the analysis is being
conducted correctly and that all invalid inputs are not accepted.
The feasibility of conducting the test will be checked when the member enters a request
for a particular test by checking if there is data available in the database for that particular
test. There have to be at least one Masters and PhD student to do the hypothesis test, at
19
least three members to do the regression analysis, at least one citizen and one
international student to do the chi square test. If these requirements are not satisfied then
appropriate error messages will be sent to the member.
Outputs: The output will be a graph or table of the analysis results displayed on the web
browser page.
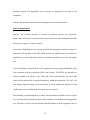
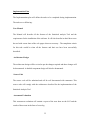
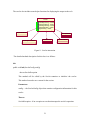
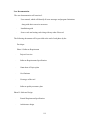
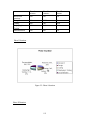
Behavior Requirements
Use Case 1
Login
Register
Member
Update information
Select Analysis question
Figure 3 Member Functions
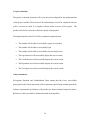
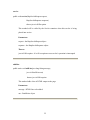
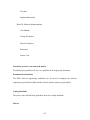
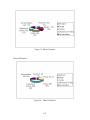
Use Case 2
20
Maintain website
Update changes
System
Administrator
Add new research questions
Figure 4 System Administrator functions
Performance Requirements
The application should be portable and possible to users of Netscape Navigators well as
Internet Explorer.
Since the application will be displaying graphs for the analysis, the response time for a
particular analysis should be not be greater than 3-4 seconds for a respectable internet
connection speed.
The database should be scalable; it must have the capacity to hold large number of users
in future. There are about 50 students currently enrolled in the master’s and PhD program
in the statistics department and the number of enrollment increases every year. There are
around 10 students graduating from this department every year. Assuming that the
department uses this website for the next 20 years, the alumni should number around 200
students henceforth. If we include the students already graduated and the current students
21
and faculty besides other users using the website, the number of users will
be approximately 500. Oracle is scalable enough to meet these requirements for the next
20 years.
The number of connections to the system should not slow down the application to a large
degree.
The data for the analysis will be obtained from the database of users, so the response time
for a query from the client side to the database side should not be more than 5 seconds.
Error handling should be implemented and the application should be able to handle all
run time errors.
The application should be flexible for future enhancements, for example, the addition of a
few more research analysis questions.
Quality attributes
The application will be composed of Enterprise Java Beans, which serve as the business
logic layer and Java servlets, and JSP pages, which serve as the web tier. All the code
will be documented using current standards and documentation will be provide to the
user to make use of the application. Added documentation will include the System
Delivery Document, which will document the installation procedure. Remote availability
will depend on an active Internet connection.
Testing for the application will be followed as a continuous process followed in parallel
to the requirements, design and implementation phase. This will include a pre-testing
22
phase, which validates the requirements of the system and also provides a feasibility
study on the project. The next phase will be the testing phase, which will include testing
the complete application after implementation. Unit testing, functional testing, white box
testing for the code and the black box testing of the application as a whole unit will be a
part of the testing phase. Thus the product will be thoroughly tested for each functional
requirement and documented for its reliability.
23
CHAPTER 2 - PROJECT PLAN
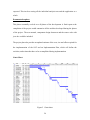
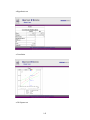
Introduction: The purpose of the project plan is to give an account of the three phases of
the project specifying the iterations and milestones in the development of the Statistical
Analysis Tool (SAT). A Gantt chart is included in the document for this purpose, which
gives a detail of the plan with estimated dates and sign-offs.
The project essentially spans over three phases of development, which are the
requirements phase or the inception phase, the design phase, or the elaboration phase and
the implementation phase or the production phase.
Inception phase
In the first phase of development i.e the Requirement phase, a working prototype of the
project would be developed to demonstrate the feasibility of the project. This would
involve gathering requirements from the end-users, learning the technology used to
develop the application, and developing the documentation which includes the
requirement specification plan, software quality assurance plan, architecture elaboration
plan and the cost estimation plan. At the completion of phase I, a presentation
summarizes all the above processes.
Elaboration phase
The second phase of development consists of the design of the project. An object model
specifying the architecture design would be developed. The entity bean and two session
beans will be developed which execute two of the statistical tests, namely the simple
24
linear regression and the correlation bean. A design of the website will be also be
developed.
The requirements will be formally specified using the USE tool and object constraint
language would be used to write the constraints.
Two inspectors would conduct a formal technical inspection of the requirement
specification and the results of the inspection will be documented and produced along
with all final documents. A test plan would be developed and a second executable
prototype will be implemented for demonstration at the second presentation. All the
changes suggested during the first presentation will be considered and the documents will
be refined. The design phase would be complete when the committee members approve
the documents and the progress in the project.
Production phase
This phase consists of the complete implementation of the project. The four statistical
tests, which are four session beans and the registration bean, which is an entity bean, will
be implemented. The results will be displayed in the form of graphs or tables. All the
documents will be refined and a project evaluation will be made. An assessment
evaluation will be conducted to test the application. This phase would be complete when
the committee approves the project and the documentation.
Testing phase
The testing involves making test cases to test if the functionality of the project behaves as
25
expected. This involves testing all the individual analysis tests and the application as a
whole.
Documentation phase
This phase essentially evolved over all phases of the development. A final report at the
completion of the project would summarize all the artifacts developed during the phases
of the project. The user manual, component design document and the source code with
java doc would be included.
The project plan also provides an updated estimate of the cost, size and effort required for
the implementation of the SAT and an Implementation Plan, which will define the
activities, and actions that have to be accomplished during implementation.
Gantt Chart
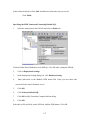
Figure 5 Gantt chart
26
Cost Estimation
In order to achieve efficient and effective management of software projects, it is
important to estimate the size and cost of the project. For the size and cost estimation of
my MSE project, I will use Function Point Analysis (FPA) and COCOMO model to
predict the development effort of the statistical analysis package. Function point analysis
and the COCOMO model are an accepted standard for the measurement of software size
in software engineering.
Function Points Analysis
The FPA is a reliable method for measuring the size of computer software. It essentially
measures functionality that the user requests and receives. It also measures the software
development and maintenance cost and size independently of the technology used for
implementation
The general approach that FPA follows is
•
Count the number of inputs, outputs, inquiries, master files, and interfaces
required, then calculate the Unadjusted Function Points (UFP)
•
Calculate the adjusted function point (AFP) by multiplying these counts by an
adjustment factor; the UFP and the product complexity
•
adjustment.
Calculate the Source Lines of Code (SLOC) with the help of the AFP and the
Language Factor (LF)
Calculation of the unadjusted function points (UFP):
27
The FPA measures functionality that the user requires. The specific user functionality is a
measurement of the functionality delivered by the application as for user request. The 5
function types identified are
•
external input which receives information from outside the application boundary,
•
external output which presents information of the information system,
•
external enquiries which is special kind of an external output.
•
An external inquiry presents information of the information system based on a
uniquely identifying search criterion, without applying additional processing
(such as calculations).
•
internal logical files contains permanent data that is relevant to the user The
information system references and maintains the data and
•
external interface files also contains permanent data that is relevant to the user.
The information system references the data, but the data is maintained by another
information system
For each function identified above the function is further classified as simple, average or
complex and a weight is given to each. The sum of the weights quantifies the size of
information processing and is referred to as the Unadjusted Function points.
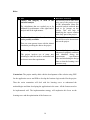
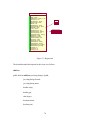
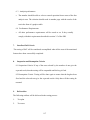
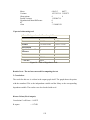
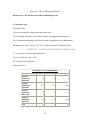
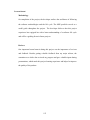
The table below shows the function types and the weighting factors for the varying
complexities.
28
Function type
Simple
Average
Complex
Internal Logical File
7
10
15
External Interface File
5
7
10
External Input
3
4
6
External Output
4
5
7
External Inquiry
3
4
6
Figure 6 Table of Function types
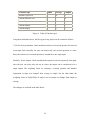
Using these definitions above, the files types in my project can be counted as follows:
** For the first presentation, I had considered selection of research question for each test
as an input. But essentially, the user can choose only one research question at a time,
hence the selection of a research question is considered as one single input.
Similarly, for the outputs, I had considered the output of each test separately. But again,
since the user can select only one test at a time; the output can be considered to be a
single output. The weighting factor for selecting a research question and Member
registration as input was changed from average to simple. On the other hand, the
weighting factor of Graph/Table of analysis test as output was change from simple to
average.
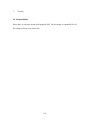
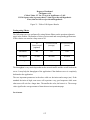
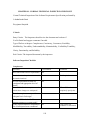
The changes are reflected in the table below.
29
Inputs
Outputs
Inquiries
Files
Interfaces
Weighting Factor
Simple Average
3
3
3
4
Member Login
Member Registration
Select a research question
Member login confirmation
Member
Registration
4
confirmation
Graph/Table of analysis test
Validate member information
View alumni list
Linear regression
correlation
Hypothesis test
Chi square test
Application server to database
User to application server
Complex
Count
9
13
5
4
4
10
10
10
10
8
40
10
10
Total UFP
20
90
Figure 7 - Table of Unadjusted function points
After the changes were made, the new total unadjusted function points (UFP) came up to
be 90.
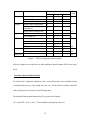
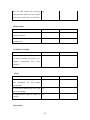
Calculate Adjusted Function Point
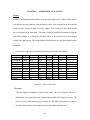
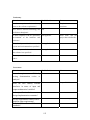
To calculate the Complexity adjustment value, several factors have to be considered, such
as Backup and recovery, code design for reuse, etc. All the factors and their estimated
values in this project are shown in the following table.
The adjusted function point denoted by FP is given by the formula:
FP = total UFP * (0.65 + (0.01 * Total complexity adjustment value)) or
30
FP = total UFP * (Complexity adjustment factor)
Total complexity adjustment value is counted based on responses to questions called
complexity-weighting factors in the table below. Each complexity-weighting factor is
assigned a value (complexity adjustment value) that ranges between 0 (not important) to
5 (absolutely essential).
Number
1
2
3
4
5
6
7
8
9
10
11
12
13
14
Complexity Weighting Factor
Backup and recovery
Data communications
Distributed processing
Performance critical
Existing operating environment
On-line data entry
Input transaction over multiple
screens
Master files updated online
Information domain values complex
Internal processing complex
Code designed for reuse
Conversion/installation in design
Multiple installations
Application designed for change
Total complexity adjustment value
Value
1
2
2
5
2
2
1
3
5
4
5
4
2
4
42
Figure 8 - Table of complexity adjustment value
Calculate the Source Lines of Code (SLOC) and the formulas used
·
Total Unadjusted Function Points (UFP)
·
Product Complexity Adjustment (PC) = 0.65 + (0.01 *42) = 1.07
·
Total Adjusted Function Points (FP) = UFP * PC = 96.3
31
= 90
·
Language Factor (LF) for Java assumed as = 38
·
Source Lines of Code (SLOC) = FP * LF = 3659
** After taking the changes into consideration, the source lines of code have changed
from 4636 to 3659.
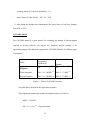
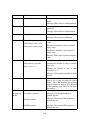
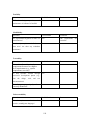
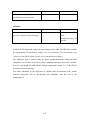
COCOMO Model
The COCOMO model is a good measure for estimating the number of person-months
required to develop software. My project, the Statistical analysis package is an
application program. The table below presents the COCOMO formulae for different types
of programs:
Programmer
Productivity
TDEV
Development Time
(Month)
PM = 2.4 * (KDSI) PM = 2.5 * (PM)
Application
Programs
1.05
0.38
Utility Programs
PM = 3.0 * (KDSI) 1.12 PM = 2.5 * (PM) 0.35
System Programs
PM = 3.6 * (KDSI) 1.20 PM = 2.5 * (PM) 0.32
Figure 9 - Table of COCOMO formulae
Using the above formula for the application programs,
The programmer productivity and the development time are as follows:
·
KDSI = 3.6 KLOC
·
PM = 2.4 * (3.6) 1.05 = 9 person-month
32
·
TDEV = 2.5 * (9) 0.38 = 5.75 month
Architecture Elaboration plan
The activities and actions to be accomplished prior to the architecture presentation are
listed below:
·
The documents presented during the phase I, which are the Software Requirement
specification, Software Quality Assurance plan along with the changes will be
documented.
·
An updated time log will be documented.
·
The vision document will be updated to ensure that the requirements specification
have captured the driving requirements of the project. The updated version will be
approved by the major advisor.
·
Cost Estimation: The updated cost estimation will present the evaluated cost, size
and effort for the statistical analysis tool. The revised version will be approved by
the major advisor.
·
Project plan: The project plan will be updated taking into consideration any new
milestones, corrected phases or iterations and deliverables along with the
estimated completion date.
·
Implementation Plan: The Implementation plan will define the activities and
actions that must be accomplished during implementation. The plan will include a
33
Work Breakdown Structure, with time and cost estimates and the completion
criteria.
· Architecture design: The complete design of the project will be documented This
will include class diagrams and object models along with any sequence or
interaction diagrams.
· Formal Requirement specifications: A section of the product’s design will be
formally specified using OCL.
· Test plan: A test plan will be developed with appropriate test, which will
demonstrate that the statistical analysis tool satisfies the requirements. The plan
will include test cases and the data that will be used for each case and the results
along with the test cases will be documented.
· Formal Technical Inspection: A test plan for the formal technical inspection will be
selected and a IEEE standard formal checklist will be used for the inspection. The
two MSE students selected as inspectors are
1.
LakshmiKanth Ghanti
2.
Divyagyana Nanjaiah
The inspectors will provide a report on the result of their inspection and these
reports will be documented.
· Executable Architecture Prototype: An executable architecture prototype will be
built in one or more iterations which will address all critical requirements
identified in the vision document and expose the top technical risks.
34
Implementation Plan
The Implementation plan will define the tasks to be completed during implementation.
The tasks are as following:
User Manual
The Manual will describe all the features of the Statistical analysis Tool and the
requirements for the installation of the software. It will also describe in detail how to use
the tool with screen shots of the web pages wherever necessary . The completion criteria
for this task would be when all the features and their use have been successfully
described.
Architecture Design
The architecture design will be revised as per the changes required and these changes will
be documented. A detailed component design will also be documented.
Source Code
The source code will be submitted and will be well documented with comments. This
source code will comply with the architecture described for the implementation of the
Statistical Analysis Tool
Assessment Evaluation
This assessment evaluation will contain a report of the tests done on the SAT and the
results of these tests in the form of a test log.
35
Project evaluation:
The project evaluation document will review the process adopted for the implementation
of this project and the effectiveness of the methodologies used. The completed software
will be reviewed to check if it complies with the initial overview of the project . The
product will also be reviewed to check the quality of the product.
The implementation of the SAT will be considered completed when
•
The member will be able to successfully register as a member
•
The member will be able to successfully login
•
The member will be able to successfully select an analysis test
•
The regression test will successfully display the correct results
•
The Correlation test will successfully display the correct results
•
The Hypothesis test will successfully display the correct results
•
The Chi-Square test will successfully display the correct results
Other documents:
Divyagyana Nanjaiah and Lakshmikanth Ganti stating that they have successfully
participated in the formal inspection of the requirement specification and thus passed the
software requirements specification will provide two formal technical inspection letters.
References will be provided for all notations used in the portfolio.
36
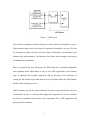
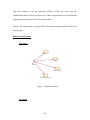
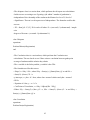
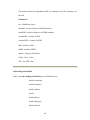
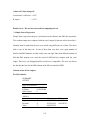
CHAPTER 3 – ARCHITECTURE DESIGN
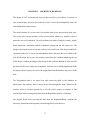
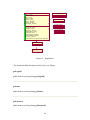
The design of SAT is summarized using an object model as given below. It consists of
four session beans, one entity bean and one servlet. Arrows and multiplicities show the
relationship between the classes.
The model consists of a servlet class, four session bean classes and an entity bean class.
The servlet class creates instances of the session beans whenever a member selects a
particular test to be performed. The tool performs four kinds of analysis, namely, simple
linear regression, correlation analysis, hypothesis testing and the chi square test. The
design is developed in such a way that each test is a session bean. This design enables the
expansion of the tool. If a new test other than the above four tests has to be added to the
tool, the developer has to just write another session bean for it without disturbing the rest
of the design. Another advantage of the design is that it allows addition of more research
questions for the tests without any complexity. Since the test is already implemented, the
developer just has to query to retrieve the proper data from the database and pass it to the
tests.
The Registration bean is an entity bean and creates the table in the database on
deployment. The member data is stored in the data through this bean. Whenever the
member selects a research question for a test, the servlet creates an instance of that
session bean which in turn gets the data from the Registration bean as a collection.
The Session beans, after receiving the data from the RegistrationBean, compute the
necessary calculations and output the result through XML to the browser.
37
The remote classes of the beans define the modules implemented in the bean class and
the home classes create and destroy the EJB’S.
Figure 10 - Object Model
38
Formal Requirement Specification
A model to test and formally specify primary properties of the SAT was developed.
Object constraint language (OCL) was used to write the constraints and the USE tool was
used to test the model.
The model designed is given below. The four tests are used as four classes namely, the
correlation class, regression class, chi-square class and the hypothesis class. The
registration class also has an All Registration class which acts as a collection of data,
which is passed to the session beans.
The model was tested with command scripts to check if the constraints behaved as
expected.
---- Research questions
---- 1. Correlation: Does higher GPA result in higher salaries?
-----2. Linear Regression: Does higher GPA result in higher salaries for master’s
----students?
---- Does higher GPA result in higher salaries for PhD students?
---- 3. Hypothesis testing: Test to see if there is a difference in the average salaries
---- of the Master's student and the PhD students at a 5% level of significance.
---- 4. Chi-Square test: Is getting a job within 3 months of graduation independent of
---- the citizenship of the student at the Masters level?
model StatisticalAnalysis
39
-- classes
--The servlet class creates instances of the Registration bean, Regression bean
--Correlation bean, hypothesis bean and the chi-square bean when the user requests
--the particular test to be performed or registers.
class servlet
operations
createRegression(r : Regression)
createCorrelation(co: Correlation)
createHypothesis(h : Hypothesis)
createChiSquare(c: Chisquare)
RegisterUser(u: Registration)
end
--The Registration class is an entity bean, which creates the member table
--in the database. When the member registers, the information is sent by the servlet to the
--Registration bean, which adds the record to the database
class Registration
attributes
name : String;
username : String;
password : String;
salary : Integer;
gpa : Real;
degree : String;
citizen : Boolean;
joinin3mths : Boolean;
end
40
class AllRegistrations
operations
addMember(m:Registration);
DeleteMember(m:Registration);
SearchMember(id:String):Set(Registration) =
if memberEntity -> exists(m:Registration|m.username = id)
then memberEntity -> select(m:Registration|m.username = id)
else oclEmpty(Set(Registration))
endif;
modifyMember(id:String, name:String, salary:Integer, gpa: Real): Set(Registration) =
if memberEntity -> exists(m:Registration|m.username = id)
then memberEntity ->select(m:Registration|m.name = name and m.salary =
salary and m.gpa = gpa)
else oclEmpty(Set(Registration))
endif;
verifyIdAndPassword(id:String, psw:String):Boolean =
memberEntity -> exists(m:Registration|m.username = id and m.password = psw);
end
--The Regression class is a session bean, which performs the linear regression test
--calculations. The test compares to see if having a higher GPA results in higher salaries --for the PhD and Masters students
--The x-variable is the Salary and the y-variable is the GPA.
--The formulae used for this test are:
-- Slope, b = SSxy / SSx ; where SSxy = Sum(xy) - [(Sumx)(Sumy)] / n and
--SSx = Sum(x2) -(Sum x)^2 / n
--y-intercept, a = ybar - b * xbar; where xbar= mean of salaries and
41
--ybar = mean of GPA's
-- Standard error of estimate, Se = Square root of [ (SSy - b*SSxy) / n-2]
-- where SSy = Sum(y2) -(Sum y)^2 / n
-- Equation of a line; y = a + b * x ; degrees of freesom = n - 2
-- Multiple R, r = SSxy / SqRoot[SSx * SSy]
-- Coefficient of Determination = r2
class Regression
operations
PerformRtest(u:Registration)
end
--The Hypothesis class is a session bean, which performs the hypothesis test calculations.
--In this test we are testing to see if there is a difference in the average salaries
-- of the Master's student and the PhD students at a 5% level of significance.
-- The test is a t-test for independent samples. The formulae used for this test are:
--t-value = x1bar - x2bar/ s*sqroot( 1/ n1 + 1/n2) where n1 = total number of Masters
students and n2 = total number of PhD students
-- and s = sqroot {[( n1-1)* s12 + (n2-1)* s22] / (n1 + n2 -2)
-- s12 and s22 are the variances of the salaries for the masters and PhD students
--respectively
-- s12 = sqroot{ Sum [(xi - xbar)2] /n-1
-- x1bar and 2bar are the means of salaries for the masters and PhD students respectively
-- Degrees of freedom = n1 + n2 - 2
class Hypothesis
operations
PerformHtest(u:Registration)
end
42
--The chisquare class is a session bean, which performs the chi-square test calculations.
--In this test we are testing to see if getting a job within 3 months of graduation is
--independent of the citizenship of the student at the Masters level at a 5% level of
--Significance. The test is a chi-square test of independence. The formulae used for this
--test are:
-- X2 = Sum [(O - E)^2] / E for each cell where E = (row total) * (column total) / sample
--size
--degrees of freesom = (rowtotal -1)(columntotal -1)
class Chisquare
operations
PerformChitest(u:Registration)
end
--The Correlation class is a session bean, which performs the Correlation test
--calculations. The test checks to see if there exists a correlation between grade point
--average of students and the salaries they obtain.
--The x-variable is the Salary and the y-variable is the GPA.
--The formulae used for this test are:
-- Slope, b = SSxy / SSx ; where SSxy = Sum(xy) - [(Sumx)(Sum y)] / n and SSx =
--Sum(x2) -(Sum x)^22 / n
--y-intercept, a = ybar - b * xbar; where xbar= mean of salaries and ybar = mean of
--GPA's
-- Equation of a line; y = a + b * x
-- Coefficient of Correlation, r = SSxy / SqRoot[SSx * SSy]
--Where SSy = Sum(y2) -(Sum y)2 / n, SSx = Sum(x2) -(Sum x)2 / n and SSxy =
Sum(xy) - [(Sumx)(Sum y)] / n
class Correlation
operations
PerformCtest(u:Registration)
43
end
--ASSOCIATIONS
association memberandall between
AllRegistrations[0..*] role membergroup;
Registration[0..*] role memberEntity;
end
association servereg between
servlet[1] role serve
AllRegistrations[0..*] role servereg
end
association servlinear between
servlet[1] role servel
Regression[0..*] role servelin
End
association servechisquare between
servlet[1] role servec
Chisquare[0..*] role servechi
End
association servehypo between
servlet[1] role serveh
Hypothesis[0..*] role servehyp
End
association servecorrel between
servlet[1] role serveco
Correlation [0..*] role servecorr
44
end
association test1 between
Registration[0..*] role testMember;
Regression[0..1] role testPerform;
end
association hypo between
Registration[0..*] role hypMember;
Hypothesis[0..1] role hypPerform;
end
association chi between
Registration[0..*] role chiMember;
Chisquare[0..1] role chiPerform;
end
association cor between
Registration[0..*] role corMember;
Correlation[0..1] role corPerform;
end
-- CONSTRAINTS
constraints
--// Each member login id has to be unique
context Registration
inv uniquemember:
Registration.allInstances -> forAll(m1,m2 | m1 <> m2 implies m1.username <>
m2.username)
--The GPA has to be between 0 and 4
45
inv GpaCheck:
Registration.allInstances->forAll(m| m.gpa >=0 and m.gpa<=4)
--The students should be either masters or PhD
inv mastersOrPhd:
Registration.allInstances->forAll(m| m.degree = 'Masters' or m.degree='Phd')
--The salary of an alumnicannot be null
inv salaryCheck:
Registration.allInstances->forAll(m| m.salary >=0)
--CORRELATION CLASS
context Correlation
inv atleastonememberforCorr:
Correlation.allInstances->forAll(c| c.corMember->size>=1)
inv xynotemptyforCorr:
Correlation.allInstances->forAll(c| c.corMember.gpa->size>=1 and c.corMember.salary>size>=1)
--REGRESSION CLASS
context Regression
inv atleastonememberforRegress:
Regression.allInstances->forAll(r| r.testMember->size>=1)
inv xynotemptyforRegress:
Regression.allInstances->forAll(r| r.testMember.gpa->size>=1 and r.testMember.salary>size>=1)
--HYPOTHESIS CLASS
context Hypothesis
46
inv atleasttwoMembers:
Hypothesis.allInstances->forAll(h| h.hypMember->size>=2)
--check if atleat one masters or one phd
inv checkforatleastoneMasters:
self.hypMember->exists (m:Registration | m.degree = 'Masters')
inv checkforatleastonePhd:
self.hypMember->exists (m:Registration | m.degree = 'Phd')
--CHISQUARE CLASS
context c:Chisquare
inv atleasttwoMembers:
Chisquare.allInstances->forAll(c|c.chiMember->size>=2)
--This constraint has to check for those members who found a job within 3 months of
--graduation and then constrain it so that there is at least one citizen and one international
inv recentgradscitizen:
c.chiMember->exists (m:Registration | m.joinin3mths =true and m.citizen =true)
inv recentgradsnoncitizen:
c.chiMember->exists (m:Registration | m.joinin3mths =true and m.citizen =false)
--Operations
constraints
context AllRegistrations::addMember(m : Registration)
pre a: memberEntity -> excludes(m)
pre b: m.isDefined
post c: memberEntity = memberEntity@pre ->including(m)
post d: memberEntity ->exists (m|m.oclIsNew)
47
context AllRegistrations::DeleteMember(m : Registration)
pre a: memberEntity -> includes(m)
post b: memberEntity = memberEntity@pre ->excluding(m)
context servlet::createRegression(r:Regression)
pre a: servelin->excludes(r)
pre b: r.isDefined
post c: servelin =servelin@pre->including(r)
post d: servelin -> exists(r|r.oclIsNew)
context servlet::RegisterUser(u: Registration)
pre a: u.isDefined()
pre b:servereg.memberEntity->excludes(u)
post c: servereg.memberEntity->includes(u)
post d: servereg.memberEntity->exists (u|u.oclIsNew)
context servlet::createCorrelation(co:Correlation)
pre a: servecorr->excludes(co)
pre b: co.isDefined
post c: servecorr =servecorr@pre->including(co)
post d: servecorr -> exists(co|co.oclIsNew)
context servlet::createHypothesis(h:Hypothesis)
pre a: servehyp->excludes(h)
pre b: h.isDefined
post c: servehyp =servehyp@pre->including(h)
post d: servehyp -> exists(h|h.oclIsNew)
context servlet::createChiSquare(c : Chisquare)
pre a: servechi->excludes(c)
pre b: c.isDefined
48
post c: servechi =servechi@pre->including(c)
post d: servechi -> exists(c|c.oclIsNew)
context Regression::PerformRtest(u : Registration)
pre a: u.isDefined()
pre b : u.testPerform ->isEmpty()
post c: u.testPerform ->notEmpty()
context Correlation::PerformCtest(u:Registration)
pre a: u.isDefined()
pre b : u.corPerform ->isEmpty()
post c: u.corPerform ->notEmpty()
context Hypothesis::PerformHtest(u:Registration)
pre a: u.isDefined()
pre b : u.hypPerform ->isEmpty()
post c: u.hypPerform ->notEmpty()
context Chisquare::PerformChitest(u:Registration)
pre a: u.isDefined()
pre b : u.chiPerform ->isEmpty()
post c: u.chiPerform ->notEmpty()
49
CHAPTER 4 – COMPONENT DESIGN
Overview of the system:
The objective of the project is to develop a website for registered members to perform
different statistical analysis on the member data. The tests being conducted are, the
regression analysis, the chi-square test, the correlation test and the hypothesis test.
The system is so designed that each test is an enterprise java bean. Thus there are four
session beans namely, LinearRegressionBean, HypothesisBean, CorrelationBean,
ChisquareBean. There is one entity bean, RegistrationBean that creates a table in the
database called “RegistrationBeantable” on deployment of the system. The system has
one servlet and uses java applets to output graphs.
The functions of each of these are explained below.
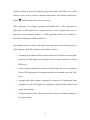
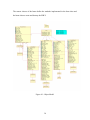
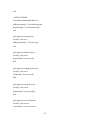
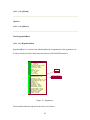
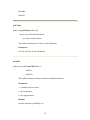
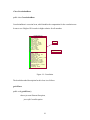
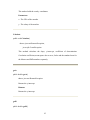
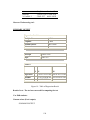
Class RunRegressionServlet
RunRegressionServlet is a servlet, which creates instances of all the session beans and the
entity bean whenever the user selects a research question.
The servlet basically facilitates
•
User Registration
•
User Login
•
Linear Regression Calculation
•
Correlation Calculation
•
Chi-Square Calculation
•
Hypothesis Calculation
50
The servlet also includes some helper functions for displaying the output to the web.
Servlet
CreateRegression() : double
CreateCorrelation() : double
CreateHypothesis() : double
CreateChiSquare() : double
RegisterUser() : double
RegistrationBean
ChisquareBean
LinearRegressionBean
CorrelationBean
HypothesisBean
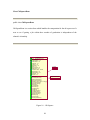
Figure 11 Servlet interaction
The detailed method description for this class is as follows:
init
public void init(ServletConfig config)
throws ServletException
This method will be called by the Servlet container to initialize\ the servlet.
This method created a new context for the session.
Parameters:
config - - the ServletConfig object that contains configuration information for this
servlet
Throws:
ServletException - if an exception occurs that interrupts the servlet's operation
51
service
public void service(HttpServletRequest request,
HttpServletResponse response)
throws java.io.IOException
This method will be called by the Servlet container when this servlet is being
placed into service.
Parameters:
request - the HttpServletRequest object
response - the HttpServletResponse object
Throws:
java.io.IOException - if an IO exception occurs servlet's operation is interrupted
addLine
public static void addLine(java.lang.String message,
java.io.PrintWriter out)
throws java.io.IOException
This method adds a line of HTML output to the page
Parameters:
message - HTML line to be added.
out - PrintWriter object
52
makeSalaryString
public java.lang.String makeSalaryString(double[] x,
int n)
This method collects the salaries of members in an array
Parameters:
x - Array for salary
n - number of items in the array
Returns:
A string of salaries
makeGPAString
public java.lang.String makeGPAString(double[] x,
int n)
This method collects the GPA's of members in an array
Parameters:
x - array for GPA
n - number of items in the array
Returns:
a string of members's GPA
registerUser
public void registerUser(java.io.PrintWriter out,
53
HttpServletRequest request,
HttpServletResponse response)
throws java.io.IOException
This method registers new members
Parameters:
out - PrintWriter object.
request - the request object for the Servlet.
response - the response object for the Servlet.
Throws:
java.io.IOException - the servlet is interrupted is IOException occurs.
CheckLogin
public void CheckLogin(java.io.PrintWriter out,
HttpServletRequest request,
HttpServletResponse response)
throws java.io.IOException
This method does the validation check on members to see if it already exists in
the database
Parameters:
out - PrintWriter object.
request - the request parameter for the servlet.
response - the response parameter for the servlet.
Throws:
54
java.io.IOException - the servlet is interrupted is IOException occurs.
calculateCorrelation
public void calculateCorrelation(java.io.PrintWriter out)
throws java.io.IOException
This method gets the results of correlation calculation and displays it to web page.
Parameters:
out - PrintWriter object.
Throws:
java.io.IOException - the servlet is interrupted is IOException occurs.
roundDouble
public double roundDouble(double d)
This method rounds double input to 4 decimal places
Parameters:
d - double value to be rounded
Returns:
double value after rounding to 4 decimal places.
roundDouble2
public double roundDouble2(double d)
This method rounds double input to 2 decimal places
55
Parameters:
d - double value to be rounded
Returns:
double value after rounding to 2 decimal places.
calculateRegression
public void calculateRegression(java.io.PrintWriter out)
throws java.io.IOException
This method get the result for linear regression calculation from the session bean
and displays to the webpage.
Parameters:
out - PrintWriter object.
Throws:
java.io.IOException - the servlet is interrupted is IOException occurs.
calculateHypothesis
public void calculateHypothesis(java.io.PrintWriter out)
throws java.io.IOException
This method get the result for linear regression calculation from the session bean
and displays to the webpage.
Parameters:
out - PrintWriter object.
56
Throws:
java.io.IOException - the servlet is interrupted is IOException occurs.
calculateChiSquare
public void calculateChiSquare(java.io.PrintWriter out)
throws java.io.IOException
This method get the result for Chi-Square calculation from the session bean and
displays to the webpage.
Parameters:
out - PrintWriter object.
Throws:
java.io.IOException - the servlet is interrupted is IOException occurs.
setChiSquareTable
public void setChiSquareTable(java.io.PrintWriter out,
int yesObsCitizen,
int noObsCitizen,
int degrees,
int yesObsInt,
int noObsInt,
int totalCitizen,
int totalInt,
57
int totalYesCitInt,
int totalNoCitInt,
int yesExpCitizen,
int noExpCitizen,
int noExpInt,
int yesExpInt,
double chiSquareValue)
This method creates the Chi-Square XML tree and then uses XSL to display it to
the web.
Parameters:
out - PrintWriter object.
yesObsCitizen - total number of citizens who joined a job within 3 months
(observed)
noObsCitizen - total number of citizens who did not join a job within 3 months
(observed)
degrees - Degrees of freedom
yesObsInt - total number of internationals who joined a job within 3 months
(observed)
noObsInt - total number of internationals who did not join a job within 3 months
(observed)
totalCitizen - total number of citizens
totalInt - total number of internationals
totalYesCitInt - total number of citizens and internationals who joined a job in 3
58
totalNoCitInt - total number of citizens and internationals who did not join a job
in 3 months.
yesExpCitizen - total number of citizens who joined a job within 3 months
(expected)
noExpCitizen - total number of citizens who did not join a job within 3 months
(expected)
noExpInt - total number of internationals who did not join a job within 3 months
(expected)
yesExpInt - total number of internationals who joined a job within 3 months
(expected)
setHypothesisTable
public void setHypothesisTable(java.io.PrintWriter out,
double meanMS,
double meanPHD,
double varianceMS,
double variancePHD,
int nMS,
int nPHD,
int degrees,
double tValue,
double CDF)
59
This method creates the Hypothesis XML tree and then uses XSL to display it to
the web.
Parameters:
out - PrintWriter object.
meanMS - means of salries of all MS members.
meanPHD - means of salaries of all PhD members.
varianceMS - variance for MS.
variancePHD - variance for PHD.
nMS - number of MS.
nPHD - number of PHD.
degrees - Degrees of freedom.
tValue - the t - Value
CDF - the CDF value.
setExtraRegressionTable
public void setExtraRegressionTable(java.io.PrintWriter out,
double correlation,
double determine,
double stderror,
int size,
double ssError,
double ssRegress,
double msError,
60
double msRegress,
double ssTotal,
double slope,
double intercept)
This method creates the Regression XML tree and then uses XSL to display it to
the web.
Parameters:
out - PrintWriter object.
correlation - coefficient of correlation
determine - coefficient of determination
stderror - Standard Error.
size - number of MS/PHD members
ssError - Sum of Squares for error
ssRegress - Sum of Squares for regression
msError - Mean Squares for error
msRegress - Mean Squares for regression
ssTotal - Sum of Squares total.
slope - slope for the best fit line
intercept - intercept for the best fit line
setTitle
public java.lang.String setTitle(java.io.PrintWriter out,
java.lang.String title)
61
This method prints the title for the results page for all the tests
Parameters:
out - PrintWriter object
title - The title for the page
setFooter
public void setFooter(java.io.PrintWriter out)
This method prints the footer for the results page for all the tests
Parameters:
out - PrintWriter object
embedApplet
public java.lang.String embedApplet(java.lang.String appletName,
java.lang.String param1,
java.lang.String param2,
java.lang.String type)
This method returns a string containing the EMBED tag for the applet the Java
version is set to 1.4,
Parameters:
appletName - the applet name to display
param1 - the X-axis value (gpa)
param2 - the Y-axis value (salary)
62
type - the type (correlation, regression or scatterplot)
destroy
public void destroy()
The Servlet Container will call this method when this servlet is being taken out of
service
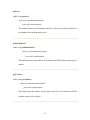
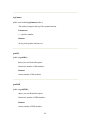
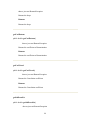
Class RegistrationBean
public abstract class RegistrationBean
RegistrationBean is an abstract base class for accessing the database. The
RegistrationBean allows through home interface access to the database and the allows
manipulation of the data.
63
RegistrationRemote
name : String
Loginid : String
Gpa : double
Salary : double
passwd : String
Degree : Boolean
Citizen : Boolean
joinIn3Mths : Boolean
LinearRegression Bean
Hypothesis Bean
Correlation Bean
getAllUsers() : void
getLoginId() : String
getGpa() : Double
getSalary() : Double
getPassword() : String
getDegree() : Char
getCitizenship() : Boolean
getJoinIn3Mths() : Boolean
FindAll() : Collection
FindUser(String LiD, String Pwd) : Collection)
Chi Square Bean
RegistrationHome
RegistrationBean
Figure 12 - Registration
The detailed method description for this class is as follows:
getLoginId
public abstract java.lang.String getLoginId()
getName
public abstract java.lang.String getName()
getPassword
public abstract java.lang.String getPassword()
64
getSalary
public abstract double getSalary()
getGpa
public abstract double getGpa()
getDegree
public abstract char getDegree()
getCitizen
public abstract boolean getCitizen()
getJoinIn3Mths
public abstract boolean getJoinIn3Mths()
setLoginId
public abstract void setLoginId(java.lang.String LId)
65
setPassword
public abstract void setPassword(java.lang.String Passwd)
setName
public abstract void setName(java.lang.String name)
setSalary
public abstract void setSalary(double salary)
setGpa
public abstract void setGpa(double gpa)
setDegree
public abstract void setDegree(char degree)
setCitizen
public abstract void setCitizen(boolean citizen)
setJoinIn3Mths
public abstract void setJoinIn3Mths(boolean join)
66
ejbCreate
public java.lang.String ejbCreate(java.lang.String LId,
java.lang.String Passwd,
java.lang.String name,
double gpa,
double salary,
char degree,
boolean citizen,
boolean join)
throws javax.ejb.CreateException
This method created the user and sets the values for all the fields.
Parameters:
LId - login id for the user.
Passwd - password for the user.
name - full name of the user.
gpa - final cumulative gpa for the user.
salary - current salary for the user
degree - degree for the user (MS or PHD)
join - Yes if he joined a job in 3 months after graduation;otherwise No
67
ejbPostCreate
public void ejbPostCreate(java.lang.String LId,
java.lang.String Passwd,
java.lang.String Name,
double salary,
double gpa,
char degree,
boolean citizen,
boolean join)
throws javax.ejb.CreateException
setEntityContext
public void setEntityContext(EntityContext ctx)
unsetEntityContext
public void unsetEntityContext()
ejbRemove
public void ejbRemove()
ejbLoad
public void ejbLoad()
68
ejbStore
public void ejbStore()
ejbPassivate
public void ejbPassivate()
ejbActivate
public void ejbActivate()
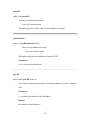
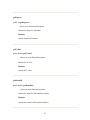
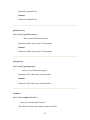
Class LinearRegressionBean
public class LinearRegressionBean
LinearRegressionBean is a session bean which handles the computation for the
correlation test. It tests to see if higher GPA results in higher salaries for the Masters or
the PhD students.
69
RegressionRemote
getA() : double
getB() : double
addXY(double x, double y) : void
getAllUsers() : void
getCoefDeterm() : double
getCoefCorrel() : double
started() : void
getStdErrorEst() : double
estimateY(double x) : double
haveData() : integer
items() : integer
startMSAnalysis() : void
getPhDGpaArray() : double[]
startPhDAnalysis() : void
getPhDSalaryArray() : double[]
getMSError() : double
getSSError() : double[]
getSalaryAndGpa() : void
getFValue() : double
getSSTotal() : double
getSSRegress() : double[]
getMSRegress() : double[]
getMSSalaryArray() : double[]
getMSGpaArray() : double[]
itemsMS() : int
itemsPhD() : int
calculate() : void
Servlet
RegistrationBean
Figure 13 - Regression
The detailed method description for this class is as follows:
addUser
public boolean addUser(java.lang.String LoginId,
java.lang.String Passwd,
java.lang.String name,
double salary,
double gpa,
char degree,
boolean citizen,
boolean join)
70
throws java.rmi.RemoteException,
javax.ejb.CreateException
This method adds a new member to the database
Parameters:
LoginId - The username with which the member logs in to do the analysis
Passwd - The password used by the member to log in
name - The member's name
salary - The salary of the member
gpa - The GPA of the member
degree - The Masters or PhD degree obtained by the member
citizen - The citizenship of the member
salary - The salary of the member
join - The variable indicating if the member joined a job within 3 months of
graduation
findUser
public boolean findUser(java.lang.String loginId,
java.lang.String password)
throws java.rmi.RemoteException,
javax.ejb.CreateException
This method looks up a member in the database given his loginId and password
Parameters:
LoginId - The username with which the member logs in to do the analysis
71
Password - The password used by the member to log in
getAllUsers
public void getAllUsers()
throws java.rmi.RemoteException,
javax.ejb.CreateException
This method gets a collection of all the members in the database from the
Registration bean
getSalaryAndGpa
public void getSalaryAndGpa()
throws java.rmi.RemoteException,
javax.ejb.CreateException
This method gets the salaries and GPA of the Masters and PhD students
separately for analysis
started
public void started()
throws java.rmi.RemoteException,
javax.ejb.CreateException
This method gets all the users from the database and starts the simple linear
regression analysis for the Masters and Phd members
72
startMSAnalysis
public void startMSAnalysis()
throws java.rmi.RemoteException,
javax.ejb.CreateException
Start analysis for MS members
startPHDAnalysis
public void startPHDAnalysis()
throws java.rmi.RemoteException,
javax.ejb.CreateException
Start analysis for PhD members
addXY
public void addXY(double x, double y)
throws java.rmi.RemoteException,
javax.ejb.CreateException
This method adds the x and y coordinates
Parameters:
x - The GPA of the member
y - The salary of the member
73
Calculate
public void Calculate()
throws java.rmi.RemoteException,
javax.ejb.CreateException
This method calculates the slope, y-intercept, coefficient of determination
Correlation coefficient, mean square due to error, fvalue and the standard error for
the Masters and PhD members separately
getMSError
public double getMSError()
throws java.rmi.RemoteException
Returns the mean square due to error
Returns:
Returns the mean square due to error
getMSRegress
public double getMSRegress()
throws java.rmi.RemoteException
Returns the mean square due to regression
Returns:
Returns the mean square due to regression
74
getSSError
public double getSSError()
throws java.rmi.RemoteException
Returns the sum of squares due to error
Returns:
Returns the sum of squares due to error
getSSRegress
public double getSSRegress()
throws java.rmi.RemoteException
Returns the sum of squares due to regression
Returns:
Returns the sum of squares due to regression
getSSTotal
public double getSSTotal()
throws java.rmi.RemoteException
Returns the sum of squares total
Returns:
Returns the sum of squares total
75
getFValue
public double getFValue()
throws java.rmi.RemoteException
Returns the FValue
Returns:
Returns the FValue
getA
public double getA()
throws java.rmi.RemoteException
Returns the y-intercept
Returns:
Returns the y-intercept
getB
public double getB()
throws java.rmi.RemoteException
Returns the slope
Returns:
Returns the slope
76
getCoefDeterm
public double getCoefDeterm()
throws java.rmi.RemoteException
Returns the coefficient of determination
Returns:
Returns the coefficient of determination
getCoefCorrel
public double getCoefCorrel()
throws java.rmi.RemoteException
Returns the Correlation coefficient
Returns:
Returns the Correlation coefficient
getStdErrorEst
public double getStdErrorEst()
throws java.rmi.RemoteException
Returns the standard error
Returns:
Returns the standard error
77
getMSSalaryArray
public double[] getMSSalaryArray()
throws java.rmi.RemoteException
Returns the salary string for Masters
Returns:
Returns the salary string for Masters
getMSGpaArray
public double[] getMSGpaArray()
throws java.rmi.RemoteException
Returns the GPA string for Masters
Returns:
Returns the GPA string for Masters
getPHDSalaryArray
public double[] getPHDSalaryArray()
throws java.rmi.RemoteException
Returns the salary string for PhD
Returns:
Returns the salary string for PhD
78
getPHDGpaArray
public double[] getPHDGpaArray()
throws java.rmi.RemoteException
Returns the GPA string for Masters
Returns:
Returns the GPA string for Masters
estimateY
public double estimateY(double x)
throws java.rmi.RemoteException
This method calculates the equation of the best fit line
Parameters:
x - The x-coordinate i.e the GPA
Returns:
Returns (a + b * x), the equation of line
haveData
public int haveData()
throws java.rmi.RemoteException,
javax.ejb.CreateException
This method checks to see if we have enough data to do the test as we require at
least 3 points to calculate standard error of estimate
79
Returns:
number of points
items
public int items()
throws java.rmi.RemoteException,
javax.ejb.CreateException
Returns the number of members
Returns:
Returns the number of members
itemsMS
public int itemsMS()
throws java.rmi.RemoteException,
javax.ejb.CreateException
Returns the number of MS members
Returns:
Returns the number of MS members
itemsPHD
public int itemsPHD()
throws java.rmi.RemoteException,
80
javax.ejb.CreateException
Returns the number of PhD members
Returns:
Returns the number of PhD members
ejbCreate
public void ejbCreate()
setSessionContext
public void setSessionContext(javax.ejb.SessionContext ctx)
ejbRemove
public void ejbRemove()
ejbActivate
public void ejbActivate()
ejbPassivate
public void ejbPassivate()
ejbLoad
81
public void ejbLoad()
ejbStore
public void ejbStore()
Class HypothesisBean
public class HypothesisBean
HypothesisBean is a session bean which handles the computation for the hypothesis test.
It tests to check the relation between mean salaries of MS and PHD members
HypothesisRemote
home : RegistrationHome
Coll : Collection
nMS, nPhD : int
meanMS, meanPhD : double
VarianceMS : double
VariancePhD : double
degrees : int
pooledSD : double
tValue : double
CDF : double
pValue : double
getUsers() : void
getMeanSalaries() : void
getVariance() : void
getDistribution(double t)() : void
getPValue(double cdf)() : void
getnMS() : int
getnPhD() : int
getDegrees() : int
getPValue() : double
getMeanMS() : double
getMeanPhD() : double
getVarianceMS() : double
getVariancePhd() : double
getpooledSd() : double
getTValue() : double
getCDF() : double
Servlet
RegistrationBean
Figure 13 - Hypotheses
The detailed method description for this class is as follows:
82
getUsers
public void getUsers()
throws java.rmi.RemoteException,
javax.ejb.CreateException
This method connects to the database and gets a collection of all the members in
the database from the Registration bean
getMeanSalaries
public void getMeanSalaries()
throws java.rmi.RemoteException,
javax.ejb.CreateException
This method gets the mean salaries of the Masters and PhD students separately for
analysis.
getVariance
public void getVariance()
throws java.rmi.RemoteException,
javax.ejb.CreateException
This method gets the variance for the salaries and GPA of the Masters and PhD
students separately for analysis.
83
getSandT
public void getSandT()
throws java.rmi.RemoteException,
javax.ejb.CreateException
This method gets the S and T values for the members for analysis.
getDistribution
public void getDistribution(double t)
throws java.rmi.RemoteException,
javax.ejb.CreateException
This method calculates the distribution in terms of CDF
Parameters:
t - the t value for the distribution
getCDF
public double getCDF(double x)
This method computes the cumulative distribution function in terms of the beta
CDF.
Parameters:
x - a number in the domain of the distribution
Returns:
the cumulative distribution at x
84
See Also:
betaCDF
getPValue
public void getPValue(double cdf)
throws java.rmi.RemoteException,
javax.ejb.CreateException
This method calculates the P value for the distribution
Parameters:
cdf - the cdf value for the distribution
betaCDF
public static double betaCDF(double x,
double a,
double b)
The method computes the beta cumulative distribution function.
Parameters:
x - a number between 0 and 1
a - the left paramter
b - the right parameter
Returns:
the beta cumulative probability at x
85
logGamma
public static double logGamma(double x)
This method computes the log of the gamma function.
Parameters:
x - a positive number
Returns:
the log of the gamma function at x
getnMS
public int getnMS()
throws java.rmi.RemoteException
Returns the number of MS members
Returns:
returns number of MS members
getnPHD
public int getnPHD()
throws java.rmi.RemoteException
Returns the number of PHD members
Returns:
returns number of PHD members
86
getDegrees
public int getDegrees()
throws java.rmi.RemoteException
Returns the degrees of freedom
Returns:
returns degrees of freedom
getPValue
public double getPValue()
throws java.rmi.RemoteException
Returns the P value
Returns:
returns the P value
getMeanMS
public double getMeanMS()
throws java.rmi.RemoteException
Returns the mean for MS members salaries
Returns:
returns the mean for MS members salaries
87
getMeanPHD
public double getMeanPHD()
throws java.rmi.RemoteException
Returns the mean for PHDmembers salaries
Returns:
returns the mean for PHD members salaries
getVarianceMS
public double getVarianceMS()
throws java.rmi.RemoteException
Returns the variance for MS members salaries
Returns:
returns the variance for MS members salaries
getVariancePHD
public double getVariancePHD()
throws java.rmi.RemoteException
Returns the variance for PHD members salaries
Returns:
returns the variance for PHD members salaries
88
getPooledSD
public double getPooledSD()
throws java.rmi.RemoteException
Returns the pooled standard deviation
Returns:
returns the pooled standard deviation
getTValue
public double getTValue()
throws java.rmi.RemoteException
Returns the t-Value
Returns:
returns the t-Value
getCDF
public double getCDF()
throws java.rmi.RemoteException
Returns the CDF
Returns:
returns the CDF
89
ejbCreate
public void ejbCreate()
setSessionContext
public void setSessionContext(javax.ejb.SessionContext ctx)
ejbRemove
public void ejbRemove()
ejbActivate
public void ejbActivate()
ejbPassivate
public void ejbPassivate()
ejbLoad
public void ejbLoad()
ejbStore
public void ejbStore()
90
Class CorrelationBean
public class CorrelationBean
CorrelationBean is a session bean, which handles the computation for the correlation test.
It tests to see if higher GPA results in higher salaries for all members
CorrelationRemote
home : RegistrationHome
coll : Collection
Salary[] : double
gpa[] : double
memberSize : int
sumX, sumY : double
sumXsquared : double
sumYsquared : double
sumXY : double
a, b : double
coefD : double
coefC : double
StdError : double
Servlet
RegistrationBean
getA() : double
getB() : double
getSalaryAndGpa() : void
getAllUsers() : void
started() : void
addXY(double x, double y) : void
Calculate() : void
getCoeffCorrel() : double
getStdErrorEst() : double
getSalaryArray() : double[]
getGpaArray() : double[]
estimateY(double x) : double
haveData() : int
members() : double
Figure 14 - Correlation
The detailed method description for this class is as follows:
getAllUsers
public void getAllUsers()
throws java.rmi.RemoteException,
javax.ejb.CreateException
91
This method connects to the database and gets a collection of all the members in
the database from the Registration bean
getSalaryAndGpa
public void getSalaryAndGpa()
throws java.rmi.RemoteException,
javax.ejb.CreateException
This method gets the salaries and GPA of the Masters and PhD students
separately for analysis.
started
public void started()
throws java.rmi.RemoteException,
javax.ejb.CreateException
This method gets all the users from the database and starts the simple linear
regression analysis for the Masters and Phd members
addXY
public void addXY(double x,
double y)
throws java.rmi.RemoteException,
javax.ejb.CreateException
92
This method adds the x and y coordinates
Parameters:
x - The GPA of the member
y - The salary of the member
Calculate
public void Calculate()
throws java.rmi.RemoteException,
javax.ejb.CreateException
This method calculates the slope, y-intercept, coefficient of determination
Correlation coefficient, mean square due to error, fvalue and the standard error for
the Masters and PhD members separately
getA
public double getA()
throws java.rmi.RemoteException
Returns the y-intercept
Returns:
Returns the y-intercept
getB
public double getB()
93
throws java.rmi.RemoteException
Returns the slope
Returns:
Returns the slope
getCoefDeterm
public double getCoefDeterm()
throws java.rmi.RemoteException
Returns the coefficient of determination
Returns:
Returns the coefficient of determination
getCoefCorrel
public double getCoefCorrel()
throws java.rmi.RemoteException
Returns the Correlation coefficient
Returns:
Returns the Correlation coefficient
getStdErrorEst
public double getStdErrorEst()
throws java.rmi.RemoteException
94
Returns the standard error
Returns:
Returns the standard error
getSalaryArray
public double[] getSalaryArray()
throws java.rmi.RemoteException
Returns the Salary values array for all members
Returns:
Returns the Salary values array for all members
getGpaArray
public double[] getGpaArray()
throws java.rmi.RemoteException
Returns the GPA values array for all members
Returns:
Returns the GPA values array for all members
estimateY
public double estimateY(double x)
throws java.rmi.RemoteException
This method calculates the equation of the best fit line
95
Parameters:
x - The x-coordinate i.e the GPA
Returns:
Returns (a + b * x), the equation of line
haveData
public int haveData()
throws java.rmi.RemoteException,
javax.ejb.CreateException
This method checks to see if we have enough data to do the test as we require at
least 3 points to calculate standard error of estimate
Returns:
number of points
members
public int members()
throws java.rmi.RemoteException, javax.ejb.CreateException
Returns the number of members
Returns:
Returns the number of members
ejbCreate
96
public void ejbCreate()
setSessionContext
public void setSessionContext(javax.ejb.SessionContext ctx)
ejbRemove
public void ejbRemove()
ejbActivate
public void ejbActivate()
ejbPassivate
public void ejbPassivate()
ejbLoad
public void ejbLoad()
ejbStore
public void ejbStore()
97
Class ChiSquareBean
public class ChiSquareBean
ChiSquareBean is a session bean which handles the computation for the chi square test. It
tests to see if getting a job within three months of graduation is independent of the
alumni's citizenship
ChiRemote
home : RegistrationHome
coll : Collection
yesObsCitizen : int
noObsCitizen : int
yesObsInt : int
noObsInt : int
totalCitizen : int
totalInt : int
totalYesCitInt : int
totalNoCitInt : int
chiSquareValue : double
noExpCitizen : int
yesExpCitizen : int
yesExpInt : int
noExpInt : int
Servlet
getUsers()
startChiSquareTest()
getObservedValues()
getExpectedValues()
getDifferences(int obs, int exp)()
getYesObsCitizen()
getNoObsCitizen()
getDegrees()
getYesObsInt()
getNoObsInt()
getTotalCitizen()
getTotalInt()
getTotalYesCitInt()
getTotalNoCitInt()
getYesExpCitizen()
getNoExpCitizen()
getNoExpInt()
getYesExpInt()
getChiSquareValue()
RegistrationBean
Figure 16 - Chi-Square
98
The detailed method description for this class is as follows:
getUsers
public java.util.Collection getUsers()
throws java.rmi.RemoteException,
javax.ejb.CreateException
This method gets a collection of all the members in the database from the
Registration bean
Returns:
A collection of all the users
startChiSquareTest
public void startChiSquareTest()
throws java.rmi.RemoteException,
javax.ejb.CreateException
This method initializes all the attribute variables for Chi Square class
getObservedValues
public void getObservedValues()
throws java.rmi.RemoteException,
javax.ejb.CreateException
Getting the Observed Values for Chi-Square test
99
getExpectedValues
public void getExpectedValues()
throws java.rmi.RemoteException,
javax.ejb.CreateException
Getting the expected values and chi square value for the table of citizens and
international students.
getDifferences
public double getDifferences(int obs,
int exp)
throws java.rmi.RemoteException
Get the difference of values between the observed and expected value ((OE)^2/E)
Parameters:
obs - observed value exp expected value
Returns:
returns difference in the two values
getYesObsCitizen
public int getYesObsCitizen()
throws java.rmi.RemoteException
100
This method gets the observed number of citizens among the alumni
Returns:
Number of observed citizens
getNoObsCitizen
public int getNoObsCitizen()
throws java.rmi.RemoteException
This method gets the observed number of non citizens among the alumni
Returns:
Number of observed non citizens
getDegrees
public int getDegrees()
throws java.rmi.RemoteException
This method gets the degrees of freedom
Returns:
1 as the degrees of freedom for a 2 x 2 table is 1
getYesObsInt
public int getYesObsInt()
throws java.rmi.RemoteException
101
This method gets the observed number of alumni who have got jobs within three
months of graduation
Returns:
Number of alumni with jobs within 3 months of graduation
getNoObsInt
public int getNoObsInt()
throws java.rmi.RemoteException
This method gets the observed number of alumni who did not get jobs within
three months of graduation
Returns:
Number of alumni without jobs within 3 months of graduation
getTotalCitizen
public int getTotalCitizen()
throws java.rmi.RemoteException
This method gets the total number of citizens among the alumni
Returns:
Number of citizens
getTotalInt
public int getTotalInt() throws java.rmi.RemoteException
102
This method gets the total number of alumni
Returns:
number of alumni
getTotalYesCitInt
public int getTotalYesCitInt()
throws java.rmi.RemoteException
This method gets the total number of citizens who got jobs within three months of
graduation
Returns:
Number of citizens with jobs within 3 months of graduation
getTotalNoCitInt
public int getTotalNoCitInt()
throws java.rmi.RemoteException
This method gets the total number of citizens who did not get jobs within three
months of graduation
Returns:
Number of citizens without jobs within 3 months of graduation
getYesExpCitizen
public int getYesExpCitizen()
103
throws java.rmi.RemoteException
This method gets the expected value of citizens who got jobs within three months
of graduation
Returns:
Expected value of citizens with jobs within 3 months of graduation
getNoExpCitizen
public int getNoExpCitizen()
throws java.rmi.RemoteException
This method gets the expected value of citizens who did not get jobs within three
months of graduation
Returns:
Expected value of citizens without jobs within 3 months of graduation
getNoExpInt
public int getNoExpInt()
throws java.rmi.RemoteException
This method gets the expected value of alumni who did not get jobs within three
months of graduation
Returns:
Expected value of alumni without jobs within 3 months of graduation
104
getYesExpInt
public int getYesExpInt()
throws java.rmi.RemoteException
This method gets the expected value of alumni who got jobs within three months
of graduation
Returns:
Expected value of alumni with jobs within 3 months of graduation
getChiSquareValue
public double getChiSquareValue()
throws java.rmi.RemoteException
This method gets the critical chisuare value for the test
Returns:
chi sqaure value
ejbCreate
public void ejbCreate()
setSessionContext
public void setSessionContext(javax.ejb.SessionContext ctx)
105
ejbRemove
public void ejbRemove()
ejbActivate
public void ejbActivate()
ejbPassivate
public void ejbPassivate()
ejbLoad
public void ejbLoad()
ejbStore
public void ejbStore()
106
CHAPTER 5 – SOFTWARE QUALITY ASSURANCE
Purpose
Software Quality Assurance Plan (SQAP) consists of those procedures, techniques and
tools used to ensure that a product meets the requirements specified in the software
requirements specification.
This document describes the SQA plan for the Statistical Analysis Tool in partial
fulfillment of the requirements of the MSE project. The tool essentially performs four
kinds of statistical analyses. They are Simple Linear regression, correlation, hypothesis
test and Chi square test.
The scope of this document is to describe all the software processes and documents used
for the quality assurance of the statistical analysis tool. This plan
•
identifies the responsibilities of the project developer,
•
lists the activities, processes and work products that will be reviewed and audited
•
Identifies the work products.
The portions of software life cycle covered by this plan are:
·
Software requirements specification
·
System architecture design
·
System detailed design
·
Encoding
·
Testing and Integration
·
Users Manual
107
Software quality assurance will be implemented throughout the entire life cycle of the
tool’s development, until the release of the software product.
Reference documents
IEEE guide for software quality assurance planning -730.1-1995
Lecture notes, CIS 748 Software Management, Dr. Scott Deloach, Spring 2002
Pressman, Roger S. "Software Engineering: A Practitioner's Approach". Fifth Edition,
Mc GrawHill, NY, June, 2001.
Management
Organization
The statistical tool is an individual project and hence there is only one member
involved. The project has to be supervised by a graduate committee. The committee
consists of :
· Major Professor: Dr. Daniel Andresen
· Committee:
Dr. William J. Hankley
Dr Scott Deloach
· Developer: Padmaja Havaldar
Tasks
It is the sole responsibility of the developer to review the tool’s efficiency, reliability,
and accuracy. The major professor will conduct inspections and reviews. The graduate
Committee will also review the documents of each phase before every presentation.
108
Responsibilities
Developer
The responsibilities of the developer include
·
Developing all the necessary documents involved in the software life cycle.
This includes developing the software requirement specification, the SQA plan
and cost estimation of the project.
·
Developing the design plan of the project.
·
Implementing and testing the statistical analysis tool.
·
Presenting the documents at the end of each phase to the major professor and
the committee for review.
Committee
The responsibilities of the committee include
· Timely review of the student’s work and progress in the project
· Giving feedback and suggestions to guide the developer
Documentation
The essential documents required are described below.
Minimum documentation requirements
Software requirements specification:
109
The SRS lists the requirements of a system and it should correctly describe the system
requirements. It specifies the functionality and performance of the project in terms of
speed, reliability etc. It describes how the system interacts with the people using and also
specifies the design constraints and standards to be followed.
Software verification & validation plan
The purpose of this document will be to develop and record formal procedures for the
verification and validation of the statistical analysis tool.
Formal Specification Document
A section of the tool’s design will be formally specified using Alloy or OCL.
Software architecture (design) document
This document describes the overall structure of the statistical analysis tool. An object
model will be constructed using rational rose, which will describe the various classes
used in the project. It will also consist of an interaction diagram depicting the key
interactions of the software.
Engineering Notebook
The engineering book consists of
·
Gantt chart of the Project Plan
·
Cost Estimation using the COCOMO model and the function point analysis
·
Time Log
110
User Documentation
The user documentation will consist of:
·
User manual, which will identify all error messages and program limitations
along with their corrective measures.
·
Installation guide
·
Source code and testing code along with any other files used
The following documents will be provided at the end of each phase by the
Developer
Phase I: Software Requirement
·
Project Overview
·
Software Requirements Specification
·
Gantt chart of Project plan
·
Cost Estimate
·
Prototype of the tool
·
Software quality assurance plan
Phase II: Software Design
·
Formal Requirement Specification
·
Architecture design
111
·
Test plan
·
Implementation plan
Phase III: Software Implementation
·
User Manual
·
Testing Evaluation
·
Project Evaluation
·
References
·
Source Code
Standards, practices, conventions & metrics
The MSE project portfolio will serve as a guideline in developing the documents.
Documentation Standards
The IEEE software engineering standards were observed in designing the software
requirements specification (SRS) and the software quality assurance plan (SQAP)
Coding Standards
The source code will follow the guidelines in the Java coding standards.
Metrics
112
Function point analysis and Source lines of code will be a measure of the size of the tool.
The COCOMO model will be a measure of the programmer month and the total
development time of the statistical analysis tool
Reviews and audits
Quality Assurance for this project will include at least one review of all current work in
each stage of development of Requirement, Design, and Implementation. There will be
timely reviews by the major advisor of the current work. There will be three formal
presentations held at the end of each phase of requirement, design and implementation.
The committee will provide a review after every presentation.
Test
A software test plan will be developed which will outline the test activities required for
testing. Test results will be documented and they will be sufficient to demonstrate that the
software requirements have been met.
Problem reporting and corrective action
The committee will provide reviews on all current work and corrective measures for
changes will be taken. The errors and problems encountered during the development of
the project will be documented.
Tools, techniques, and methodologies
·
Oracle Database is used as the database server
113
·
Sun ONE Application Server 7 is used as a J2EE container, which consists of EJB
server and Web Server
·
Rational Rose tool is used for the UML model design
·
USE-2.0.1 is used for the formal OCL specification
Training
The following courses taken by the developer will provide the required training in the
development of the project:
·
CIS540:SoftwareEngineering–I
·
CIS740:SoftwareEngineering–II
·
CIS748:SoftwareManagement
·
CIS 771: Software Specification
The developer also has sufficient knowledge of Statistics.
114
CHAPTER 6 – TEST PLAN
1.
Test Plan Identifier
MSE-Version 1.0
2.
Introduction
This document will describe the test plan for the Statistical Analysis Tool, which is being
developed in partial fulfillment of the requirements of the MSE degree. The purpose of
the document is to draft a test approach for testing the critical aspects of the statistical
analysis tool and the overall strategy to be adopted in the process.
The vision document and the Software Quality Assurance plan will be used as a
reference.
3.
Test Items
The items to be tested for the Statistical Analysis Tool (SAT) are:
1.
2.
Statistical Analysis Tool Application
The critical requirements specified in the Software Requirements Specification
Sections 3.3, 3.4 and 3.5.
4.
Features to be tested
The following features of the SAT will be tested:
1. The login, Registration and test analysis features which are described in detail in
Sections 3.3.1, 3.3.2 and 3.3.3 of the SRS. Also the features described in sections 3.4
and 3.5
2. The Statistical Analysis Tool program structure
115
3. The functionalities of the session beans and the entity bean which perform the tests
and the registration.
5.
Features not to be tested
Not Applicable as all features will be tested
6.
Test Cases
6.1
Login:
•
If the member enters incorrect input like empty or wrong user name and/or
empty or wrong password, the member should be denied access and be
prompted to enter the correct input.
•
If the member enters correct input, then the member should be given access
and taken to the next page.
6.2
Registration:
•
Register new member
•
If the member enters empty or wrong input in the required fields, the
member should not be allowed to register and a message prompting him to
enter correct input should be displayed.
•
If the member fills in all the fields correctly, he/she should be registered as
a new member and the record should be saved in the database.
•
If the member fills in all the fields correctly, he/she should be allowed to
update data and the record should be saved in the database.
116
6. 3 Analysis performance:
•
The member should be able to select a research question from a menu of the four
analysis tests. The selection should result in another page with the results of the
test in the form of a graph or table.
6.4 Performance Requirements:
•
All other performance requirements will be tested to see if they actually
comply with their requirements described in section 3.5 of the SRS.
7.
Item Pass/Fail Criteria
The testing of SAT will be considered accomplished when all the tests of the mentioned
features have been successfully completed.
8.
Suspension and Resumption Criteria
8.1 Suspension Criteria: If any of the tests selected by the member do not give the
expected result, then the testing will be suspended until the bug is fixed
8.2 Resumption Criteria: Testing will be done again to ensure that the bug has been
fixed and the selected tests give the expected results. Only then will the testing be
resumed.
9.
Deliverables
The following artifacts will be delivered in the testing process:
1.
Test plan
2.
Test cases
117
3.
Test log
10. Responsibilities
Since there is only one person developing the SAT, the developer is responsible for all
the testing activities to be carried out.
118
CHAPTER 7 – ASSESSMENT EVALUATION
Testing
In order to test whether all the analysis tests gives the right results, a table of know values
was inputted into the database. Now the known results were compared with the expected
results from the statistical analysis tool for validity. The results were also checked with
the excel output for the same data. The project was also tested for performance using the
tool JMeter. JMeter is a subproject of Jakarta and is a Java based tool for load testing
client-server applications. The results obtained from this tool are also documented in this
document.
Given below is the table of known data that was entered into the database.
Name
Padmaja
Kathy Zarka
Lora Boyer
Toni Ferns
Sada Bugs
Sharath mada
Rekha joshi
Leena joshi
Mad max
Saba alvi
Login
Padma
kathy
lora
toni
sada
sharath
rekha
leena
mad
saba
Password
pad
kath
lor
ton
sad
shar
rekh
leen
max
sab
Degree
MS
PhD
MS
Phd
MS
MS
Ms
Phd
Ms
Phd
Salary
56432
78654
65432
87654
65743
78654
60000
80000
40000
90000
GPA
3.5
3.7
3.4
3.9
3.6
3.4
3.4
3.8
3.2
4.0
Citizen
No
Yes
Yes
No
No
Yes
Yes
No
No
Yes
JoinIn3Mths
No
Yes
No
Yes
No
Yes
No
yes
No
yes
Figure 16 - Table of Test data
Test cases.
The tool requires members to register before they can do the analysis. There is a
membership form provided on the website which enables the alumni to register. The
test cases used for this form are given in table 18. The table also includes test cases to
check the functionality of the analysis tests in the statistical analysis tool.
119
Test Unit
Test Case
Result
Login
Empty login name
Prompts the member to enter valid login
name
Message: Please enter a valid login name
Password
Prompts the member to enter valid
password
Empty password
Message: Please enter a valid password
Name
Empty Name
Prompts the member to enter valid name
Message: Please enter a valid name
Salary
Prompts the member to enter a salary
value
Empty salary
Non-numeric salary value
Prompts the member to enter a numeric
salary value
Non-positive salary value
Prompts the member to enter a positive
salary value
Message: Please enter a positive numeric
value
Gpa
Empty Gpa
Prompts the member to enter value
Non-numeric Gpa value
Prompts the member to enter a numeric
Gpa value
Gpa >4 or <= 0
Prompts the member to enter a value
between 0 to 4
Message: Please enter a number between
0 and 4
Regression
Bean
Correct data in each field
The member will be taken to the main
page to log in after he enters all correct
values. Once the member successfully
logs for statistical analysis, he is directed
to the questions page where he can begin
the analysis
Less than 3 members
Message: Not enough members to
perform the test
No MS members
Message: There are no MS members to
perform the test
No PhD members
Message: There are no PhD members to
perform the test
120
Chi-Square Bean
Message: There are no members currently
in the database who are citizens. Please try
again later to perform the Chi-Square
test.
International Message: There are no members currently
in the database who are citizens. Please try
again later to perform the Chi-Square
test.
No Citizens
No
students
No person with a job in Message: There are no members currently
3 months of graduation in the database who got a job in 3 months
of graduation. Please try again later to
perform the Chi-Square test.
No person without a Message: There are no members currently
job in3 months of in the database who did not get a job in 3
graduation
months of graduation. Please try again
later to perform the Chi-Square test.
Hypothesis Bean
There are no MS members currently in the
database to perform the Hypothesis test.
Please try again later.
There are no PhD members currently in
the database to perform the Hypothesis
test. Please try again later.
There are no members currently in the
database to per form this test.
No MS alumni
No PhD alumni
Correlation
No members
Figure 17 - Table of Test cases
Since the tool performs statistical analysis, the results obtained using it were compared
with the results obtained using Microsoft Excel, which is known to give reliable and
accurate results. The same data set, shown in Table 17 was used in both cases.
The results obtained for the four tests are summarized below.
1. Hypothesis test:
Known values (Excel output):
t-Test: Two-Sample
Variances
Assuming
Equal
Variable 1
121
Variable 2
Mean
Variance
Observations
Pooled Variance
Hypothesized Mean Difference
df
t Stat
61043.5
84077
163331531.9 31302572
6
4
113820671.9
0
8
-3.344683159
Expected values using tool:
t-Test of Independence for Two Sample Means
Masters
PhD
Mean
61043.5
84077.0
Variance
1.633144339E8
3.131137133E7
Observations
6
4
Hypothesized
Difference
Mean
0
df
8
t Stat
-3.3448
P - one tail
0.0051
Figure 18 - Table of Hypothesis result
Result of test: The tool was successful in computing the test
2. Correlation:
The result for this test is evident in the output graph itself. The graph shows the points
with the members GPA as the independent variable and the Salary as the corresponding
dependent variable. The results were also checked with excel.
Known Values (Excel output):
Correlation Co-efficient = 0.85675
R-square
= 0.73421
122
Observed Values using tool:
Correlation Co-efficient = 0.857
R-square
= 0.734
Result of test: The tool was successful in computing the test
3. Simple Linear Regression
Simple linear regression analysis is performed on the Masters and PhD data separately.
The resultant output was compared with the excel output for known values from table 1.
Mention must be made that the tests were tested using different sets of data. The above
table is one of the data sets. In one of these data sets, there were equal number of
Masters and PhD students, and the results came out right. But when different number of
MS and PhD students were used, the result for PhD did not compare with the excel
output. This error was debugged and the results were comparable. The error was due to
the fact that the loop for the PhD students used MS size instead of PhD!
Known values (Excel output):
For MS students:
SUMMARY
OUTPUT
Regression Statistics
Multiple R
0.55189228
R Square
0.304585088
Observations
6
ANOVA
Regression
Residual
Total
df
1
4
5
SS
248741745.3
567915914.2
816657659.5
123
MS
248741745.3
141978978.5
Coefficients Standard Error
-120263.5283 137064.8226
53065.4717 40091.26078
Intercept
X Variable 1
Observed Values using tool:
SUMMARY OUTPUT
Regression Statistics
Multiple R
0.5519
R Square
0.3046
Standard Error
40091.2608
Observations
6
Intercept
-120263.5283
Slope
53065.4717
ANOVA
df SS
MS
Regression
1
2.487417453113E8 2.487417453113E8
Residual
4
5.679159141887E8 1.419789785472E8
Total
5
8.166576595E8
Figure 19 - Table of Regression Result
Result of test: The tool was successful in computing the test
For PhD students:
Known values (Excel output):
SUMMARYOUTPUT
124
Regression Statistics
Multiple R
R Square
Observations
0.962026626
0.92549523
4
ANOVA
Regression
Residual
Total
df
1
2
3
SS
86911143.2
6996572.8
93907716
MS
86911143.2
3498286.4
Intercept
X Variable 1
Coefficients Standard Error
-76437.2
32217.10066
41692
8364.551871
Observed Values using tool:
SUMMARY OUTPUT
Regression Statistics
Multiple R
0.962
R Square
0.9255
Standard Error
8364.5519
Observations
4
Intercept
-76437.2
Slope
41692.0
ANOVA
df
SS
MS
Regression
1
8.69111432E7
8.69111432E7
Residual
2
6996572.8
3498286.4
Total
3
9.3907716E7
125
Figure 20 - Table 2 of Regression Results
Result of test: The tool was successful in computing the test
4 Chi-Square Test:
Expected Values:
The test was manually computed and the results were:
Ho: Citizenship and getting a job in three months of graduation are independent
Ha : Citizenship and getting a job in three months of graduation are not independent
Chi-Square test value = Sum (O – E)^2/E ; O=Observed value, E=Expected Value
= (3-2.5)^2/2.5 + (2-2.5)^2/ 2.5 + (3-2.5)^2/2.5 + (2-2.5)^2/ 2.5 = 0.4
E = (row total) * (Column total)/Sample Size
Critical Chi-Square value = 3.841
We accept the null hypothesis.
Observed Values:
Chi-Square Test of Independence
Citizens Internationals
Total
(Join in 3
Months)Yes
(observed)
3
2
5
(Join in 3
Months)Yes
(expected)
2.5
2.5
NA
(Join in 3
Months)No
(observed)
2
3
5
(Join in 3
Months)No
(expected)
2.5
2.5
NA
5
5
10
Total
126
Degrees of freedom:1
Chi-Square =0.4
Critical Value- CV for 5% level of significance = 3.841
If Chi-Square value is greater than CV than reject the null hypothesis.
If not, than we fail to reject the null hypothesis.
Figure 21 - Table of Chi-Square Results.
Testing using JMeter
The following tests were performed by using Jakarta JMeter on the questions (dynamic
page) in the website. The number of users was increased and corresponding performance
of the website was noted at a loop count of 10.
10
Users/second
(optimal)
30 Users/second
(average)
45 Users/second
(worst)
Deviation
248
559
1542
Throughput
755/min
981/min
824/min
Average
709
1619
2998
The throughput is very much dependent on the network traffic and the overall load on the
server. It may help the throughput of the application if the database server is completely
dedicated to the application.
The two important parameters in the above table are deviation and average (ms). If the
standard deviation is high, some users will experience very good responses while some
other users will wait for a longer time. The smaller the value, the better it is. The average
value signifies the average amount of time taken to load a particular page.
For 10 users:
127
For 30 users
128
For 45 users.
The above given screen shot is for the worst case scenario, where the average and
standard deviation values shoot up drastically, and the throughput gets saturated if the
number of users are increased beyond this point.
SCALABILITY
Current server-side setup is for small number of simultaneous hits (~40).
The data is displayed as graphs and tables. The data transfer across the wire is minimal as
the data is manipulated in the middle tier and the final calculated value is passed over to
the web. But since the middle tier does a lot of calculations on the data, the amount of
time required for the result to be displayed is in higher magnitude.
129
J2EE application servers are well established and can currently meet an enterprise’s
applications needs. Though they are more complex than the normal web servers, they
provide a multi-tier architecture, where each tier can be developed separately and allows
the enterprise to add to each tier without affecting the complete application. J2EE
application servers will also provide some amount of basic clustering facilities.
•
J2EE delivers high performance, scalability and reliability for deploying ecommerce applications and services
•
Database scalability - Oracle is inherently scalable, and can easily port large
amounts of data.
Documentation for Developers:
Sun ONE Application Server and J2EE
A walkthrough for deploying EJB’s and the installation procedure for the Sun ONE
Application Server is explained below which may assist in giving a head start to
developers who are new to this technology in the CIS department of Kansas State
University.
Installation Guide
1. Download and install the J2SE SDK 1.3.1 from http://java.sun.com/j2se/1.3/ and
J2EE SDK from http://java.sun.com/j2ee/download.html#sdk . If you need to use a
build tool then download Apache ant from http://ant.apache.org/bindownload.cgi
1.
Set the environment variables to the values noted in the following table:
Table Setting for Environment Variables
Environment Variable
<JAVA_HOME>
<J2EE_HOME>
Value
The location of the J2SE SDK installation.
The location of the J2EE SDK installation.
130
<ANT_HOME>
PATH
The location of the ant installation.
Should include the bin directories of the J2EE SDK, J2SE
SDK, and ant.
2. If you use Oracle Database Server then you will have to copy classes111.zip from
C:\Oracle\ora90\jdbc\lib
download
into
<JAVA_HOME>\lib\system.
classes111.zip
from
the
Oracle
You
can
website
also
at
http://otn.oracle.com/software/tech/java/sqlj_jdbc/index.html
Starting The J2EE Server
The command to start the J2EE Server is
j2ee –verbose
Starting The Deploytool tool
For the GUI version of the deploytool, the command to start the tool is deploytool after
the j2ee startup is complete.
Creating The J2EE Application
The application generally comprises of three components: an enterprise bean, a J2EE
application client, and a Web component.
To create a new application:
1.Select File | New | Application. In the deploytool
131
2.
Click Browse.
3.
Navigate to the directory where the application reside and in the File Name field,
enter the name you wish to give for the ear file. Note that the ear file should be
present where all your java files are stored.
5.
Click New Application.
6.
Click OK.
Packaging the Enterprise Bean (JAR file)
In packaging an enterprise bean, the wizard performs the following tasks:
·
Creates the bean's deployment descriptor
·
Packages the deployment descriptor and the bean's classes in an EJB JAR file
·
Inserts the EJB JAR file into the application's ear file
•
Select File | New | Enterprise Bean.
132
•
Select the Create New JAR File when you are crating the JAR for the first time. If
you have already created one and want to add another EJB to this JAR file then
click on Add to existing Jar file.
·
Click on Edit.
·
In the tree under Available Files, locate the directory where you have stored
the files and Add the class files of the remote, home and bean classes of the
EJB.
·
Click OK.
·
Click Next.
In the General dialog box that appears select Session for a session bean and Entity
for an entity bean. Select the remote, home and bean classes as shown below.
133
·
·
Click Next.
In the Persistence Management dialog box that appears, Select the
Container-managed Persistence 2.0 radio button.
If in the above figure you select an entity bean then in the Fields to be Persisted,
check all fields you want in the database.
134
·
Enter the Primary Key class. Remember to change the type according to your
primary key.
·
In the Primary Key Field Name combo box, select the primary key of your
bean.
·
Specify an Abstract Schema Name
·
Click Next to skip the remaining dialog boxes until you encounter the Finish
button to click.
Packaging the Web Client (WAR file)
In packaging a Web client, the wizard performs the following tasks:
·
Creates the Web application deployment descriptor
·
Adds the component files to a WAR file
·
Adds the WAR file to the application's ear file
•
Select File | New | Web Component.
135
•
Skip the introduction and Select Create New WAR File In Application. If you
already have a War file then select Add to existing WAR files.
•
Click Edit.
•
In the tree under Available Files, locate the directory where you saved the servlet
class or any html pages you wish to add and click Add. If you have any java
applets that you wish to add, you will notice that they get added to the classes
where the servlet is. Drag the applet class files from there and put them with the
html pages.
•
Click OK.
•
Click Next.
Choose the web component you are creating which is a servlet in our case.
·
In the Servlet Filename combo box, select one of the servlets you want.
·
Click Next.
·
Skip and Click Next.
136
In the Aliases dialog box Click Add. And Enter the alias name for your servlet
·
Click Finish.
Specifying the JNDI Names and Generating Default SQL
1.
Select the entity bean in the JAR file and click on Entity tab.
Click on Finder/Select Methods to write EJB-QL. Click OK after writing the EJB-QL.
2.
Click on Deployment Settings.
3.
In the Deployment Setting dialog box, click Database Setting.
4.
Enter jdbc/oracle in the database JNDI name field. Enter you user name and
password for the Oracle Database server.
5.
Click OK.
6.
Click Generate Default SQL.
7.
Click OK in SQL Generation Complete Inform dialog.
8.
Click OK.
Select the Jar file and click on the JNDI tab. Add the JNDI names. Click OK
137
Deploying The J2EE Application
To deploy the application with the WAR and JAR components added, select the
application name.
·
Select Tools | Deploy.
·
Select the checkbox labeled Return Client Jar.
•
Click Next.
•
In the JNDI Names dialog box, verify the names you entered in the previous
section.
•
Click Next.
•
In the WAR Context Root dialog box, enter the Context Root field. When you
run the Web client, the context root will be part of the URL.
•
Click Next.
•
In the Review dialog box, click Finish.
138
•
In the Deployment Progress dialog box, click OK when the deployment
completes.
Running The Web Client
To run the Web client, type the following URL in the browser with all relative
information.
http://<localhost>: 8000/<context root>
Modifying The J2EE Application
Since the J2EE SDK is intended for experimentation, it supports iterative development.
Whenever you make a change to a J2EE application, you must redeploy the application
Stopping the J2EE server
The command to stop the server is
J2ee –stop
139
CHAPTER 8 – USER’S MANUAL
General Information
System Overview
The Statistical Analysis Tool is a web-based application for registered users to perform
different statistical analysis on the user data. The website will allow four types of analysis
to be done on the data; the regression analysis, the chi-square test, the correlation test and
the hypothesis test. The website in particular will be able to provide analysis for
questions of the nature of,
•
Is there a relationship between the grade point average (GPA) of an alumni
member and the salary bracket that he currently belongs to?
•
Is there a difference between the average salaries of the Master's student and the
average salaries of the PhD students at a 5% level of significance?
•
Does higher GPA result in higher salaries for masters students
•
Does higher GPA result in higher salaries for PhD students
•
Is getting a job within 3 months of graduation independent of the citizenship of
the student at the Masters level?
Using the System
The user has to enter the URL, http://procyon.cis.ksu.edu:8000/lastapp/indexproj.htm to
take him to the system. In order to use the system and perform analysis, the user has to
log in to the system. This can be done only if the user has registered to be a member of
140
this website. An online membership form is provided by the website to enable the user to
register. Once a member, the user can freely access the data analysis webpage, which
provides the research questions pertaining to the four tests. The results are displayed in
the form of graphs or tables. The detailed steps are explained below:
Log In: The member has to log in to perform analysis by:
•
Typing his user name in the UserName field provided at the right hand corner of
the webpage
•
Typing his password in the Password field.
•
Clicking on Submit to gain access to the system.
If the user has not registered to be a member, he can do so by clicking on the
Membership link, which will take him to the online membership form. The user will have
to
141
•
Click on the link Membership or Join here
•
Fill out all the data fields’ in the form and click Submit.
•
The system will register the user as a member and go back to the main page from
where the member can now log in to access statistical analysis by entering his
username and password and clicking on the Submit button.
Note: A login form is provided on all the pages of the website to enable the member
to perform analysis.
If the member enters an invalid user name or password, the system does not allow the
user to login and displays a message that the login has failed and prompts the user to
login again.
142
Analysis: On successfully logging into the system, the member is directed to the
webpage where he can select the analysis he wishes to perform. The research questions
and the corresponding test are displayed on the page. The member has to click the
Analyze button to see the results of any particular test.
143
Results
Once the member has selected a test, the results are displayed in the form of a graphs or
tables with all the statistical data. The output for each of the tests is given below:
• Simple Linear Regression
144
• Hypothesis test
• Correlation
• Chi-Square test
145
System Configuration
Oracle Database Server is used for storing all the persistence data such as the data
pertaining to the members that they enter into the system when they register.. Sun ONE
Application Server 7.0 is used as J2EE container, which includes EJB Server and Web
Server to maintain Enterprise JavaBeans and Web components. For the Client, the
hardware requirement is at least Intel Pentium III 300 Mhz or 1.0 Ghz Athlon which has
at least 256 MB RAM and has at least 200 MB freed hard disk space.
To run the application, Netscape Navigator and Microsoft Internet Explorer versions that
support Java Script and Java applets are required.
146
CHAPTER 9 – PROJECT EVALUATION
Problems Encountered
Learning curve
The Statistical analysis tool analyses four kinds of tests namely, the hypothesis test, chisquare test, simple linear regression and correlation. The developer had to study these
tests in order to implement them. Statisticians have come up with a table of probabilities
for the t-value, p-value and chi-square values required to come up with the critical value
which is compared to the test value to obtain the result. The developer had to find a way
of implementing these probabilities and had to do research on ways to do it.
The J2EE architecture also posed a challenge in the learning process since the developer
had not worked extensively with this technology prior to this project. In the earlier part of
the project, a lot of time was spent on understanding this and the various class paths to be
set.
J2EE and Deploy tool
Does not update files automatically.
The documentation for the deploy tool suggests that if we change any file within the EJB
jars or the web component and compile the changes, we just need to click on update files
to get the latest version for all files. But the deploy tool does not do this on a regular
basis. The files are not updated. The only way to be sure that the deploy tool gets
the updated version of your files is to load them again into the WAR or JAR and redeploy
them.
147
Not best suited for unit testing or development practices.
If the development environment has considerations of space or memory, the deploy tool
is not best suited for unit testing and deploying many times with changes. The problem is
that even with few EJB jars and just one WAR component, the EAR file becomes huge
and it is backed up each time you redeploy. The space crunch causes the deploy tool to
perform erratically, giving errors like Out of Space exception while deploying your
application. After some amount of research, I found a clean up tool for J2EE, which
cleans up the repository directory in the J2EE server.
EJB packaging error occurs in deploy tool when Finish button is clicked too
early. When deploying, even if all your properties are set and you can hit 'Finish' to start
deploying, it is best to keep clicking 'Next' until the last screen of the wizard is reached.
Some form of corruption takes place in the EAR file, if this is not followed and the next
time you start deploy tool, it complains that the EAR file could not be loaded as it is
corrupted.
There were other issues, where the deploy tool used to hang while importing .ear files
and would crash the complete system when closed.
Alumni data
The Analysis tool had to perform analysis on the alumni of the department of statistics.
This data is available at the Kansas state university alumni center. But the developer,
even after much trying, could not get access to this data due to security reasons. So for
the purpose of the MSE project, dummy data is used instead of the actual alumni data.
148
Number of lines of code
In the First phase of development, the estimate for the lines of code was 4636. This
estimate was made based on the function point analysis. It should be taken into account
that the developer had no prior experience, besides an academic assignment, in
developing such a project. Thus the estimate for the number of lines of code differed in
the second phase. They were estimated to be 3659. This was de to the fact that, in the first
phase the developer had considered the selection of research question for each test as an
input. But essentially, the user can choose only one research question at a time, hence the
selection of a research question is considered as one single input. This reduced the lines
of code estimate to 3659.
The actual number of lines of code came out to be 2800. The tool makes use of graphs to
output the results. The developer based these graphs on a source which was available on
the internet and made re-use of this code. This reduced the number of lines of code which
the developer would then have to write.
The distribution of the lines of code is as follows:
Entity Java Beans = 1869
Servlet =1040
XSL =120
Total = 3029 lines of code.
Cost estimation
149
The cost estimation was done using the function point analysis and the COCOMO model.
Since the project plan and cost estimate was refined in the second phase, the programmer
months also changed from the earlier estimate of 11 person-month to 9 person-month.
The actual time required for the completion of the project was 9.25 months, which is
fairly consistent with the estimate from the second phase.
The first and second phases of the project took longer than the third phase. This was due
to the initial unfamiliarity with the technologies and the unexpected problems
encountered while using the deploy tool in the first phase and due to the design in the
second phase. The project uses many mathematical formulae to develop the tests and it
was not clear how this should be done using OCL and the USE tool. The problem was
then resolved after valuable input from the committee members
Project duration
The following table shows the duration of the project:
Start Time
Finish Time
Phase I
03/15/03
06/30/03
Phase II
07/01/03
10/27/03
Phase III
10/28/03
12/08/03
The breakdown of activities in each phase is summarized in the following table and pie
charts:
150
Research&
meetings
Design
Phase I
minutes
990
PhaseII
minutes
390
PhaseIII
minutes
120
240
1120
80
Coding
900
700
1050
Deploying&
Testing
Documentation
1110
810
1800
840
640
920
Phase I Duration:
Figure 22 - Phase I duration
Phase II Duration:
151
Figure 23 - Phase II duration
Phase III Duration:
Figure 24 - Phase III duration
152
Lessons learnt
Methodology
On completion of the project, the developer realizes the usefulness of following
the software methodologies and the life cycle. The MSE portfolio served as a
useful guide throughout the project. The developer believes that this project
experience has equipped her with a better understanding of a software life cycle
and will be a guiding factor in future projects.
Reviews
One important lesson learnt in doing this project was the importance of reviews
and feedback. Besides getting valuable feedback from my major advisor, the
committee as a whole also reviewed my progress and gave valuable inputs during
presentations, which made this project learning experience and helped to improve
the quality of the product.
153
CHAPTER 10 – FORMAL TECHNICAL INSPECTION CHECKLIST
Formal Technical Inspection of the Software Requirements Specification performed by
Lakshmikanth Ganti
Divyajnana Nanjaiah
Criteria
Entry Criteria: The Inspectors should review the document and evaluate if
Yes/No/Partial and suggest comments if needed.
Type of Defects to Inspect: Completeness, Consistency, Correctness, Feasibility,
Modifiability, Traceability, Understandability, Maintainability, Verifiability/Testability,
Clarity, Functionality, and Reliability.
Exit Criteria: The inspected document by the inspectors.
Software Inspection Checklist
Completeness
Questions
Yes/No/Partial
Does SRS include all user requirements?
Yes
Do the functional requirements cover all
No
Comments
Not Required
abnormal situations?
Are all requirements written at a
consistent and appropriate level of
detail?
Yes
Does SRS define those requirements for
Partial
which future changes are anticipated?
Do the requirements provide an
The
SRS
does
not
completely specify this.
Yes
adequate basis for design?
Does the SRS include all of the
known customer or system needs?
Is the expected behavior documented
for all anticipated error conditions?
Yes
Yes
154
Only normal error
conditions are documented
Consistency
Questions
Yes/No/Partial
Comments
Is there any internal inconsistency
No
Requirements
between the software requirements?
are
consistent
Does SRS use standard terminology and
Yes
definitions throughout?
Is SRS compatible with the operational
environment
of
the
hardware
Not applicable
and
Don't
think
that
project has to define this.
software?
Has the impact of software on the
Not applicable
system and environment been specified?
Has the impact of the environment on
Not applicable
the software been specified?
Do any statements contradict each
No
other?
Correctness
Questions
Yes/No/Partial
Is each requirement verifiable by
Yes
Comments
testing, demonstration, review, or
analysis?
Does the SRS identify external Yes
Output Variables
interfaces in terms of input and
output mathematical variables?
Is there justification for the
Yes
design/implementation constrains?
Do any requirements conflict with or
duplicate other requirements?
Does the SRS conform to SRS
standards?
the
No
Yes
155
No Redundancy
Feasibility
Questions
Will
Yes/No/Partial
the
design,
operation,
and
Comments
Yes
maintenance of software be feasible?
Modifiability
Questions
Yes/No/Partial
Comments
Are requirements organized to allow for
Yes
The
modifications?
requirements
extensible
Is each unique requirement defined more
No
than once? Are there any redundant
statements?
Traceability
Questions
Yes/No/Partial
Can each software functional
requirement be traced to a higherlevel requirement (e.g., system
requirement, use case)?
Yes
Is
Yes
SRS
traceable
forward
through
Comments
successive development phases (e.g.,
into
the
design,
code,
and
test
documentation)?
Is each requirement uniquely and
correctly identified?
Yes
Understandability
Questions
Yes/No/Partial
Is each requirement written in clear,
Yes
concise, unambiguous language?
156
Comments
are
Does the SRS contain only necessary
Yes
implementation details and not contain
unnecessary details? Is it over specified?
Maintainability
Questions
Yes/No/Partial
Does the documentation follow MSE
Yes
Comments
portfolio standard?
Is
the
documentation
clear
and
Yes
unambiguous?
Verifiability/Testability
Questions
Yes/No/Partial
Comments
Are the requirements verifiable (i.e., can
Yes
Can be verified
Questions
Yes/No/Partial
Comments
Are all of the decisions, dependencies,
Yes
the software package be checked to see
whether
requirements
have
been
fulfilled)?
Clarity
and
assumptions
for
this
design
documented?
Is each concept defined only once, with
Yes
one clear meaning?
Is each statement written as clearly as
Yes
possible?
Functionality
157
Questions
Does
the
Yes/No/Partial
design
implement
the
Comments
Yes
specifications and requirements?
Reliability
Questions
Yes/No/Partial
Comments
Are the defect conditions/codes/messages
Partial
Necessary
specified completely and meaningfully?
defect
conditions/messages are
specified
Evaluation: The inspection resulted in minor changes in the SRS. The SRS did not define
the requirements for which future changes were to be anticipated. This was amended in the
version 2.0 of the SRS by adding a section 2.6 for anticipated future changes.
The Inspectors gave a partial rating for defect conditions/messages being specified
completely but said that all necessary defect conditions/messages have been specified.
Even so, a paragraph was added in the Analysis requirement section 3.3.3 of the SRS to
incorporate all error messages.
The letters submitted by the inspectors to confirm their involvement in the formal
technical inspection will be documented and submitted with the rest of the
documentation.
158
REFERENCES
IEEE Std 1028-1998, “IEEE Standard for Software Reviews and Audits”. 1998 Edition,
IEEE,1983.
IEEE Std 730-1998, "IEEE Standard for Software Quality Assurance Plans". 1998 Edition,
IEEE,1998.
IEEE STD 830-1998, "IEEE Recommended Practice for Software Requirements
Specifications"1998 Edition, IEEE, 1998.
Pressman, Roger S. "Software Engineering: A Practitioner's Approach". Fifth Edition,
Mc GrawHill, NY, June, 2001.
“Developing Enterprise Applications Using the J2EE Platform ”, java.sun.com, 2003,
IEEE Std 829-1983, "IEEE Standard for Software Test Documentation". 1983
Edition, IEEE, 1983.
Java Applets for graph: West Virginia University stats web site,
“http://www.stat.wvu.edu/SRS/Modules/Applets”
Dr. Scott Deloach’s CIS748 lecture notes “http://www.cis.ksu.edu/~sdeloach/748”
IEEE guide for software quality assurance planning -730.1-1995
159
Lecture notes, CIS 748 Software Management, Dr. Scott Deloach, Spring 2002
Formal Technical Checklist,
“http://www.csc.calpoly.edu/~jdalbey/205/Resources/InspectChecklist.html”
Formal Technical Checklist, “http://satc.gsfc.nasa.gov/fi/”
IEEE 1042, Guide to Software Configuration Management Plans
160