1
ULTIMETER® 100 OWNER’S MANUAL
TABLE OF CONTENTS
Page No.
QUICK START........................................................................... 3
I. INTRODUCTION............................................................. 9
II. PRE-INSTALLATION TESTING.................................... 10
III. PLANNING YOUR INSTALLATION............................... 16
IV. INSTALLING ULTIMETER 100 COMPONENTS........... 20
V. CONNECTING YOUR ULTIMETER 100 SYSTEM........ 23
VI. INITIAL SETTINGS………………..................................
SET YEAR.....................................................................
SET DATE AND DATE FORMAT..................................
RESET LONG-TERM MEMORIES................................
SET TIME AND TIME FORMAT....................................
SELECT TEMPERATURE UNITS.................................
SELECT WIND SPEED UNITS.....................................
SELECT RAIN GAUGE INCREMENTS & UNITS..........
TO ADJUST THE LONG-TERM RAIN TOTAL..............
25
25
25
25
26
26
26
27
29
XII. THE ULTIMETER 100 SERIAL PORT..........................
WEATHERTEXT OUTPUT MODE................................
COMPLETE RECORD MODE.......................................
DATA LOGGER MODE.................................................
PACKET MODE............................................................
COMPLETE HISTORY MODE......................................
MULTIPLE OUTPUT MODE..........................................
MODEM MODE.............................................................
XIII. SUPPLEMENTAL WIND VANE CALIBRATION............ 39
XIV. TEMPERATURE OFFSET ADJUSTMENT.................... 40
XV. ROUTINE MAINTENANCE............................................ 41
XVI. REPAIR & EXCHANGE SERVICE................................. 42
XVII. SPECIFICATIONS......................................................... 43
XVIII. AVAILABLE ACCESSORIES......................................... 47
VII. DISPLAYING CURRENT DATA.................................... 30
VIII. THE ULTIMETER 100 HI/LO MEMORY SYSTEM........ 31
IX. DISPLAYING STORED DATA......................................
TO DISPLAY HIGHEST VALUES.................................
TO DISPLAY LOWEST VALUES..................................
TO DISPLAY RAINFALL...............................................
32
33
33
34
X. RESETTING LONG-TERM MEMORY VALUES............ 34
TO RESET A SINGLE LONG-TERM HI OR LO............ 34
TO RESET ALL LONG-TERM HI & LO MEMORIES..... 34
XI. ALARMS........................................................................
TO SET AN ALARM.......................................................
THE RAIN RATE ALARM..............................................
TO MOMENTARILY STOP AN ALARM.........................
TO DISABLE AN ALARM...............................................
35
35
35
36
36
Continued On Next Page
1
37
37
37
38
38
38
38
38
2
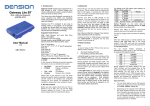
CONNECT SYSTEM COMPONENTS
QUICK START GUIDE
FOR THOSE WHO DON’T HAVE TIME TO READ
INSTRUCTIONS
Connect components to Junction Box as shown in diagram below. Refer
to the section "Installing Your ULTIMETER 100 Components".
N
(AND THOSE WHO DO)
W
E
WEATHER BASE 10
ULTIMETER
100
West Marine
In addition to these few "Quick Start" paragraphs,
please be sure to read the section on installation very
carefully. It includes important safety information as
well as time saving installation tips.
Indoor Temperature Sensor
(Optional)
Duplex Cable
(Optional)
S
ULTIMETER 100
Keyboard Display
OR
PC Data Logger
(Optional)
SUGGESTION: DO NOT UNCOIL CABLES UNTIL YOU
HAVE TESTED AND BECOME FAMILIAR WITH ALL
COMPONENTS AND ARE READY TO INSTALL THE
SYSTEM.
Junction Box Cable
ABOUT THE KEYBOARD
R
THE WEATHER PICTURE
There are six “data keys,” each identified by a symbol as
shown below:
N
*
AC Adapter
HI TEMP TODAY
76
HI WIND TODAY
24
W
WIND SPEED
9
TEMPERATURE
E
70
LO TEMP TODAY
54
WIND CHILL
64
RAIN TODAY
0 0.2 8
S
P EET BROS .
The Weather Picture
(Optional)
WIND
SPEED
WIND
CHILL
TEMP
RAIN
TIME
Junction Box
DATE
In addition, there are six “utility keys,” each identified by a
symbol as shown below:
ULTIMETER
Wind Sensor
Rain Gauge (Optional)
a
c
b
SCAN
Temperature Sensor
of both The Weather Picture
* Connection
AND a PC Data Logger to the i/o port
requires a Duplex Cable.
LAMP
CLEAR
ALARM
DOWN
UP
NOTE: The Weather Picture requires a 12v/1000mA AC Adapter be
used in place of the 12v/400mA AC Adapter supplied with the
ULTIMETER 100. Also, BEFORE YOU INSTALL PLUGS IN
RECEPTACLES, be sure to check connectors as shown on p. 13.
3
4
TO DISPLAY WIND SPEED, WIND CHILL, TEMPERATURE,
TIME, OR DATE
,
,
,
Press and release the desired data key:
, or
. The corresponding symbol will appear on the
screen and the current data value will be displayed.
, the instrument will display
NOTE: When you first press
the outdoor temperature.
TO DISPLAY WIND DIRECTION
After installation, the ULTIMETER 100 will constantly indicate the
prevailing wind direction on its 16 point compass rose. The
system minimizes confusing "jitters" by ignoring momentary
direction changes that occur during transient wind gusts. It also
avoids erroneous readings, by "locking" the wind direction display
when there is no wind, i.e. when the cups are not spinning.
Therefore, in order to test or demonstrate the wind direction
function, you must spin the cups. You'll find it is best to blow
somewhat steadily on the cups, rather than abruptly spinning the
anemometer rotor with your fingers.
The current wind direction in degrees (° ) is displayed by pressing
the
key twice (the first press displays the current wind speed):
key again
N=0°, E=90°, S=180°, W=270°, etc. Pressing the
returns the display to the current wind speed.
TO DISPLAY INDOOR TEMPERATURE (REQUIRES OPTIONAL
SENSOR)
a) Press and release
to display outdoor temperature.
a second time to display
b) Next, press and release
indoor temperature.
repeatedly, to display the values for each of the LAST SEVEN
DAYS. After each press, the display will repeatedly cycle
through: the selected date, that day's high or low value, and
the time at which it occurred.
d) To display the LONG TERM High or Low values (since last
RESET), press
or
a ninth time. The display will
repeatedly cycle through: the date on which the high or low
occurred, the highest or lowest value since last reset, and the
time at which it occurred. This display mode is easily
recognized by the flashing
when the date is displayed.
e) Pressing
or
a tenth time returns the display to
TODAY'S high or low value.
TO DISPLAY RAINFALL
a) To display TODAY'S rainfall (since midnight), press
b) To display PREVIOUS DAY'S rainfall (from midnight to
midnight) press
, repeatedly, to display daily rainfall for
each of the LAST SEVEN DAYS. The display will alternate
between the selected date and that day's total rainfall.
c) To display the LONG-TERM ACCUMULATED rainfall
(since you last reset this value to zero), press
an eighth
time. The display will alternate between the date you last
reset this total and the rainfall accumulation since that date.
d) Pressing
a ninth time returns the display to
TODAY'S rainfall.
TO DISPLAY HIGHEST AND LOWEST READINGS
a) Press the desired data key to display the current value.
b) To display TODAY'S highest or lowest values (since
midnight), press
or
once. The display will
repeatedly cycle through today's date, today's high or low
value, and the time at which it occurred.
c) To display PREVIOUS DAY'S highest or lowest values
(from midnight to midnight), press
or
again,
5
.
6
TO CHANGE MEASUREMENT UNITS OR FORMAT
NOTE: The ULTIMETER 100 is designed to minimize the
chance of someone else accidentally clearing your data or
changing your settings.
That is why, in many of the
procedures below, you must first display the value you wish to
change, then press and hold a key for 3-4 seconds before
settings are cleared or changed.
Use the procedure below to select: Wind Speed in mph, m/s,
knots, or km/h; Temperatures in Fahrenheit or Celsius; Time
in 12- or 24-hr format; Date in day/month or month/day
format; Rainfall increments of 0.01 in, 0.25 mm, 0.1 in, 0.1
mm, or 2.5 mm according to your preference and the type of
rain gauge you are using.
a) Press and hold the desired data key:
,
,
,
, or
. KEEP IT PRESSED UNTIL THE DISPLAY
CHANGES (after flashing three times).
NOTE: Units for wind chill
, dew point
index will be the same as for temperature.
d.p.
, and heat
b) Repeat this step until data is displayed in the desired units
or format.
TO ADJUST TIME, DATE, AND YEAR SETTING
This instrument features a perpetual calendar. For it to operate
correctly, you must set the current year before you set the day and
month.
a) Press and release
and
simultaneously. The
clock and calendar symbols will appear on the screen and the
instrument will display the year setting (default is 2009).
ANSWERS TO A FEW MOST LIKELY QUESTIONS . . .
WHAT IS THE
BUTTON FOR?
This button activates display backlighting, for viewing in a
dark room. Pressing the button once turns backlighting on,
and pressing it again turns it off. Backlighting may be left on
continuously if desired.
WHAT DOES THE BATTERY SYMBOL MEAN?
The battery symbol (not flashing) means the instrument is
operating from battery power. Likely causes are a
disconnected AC adapter, an AC power outage, or a faulty
AC adapter.
WHAT DOES A FLASHING BATTERY SYMBOL MEAN?
The battery symbol will flash if the battery is weak, or if no
battery has been installed.
WHAT IS THE MODULAR 6-CONDUCTOR JACK ON THE SIDE
OF THE CONTROL UNIT?
This jack is an RS232-compatible Serial Data I/O jack. It is
used for sending weather data to a personal computer or
other external device, such as The Weather Picture, Weather
Vox, or a radio transmitter. It is also used for connecting the
optional Indoor Temperature Sensor.
An additional Serial Data Output port is located in the junction
box (labeled "i/o").
b) Press
and KEEP IT PRESSED until the year begins
or
as required until the
to change. Then press
display shows the current year.
c) Press and release
to set time or
to set date.
d) Press and hold
or
as required until the displayed
value is close to correct, then press repeatedly until correct
setting is displayed. Press any data key to return to normal
operation.
7
8
I. INTRODUCTION
II. PRE-INSTALLATION TESTING
Congratulations on selecting The ULTIMETER 100 Weather
Station. To take full advantage of its advanced features,
please take a few minutes to read through and follow this
short booklet. Its simple step-by-step instructions will speed
you through system installation and help assure you many
years of complete satisfaction.
SUGGESTION: DO NOT UNCOIL CABLES UNTIL YOU
HAVE TESTED AND BECOME FAMILIAR WITH ALL
COMPONENTS AND ARE READY TO INSTALL THE
SYSTEM.
Before you uncoil any cables, you should interconnect and test the
system components, as described below. This will allow you to
become familiar with the system and assure that all components
are functioning properly before you install them.
Setup
1. Carefully remove each component from its shipping container
and place them all on a clear work area.
2. As shown below, identify the basic system components and
any accessories you have ordered.
N
W
PRO
Anemometer/
Wind Vane
N2:00
E
S
WEATHER BASE100
10
ULTIMETER
West Marine
Keyboard/Display Unit
IMPORTANT NOTE CONCERNING WIND DIRECTION:
The ULTIMETER 100 is designed to detect and display the
prevailing wind direction on its 16 point compass rose. The
system minimizes confusing "jitters" by ignoring momentary
direction changes that occur during transient wind gusts. It
also avoids erroneous readings, by "locking" the direction
display when there is no wind, i.e. when the cups are not
spinning. Therefore, in order to test or demonstrate the wind
direction function, you must spin the cups. You'll find it is
best to blow somewhat steadily on the cups, rather than
abruptly spinning the anemometer housing with your fingers.
The current wind direction in degrees (°) is displayed by
pressing the
key twice (the first press displays the
current wind speed). Pressing the
key again returns the
display to the current wind speed.
9
Junction Box
Junction Box Cable
Wind Vane Fin
Desk Stand
Cup Retaining Clips
Anemometer Cups
(PRO)
Wall Mount Bracket
Cable Ties
AC Adapter
Temperature Sensor
Not shown: 2 screws for desk stand; 2 screws for wall mounting keyboard/display unit; 2
drywall screws for wall mounting keyboard unit; mounting bracket and screw for
temperature sensor.
10
3. Install Anemometer Cups
Plug each cup firmly into place on the anemometer rotor
housing. Be sure that each cup arm snaps solidly.
NOTE: THE CUPS MUST BE ORIENTED AS SHOWN OR
WIND DIRECTION WILL BE INCORRECTLY DISPLAYED,
AND THE CUPS WILL NOT PROPERLY LOCK INTO
PLACE.
CUP ORIENTATION
(viewed from above)
4. Install Cup Retaining Clips (PRO Anemometer Only)
Spread the metal retaining clip apart and over the top of each
cup connection as shown.
Press down until clip is FULLY seated. Press the sides of the
clip to be sure the clip wraps around the bottom side of the cup
connection.
11
5. Install the Wind
Vane Fin
Insert the fin into the
open end of the
wind vane pointer
as shown. Press in
firmly until a “snap”
is felt.
6. Select the correct Anemometer Calibration
The correct anemometer (PRO, w/2.6” cups, or Standard, w/1.2”
cups) must be selected on the ULTIMETER keyboard/display for
wind speed to be properly calculated and displayed.
a. Press
and
buttons simultaneously to display the
presently selected anemometer. The default setting is “PRO”.
b. To change setting between “PRO” anemometer and “Std”
anemometer, press and HOLD
and
buttons
simultaneously while the display flashes three times. The new
selection is then displayed.
c. Press any key to return to normal operation.
d. Displayed wind speeds using PRO calibration will include
tenths of units (ex: 10.5), where wind speeds using Std
calibration will be display as whole numbers (ex: 10).
12
IMPORTANT NOTE CONCERNING UPGRADES:
If you have upgraded your weather station by adding a new
ULTIMETER 100 keyboard/display, but are still using an earlier
anemometer (with 1.2-inch cups), you must select the Standard
(“Std”) calibration in order to properly measure wind speeds.
7. Check all receptacles for crossed wires (see illustration below).
This can occur during plug-in and unplugging of the cables. It can
be corrected by using a pair of tweezers to gently lift the wire back
into the correct slot.
WRONG
RIGHT
Test Anemometer/Wind Vane Functions
1. Press and release the wind speed key, marked
, to display
current wind speed. Press and release it a second time to display wind
direction in degrees° (N=0°, E=90°, S=180°, W=270°, etc.)
2. If you wish to display wind speed in units other than mph, press
again and keep it pressed. The screen will flash 3 times, then display
wind speed in m/s. Each time you repeat the procedure, wind speed will
be displayed in alternate measurement units; mph, m/s, knots, or km/h.
3. Blow gently and steadily on the anemometer cups, so they rotate
clockwise when viewed from above and the screen displays a fairly
steady wind speed of 3.0 mph or more (4.8 km/h or 2.6 knots). Stop
blowing when a wind direction arrow is displayed within the compass
rose. The wind direction is calculated only while the anemometer cups
are spinning. This prevents any false indication of the last wind
direction.
8. Without uncoiling the cables, plug the wind vane cable and the
temperature cable into the junction box, in accordance with the
markings on top of the junction box.
NOTE: If you have ordered any extension cables, do not
uncoil them, but insert each between the junction box and
the thermometer or anemometer/wind vane, just as it will be
used in your actual installation.
9. Uncoil the 8-ft. junction box cable and plug one end into the
receptacle on the back of the keyboard/display unit. Plug the
other end into the junction box, opposite the temperature cable.
10. Plug the AC adapter cable into the junction box, then plug the
adapter itself into a 110-volt 60-cycle outlet. After 2 or 3 seconds,
the liquid crystal screen will come on, displaying the clock symbol,
“12:00” and the compass rose for wind direction, as shown below.
5. Now blow on the cups a little harder, until the reading increases, then
let the cups stop.
6. Press the up key, which is marked
. The screen will display the
highest wind speed registered while you were blowing on the cups. The
direction in degrees (of the highest wind) and the time and date at which
the high wind speed occurred will be alternately displayed (see
"Displaying Stored Data" section for complete information). Don't worry
that time and date are not yet correct - we'll be setting them in "Initial
Adjustments" instruction section.
NOTE: The ULTIMETER 100 does not display a low wind speed value,
simply because zero is normally the lowest wind speed measured.
7. Press any function key to exit the highest value display.
Test Temperature Functions
1. Press and release the temperature key, which is marked
on the
keyboard/display unit. The screen will display current temperature in
degrees Fahrenheit and a thermometer symbol.
N
W
4. Point the wind vane in the opposite direction. Again blow gently and
steadily on the cups. The wind direction arrow will shift to the opposite
side of the compass rose.
E
2. Press
again and keep it pressed. The screen display will flash 3
times, and then display the temperature in degrees Celsius. Release the
key. Repeat this procedure until the units you intend to use are
S
10
WEATHER BASE100
ULTIMETER
West Marine
13
14
displayed. Each time you repeat this procedure, temperature will be
displayed in alternate units, Celsius or Fahrenheit.
3. Hold the temperature sensor in your hand for 2 or 3 minutes. The
temperature indicated on the screen will rise.
4. Release the temperature sensor and allow the indicated temperature
to come back down several degrees.
III. PLANNING YOUR INSTALLATION
Please take a few minutes to plan the installation of your home
weather station. You'll help assure your long term satisfaction
with the installation and almost certainly save time and effort in the
process.
5. Press the up key, which is marked
. The screen will display the
date, highest temperature registered, and time it occurred, while you
were holding the sensor.
It may be helpful to remember that the cable lengths are:
Wind Sensor: 40 feet
Temperature Sensor: 25 feet
Rain Gauge (Optional): 40 feet
Junction Box Cable: 8 feet
AC Adapter Cord: 6 feet
6. Press any function key to exit the highest value display. When you
are entirely satisfied with the instrument's performance, you are ready to
proceed.
First you must decide where each system component is to be
installed. We suggest that you determine the optimum location of
the prime components in the order shown below.
7. Unplug the junction box cable from the back of the keyboard to erase
test readings from memory.
Control Unit Location - The primary considerations in
placement of the Keyboard/Display unit are: which room it
should go in, and should it be wall mounted or desk mounted.
Room Selection
- in which room will the data be most useful (e.g. bedroom,
kitchen, hallway near hall closet, solarium, etc.);
- in which room will the most people be able to enjoy and use
the data (e.g. living room or family room);
- other factors being equal, which room will make for easiest
wiring.
Wall Mount Advantages
- better visibility from most of the room;
- wiring can often be completely concealed -- may offer
shorter wire runs to outside sensors, possibly avoiding the
need for extension cables.
Desk Mount Advantages
- convenient access to keyboard;
- optimum visibility from desk chair;
- convenient for connection to a Personal Computer.
15
16
Anemometer/Wind Vane Location - The anemometer/wind vane is
designed to clamp to the top 3.5 inches of a mast having a having a
diameter of at least 1 in. and not more than 1-1/4 in. A thin-wall steel
TV antenna mast is ideal (available at Home Depot, Radio Shack and
many other stores).
NOTE: DO NOT MOUNT THE WIND SENSOR DIRECTLY ON
TOP OF IRON PLUMBING PIPE OR EMT ELECTRICAL
CONDUIT. Pipes and conduit have relatively thick ferrous
(magnets will stick to them) walls, which can interfere with the
proper operation of the magnets in the anemometer/wind vane.
If you wish to use iron pipe or electrical conduit as a mast, simply
add a short section of PVC to the top and clamp the wind sensor
onto the PVC. There are many ways to do this, but two typical
methods are:
a. If you are using a 3/4 inch iron water pipe as a mast, screw a
PVC pipe adapter with a 6-inch piece of 3/4 inch Schedule 40
PVC pipe onto the top of your mast.
b. If you are using 1-inch EMT electrical conduit as a mast, just
press a 12-inch long piece of 3/4 inch Schedule 40 PVC pipe six
inches into the top of the conduit.
In either method, PVC should not be used for the entire mast
because the MAST MUST BE GROUNDED. In addition, PVC
pipe is not strong enough to be used as a mast without
reinforcement.
Considerations for locating the mast:
- use an existing TV or FM-type mast if you can.
- mast should extend at least 3 feet (more if possible) above the
highest part of your roof or other nearby obstruction. You may
be able to add an extension to an existing mast.
- the mast should, as nearly as possible, be exactly vertical.
- the top 3-1/2 in. of the mast must be free. Again, you may be able
to add a short extension to an existing mast.
- if you are installing a new mast, it will be most economical to locate
it within 40 ft. of the junction box, so you won't need an extension
cable.
- mast must not be mounted on, or directly next to, an active
chimney. Flue gasses are very corrosive.
CAUTION: MAKE SURE THE MAST YOU USE IS PROPERLY
GROUNDED. IF YOU HAVE ANY DOUBT, HAVE IT CHECKED BY
A QUALIFIED TV SERVICE PERSON.
17
Temperature Sensor Location
NOTE: Before drilling holes and permanently installing the
temperature sensor, you may wish to experiment with the
temperature sensor location to be sure of satisfactory
readings.
Generally speaking, you should locate the temperature sensor:
- in the shade where it can never receive direct sunlight
- protected from wind and rain
- where air can circulate freely around it (e.g. avoid closed
gable ends that can trap a pocket of warm air)
- away from incidental heat sources, such as roof circulation
vents
- not directly above radiated or reflected heat sources such as
cement patios or large picture windows
- so that the last three feet of cable (or more) are outside the
structure in the open air
- so that the cable, rather than the sensor itself, is secured by
the supplied mounting clamp
It is surprising how much these factors affect temperature
readings; we have seen errors of 4° to 6° caused by just one of
these factors.
Rain Gauge (Optional) Location
- in the open, away from overhanging trees
- well clear of the house or other structures that might block
blowing rain
- easily accessible for periodic inspection and cleaning
- DO NOT locate on high tower or inaccessible rooftop!
Junction Box Location
- must be indoors
- must be close to an ac outlet, so the ac adapter cord can
reach it
- a vertical orientation is preferable to minimize the possibility
of dust getting into the junction box
- consider connecting serial data peripherals such as a PC or
Weather Picture to the Junction Box’s “i/o” port
If you will not require extension cables (that is, if the external
sensors are each close enough to the control unit location) it is
usually best to locate the junction box within 8 feet of the
control unit.
18
IV. INSTALLING YOUR ULTIMETER 100 COMPONENTS
Extension Cables
Installing the Anemometer
There is no problem extending the anemometer/wind vane cable or
optional rain gauge cable to 250 feet or more. Be sure the extension
cable used is correctly wired - if in doubt, proper 40' Extension Cables
may be obtained from Peet Brothers Company.
1. Slide the locking ring up as far as it will go on the fingers.
The Outdoor Temperature Sensor cable length should be kept as
short as practical, but extension up to 100 feet will not degrade
performance.
3. Slide the clamping ring down over the fingers until you start to
feel significant resistance.
Normally it is best not to extend the total cable length from the
temperature sensor to the keyboard display unit any more than
necessary. Longer cables tend to decrease the temperature reading
slightly. For example, a total length of 265 feet (using six 40-foot
extension cables) can decrease temperature readings about 1.5°F.
This applies only to temperatures above about 60°F; measurements
of temperatures below 60°F are unaffected by long cable lengths.
Instead of extending more than one sensor cable, it may be possible
and more economical to place the junction box further from the
keyboard/display unit, using a 40' Junction Box Extension Cable.
2. Place the anemometer/wind vane over the top of the mast with
all four fingers on the outside of the mast.
4. Find the North Calibration Mark on the anemometer (this is the
small silver line located near the screw head - see illustration
below). Rotate the anemometer on the mast until the calibration
mark is facing due north. Use a compass or other directional
reference.
Tip: Use a piece of tape to hold the wind vane pointed in the
direction of the silver mark, and use the wind vane pointer to help
to install the anemometer in the correct position. Rotate the
anemometer on the mast until the wind vane points North
(remember to remove tape!).
NOTE: If you plan to use a sensor extension cable that will be joined
outside, you must waterproof the connection.
North Calibration Mark
5. Firmly clamp the anemometer in place by repeatedly pulling the
locking ring down, first a little on one side, then a little on the
opposite side, keeping it more or less level, until you can't pull it
down any further.
6. Using the cable ties provided, secure the cable to the mast.
One tie should be placed just about 2 in. below the
anemometer/wind vane. The other two should be evenly spaced
below that.
19
20
Installing the External Temperature Sensor
1. Drill a pilot hole at the desired location.
2. Mount the supplied clamp and temperature sensor taking care
that its protective metal housing does not touch any nearby
surface. The metal end should be pointed "up", with the cable
exiting downward, to discourage water droplets or ice from
"hanging on" to the metal housing.
Installing the Keyboard/Display Unit
Desk or Shelf Mounting
1. Assemble the desktop stand as shown below.
3. Insert the plug of the junction box cable into the back of the
control panel. Be sure it "clicks" into place.
4. If the junction box cable is to run down the wall, insert the cable
into the groove provided on the back of the keyboard/display unit.
5. Hang the keyboard/display unit from the two projecting nubs on
the mounting bracket.
Installing the Junction Box
1. Drill two pilot holes 3-1/2 in. apart at the desired mounting
location.
2. Mount the junction box; use wood screws (provided) for a
wooden wall or drywall anchors (provided) for a sheet rock
wall.
2. Place the keyboard/display unit on the stand so the two
alignment pins on the stand fit firmly into the matching holes on
the back of the instrument.
3. Plug in cables from the ac adapter, keyboard display unit,
thermometer, anemometer/wind vane, and rain gauge, also
PC or Weather Picture if applicable.
3. Secure the Keyboard/display unit to the stand, using the two
screws provided.
4. Insert the plug of the junction box cable into the back of the
control panel. Be sure it "clicks" into place.
5. Position the assembled unit as desired.
Wall Mounting
1. Using the mounting bracket as a template, use a pencil to mark
two holes 3.75 in. apart for the wood screws or drywall anchors
provided. Mount at a height slightly above eye level for best
viewing angle.
2. Install the mounting bracket using the two screws provided. Do
not overtighten.
21
22
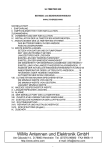
V. CONNECTING THE ULTIMETER 100 SYSTEM
Connect components to configure your system as shown in
the Wiring Diagram.
Notes concerning Unimounts: If your system includes a
Unimount Sensor Array (optional), please refer to the wiring
diagram provided with the Unimount. Also, in Unimount
systems, The Weather Picture® MUST be connected to the
serial data port of the ULTIMETER 100 keyboard using an
adapter cable, and cannot be connected to the junction box.
WIRING DIAGRAM
Connect components to Junction Box as shown in diagram below.
N
W
E
Indoor Temperature Sensor
(Optional)
Duplex Cable
(Optional)
S
WEATHER BASE 10
ULTIMETER
100
West Marine
ULTIMETER 100
Keyboard Display
OR
Using the following sequence, apply power to your system:
PC Data Logger
(Optional)
1. Plug one end of the 8-conductor cable into the junction
box. Plug the other end into the back of the instrument.
2. Connect the AC adapter into an AC outlet. In 110 volt
systems, be sure to use the 3-prong AC adapter and a
properly grounded 3-prong outlet. Then, plug the AC adapter
output cable into the junction box. Allow 2 or 3 seconds for
the keyboard display to come on.
Junction Box Cable
R
THE WEATHER PICTURE
N
*
AC Adapter
3. Install a fresh 9 volt back-up battery (not included) at this
time, in order to preserve any settings or adjustments that you
make while installing the system.
HI TEMP TODAY
76
HI WIND TODAY
24
W
WIND SPEED
9
TEMPERATURE
E
70
LO TEMP TODAY
54
WIND CHILL
64
RAIN TODAY
0 0.2 8
S
P EET BROS .
The Weather Picture
(Optional)
The back-up battery compartment is located on the lower right
side of the keyboard/display unit. To open the compartment,
slide the cover in direction of arrow. Insert a 9-volt battery,
with the + and - terminals oriented as shown in the diagram
on the back of the keyboard housing. Replace the cover.
Junction Box
ULTIMETER
4. Press
and
simultaneously to initiate the battery
check function. In a few seconds, the flashing battery symbol
should go out.
About the Battery Symbol in the Display
In operation, a flashing battery symbol indicates a weak battery in
need of replacement. Your keyboard automatically performs a
battery check daily. To perform a battery check manually, press
and
simultaneously to initiate the battery check function.
In a few seconds, the flashing battery symbol should go out. If it
does not, the battery should be replaced.
23
Wind Sensor
Rain Gauge (Optional)
Temperature Sensor
of both The Weather Picture
* Connection
AND a PC Data Logger to the i/o port
requires a Duplex Cable.
NOTE: The Weather Picture® requires a 12v/1000mA AC Adapter be
used in place of the 12v/400mA AC Adapter supplied with the
ULTIMETER 100.
Also, BEFORE YOU INSTALL PLUGS IN RECEPTACLES, be
sure to check connectors as shown on p. 13.
24
Term high and low values will be replaced by the current values, the
Long Term rainfall total will be reset to zero, and the rainfall "since"
date will be reset to the current date.
VI. INITIAL SETTINGS
SET THE YEAR
This instrument features a perpetual calendar, using a leap year counter
to keep track of each leap year. For it to operate correctly, you must set
the current year before you set the day and month.
and
simultaneously. The clock and
1. Press and release
calendar symbols will appear on the screen and the instrument will
display the year setting (default is 2009).
2. Press
and KEEP IT PRESSED until the year begins to
change. Then press
shows the current year.
or
as required until the display
NOTE: It's best to set the Year BEFORE you set the date. If you
have already set the date, check it after setting the year, and adjust
the date display as necessary.
NOTE TO SERIAL PORT USERS: It is essential to make the
correct Year setting; otherwise, date data from the serial port may
be incorrect.
You may wish to use this "master reset" procedure on the first day
of each new month. All Long Term high and low values will then be
the highest and lowest values, and also the total rainfall, for the
month to date.
SET TIME AND TIME FORMAT
again and hold
2. If you prefer a 24-hour clock display, press
until the display stops flashing (the display will flash three times,
then change to 24-hr format). To change back to 12-hr format,
repeat this procedure.
3. Press and hold
for at least 3 seconds. The time display will
flash three times, then enter a setting mode and the time will begin
to change. Press
you press and hold
4. Press
SET DATE AND DATE FORMAT
key.
1. Press the
or
as required to set the correct time. If
, the display will change rapidly.
or
to return to normal operation.
SELECT TEMPERATURE UNITS
1. Press and release
. The date will be displayed in mm/DD
format. If this is satisfactory, you may skip to Step 3.
Temperature is initially displayed in degrees Fahrenheit. Use the
following procedure if you prefer degrees Celsius.
2. If you prefer a DD/MM date display, press and hold
until the
display stops flashing (the display will flash three times, then
change to DD/mm format). To change back to MM/DD format,
repeat the procedure.
1. Press and release the
3. Press and hold the
for at least three seconds. The date
display will flash three times, then enter a setting mode and the date
will begin to change. Press
or
correct date. If you press and hold
change rapidly.
as required to set the
or
, the display will
4. When you have finished setting the date, press
normal operation.
again and hold until the display stops flashing.
2. Press
Temperature will be displayed in Celsius. To return to Fahrenheit,
repeat this step.
NOTE: Units for wind chill
, dew point d.p. , and heat index
will be the same as for temperature.
SELECT WIND SPEED UNITS
Wind Speed is displayed initially in mph. You may select m/s,
knots, or km/h as preferred.
to return to
RESET LONG-TERM MEMORIES
and
simultaneously for at least three
Press and hold
seconds. The display will flash three times, then stop. All Long
25
key.
1. Press and release the
key to display current wind speed.
again and hold until the display stops flashing. Wind
2. Press
speed will be displayed in m/s.
3. Repeat this procedure to select knots or km/h.
26
SELECT RAIN GAUGE INCREMENTS AND RAINFALL UNITS
If your ULTIMETER system does not yet include a self-emptying rain
gauge, you may skip this section and proceed to "DISPLAYING
CURRENT DATA".
Use the procedure below to tell the instrument the measuring increment
of your rain gauge. Allowable rainfall increments are: 0.01 inches, 0.25
mm, 0.1 inches, 0.1 mm, and 2.5 mm.
key. The rain icon and "0.00 in" will
1. Press and release the
appear in the display. Each time your rain gauge reports an
increment of rain, the rain display will increase by 0.01 inches. If
your rain gauge reports rainfall in increments of 0.01 inches, skip
the rest of this section.
for at least three seconds. The display will flash three times,
then stop. The Long Term rainfall total will be reset to today's
rainfall, and the rainfall "since" date will be reset to the current date.
Or, to reset ALL long-term memories (including rainfall), press and
hold
and
simultaneously for at least three seconds. The
display will flash three times, then stop. All Long Term high and low
values will be replaced by the current values, the Long Term rainfall
total will be reset to today's rainfall, and the rainfall "since" date will
be reset to the current date. You may wish to use this "master
reset" procedure on the first day of each new month.
2. Press and hold the
key a second time until the display
stops flashing. "0.00 mm" will appear in the display. Each time
your rain gauge reports an increment of rain, the rain display will
increase by 0.25 mm. If your rain gauge reports rainfall in
increments of 0.25 mm, skip the rest of this section.
3. Press and hold the
key a third time until the display stops
flashing. "0.0 in" will appear in the display. Each time your rain
gauge reports an increment of rain, the rain display will increase by
0.1 inches. If your rain gauge reports rainfall in increments of 0.1
inches, skip the rest of this section.
4. Press and hold the
key a fourth time until the display stops
flashing. "0.0 mm" will appear in the display, with the "mm" flashing.
Each time your rain gauge reports an increment of rain, the rain
display will increase by 0.1 mm. If your rain gauge reports rainfall in
increments of 0.1 mm, skip the rest of this section.
Note to Serial Data Port Users: when you select 0.1mm
increments, the serial data output will report rain totals in metric
rather than English units.
key a fifth time until the display stops
5. Press and hold the
flashing. "0.0 mm" will appear in the display, with the "mm" not
flashing. Each time your rain gauge reports an increment of rain,
the rain display will increase by 2.5 mm. If your rain gauge reports
rainfall in increments of 2.5 mm, this is the correct setting.
INITIALIZE THE LONG-TERM RAINFALL TOTAL
key. Then press and release the
Press and release the
key eight times to display the long-term rainfall. Press and hold
27
28
TO ADJUST THE LONG-TERM RAINFALL TOTAL
VII. DISPLAYING CURRENT DATA
If you wish to include rainfall accumulated prior to installation of your
ULTIMETER 100, you must adjust the long-term rainfall memory to
display the accumulated total rainfall, and also adjust the rainfall
"since" date to reflect the earlier beginning of your rainfall record. If
the "since" date on your weather station is already correct, then
perform only Step 3. Otherwise, perform all four steps.
Step 1: Adjust the rainfall "since" date as follows:
a) Enter the year of the "since" date, by pressing and releasing
and
, or
. The corresponding symbol will appear on the
screen and the current data value will be displayed. To
display current Wind Direction in Degrees, press
twice
(you may press again to return to Wind Speed).
simultaneously. The instrument will display the
year setting (default is 2009). Press
and KEEP IT
PRESSED until the year begins to change. Then press
or
as required until the display shows the correct year of the
rainfall "since" date.
b) Enter the day and month of the "since" date, as follows:
press and release
to display date. Press and hold
for
at least three seconds. The date display will flash three times,
then enter a setting mode and the date will begin to change.
Press
TO DISPLAY THE CURRENT VALUE OF WIND SPEED, WIND
CHILL, OUTDOOR TEMPERATURE, TIME, OR DATE:
Press and release the desired data key:
,
,
,
or
press and hold
as required to set the correct date. If you
or
, the display will change rapidly.
Step 2: Reset the Long-Term Rain total and "Since" date as follows:
Press and release the
key. Then press and release the
key eight times to display the long-term rainfall. Press and
for at least three seconds. The display will flash three
hold
times, then stop. The long-term rainfall total will be reset to
today's rainfall, and the rainfall "since" date will be reset to the
date you input in step 1.
Step 3: Enter the desired Long-Term Rainfall total as follows:
1. Press and hold
and
simultaneously for at least
three seconds until the displayed long-term rainfall total begins
to change.
2. Then press
or
repeatedly until the desired rainfall
total is displayed (be sure to include today's rainfall in your longterm total). Press
to return to normal operation.
Step 4: Reset to the Current Date (enter current year, then current
day and month), by following the key sequences of Step 1.
NOTE: When you press
outdoor temperature.
, the instrument will display the
TO DISPLAY CURRENT WIND DIRECTION IN DEGREES°
The current wind direction in degrees (° ) is displayed by
pressing the
key twice (the first press displays the
current wind speed): N=0°, E=90°, S=180°, W=270°, etc.
Pressing the
key again returns the display to the current
wind speed.
TO DISPLAY CURRENT INDOOR TEMPERATURE
to display outdoor temperature.
1. Press and release
a second time to display
2. Next, press and release
symbol will appear in the display
indoor temperature. The
and the current indoor value will be shown.
Automatic Scanning
The instrument can continually scan any of the following data at 5second intervals:
Wind Speed
Today's Rainfall
Wind Chill
Time
Temperature (Indoor & Outdoor) Date
To select data to be scanned:
a
1. Press c b and keep it pressed until “SEL” (select) appears
in the display.
2. Press the data key of each function you wish to include in
the scan sequence.
a
3. Press c b to end the selection process and start the scan.
To exit scan mode, press any data key.
To resume scanning, press and release
29
30
a
c b
.
VIII. ULTIMETER 100 HIGH/LOW MEMORY SYSTEM
The ULTIMETER 100 keyboard monitors and displays current data from
five different sensors (plus calculated wind chill temperature). It also
maintains nine memory banks for high and low records. The instrument
will be most valuable to you if you understand the nine memory banks:
TODAY'S HIGHS, LOWS, AND RAINFALL
At midnight each night, the ULTIMETER 100 starts keeping track of
high and low values, and rainfall, for the new day. At any time
during the day, the instrument can tell you what the highest and
lowest values have been, thus far in the day (since midnight).
"TODAY'S" high and low values are automatically maintained, and
cannot be manually altered or reset. If you ever wish to record
highs and lows, or rainfall, starting from a specific time, you may
use the user-resettable "Long Term" high/low memory described
below.
PREVIOUS DAY'S HIGHS, LOWS, AND RAINFALL
Each midnight the instrument moves TODAY'S highs and lows and
rainfall into separate memory, now calling them PREVIOUS DAY'S
values. At any time in the current day, you can retrieve the high and
low values and rainfall for each of the previous seven days directly from the keyboard or remotely by phone, modem, or radio
link. PREVIOUS DAY'S values are automatically maintained, and
cannot be manually altered or reset. If you ever wish to record
highs and lows or rainfall starting from a specific time, you may use
the user-resettable "Long Term" high/low memory described below.
LONG TERM HIGHS AND LOWS
The long-term memory bank is extremely flexible. It keeps track of
highest and lowest readings, and accumulated rainfall, since the
last time you reset the stored value. You can individually reset any
high or low value in this memory whenever you wish. For example,
you may wish to keep close watch on a major storm by resetting the
LONG TERM highest wind speed memory, or the LONG TERM
rainfall total just before the storm hits, or even again during the
storm.
There is also a master reset that resets all of the LONG TERM
stored values simultaneously. If you wish to track monthly highs
and lows, just use the master reset at the beginning of each new
month.
IX. DISPLAYING STORED DATA
TO DISPLAY HIGHEST VALUES
To display the highest values of wind speed or temperature for today,
yesterday, and long term:
1. Press the desired data key to display the current value.
2. To display TODAY'S highest value (since midnight), press
once. The display will repeatedly cycle through today's date,
today's high value, and the time at which it occurred.
3. To display PREVIOUS DAY'S highest values (from midnight to
midnight), press
again, repeatedly, to display the values for
each of the LAST SEVEN DAYS. After each press, the display will
repeatedly cycle through: the selected date, that day's high value,
and the time at which it occurred.
4. To display the LONG TERM highest value (since last RESET),
press
a ninth time. The display will repeatedly cycle through:
the date on which the highest value occurred, the highest value
since last reset, and the time at which it occurred. The Long Term
high value is the highest value recorded since you last reset this
memory. The Long Term display is easily recognized by the
flashing
when the date is displayed.
5. Pressing
highest value.
a tenth time returns the display to TODAY'S
TO DISPLAY LOWEST VALUES
1. Press the desired data key to display the current value.
2. To display TODAY'S lowest value (since midnight), press
once. The display will repeatedly cycle through today's date,
today's low value, and the time at which it occurred.
3. To display PREVIOUS DAY'S lowest values (from midnight to
midnight), press
again, repeatedly, to display the values for
each of the LAST SEVEN DAYS. After each press, the display will
repeatedly cycle through: the selected date, that day's low value,
and the time at which it occurred.
4. To display the LONG TERM lowest value (since last RESET),
press
a ninth time. The display will repeatedly cycle through:
the date on which the lowest value occurred, the lowest value since
last reset, and the time at which it occurred. The Long Term low
31
32
value is the lowest value recorded since you last reset this memory.
X. RESETTING LONG TERM MEMORY VALUES
The Long Term display is easily recognized by the flashing
when the date is displayed.
TO RESET A SINGLE LONG TERM HIGH OR LOW MEMORY
5. Pressing
lowest value.
a ninth time returns the display to TODAY'S
TO DISPLAY RAINFALL
NOTE: Only Long Term memory values can be reset; you
cannot clear Today's or Previous Day's values. These are
automatically reset (updated) by the instrument.
1. First, display the stored Long Term data you wish to clear.
1. To display TODAY'S rainfall (thus far since midnight), press
. The instrument will display today's total rainfall.
2. To display PREVIOUS DAY'S rainfall (from midnight to midnight)
press
, repeatedly, to display daily rainfall for each of the
LAST SEVEN DAYS. The display will alternate between the
selected date and that day's total rainfall.
3. To display the LONG-TERM ACCUMULATED rainfall (since you
last reset this value to zero), press
an eighth time. The display
will alternate between the date you last reset this total and the
rainfall accumulation since that date.
4. Pressing
rainfall.
a tenth time returns the display to TODAY'S
FCC STATEMENT ON CLASS B
This equipment has been tested and found to comply with the limits for a Class B digital
device, pursuant to Part 15 of the FCC rules. These limits are designed to provide
reasonable protection against harmful interference when the equipment is operated in a
residential installation. This equipment generates, uses, and can radiate radio frequency
energy and if not installed and used in accordance with the instruction manual nay cause
harmful interference to radio communications. However, there is no guarantee that
interference will not occur in a particular installation. If this equipment does cause harmful
interference to radio or television reception, which can be determined by turning the
equipment off and on, the user is encouraged to try to correct the interference by one or
more of the following measures:
•
•
•
•
key for at least three seconds.
2. Press and hold the
The display will flash three times, then change to a display of
the current value, the current time, and today's date.
TO RESET ALL LONG TERM HIGH, LOW, & RAIN MEMORIES
Instead of resetting each Long Term high and low memory
individually, you may simultaneously reset all Long Term
highs and lows, including the Long Term rainfall total. To do
so:
Press and hold
and
simultaneously for at least
three seconds. The display will flash three times, then stop.
All Long Term high and low values will be replaced by the
current values, and the Long Term rainfall total will be reset to
zero.
You may wish to use this "master reset" procedure on the first
day of each new month. All Long Term high and low values
will then be the highest and lowest values for the month to
date.
TIP: If you always use only the master reset (as opposed to
individual resets), the date shown on the Long Term rainfall
display will be the date when all highs and lows were last
reset.
Reorient or relocate the receiving antenna.
Increase the separation between the equipment and the receiver.
Connect the equipment into an outlet on a circuit different from that to which the
receiver is connected.
Consult the dealer or an experienced radio TV technician for help.
Notice: The changes or modification not expressly approved by the party responsible for
compliance could void the user's authority to operate the equipment.
33
34
XI. ALARMS
The ULTIMETER 100 includes the following 15 adjustable alarms:
High Wind Speed, High Outdoor Temperature, Low Outdoor
Temperature, High Indoor Temperature, Low Indoor Temperature,
Low Wind Chill Temperature, Rain Rate Alarm, and Time Alarm.
When an alarm setting is exceeded, the display flashes the alarm
setting and a high-pitched alarm will sound. The sound will stop
automatically after about 30 seconds, but the display will continue
flashing until reset.
TO SET AN ALARM (other than Flash Flood Alert)
1. Select the function for which you wish to set an alarm by
pressing
,
,
, or
. If you are setting an
alarm for wind speed, wind chill, or time, skip to step (3).
2. This instrument has both a high and a low alarm for
temperature. Press
to set a high alarm or
to set a
low alarm.
3. Press and release
to display the current alarm value.
4. Press and hold
or
until the display changes, then
press repeatedly until desired alarm setting is displayed.
THE RAIN RATE ALARM
This instrument provides a rain rate alarm, intended for use
where there is danger of local flooding or downstream flash
flooding. Flash flooding can result when heavy rainfall occurs
at higher elevation, and water rushes toward low-lying areas.
The rain rate alarm warns that heavy rainfall has occurred,
which could result in impending local flood conditions, or flash
flooding within your vicinity (or possibly downstream, outside
of your vicinity). Bear in mind that your success in predicting
flash flooding depends upon many factors, in addition to rain
rate: terrain, elevation, drainage, etc.
Before setting the rain rate alarm, be sure to select rainfall
units according to the type of rain gauge you are using.
The rain rate alarm is set in inches-of-rain or mm-of-rain per
hour. An alarm will sound of a specified minimum amount of
rain (called the threshold) falls at a rate equal to or greater
than the rain-rate setting. The default threshold value is 0.5
in, or 12.7 mm.
35
EXAMPLE: If you set an alarm for a rain rate of 2 inches per
hour, the alarm will sound if 0.5 inches of rain (the default
threshold value) falls within 15 minutes, which equals an
hourly rate of 2 inches per hour.
To adjust the Rain Rate Alarm rain rate:
1. Press and release
.
. The rain, clock, and alarm symbols will
2. Press
appear in the display, and the present rain rate alarm setting
will be displayed.
or
until a value is shown and
3. Press and hold
begins to change. The rain rate can be adjusted from 0.1
in/hr to 10 in/hr in 0.1-in increments, or from 2.5 mm/hr to
254.0 mm/hr in increments of 2.5 mm/hr.
4. Press
or
setting is shown.
repeatedly until the desired rain rate
To adjust the Rain Rate Alarm threshold value:
and
simultaneously. The rainfall and
1. Press
alarm symbols will appear in the display, and the present
threshold value will be shown.
or
until the threshold value
2. Press and hold
begins to change. The threshold value can be adjusted from
0.1 inch to 0.5 inch in 0.1-inch increments, or from 2.5 mm to
12.5 mm in increments of 2.5 mm.
3. Press
or
value is shown.
repeatedly until the desired threshold
TO MOMENTARILY STOP AN ALARM FROM SOUNDING
key. The
With the alarm setting displayed, press the
alarm sound will stop temporarily. When you return to normal
operation (displaying data), the alarm will sound again when
the current value exceeds the alarm setting.
TO DISABLE AN ALARM
First, display the alarm setting. If the alarm has been
triggered, the alarm setting will already be displayed.
Then, press and hold the
key for at least three seconds.
The display will flash three times, then read "OFF".
36
XII. THE ULTIMETER 100 SERIAL PORT
The ULTIMETER 100 provides a unique 7-mode serial port to facilitate
computer data logging and remote data reporting via telephone, modem,
or RF link. Each of the four modes can be accessed by pressing and
holding a combination of two keys, or by command into the serial port.
The following is a brief description, to provide an idea of the capabilities
of each mode. The serial port is located in the Junction Box (receptacle
"i/o") and also the right-side receptacle of the keyboard/display.
Complete details are available to programmers upon request or at
www.peetbros.com.
WEATHERTEXT OUTPUT MODE
In WeatherText Output Mode, the instrument puts out one humanreadable (text) Weather Report each minute. The serial text output
is viewed on the monitor of a PC using terminal software such as
HyperTerminal (located on your WIndows PC at
Start/Programs/Accessories/Communications/HyperTerminal), or
using WeatherText™ Tools software from Peet Bros. The text
output may be "captured" and saved as a .txt file for later viewing or
printout. Communications settings are 2400/8/N/1 (contact Peet
Bros. Tech Support for further assistance). Each "WeatherText
Report" includes all current values, plus the highest wind speed
over the past minute with the associated wind direction, the average
wind speed over the last minute, today's and long-term rainfall,
today's highs and lows, and current time and date. Key Combo:
and
for 3 seconds to enter this mode. In
Press and hold
addition, each time this key combo is pressed, a comprehensive
"Complete History Report" is output (contains highs and lows for the
previous 7 days plus long-term). Following is a sample
WeatherText Report:
ULTIMETER WEATHER REPORT 01/17/05 09:32A
Wind:
Cur 11.4MPH 180Deg, 1mAvg
0.0MPH, 1mPeak 16.3MPH 166Deg
Hi 19.1MPH 176Deg
WChill:
Cur 75.7F, Lo 45.6F
Temp Out: Cur 75.7F, Hi 75.7F, Lo 55.6F
Temp In: Cur 76.4F, Hi 72.6F, Lo 72.3F
Hum Out: Cur 65.6%, Hi 85.9%, Lo 65.6%
Baro:
Cur 29.93inHg, Hi 30.14inHg, Lo 29.93inHg, 3hr chg -0.09inHg
Dewpt:
Cur 63.6F
Heatx:
Cur 77.0F
Rain:
Today
0.12in, Since 01/01/05:
0.34in
WeatherText™ Tools software also generates an APRS data string for
ham radio transmission (ref. WeatherText™ Tools “Help” for more info).
COMPLETE RECORD MODE
Recommended for use with The Weather Picture®
In Complete Record Mode, the instrument puts out a steady stream
of records, about thirty per minute. Each record includes all current
values, today's high and low values, yesterday's high and low
values, and long term high and low values, station calibration
37
numbers, and current time and date. Key Combo: Press and hold
and
for 3 seconds to enter.
DATA LOGGER MODE
In Data Logger Mode, the instrument puts out a steady stream of
records, about two per second. Each record includes all current
readings including time and date. Key Combo: Press and hold
and
for 3 seconds to enter this mode.
PACKET MODE
In Packet Mode, the instrument puts out one record every five
minutes. Each record includes all current values, plus the highest
wind speed over the past five minutes with the associated wind
direction, station calibration numbers, and current time and date.
Key Combo: Press and hold
and
for 3 seconds to enter
this mode.
COMPLETE HISTORY MODE
In Complete History Mode, the instrument puts out a steady stream
of records, about twelve per minute. Each record includes all
current values, today's high and low values, seven previous day's
high and low values, long term high and low values, station
calibration numbers, current time, date, and year. Key Combo:
a
Press and hold
and c b for 3 seconds to enter this mode.
MULTIPLE OUTPUT MODE
Recommended for use with The Weather Picture®
In Multiple Output Mode, the instrument puts out a stream of
consecutive records, alternating between each of the four output
modes described above. WeatherText Mode, Complete Record
Mode, Complete History Mode, and Data Logger Mode records are
output continuously; in addition, a Packet Mode record is output
every five minutes. This mode enables multiple serial data output
applications requiring different output modes. Key Combo: Press
and hold
and
for 3 seconds to enter this mode.
MODEM MODE
In Modem Mode, the serial port is kept in a receive mode with no
data output. It will accept commands to send a Complete Record,
set time and date, set wind direction correction, set temperature
offsets, and reset all long term memory. Key Combo: Press and
hold
and
for 3 seconds to enter this mode.
NOTE TO SERIAL PORT USERS: It is essential to make the
correct Year setting (see Section VI); otherwise, date data from the
serial port may be incorrect.
38
XIII. Supplemental Wind Vane Calibration Adjustment
XIV. Supplemental Temperature Offset Adjustment
Your anemometer/wind vane has been factory-calibrated to
correctly indicate wind direction when installed per the instructions
on p. 17, and should not require recalibration. However, if you
wish to adjust wind direction readings after installation (to correct
a difference between display readings and actual wind direction)
without physically realigning the sensor, you may use the following
procedure.
Your outdoor and indoor temperature sensors encorporate
precision aged thermistors, which have been factory-calibrated to
correctly indicate temperature when installed per the instructions
on p. 18, and cannot be recalibrated. However, if you wish to
adjust temperature readings after installation (to correct a
difference between display readings and actual temperature, due
to various mounting location factors) without physically relocating
the sensor, you may use the following procedure.
1.
2.
3.
4.
5.
Perform when you have a fairly steady breeze from
a known direction.
Press
and
simultaneously to display the
wind vane correction constant (the keyboard
initially has a correction constant of zero).
Press and hold
or
to adjust the wind vane
correction constant. After approximately 3 seconds
the wind vane correction constant will start
changing. Increase the number if you want the
direction diamond on the display to move counterclockwise to match actual wind direction. Decrease
the number if you want the direction-indicating
diamond to move clockwise to match actual wind
direction.
Repeat Step 3 as necessary until the wind direction
is correctly displayed. Record the Wind Vane
Correction Constant below.
Press any function key to leave this operation and
retain the correction constant that is displayed.
NOTE: The correction constant is a number between 0 and 255.
Each digit represents approximately 1.4 angular degrees of
correction (360 ÷ 256) that is added to the uncorrected wind
direction.
Record your Wind Vane Correction Constant here_________
1.
2.
3.
4.
5.
Perform when you have a desired outdoor or indoor
temperature value from a reliable standard in close
proximity.
Press
and
simultaneously to display the
previously-entered outdoor temperature offset (or
,
, and
press
simultaneously to
display the previously-entered indoor temperature
offset). The keyboard initially has temperature
offsets of zero.
Press and hold
and
(or press and hold
,
, and
for indoor temp) to adjust the
temperature offset value. After approximately 3
seconds, the temperature offset value will start
changing. Press
or
repeatedly to adjust
the offset to equal the amount you wish to add or
subtract from the base temperature reading.
Record the Outdoor and Indoor Temperature Offset
values below, for future reference or re-input.
Press
to return to displaying the outdoor
temperature and retain the offset value. Allow
about 15 seconds for the displayed reading to
reflect the offset.
NOTE: The temperature offset is number from -50°F through
50°F (-27°C and 28°C). The default on keyboard power-up is
zero. The offset must be re-input after power-down has occurred.
Record your Outdoor Temperature Offset here_________
Record your Indoor Temperature Offset here_________
39
40
XV. ROUTINE MAINTENANCE
XVI. REPAIR AND EXCHANGE SERVICE
Care of Liquid Crystal Display
In Case of a Problem
If the keyboard display unit's LCD becomes dirty, clean with a soft
damp cloth only. Use no harsh or abrasive cleaners, as these will
permanently scratch the surface of the display. Do not spray any
liquids or cleaners directly on the display unit (especially the
keyboard buttons).
Your ULTIMETER 100 is designed to provide years of trouble free
operation. If the instrument completely stops operating, the cause
is probably inadequate power due to a faulty ac adapter, a faulty
connection to the adapter, or weak or missing battery when
operating from internal power. To correct the problem, disconnect
all batteries and external power, then reapply proper power.
Care of Anemometer/Wind Vane
The anemometer/wind vane is designed for years of reliable
operation, with no scheduled maintenance required. It features
bearings of durable acetal polymer and stainless steel balls, which
require no lubrication. The introduction of oils or dry graphite
lubricants into the bearings will tend to slow them down, resulting
in inaccurate wind speed readings.
If you believe the anemometer's rotor or wind vane are not turning
freely, you may remove them for inspection and cleaning as
follows: Grasping the vane and rotor at the same time (in the
palm of your hand), hook your fingers under the cup arms'
retaining clips and pull upward. After overcoming initial
resistance, the vane and rotor will be removed together. Remove
any foreign material (i.e. cobwebs, soot, pollen, etc.) from inside
the vane and rotor. The bearings may be cleaned using
compressed air.
Also, be sure to see page 13 (crossed wires in receptacles) and
page 8 ("Answers to Commonly-Asked Questions").
If a problem persists, please write or call our Technical Support
Department at 1-866-446-1216. We will do everything possible to
assure your satisfaction.
Repair and Exchange Service
Any defective ULTIMETER 100 may be repaired or exchanged for
a factory reconditioned instrument of the same type with like-new
performance. Under warranty there is no charge. Beyond
warranty the charges are modest, depending upon the condition of
the instrument.
Copyright 2006 Peet Bros. Company, Inc. All Rights Reserved.
Do not use oil or dry graphite lubricants.
In Case of Non-Responsive Keyboard
Sometimes an electrical storm or line power surge can cause the
keyboard to be disabled. To correct this condition, unplug the
junction box cable from the back of the keyboard display and
remove the 9-volt battery (however, be advised that all memories
and initial settings will be lost). Install the battery again and
reconnect the junction box cable.
NOTE:
If you have adjusted wind direction calibration or
entered temperature offsets (ref. page 39-40), it will be
necessary to re-enter them after performing this procedure.
Follow instructions on pp. 39-40. If the problem persists,
please inquire about our special 4-Line Static Electricity
Discharge Unit.
41
WARRANTY
Each ULTIMETER 100 carries a limited warranty against defects
of material or workmanship for a period of 1 year from the date of
initial purchase. Our responsibility under this warranty is limited to
the repair or replacement of instruments returned to us postage
paid, together with proof of purchase date. This warranty shall not
apply to instruments subjected to: improper installation, any
alterations, misuse, tampering, or unauthorized service. It does
not cover damage due to accidents, lightning, or other acts of
God. Neither we nor our representatives, distributors, nor dealers
shall be liable for any incidental or consequential damages. Some
states do not allow the exclusion or limitation of incidental or
consequential damages, so the above exclusion or limitation may
not apply to you. This warranty gives you specific legal rights, and
you may also have other rights which vary from state to state.
42
Outdoor Temperature
XVII. SPECIFICATIONS
Wind (PRO Anemometer)
Type:
Materials:
Cup Size:
Vane Size:
3-Cup Anemometer, all digital, magnetically-actuated
UV-Stabilized Polycarbonate, Acetal, 316 Stainless Steel
2.6” diameter (6.6cm), 5.3 in² (34cm²) cross-sectional area
12.9” (32.8cm) overall length, 3.5” (8.9cm) height, 13.8in²
(88.5 cm²) surface area
Resolution:
0.1 mph (0.1 km/h, 0.1 m/s, 0.1 knots)
Speed Range:
0.2 to 160.0 mph (0.3 to 257.0 km/h, 0.1 to 71.0 m/s, 0.2 to
139.0 knots)
Threshold:
1.5 mph (2.4 km/h, 0.6 m/s, 1.3 knots)
Update Interval: 0.5 seconds, typical (more often at speeds >5 mph)
Accuracy:
± 2 mph (± 3.2 km/h, ± 0.9 m/s, ± 1.7 knots) or ± 5%,
whichever is greater
Speed Data:
Current¹·², 1-min Peak and associated Direction², 1-min
Avg², 5-min Peak and associated Direction², 5-min Avg²,
Daily Peak and associated Direction¹·² (8 days’ Peaks
stored in keyboard memory), Long-Term Peak and
associated Direction¹·²
Direction:
Digital magnetic sensor, with 16-point analog "compass
rose" display¹, and numeric "degrees" display¹·² with 1°
resolution, ± 5% accuracy
Cable:
40 ft., 4-conductor, unshielded w/modular plug
Type:
Materials:
Resolution:
Range:
Accuracy:
Data:
Cable:
Wind Chill
Basis:
Index:
Resolution:
Range:
Accuracy:
Data:
Wind (Standard Anemometer)
Type:
Materials:
Cup Size:
Vane Size:
3-Cup Anemometer, all digital, magnetically-actuated
UV-Stabilized Polycarbonate, Acetal, 316 Stainless Steel
1.2” diameter (3.2cm), 1.2 in² (7.8cm²) cross-sectional area
6.2” (15.7cm) overall length, 2.8” (7.1cm) height, 6.8in²
(43.6 cm²) surface area
Resolution:
1 mph (1 km/h, 1 m/s, 1 knot)
Speed Range:
2 to 175 mph (3 to 282 km/h, 1 to 78 m/s, 2 to 152 knots)
Threshold:
3 mph (5 km/h, 1 m/s, 3 knots)
Update Interval: 1 second, typical (more often at speeds >10 mph)
Accuracy:
± 2 mph (± 3 km/h, ± 1 m/s, ± 2 knots) or ± 5%,
whichever is greater
Speed Data:
Current¹·², 1-min Peak and associated Direction², 1-min
Avg², 5-min Peak and associated Direction², 5-min Avg²,
Daily Peak and associated Direction¹·² (8 days’ Peaks
stored in keyboard memory), Long-Term Peak and
associated Direction¹·²
Direction:
16-point analog "compass rose" display¹, and numeric
"degrees" display¹·² w/1° resolution, ± 5% accuracy
Cable:
40 ft., 4-conductor, unshielded w/modular plug
¹Data displayed in keyboard LCD
²Data available in RS232 Output
¹·²Data displayed in LCD and available in RS232 Output
43
Precision aged Thermistor
Nickel-plated Steel Probe housing, 24-gauge copper cable
1°F¹ (0.1°C¹), 0.1°F² (0.1°C)²
-55°F to +150°F (-48°C to +66°C)
± 1°F (± 0.5°C)
Current¹·², Today’s High and Low w/time occurred (since
12:00am)¹·², Daily Highs and Lows w/time occurred¹·² (each
of previous 7 days), and Long Term Highs and Lows w/time
occurred¹·² (since user reset)
25 ft., 4-conductor w/modular plug termination
Derived from ambient air temperature and instantaneous
wind speed
US National Weather Service Wind Chill Index (adopted
November 2001, and valid for air temperatures below 50°F)
Note: by definition, above +50°F(+10°C), the Wind Chill
Temperature is identical to the ambient air temperature
1°F¹ (0.1°C¹), 0.1°F² (0.1°C)²
-99°F to +50°F (-72°C to +10°C) See note above
± 1°F (± 0.5°C)
Current¹·², Today’s Low w/time occurred (since 12:00am)¹·²,
Daily Lows w/time occurred¹·² (each of previous 7 days), and
Long Term Low w/time occurred¹·² (since user reset)
Indoor Temperature
Type:
Resolution:
Range:
Accuracy:
Data:
Precision aged Thermistor, located inside keyboard/display
1°F¹ (0.1°C¹), 0.1°F² (0.1°C)²
32°F to +110°F (0°C to 43°C)
± 1°F (± 0.5°C)
Current¹·², Today’s High and Low w/time occurred (since
12:00am)¹·², Daily Highs and Lows w/time occurred¹·² (each
of previous 7 days), and Long Term Highs and Lows w/time
occurred¹·² (since user reset)
Barometric Pressure (ULTIMETER 2100 only)
Type:
Resolution:
Range:
Accuracy:
Data:
Precision electronic absolute pressure transducer, located
within keyboard/display unit
0.1 hPa/mbar, 0.1 inHg 0.1 mmHg
931.3 to 1067.0 hPa/mbar, 27.5 to 31.5 inHg
698.5 to 800.0 mmHg
± 1.7 hPa/mbar, ± 0.05 inHg, ± 1.3 mmHg (at room
temperature)
Current¹·², 3-hr Change¹·², Daily High/Low¹·² (8 days),
Long-Term High/Low¹·²
¹Data displayed in keyboard LCD
²Data available in RS232 Output
¹·²Data displayed in LCD and available in RS232 Output
44
Rain Gauge, PRO (optional sensor)
Type:
Resolution:
Range:
Accuracy:
Data:
Units:
Cable:
Drop-counting electronic rain gauge, 3.2”dia (8.1cm) funnel
0.001 inches (.025mm), 0.01 inch (.25mm) increments
0.00 to 199.99 inches (0.00 to 1999.9mm) accumulation
± 5%, at rain rates up to 10” (254mm) per hour
Today’s Rainfall (since 12:00am)¹·², 3-hr Change¹·², Daily
Rainfall¹·² (each of previous 7 days), and Long Term
Rainfall¹·² (since user reset)
inches, millimeters
40 ft., 4-conductor w/modular plug termination
Rain Gauge, TB (optional sensor)
Type:
Resolution:
Range:
Accuracy:
Data:
Units:
Cable:
Electronic Tipping Bucket rain gauge, US NWS compliant
8”dia (20.3cm) funnel
0.01 inch (.25mm) increments
0.00 to 199.99 inches (0.00 to 1999.9mm) accumulation
± 1.5%, at rain rates up to 0.5” (13mm) per hour
± 5%, at rain rates up to 5” (127mm) per hour
Today’s Rainfall (since 12:00am)¹·², 3-hr Change¹·², Daily
Rainfall¹·² (each of previous 7 days), and Long Term
Rainfall¹·² (since user reset)
inches, millimeters
40 ft., 4-conductor w/modular plug termination
Rain Gauge, Other (optional sensor)
Type:
Increments:
Other manufacturers’ rain gauges can be interfaced
0.1", 0.01", 2.5mm, .25mm, 0.1mm (user selectable to
match rain gauge increments)
Outdoor Humidity/Temperature (optional sensor, ULTIMETER 2100
and ULTIMETER 800 only)
Type:
Materials:
Resolution:
Range:
Accuracy:
Dew Point:
Heat Index:
Data:
Cable:
Capacitative RH Sensor, Precision aged Thermistor
UV-stabilized ABS housing, 24-gauge copper cable,
conformal-coated circuit assembly, stainless steel vents
1°F¹ (0.1°C¹), 0.1°F² (0.1°C)², 1% R.H.
Temperature -55°F to +150°F (-48°C to +66°C),
Relative Humidity 0 to 100%
Temperature ± 1°F (± 0.5°C), R.H. ± 4%
derived from ambient temperature and relative humidity;
same units as temperature
derived from ambient temperature and relative humidity;
same units as temperature
Current Temp, R.H. Dew Point, Heat Index¹·², Today’s High
and Low Temp & R.H. w/time occurred (since 12:00am)¹·²,
Daily High and Low Temp & R.H. w/time occurred¹·² (each
of previous 7 days), and Long Term High and Low Temp &
R.H. w/time occurred¹·² (since user reset)
40 ft., 4-conductor w/modular plug termination
¹Data displayed in keyboard LCD
²Data available in RS232 Output
¹·²Data displayed in LCD and available in RS232 Output
45
Indoor Humidity (optional sensor, ULTIMETER 2100 and
ULTIMETER 800 only)
Type:
Materials:
Capacitative RH Sensor
UV-stabilized ABS housing, 24-gauge copper cable,
sintered plastic vents
Resolution:
1% R.H.
Range:
Relative Humidity 0 to 100%
Accuracy:
R.H. ± 4%
Data:
Current¹·², Today’s High and Low w/time occurred (since
12:00am)¹·², Daily Highs and Lows w/time occurred¹·² (each
of previous 7 days), and Long Term Highs and Lows w/time
occurred¹·² (since user reset)
Cable:
20 ft., 4-conductor w/modular plug termination
¹Data displayed in keyboard LCD
²Data available in RS232 Output
¹·²Data displayed in LCD and available in RS232 Output
Control Unit
Size:
6-3/4" x 2-3/4" x 1-1/4", Desk or Wall Mounted
Display:
Backlit Liquid Crystal
Numeral Size:
.5" high
Keypad:
16-button, illuminated buttons
Sensor Interface Jack: 10P10C (for 10-conductor cable to Junction Box)
Serial Port:
RS232 I/O port, RJ12 modular jack
Junction Box
Has receptacles for external power and all outside sensors.
RS232 Serial Data I/O port (RJ12 modular jack)
Built-in Static Electricity Discharge Protection
Size: 4" x 1-3/4" x 7/8"
Primary Power
AC adapter 12 v DC output
Back-up Power
Provision for 9-volt alkaline battery
Serial Data Output
RS232 compatible UART, user-selectable 2400 or 19200 baud, 8-N-1
Optional Accessories
• Indoor Temperature Sensor
• Self-emptying Rain Gauges - several models available, including heated
• The Weather Picture®
• WeatherText™ Tools PC Data Logger Kit
• The WeatherVox – a “speech synthesized” weather reporting device
Specifications necessarily subject to change without notice. Protected
under one or more of the following patents: US 05361633, US
05231876, US 05033402, US 05001929, and US 04969358
46
IX. AVAILABLE ACCESSORIES
We are continually developing new products and accessories to
make your ULTIMETER 100 Weather Station more interesting and
valuable to you. Some of our most popular items are:
THE WEATHER PICTURE
N
HI TEMP TODAY
76
HI WIND TODAY
24
W
R
TEMPERATURE
WIND SPEED
9
E
70
LO TEMP TODAY
54
WIND CHILL
64
RAIN TODAY
0 0.2 8
S
PEET BROS.
THE WEATHER PICTURE
Finally a big weather display you can read from across the
room - and handsome enough for any setting. THE WEATHER
PICTURE displays information it receives from an
ULTIMETER Weather Station, continuously providing and
updating all the vital weather data you have pre-selected,
without having to press a single key.
Its 8" compass rose and large 0.8" illuminated red numerals
are clearly visible, day and night. THE WEATHER PICTURE
is perfect for homes as well as schools, hotels, offices,
country clubs, stores, marinas, corporate lobbies, ski
lodges, emergency management stations, etc. - any place
needing up-to-the-second local weather data. Can be totally
customized to display any of over 60 weather functions on
each numeric display. Available in two frame styles (brushed
aluminum and traditional oak).
Indoor Temperature Sensor
Special modular design plugs into the side receptacle of the
ULTIMETER 100 keyboard - no additional cable required.
Duplex Cable
Allows both an indoor temperature sensor and a data logger
cable or other serial I/O device to be connected
simultaneously to the receptacle on the right side of the
keyboard. Or, allows a Weather Picture and other serial I/O
device to be connected simultaneously to the "i/o" receptacle
of the junction box.
WeatherText™ Tools PC Data Logger Kit
Special cable and software to record weather data on a
personal computer. Generate csv or text weather data files,
automatically email weather reports, and upload to website via
FTP. Display and analyze logged data in graphic or tabular
form using any popular spreadsheet program.
Splitter Junction Box
Allows the operation of a second keyboard/display unit, for
installation in another room or adjacent building.
Radio Frequency Interference Filter
If the ULTIMETER 100 is used near an extremely powerful
radio transmitter, its high and low temperature readings can be
affected. This would normally only be encountered in the
immediate vicinity of commercial radio or TV stations, or highpower ham radio transmitters. If you think you are
experiencing this problem, please inquire about our
inexpensive, 30 dB 4-line RFI filter.
For additional information about these or other accessories,
please contact your ULTIMETER 100 dealer or Peet Bros.
Company. We'll be happy to advise you of latest developments
and answer any questions you may have.
Self-Emptying Rain Gauge: TB, PRO, or Heated PRO
Automatically empties itself every 0.01" of rain and sends a
signal to the keyboard/display unit, which maintains NINE
independent rain totals: today's total rainfall, each of the
previous 7 day's totals, and long-term total (since last reset).
47
48