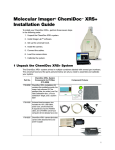
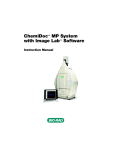
1
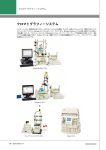
Imaging
7
3
9
6
13
2
9
4
9
8
6
16
17
8
11 2
14
2
5
11
12
11
4
8
6
11
8
5
9
7
14
17
5
11 3
13
2
15
4
1
5
6
15
15
2
7
4
8
1
3
12
11
9
3
18 1
2
6
3
3
3
1
5
8
5
8
3
8
9
2
5
15
16
2
7
9
2
16
8
15
8
6
2
6
16
13
5
7
8
11
11
9
15
5
15
2
17
9
1
14
16
7
4
2
9
14
11
15
3
11
1
18
6
11
7
11
15
12
13
7
15
ChemiDoc™ XRS+ Imager
Effortless and Accurate Imaging
and Analysis for Gels and Blots
Solve Complex Biological Questions
with Simple and Reliable Imaging
For more than two decades, Molecular Imager® systems
from Bio-Rad have been widely recognized and trusted
high-quality imaging instruments. Whether your research
includes routine imaging of chemiluminescent western
blots, SDS-PAGE, or PCR products for diagnostics
or therapeutic development — the ChemiDoc XRS+
imaging system will meet your needs. Designed for ease
of use and ability to support a wide array of applications,
it is a perfect fit for individual laboratories or multiuser
core facilities. Quality standards of engineering and
manufacturing make the system adaptable to academic
or biopharmaceutical laboratories. Thousands of
researchers over the years have published images
acquired with the ChemiDoc XRS system in journal
articles and grant proposals and established a record of
reliability and excellence for the system.
What the ChemiDoc XRS+ System
Can Do for You:
Automated workflow from image to results
Makes your blot and gel imaging and analysis quick
and effortless
■■
■■
■■ Allows any user to repeat the same workflow in
exactly the same way
Automated image capture
■■
■■
The ChemiDoc XRS+ system is flexible and easy to
use and supports other detection methods including
fluorescence and colorimetry. It is the ideal complement
to your electrophoresis, purification, and PCR systems,
enabling image analysis and documentation of western
blots, protein and DNA gels, and other sample types.
Produces beautiful pictures of your blots and gels
elivers quantitative analysis of your protein and
D
DNA samples
Automated image optimization
■■ Delivers image data that is always optimized
and reproducible without imaging artifacts
■■
The ChemiDoc XRS+ system enables direct digital
visualization of chemiluminescent western blots
for accurate images of accumulated signal from
the chemiluminescent reaction. It provides reliable
quantitative data for characterizing your
samples reproducibly.
Eliminates the need for training
liminates the need to use costly and
E
undependable X-ray film techniques
Automated image analysis
Produces reports with data organized
the way you want
■■
■■ Minimizes time from lab work
to presentations
Immun-Star™ WesternC™
chemiluminescent detection
ChemiDoc XRS+ System Applications
Nucleic Acid Protein Gel
ElectrophoresisElectrophoresis Blotting
Ethidium bromide
Coomassie Blue
Chemiluminescent
SYBR® Green
Copper stain
Colorimetric
SYBR® Safe
Zinc stain
Qdots 525
SYBR® Gold
Flamingo™ fluorescent gel stain
SYBR® Safe stain
Qdots 565
GelGreenOriole™ stain
Qdots 625
GelRed
Silver stain
CY2
Fast Blast™ DNA stain
Coomassie Fluor Orange
Alexa Fluor 488
SYPRO Ruby
DyLight 488
KryptonFluorescein
Coomassie Brilliant Blue
R-250 stain
Oriole™ stain
Qdot blot
ChemiDoc XRS+ System Is Powered
with Image Lab™ Software
Fast Results from a Completely
Automated Workflow
The ChemiDoc XRS+ system is controlled by Image Lab
software to automatically and reproducibly generate blot
and gel images. Image Lab software is fast, taking you from
blot to printed results in seconds. Your results are visible
with a single click of the mouse.
Image Lab software eliminates the guesswork in imaging.
You won’t have to perform tedious repetitive steps to find
the right focus setting. You won’t have to guess which
exposure times will best visualize the bands of interest.
Image calculations and corrections are done automatically
for your application. Whether you are working with protein
gels, nucleic acid gels, blots, or your own customized
imaging application, the ChemiDoc XRS+ system will select
the proper settings for optimum detection conditions of the
stain, label, or light-emitting substrate in use.
Automated workflow for any application.
You also won’t need to set aside time for training new users;
the system and the software are easy to use and work
together from setup to finish. Imaging and image analysis
can become the simplest work in the laboratory.
Simple and Reproducible Image Capture
Place your gel or blot on the ChemiDoc XRS+ imager’s
sample tray and run your protocol: Your work is done in
just one step. Design and save protocols for the imaging
steps in your experiments and Image Lab software
will run the protocols exactly the same way every time.
The protocol feature negates variability in results due to
different people operating the imaging system. When a
new project is related to an existing one, you can reuse
the previously created protocol by revising its parameters
and renaming it. Image Lab software lets you devote your
valuable time to research and discovery instead of to
wondering if you used your imaging system properly.
Results and Reports
In addition to printing a picture of your gel or blot for your
records, Image Lab software creates and prints reports
of your experimental data. Any part of the report can be
copied into popular document processing applications
such as Adobe Acrobat and Microsoft Word,
PowerPoint, or Excel files. To include a 3-D view of your
gel or blot, copy it using the Snapshot tool, and paste it
into your presentation slide. High quality, good-looking
reports are easy to produce with the combined power of
the ChemiDoc XRS+ system and Image Lab software.
Lane profiles depict band intensity and represent quantities of sample
components separated in a gel.
Tutorials
With Image Lab software, you don’t need previous
imaging experience to produce optimal gel and blot
images. Detailed tutorials are accessible via the toolbar
and start-up page to acquaint you with all of the Image
Lab software capabilities.
It’s that easy to use Image Lab to generate the data and
reports that you need. Please look at the other tutorials for
more detailed explanations of other Image Lab features.
When an analysis parameter is changed, the results
tables are updated instantly to reflect the new data.
Tutorials for novice users.
12
3
9
5
8
2
8
3
9
2
11
1
18
Immunodetection
6
11
Sophisticated Software 3
1
Automated workflows — the entire workflow (image capture,
11 is recorded in a protocol file. Protocols15
results, report)
can
be edited, resaved, reused, and shared among multiple
13
7
users. Allows 100% repeatability of the workflow and
ensures optimized image data and analysis specific to the
selected application.
— Image Lab software’s proprietary algorithms
calibrate the system at setup for an automatic focused
image at any zoom level. Eliminates user error and the need
for manual camera adjustments to obtain an image, leading
to higher image quality.
Auto focus
Auto camera aperture control — you do not have to
focus, nor adjust aperture settings. Only adjust the
zoom to position sample. Allows you to quickly image
across different applications with different aperture
setting requirements.
Flat fielding — flat fielding calibrations are performed for
each application automatically. Delivers image data that is
always optimized and reproducible without imaging artifacts
for superior image uniformity and quantification.
Increased image resolution — decreases pixelation when
images are cropped or zoomed. Allows smooth, clean
images at any zoom level.
7
12
15
Chemiluminescent Detection
Use the signal accumulation mode (SAM) of the
ChemiDoc XRS+ system to record the time course of
development of the chemiluminescent reaction.
■■ Eliminate the guesswork often involved with single event film capture of blot signals
■■
Simplify chemiluminescent digital imaging
During the live acquisition, the ChemiDoc XRS+
system records progressive image development, allowing
you to:
■■ Visualize the accumulated chemiluminescent signal at
multiple time points and capture the image
■■ Customize acquisition time and the number of
images taken
■■ Save and analyze each image while the next image is
being captured, even before the series is complete
Automatic digital capture of chemiluminescent blot signals
is efficient.
■■ Eliminate the chemical use and disposal problems
involved with film developing
■■ The self-contained lighttight enclosure means you don’t
need a separate darkroom
■■ For a more detailed comparison of digital detection with
the ChemiDoc XRS+ system and analog detection with
film, refer to bulletin 5809.
Limit of Detection of Film and ChemiDoc XRS+ System
300,000
ChemiDoc XRS+ system
250,000
Chemiluminescence, RU
16
6
5
X-ray film
200,000
150,000
100,000
50,000
0
500
250
125 62.5 31.25 15.62 7.81
3.9
1.95 0.98
Human serum volume, pL
X-ray film (300 sec exposure)
Images can be zoomed in without losing resolution.
ChemiDoc XRS+ system (60 sec exposure)
— no need to export
images to another program such as Photoshop image
editing software to change the dpi before importing for
publication. You can now define your desired resolution
within Image Lab software.
Comparison of chemiluminescent western blot detection on X-ray film
and with the ChemiDoc XRS+ system. Blots of twofold serial dilutions
of human serum were probed with rabbit anti-human transferrin polyclonal
antibodies. A 1/1,000 dilution of human serum was used to make the twofold
serial dilutions. A 300 sec exposure on film does not reach the same limit of
detection that is reached by a 60 sec exposure in the ChemiDoc XRS+ system.
Greater export functionality
Accurate Quantitation Visualized
The ChemiDoc XRS+ system can perform accurate
quantitative detection with high resolution and sensitivity
on a wide variety of samples.
A
Chemiluminescent and Colorimetric Detection
Combined in a Single Blot
C
Chemiluminescence
D
Visible marker
Chemiluminescence image from
sample merged with visible marker
A
1.5
3.0
6.0
30
40
100
200
370
750
B
C
Chemiluminescent ELISA arrays. The
Quansys Biosciences Q-Plex array has
16 distinct capture antibodies bound to
each well of a 96-well plate. The attributes
of high resolution and sensitivity enable
the ChemiDoc XRS+ system to image the
entire plate (panel A) while resolving each
array spot (panel B) with the dynamic
range (panel C) to provide quantitative
data (panel D).
Multifluorescent Western Blot
1,500
Quantitative dynamic range and visualization tools. A, the ChemiDoc XRS+
system detects a wide range of sample concentrations without saturating the
most concentrated band, enabling linear quantitation. A variety of visualization
tools are provided for sample verification. B, the 3-D viewer shows the distinct
peaks of the most concentrated band as well as the faintest band. C, the lane
profiles provide quick comparison of expression levels from each lane. D, the
volume regression curve shows a correlation coefficient R2 of 0.986909
confirming linear data over the entire range of sample detection.
Chemiluminescent sample detection and visible markers. Visible markers
are commonly used to monitor problems with SDS-PAGE and blot transfer. To
determine the molecular weights, users trace the pattern of the visible marker
from the blot to film. This adds additional steps and can possibly introduce
errors. The ChemiDoc XRS+ system images the chemiluminescent samples
and visible markers to provide a digital record; the images are then merged for
molecular weight estimation.
15
B
D
Multifluorescent western blot detection of maltose binding protein
(MBP) and Profinity eXact™ fusion-tagged MBP bands using Qdot 625
and Qdot 525 fluorescent conjugated secondary antibodies (Invitrogen
Corp.), respectively, imaged with the ChemiDoc XRS+ system. The
blot was imaged with excitation via UV, and separate images were taken by
switching between 520/30 (Qdot 525) and 630/30 (Qdot 625) filters installed
in the ChemiDoc XRS+ imager. Multifluorescent western blotting enables
detection of two antibody-specific proteins at once, removing the variability
involved with two blots or the loss of protein with stripping. For more
information, refer to bulletin 5792.
Verification and Quantitative Analysis
Protein Analysis
ChemiDoc XRS+ systems are often incorporated into
sample preparation and sample quantitation workflows.
Ethidium Bromide and SYBR ® Safe DNA Stain Detection
18,000
SYBR ® Safe and
XcitaBlue conversion
screen
EtBr and UV light
16,000
Fluorescence, RU
14,000
12,000
10,000
Protein gels stained with Coomassie Blue stain (left) and silver stain
(right). Documentation of protein gels for lab notebooks or sample analysis,
including protein purity and concentration assessment for differential protein
expression studies or to monitor gene modulation products, is supported by
the array of analysis tools in the ChemiDoc XRS+ system. The gel stained
with silver stain shows salmon muscle, soybean, and rat brain extracts,
protein mixtures, and E. coli extracts compared with Precision Plus Protein™
Unstained standards.
8,000
6,000
4,000
2,000
0
51.225.6 12.8 6.4 3.2 1.62 0.8 0.4 0.2 0.1
Sample load, ng
Protein gels fluorescence-stained with Oriole stain (left) and Flamingo
fluorescent gel stain (right). Achieve higher levels of sensitivity with
fluorescent stains to differentiate proteins with low expression. Resolve
closely spaced spots or bands for protein profiling, quantitation, and
characterization.
Molecular Biology
Gel electrophoresis remains an important tool for
quantitative analysis of complex protein and nucleic acid
samples. Applications include nucleic acid isolation or
amplification for molecular cloning techniques, nucleic
acid quality evaluation prior to quantitative PCR, gene
silencing, gene modulation, and gene expression.
ChemiDoc XRS+ systems are suitable for laboratories
engaged in RNAi analysis, molecular diagnostics,
epigenetics, pharmacogenomics, and forensic testing of
genomic DNA.
An alternative to UV illumination to better preserve DNA samples.
Top, serial dilutions of EtBr-stained precision molecular mass ruler
(Bio-Rad Laboratories, Inc.) on agarose gel imaged with UV light; bottom,
serially diluted precision molecular mass ruler stained with SYBR® Safe
stain on agarose gel imaged with XcitaBlue™ conversion screen. There
is no loss in sensitivity when a combination of SYBR® Safe nucleic acid
fluorescent stain and less harmful blue excitation is used instead of UVexcitable EtBr. The image of the gel stained with SYBR® Safe stain was
taken using the XcitaBlue conversion screen and a filter for SYBR® Safe
stain and GFP. Less harmful detection methods better preserve samples
for downstream uses such as cloning.
Specifications
Automation Capabilities
Workflow automated selection
Application driven; user selected or recalled by a protocol
Workflow automated executionControlled by a protocol via application specific setup for image area, illumination source, filter,
analysis, and reporting
Workflow reproducibility100% repeatability via recallable protocols; from image capture to quantitative analysis and reports
Autofocus (patent pending)
Precalibrated focus for any zoom setting or sample height
Image flat fielding* Dynamic; precalibrated and optimized for every application
Autoexposure
2 user-defined modes (intense or faint bands)
Hardware Specifications
Maximum sample size
28 x 36 cm
Maximum image area
25 x 26 cm
Excitation sourceTrans-UV and epi-white are standard (302 nm included, with 254 and 365 nm available as options);
optional trans-white, self-powered or conversion screen; optional XcitaBlue UV/blue conversion screen
Illumination control5 modes (trans-UV, epi-white, and no illumination for chemiluminescence are standard); trans-white
and XcitaBlue conversion screens are options
Detector
Supercooled CCD
Image resolution (H x V)
>4 megapixels
Pixel size (H x V)
6.45 x 6.45 µm
Cooling system
Peltier
Camera cooling temperature
–30°C controlled
Filter holder
3 positions (2 for filters, 1 without filter, for chemiluminescence)
Emission filters
1 included (standard), 3 optional
Dynamic range
>4.0 orders of magnitude
Pixel density (gray levels)
65,535
Instrument size (L x W x H)
36 x 60 x 96 cm
Instrument weight 32 kg
Operating Ranges
Operating voltage
Operating temperature
Operating humidity
110/115/230 V AC nominal
10–28°C (21°C recommended)
<70% noncondensing
* U.S. patent 5,951,838.
Catalog #
Description
170-8265Molecular Imager ® ChemiDoc™ XRS+ System with
Image Lab Software, PC or Mac, includes darkroom, UV transilluminator, epi-white illumination, camera,
power supply, cables, Image Lab software
170-8075
Filter 560DF50 62 mm, for SYBR® Safe/Cy3/rhodamine
170-8076
Filter 630BP30 62 mm, for SYPRO Ruby/Texas Red
170-8077
Filter 480BP70 62 mm, for Hoechst/coumarin
Accessories
170-7950
170-8098
254 nm UV Lamps, pkg of 6
White Light Transilluminator
170-6887
365 nm UV Lamps, pkg of 6
170-8001
White Light Conversion Screen
170-8097
Standard 302 nm UV Lamps, pkg of 6
Catalog #
Description
170-8182XcitaBlue Conversion Screen, includes view goggles;
blue conversion screen for viewing SYBR® Green,
SYBR® Safe, GFP, Flamingo, and other fluorescent
gel stains
170-8089
Mitsubishi P93DW Printer
170-7581
Mitsubishi Thermal Printer Paper, 4 rolls
170-8184
Gel Alignment Templates, pkg of 3
170-8183XcitaBlue Conversion Screen and Filter, includes view
goggles and SYBR® Safe filter (170-8075, 560DF50);
blue conversion screen for viewing SYBR® Green,
SYBR® Safe, and other fluorescent gel stains
Software
170-9690*
Image Lab Software, PC or Mac, for automated image
capture, optimization, and 1-D data analysis
170-8299
Image Lab Upgrade for ChemiDoc XRS+ System,
includes Image Lab software, focus calibration target,
flat fielding disk, installation guide, and user manual
170-8074
Filter 520DF30 62 mm, for SYBR® Green/GFP/SYBR®
Gold/fluorescein
* Included with the imaging system.
Acrobat and Photoshop are trademarks of Adobe Systems Incorporated. Alexa Fluor, Coomassie Fluor Orange, Qdot, SYBR®, SYPRO, and
Texas Red are trademarks of Invitrogen Corp. Coomassie is a trademark of BASF Aktiengesellschaft. Cy is a trademark of GE Healthcare group
companies. DyLight and Krypton are trademarks of Thermo Fisher Scientific. Excel, Microsoft, and PowerPoint are trademarks of Microsoft
Corporation. GelGreen and GelRed are trademarks of Biotium, Inc. Hoechst is a trademark of Hoechst GmbH. Mac is a trademark of Apple Inc.
Mitsubishi is a trademark of Mitsubishi Companies. Q-Plex is a trademark of Quansys Biosciences.
Practice of the polymerase chain reaction (PCR) may require a license.
Precision Plus Protein standards are sold under license from Life Technologies Corporation, Carlsbad, CA, for use only by the buyer of the product.
The buyer is not authorized to sell or resell this product or its components.
Profinity eXact vectors, tags, and resins are exclusively licensed under patent rights of Potomac Affinity Proteins. This product is intended for research
purposes only. For commercial applications or manufacturing using these products, commercial licenses can be obtained by contacting the Life Science
Group Chromatography Marketing Manager, Bio-Rad Laboratories, Inc., 6000 Alfred Nobel Drive, Hercules, CA 94547, Telephone 1-800-4BIORAD (1-800-424-6723).
Bio-Rad
Laboratories, Inc.
Web site www.bio-rad.com USA 800 424 6723 Australia 61 2 9914 2800 Austria 01 877 89 01 Belgium 09 385 55 11 Brazil 55 31 3689 6600
Canada 905 364 3435 China 86 20 8732 2339 Czech Republic 420 241 430 532 Denmark 44 52 10 00 Finland 09 804 22 00 France 01 47 95 69 65
Germany 089 31 884 0 Greece 30 210 777 4396 Hong Kong 852 2789 3300 Hungary 36 1 459 6100 India 91 124 4029300 Israel 03 963 6050
Italy 39 02 216091 Japan 03 6361 7000 Korea 82 2 3473 4460 Mexico 52 555 488 7670 The Netherlands 0318 540666 New Zealand 0508 805 500
Norway 23 38 41 30 Poland 48 22 331 99 99 Portugal 351 21 472 7700 Russia 7 495 721 14 04 Singapore 65 6415 3188 South Africa 27 861 246 723
Spain 34 91 590 5200 Sweden 08 555 12700 Switzerland 061 717 95 55 Taiwan 886 2 2578 7189 United Kingdom 020 8328 2000
Life Science
Group
Bulletin 5837 Rev C
US/EG
10-1694
1110
Sig 1109