1
VeriPlexTM Human Interferon
9-Plex ELISA Kit
Catalog No. 51500
Store all components at 2 - 8°C
We recommend reading the protocol in its entirety prior
to use. First time users must pay particular attention to
pages 12-23 and read the manual of the Q-View™
imager and software available for download at
www.quansysbio.com.
Sold under license from Pestka Biomedical Laboratories, Inc. d/b/a
PBL Assay Science. For research use only.
Not for diagnostic or clinical use in, or administration to, humans. Not for resale in
original or any modified form, including inclusion in a kit, for any purpose.
Not for use in the preparation of any commercial product.
©
Copyright 2013 Pestka Biomedical Laboratories, Inc. All rights reserved.
TABLE OF CONTENTS
PART
TITLE
A
Introduction………….……………………………...3
B
Assay Procedure—Quick Reference…………....7
C
Preparation of Reagents…………………...….….8
D
Assay Procedure…………………………………..9
E
1
2
3
4
5
6
7
Imaging Procedure
Q-View™ Imager-Acquiring an Image…….....12
Q-View™ Software-Importing an Image……..14
Alpha Innotech HD2 Camera………………….15
Alpha Innotech FC2 Camera………………….16
Bio-Rad VERSADOC 4000 Camera…….……18
Bio-Rad CHEMIDOC XRS Camera……….….20
FUJIFILM LAS-3000 Camera………………....22
1
2
3
Product Performance Characterization
Matrix Studies…………………………………..24
Cross-Reactivity Studies………………………29
Additional………………………………….…….31
F
G
PAGE
References…………………………………….…..32
*Q-Plex™ is a registered trademark of Quansys Biosciences.
51500 Rev. 05
2
A. INTRODUCTION
Interferons (IFNs) are a group of cytokines which exhibit
pleiotropic activities that play major roles in both innate and
adaptive immunity. There are three types of interferons, namely
type I, II and III. Type I IFNs consist of multiple Interferon Alpha
(IFN-α) genes, at least one Interferon Beta (IFN-β) gene, and
one Interferon Omega (IFN-ω) gene in most vertebrates.1 IFNα, IFN-β and IFN-ω are released by a host of mammalian cells
on exposure to viruses or double-stranded RNAs,2 and on
triggering of Toll-like receptors (TLR3/4/7/8/9) by CPG DNAs
and lipopolysaccharides (LPS). Upon binding to their cellular
receptor chains IFN-α-Rc1 and IFN-α-Rc2, Type I IFNs signal
through the Jak-Stat pathway to further elicit a host of antiviral
actions including production of protein kinase A and 2’5’
Oligoadenylate Synthetase (OAS).2 Type I interferons are used
therapeutically to treat viral infections, cancers and autoimmune disorders. IFN-α is used therapeutically to treat
hepatitis B and hepatitis C infections. Additionally, IFN-α is
known to have significant biological activity in inhibition of
proliferation of multiple cancers.3 IFN-β is used therapeutically
to treat multiple sclerosis. 4 Type II IFN consists of Interferon
Gamma (IFN-γ). IFN-γ is produced by a host of immune cells lymphocytes, CD4+ T cells, NK cells and such antigen
presenting cells (APCs) as macrophages, monocytes and
dendritic cells.5 IFN-γ uses receptor chains IFN-γ-R1 and IFN-γR2. IFN-γ, a homodimer, binds two IFN-γ-R1 subunits, thereby
generating binding sites for two IFN-γ-R2 chains, a process that
subsequently triggers intracellular signaling and activation of
Jak1, Jak2 and Stat1 that in turn induce genes with the γ
activation sequence in the promoter. 2,6 IFN-γ plays a role in
several immunomodulatory functions including up-regulation of
pathogen recognition, antiviral action, activation of microbicidal
functions in immune cells and leukocyte trafficking. 5 The newly
3
characterized Type III IFNs consist of Interferon Lambda 1 (IFN
-λ1 or IL-29), Interferon Lambda 2 (IFN-λ2 or IL-28A) and
Interferon Lambda 3 (IFN-λ3 or IL-28B). The members of the
Type III family share close homology to one another with IFN-λ2
and IFN-λ3 sharing 96% amino acid identity and with IFN-λ1
sharing 81% homology with IFN-λ2 and IFN-λ3.7 Type III IFNs
are functionally similar to Type I IFNs and are known to have
similar downstream effects, i.e. Type III IFNs promote the
phosphorylation on STAT1 and STAT2, induce the ISRE3
complex, elevate OAS and Type I IFNs induce Myxovirus
resistance protein A (MxA) expression and exhibit antiviral
activity in vitro;10 however, Type III IFNs and their heterodimeric
receptor subunits-CRF2-12(IFN-λR1)9 and CRF2-4 (IL-10R2)9
are known to be more prominent in cells of the epithelial
tissues.8
IFN-λ1 is known to modulate the development of Th1/Th2
cells.10 IFN-λ2 has been shown to inhibit the replication of
hepatitis B and hepatitis C virus in murine hepatocyte cell
lines11 and IFN-λ1 is being explored as a potential therapeutic
for hepatitis C.12
The VeriPlexTM Human Interferon 9-Plex ELISA has been
developed to simultaneously detect IFN-α, IFN-β, IFN-γ, IFN-ω,
IFN-λ1/2/3 and other key pro-inflammatory cytokines released
upstream and downstream of interferon signaling, including
TNF-α, IP-10, IL-1α and IL-6. This assay has been developed
using the Q-PlexTM array spotting technology, in which capture
antibodies to the different analytes are spotted in a single well
in a 3x3 array. The functional format of the assay is as that of a
sandwich ELISA with a chemiluminiscent output. The assay is
compatible with multiple matrices including tissue culture
media, human serum, human plasma and buffers.
4
MATERIALS PROVIDED
• Human Interferon Multiplex 96-Well microtiter plate
• Plate sealers
• Wash Solution Concentrate
• Human Interferon Multiplex Antigen Standard
• Sample Diluent
• Assay Diluent
• Human Interferon Multiplex Detection Mix
• HRP Concentrate
• Substrate A
• Substrate B
• Diluent Additive II
• Diluent Additive III
ADDITIONAL MATERIALS REQUIRED
(NOT PROVIDED)
• Variable volume microtiter pipettes
• Adjustable multichannel pipette (50-300 μl)
• Reagent reservoirs
• Wash bottle or plate washing system
• Distilled or deionized water
• Serological pipettes (1, 5, 10 or 25 ml)
• Disposable pipette tips (polypropylene)
• Plate shaker
• One of the following cameras/imagers:
• Q-View™ Imager (recommended)
• Alpha Innotech HD2 and FC2 Camera
• Bio-Rad VERSADOC 4000 Camera
• Bio-Rad CHEMIDOC XRS Camera
• Fujifilm LAS 3000 Camera
• KODAK 4000MM Camera
• Q-View™ software
5
Specifications: This kit quantitates Human Interferon Alpha (IFN
-α), Human Interferon Beta (IFN-β), Human Interferon Gamma
(IFN-γ), Human Interferon Omega (IFN-ω), Human Interferon
Lambda (IFN-λ 1, 2 and 3), Human Tumor Necrosis FactorAlpha (TNF-α), Human Interleukin-6 (IL-6), Human Interferon
Gamma inducible protein (IP-10) and Human Interleukin 1
Alpha (IL-1α) in sera, plasma and tissue culture media by
sandwich enzyme linked immunosorbent assay (ELISA) using
the Q-Plex™ Multiplex technology.
Detection Ranges: Refer to the supplied lot specific Certificate
of Analysis
Speed: Incubation time, 3 hr 15 min
Specificity: The IFN-λ antigen in the Standard is an equal mix of
IFN-λ1 and λ2. The IFN-λ antibody pair in the product detects
IFN-λ1, λ2 and λ3, although IFN-λ2 and λ3 are detected less
effectively.
Rhesus monkey IFN-α A, Cynomolgus monkey IFN-α, and
Cynomolgus monkey IFN-β are detected by the product. Mouse
IFN-β, Mouse IFN-γ and Mouse IFN-λ3 do not cross react with
the product. 10 µg/ml of Mouse IFN-α demonstrated 0.004%
cross reactivity. Refer to pages 29-31 for details.
Storage Conditions/Comments: For retention of full activity, all
reagents should be kept at 2-8ºC in the dark when not in use.
Diluents and buffer reagents should be warmed to room
temperature (RT), 22-25ºC, before use. We have not fully
evaluated the long term stability of reconstituted materials in
liquid or frozen form.
6
B. ASSAY PROCEDURE - QUICK REFERENCE
Total Time: 3 hr, 15 min
1) Add 50 μl Assay Diluent
2) Add 50 μl Standard,
Test Sample or Blank
Incubate 2 hrs (shake at 500 rpm)
Aspirate and wash 3x (30 second soak between washes)
Add 50 μl Reconstituted
Detection Mix
Incubate 1 hr (shake at 500 rpm)
Aspirate and wash 3x (30 second soak between washes)
Add 50 μl HRP Concentrate
Incubate 15 min in the dark (shake at 500 rpm)
Aspirate and wash 6x (30 second soak between washes)
Add 50 μl Mix of
Substrate A and B
Image plate within 20 min
Note: ALL
incubations are at
room temperature
(22 - 25ºC)
7
C. PREPARATION OF REAGENTS
Supplied Human IFN Multiplex Antigen Standard, Human IFN
Multiplex Detection Mix and HRP Concentrate should be kept
on wet ice.
Wash Solution: The Wash Solution Concentrate may contain
crystals. Place the bottle in a warm water bath and gently mix
until completely dissolved. Prepare a 1:20 working wash
solution (e.g. Add 50 ml of Wash Solution Concentrate to 950
ml of distilled or deionized water and mix thoroughly). Diluted
Wash Solution can be stored at RT (22-25oC) when not in use.
Standard: Reconstitute the supplied Human IFN Multiplex
Antigen Standard by adding the volume of Sample Diluent
indicated in the lot specific Certificate of Analysis. Mix gently
until the Antigen Mix is completely dissolved and store on wet
ice until use. Do not vortex. Do not introduce bubbles.
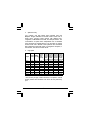
Standard Curve Preparation: Label seven polypropylene
tubes (S1-S7). Prepare a 3 fold dilution series using the
reconstituted Antigen Standard and Sample Diluent as per
Figure 1. Mix thoroughly between each dilution by pipeting 5x.
The high point (S1) in the series is the reconstituted Antigen
Standard.
Assay Diluent: Reconstitute the Assay Diluent as per
instructions in the lot specific Certificate of Analysis (COA)
using distilled or deionized water, Diluent Additive II and
Diluent Additive III. Do not vortex. Store at RT (22-25oC) until
use in step 1 of the Assay Procedure.
Note: Solution may appear cloudy and contain bubbles.
8
Figure 1: 7-Point Standard Curve Prepared in Sample Diluent
180 µl
Reconstituted
Antigen Standard
Sample Dilution Label
Sample Diluent (µl)
S1
S2
S3
S4
S5
S6
S7
Blank
0
120
120
120
120
120
120
120
Detection Mix: Reconstitute the Human IFN Multiplex
Detection Mix in 6 ml distilled or deionized water. Mix gently
until the mix is completely reconstituted. Store on ice until use
in step 2 of the Assay Procedure.
D. ASSAY PROCEDURE
All incubations should be performed in a closed chamber at RT
(22-25ºC), keeping the plate away from drafts and other
temperature fluctuations. Use a plate shaker at 500 rpm where
indicated. The shaking speed must be such that bubbles are
not formed during shaking. Use plate sealers to cover the
plates as directed. During all wash steps, remove contents of
plate by inverting and shaking over a sink and blotting the plate
on lint-free absorbent paper; tap the plate. It is recommended
that the plate be soaked in Wash Solution for 30 seconds
between washes. Wash each well with a minimum of 300 μl of
diluted Wash Solution for each wash step. See Preparation of
Reagents for details on dilution of concentrated solutions.
9
1. Standards and Test Samples:
1a. Adding Assay Diluent:
- Add 50 µl of Assay Diluent to each well
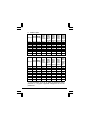
We recommend running the standard, blanks and test samples
in duplicate. Refer to the model plate setup in Figure 2. The
highest dilution point of the standard (S1) must be in wells
A1 and A2.
1b. Adding Standards, Blanks and Test Samples:
- Add 50 µl of Standard to wells designated as Standard
- Add 50 µl of Blanks (Sample Diluent or sample matrix) to
wells designated as Blanks
- Add 50 µl Test Samples to wells designated as Test
Samples
Cover with plate sealer and shake plate at 500 rpm at RT (2225ºC) for 2 hours.
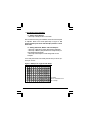
Figure 2: Example of a Typical Plate Setup
B = Blank
S1-S7 = Standard Curve
Sa = Sample
10
After 2 hours, empty the contents of the plate and wash the
wells three times with at least 300 µl of working Wash Solution
(refer to Preparation of Reagents) per well (30 second soak
recommended between washes).
2. Detection Antibody: Add 50 μl of reconstituted Detection
Mix (refer to Preparation of Reagents) to each well. Cover with
plate sealer and shake plate at 500 rpm at RT (22-25ºC) for 1
hour.
During this incubation, prepare a Substrate Mix by mixing
equal volumes of Substrate A and Substrate B. Use full
contents of Substrate A and Substrate B. Store the mix at
RT (22-25ºC), in the dark, until use in Step 4. The mix must
be prepared at least 10 minutes prior to use in Step 4.
After 1 hour, empty the contents of the plate and wash the
wells three times with at least 300 µl of working Wash Solution
per well (30 second soak recommended between washes).
3. HRP Concentrate: Add 50 μl of supplied HRP Concentrate
to each well. Cover with plate sealer and shake, in the dark, at
500 rpm at RT (22-25ºC) for 15 minutes.
After 15 minutes, empty the contents of the plate and wash the
wells six times with at least 300 µl of working Wash Solution
per well (30 second soak recommended between washes).
4. Substrate Mix and Imaging: Add 50 μl of the prepared
Substrate Mix to each well.
Image the plate within 20 minutes of adding the Substrate
Mix. Refer to pg. 12 and onwards for detailed instructions
on imaging the plate using different imagers.
11
E. IMAGING PROCEDURE
1.
Quansys Q-View™ Imager—Acquiring an Image
These are basic instructions for using the Q-View™ Imager
and Software to image your plate only. A comprehensive
software manual for use of Q-View™ software is available.
A full version of the Quansys Q-View™ Software is available
for free. The download is available at http://
www.quansysbio.com/q-view-software.
The user manual for the software can be found under Manuals
in the Support section.
A.
Select New Project if starting a new project and save
under a new name. Otherwise, select Open Project to
browse and select a previous project. The new image will
not overwrite prior images in the project.
B. Ensure that the Q-View™ Imager is connected to the
computer. The connection status can be confirmed under
Settings -> Administration -> Manage Imagers. If needed,
click on Refresh.
C. Optional. Uncheck the box “Discard sub-images after
stacking is complete” under Settings -> Preferences in
order to see images of different exposure times after the
imaging process is complete. Otherwise, a stacked image
will be displayed.
D. Optional. It is recommended to periodically calibrate the Q
-View™ Imager. To calibrate the imager, select Settings ->
Administration -> Manage Imagers. Ensure that there is no
plate in the plate housing slot in the imager and that the
housing door is closed. Select Calibrate.
E. Optional. If the imager has not been focused previously,
place a Quansys focusing plate in the imager (do not close
12
the plate housing door) and adjust the focus (under
Settings -> Administration -> Manage Imagers) until the
image is clear. Remove the focusing plate. Close the
Manage Imagers section.
Q-ViewTM Version 3.01
F. Select Acquire Image.
G. Ensure that the Q-View™ Imager is recognized. If not,
follow step B. and click on Refresh.
H. Select Image Processing method, either Legacy (similar to
previous versions of Q-View™) or Standard (new feature
in Q-View™).
I. Enter Exposure Time(s). Recommended exposure times
are 30, 60 and 180 seconds for the Legacy setting or 270
seconds for Standard Image Processing. When using
Legacy, each exposure will have a different image. The
software will also display a stacked image.
J. Enter the names of the image(s). For example, Expt1 30
sec, Expt1 60 sec and Expt1 180 sec.
K. Place the plate to be read in the plate housing slot, close
13
L.
the plate housing door and select Capture Image(s). The
imaging should begin. Once acquired, the image will
appear in the Q-View™ Software main screen.
If the image is needed for use in other programs, save the
acquired image(s) by clicking Export. Export the image(s)
as TIFF file(s).
Exposure Times: These times can be modified to meet your
specific assay, but 30, 60 and 180 second exposure times
(Legacy) or 270 second exposure time (Standard) are
recommended for most assays. Once set, one can exit the
Exposure Times dialog by mousing outside of the dialog box.
Standard Image Acquisition Option
Legacy Image Acquisition Option
2. Q-View™ Software—Importing an Image File
Q-View™ Software can open images in the following formats:
TIFF, CR2 (raw image files from Canon cameras), JPEG, PNG
and BMP. However, it should be noted that lossy or low bit
depth images (JPEG, PNG and BMP) are insufficient to use for
analysis and therefore should be imported for the purpose of
14
display only. Users should take images using supported
imaging systems (See Page 5).
To acquire an image by importing an image file, select Import
Image. Browse and select the desired image.
The time to upload the image will vary depending on the image
file type and size. Once imported, the image will appear in the
Q-View™ Software main screen.
Images acquired using the following imagers can be imported
into the Q-View™ software for analysis. Refer above for details
on importing images to Q-View™ software.
3. Acquiring an image using the Alpha Innotech HD2 Camera
and Software Setup
A. Open the camera door.
B. Set the adjustable tray on the lowest level.
C. Place the focusing plate in the center of the tray for
focusing.
D. Open the aperture on the camera all the way to the lowest
value (~0.95).
E. Open the software on the computer.
F. Click the acquire button.
G. Close the door on the camera slightly so some light can
get in and the focusing plate can be seen on the computer
screen.
H. Adjust the focus on the actual camera lens until the
focusing plate is in focus.
I. Remove the focusing plate.
J. Place the plate to be read in the center of the tray and
make sure it is in the center of the photo path (on the
computer screen).
15
K.
Close all doors on the camera and ensure there are no
light leaks.
L. Ensure all cabinet lights are off and that the filter wheel is
set to position “1.”
M. Set the software settings on the computer as follows:
i. No lights on.
ii. Resolution to “Normal/Ultra”.
iii. Select only “noise reduction”
iv. Set the exposure time to 3 min for the first time.
N. Click on Acquire Image.
O. Once the image is acquired, save it and look at the pixel
intensity of the high points on the standard curve. On
average, most of the high points on the curve should be in
the 45,000 - 55,000 pixel intensity range, and on the
second spot they should be in the 20,000 - 40,000 pixel
intensity range.
i. If there are spots where the PI (pixel intensity) on the
high point of the curve is at 65,000 and the second
point is 60,000 or higher, then acquire another image
of the plate for a shorter period of time.
ii. If the spots on the high point of the curve in general
fall below 40,000 PI, then reacquire the image for a
longer period of time.
4. Acquiring an image using the Alpha Innotech FC2 Camera
and Software Setup
A. Open the camera door.
B. Set the adjustable tray on the top shelf.
C. Place the focusing plate in the center of the tray for
focusing.
D. Open the aperture on the camera all the way to the lowest
value (~1.8).
16
E. Open the software on the computer.
F. Click the Acquire button.
G. Close the door on the camera slightly so some light can
get in and the focusing plate can be seen on the computer
screen.
H. Adjust the focus on the actual camera lens until the
focusing plate is in focus.
I. Remove the focusing plate.
J. Place the plate to be read in the center of the tray and
make sure it is in the center of the photo path (on the
computer screen).
K. Close all doors on the camera and ensure there are no
light leaks.
L. Ensure all cabinet lights are turned off and that the filter
wheel is set to “1”.
M. Set the software settings on the computer.
i. No lights on.
ii. Resolution to “Normal/Ultra”.
iii. Select only “noise reduction”,
iv. Set the exposure time to 6 min for the first time.
N. Click on Acquire Image.
O. Once the image is acquired, save it and look at the pixel
intensity of the high points on the standard curve. On
average, most of the high points on the curve should be in
the 45,000 - 50,000 pixel intensity range, and on the
second spot they should be in the 20,000 - 40,000 pixel
intensity range.
i. If there are spots where the PI (pixel intensity) on the
high point of the curve is at 65,000 and the second
point is 60,000 or higher, then acquire another image
of the plate for a shorter period of time.
ii. If the spots on the high point of the curve in general
fall below 40,000 PI, then reacquire the image for a
longer period of time.
17
5. Acquiring an image using the Bio-Rad VERSADOC 4000
Camera and Software Setup
A. File setup
i. Open the software on the computer.
ii. Click on “File, then select “Versadoc”.
iii. Make sure that only “Channel 1” is enabled.
iv. Click on the “Select” button, then select “Custom” and
then “Create”.
v. When the new window opens, name this custom
setup as “Quansys 1x1 binning”, and change the
settings to:
1. Filter: None
2. Illumination: None
3. Gain: 1X
4. Binning: 1X1
vi. Click on “OK”. (Now that this setting is saved, you can
use it again for future exposures. Instead of selecting
“Create”, select “Quansys 1X1 binning”.)
B. Camera Setup and Focus
i. Open the imager door.
ii. Place a box or stand in the cabinet below the camera
to increase the imaging height between 4 - 6 inches.
iii. Place the “imaging target sheet” or the focusing plate
in the cabinet on top of the box or stand.
iv. Open the aperture on the camera all the way to the
lowest value.
v. Leave the door slightly open to let in light while
focusing.
vi. Click “Focus” in the software, and turn the focus on
the camera until the imaging targets on the screen on
the computer are in focus or the focusing plate is in
focus. Click “Stop” when in focus.
vii. Replace the “imaging target sheet”/focusing plate with
the plate to be read, and ensure the plate is centered
18
in the imaging screen and is straight.
viii. Close the cabinet door.
C. Image Acquisition
i. On “Step III—Set exposure time” on the software,
change the exposure time to 30 seconds and select
Acquire.
ii. When the exposure is compete, convert the image
into negative (black background with white spots).
1. Click image, and new menu appears.
2. Select Transform, and then check the box that
says “Invert Display”.
3. Click OK.
iii. Save the image.
D. Image Optimization
i. Once the image is acquired, loot at the pixel intensity
of the high points on the second dilution in the
standard curve, and make sure they are not
saturated. On average, most of the high points on the
curve should be in the 45,000 - 55,000 Pixel Intensity
range, and on the second spot they should be in the
20,000 - 40,000 Pixel Intensity range.
1. If there are spots where the PI (pixel intensity) on
the high point of the curve is at 65,000 and the
second point is 60,000 or higher, then re-expose
image of the plate for a shorter period of time (1
minute).
2. If the spots on the high point of the curve in
general fall below 40,000 PI, then re-expose the
image for a longer period of time (i.e. 3 minutes).
E. File Conversion
i. After acquiring the images, you need to convert them
to TIFF files.
ii. Click on “File” then “Export to TIFF image”.
iii. Select “Export raw data”, click on “Export”, then click
on “Save”.
19
6. Acquiring an image using the Bio-Rad CHEMIDOC XRS
Camera and Software Setup
A.
B.
File Setup
i. Open the software on the computer.
ii. Click on “File”, then select “ChemiDoc XRS”.
iii. Under “Step I—Select Application” press the “Select”
button, then select “Custom” and then “Create”.
iv. When the new window opens, name this custom
setup as “Quansys 1x1 binning”. Under “Illumination”
select “none”, and under “gain & binning” select “2X,
1X1” and click “OK”. (Now that this setting is saved
you can use it again for future exposures. Instead of
selecting “Create”, select “Quansys 1x1 binning”).
Camera Setup and Focus
a. On the software select “Live Focus”.
b. On the cabinet press the plus button to open the
aperture or iris all the way (the lowest number).
c. Open the camera’s drawer, place the plate in the
middle of the drawer, then close the drawer.
d. Press the “Epi White” button on the camera cabinet.
e. Press the zoom buttons on the cabinet until the plate
fills most of the screen on the computer.
f. Replace the plate with the “imaging target sheet” or
the focusing plate and close the door.
g. Press the focus buttons on the cabinet until the
targets or focusing plate are in focus on the computer
screen.
h. Replace the imaging target sheet/focusing plate with
the plate to be read, close the drawer, and make sure
the plate is in the center of the imaging screen and
straight.
i. Turn off the “Epi White” button on the cabinet, and
select “freeze” in the software.
20
C. Image Acquisition
a. On “Step III—Acquire Image” on the software, change
the exposure time to 30 seconds and select Manual
Expose.
b. When the exposure is complete, convert the image
into negative (black background with white spots).
i. Click Image, and new menu appears.
ii. Select Transform, and then check the box that
says “Invert Display”.
iii. Click OK.
c. Save the image.
D. Image Optimization
a. Once the image is acquired, look at the pixel intensity
of the high points on the standard cure. On average,
most of the high points on the curve should be in the
45,000 - 55,000 Pixel Intensity range, and on the
second spot they should be in the 20,000 - 40,000
Pixel Intensity range.
i. If there are spots where the PI (pixel intensity) on
the high point of the curve is at 65,000 and the
second point is 60,000 or higher, then re-expose
image of the plate for a shorter period of time (i.e.
1 minute).
ii. If the spots on the high point of the curve in
general fall below 40,000 PI, then re-expose the
image for a longer period of time (i.e. 3 minutes).
E. File Conversion
a. After acquiring the images, you need to convert them
to TIFF files.
b. Click on “File” then “Export to TIFF image”.
c. Select “Export raw data”, click on “Export”, then click
on “Save”.
21
7. Acquiring an image using the Fujifilm LAS-3000 Camera and
Software Setup
A.
B.
File Setup
a. Open the software on the computer.
b. Under “Exposure Type” select “Precision” in the drop
down menu.
c. Under “Exposure Time” set the imager to take a 30second image by selecting “Manual” then entering
“30” in the first box and selecting “sec” in the second
box.
d. Under “Sensitivity” select “Standard” in the drop down
menu.
e. Ensure the box next to “Image Acquire & Digitize” is
checked.
f. Click on the “Method/Tray Position” button. In the
window that appears, select “Chemiluminescence”,
and under tray position select “2”. Then select “OK” to
close the window.
Camera Setup and Focus
a. Open the camera box and make sure the tray is in
position “2”.
b. Place the focusing plate or other imaging target sheet
on the tray and close the door.
c. On the software select “Focus” and a new window
appears. In the “Adjust” area, click up or down on the
arrows until the focusing plate is in focus.
d. Remove the focusing plate from the imager and place
the plate to be read in the center of the tray. Look on
the computer screen to make sure the plate is
centered and straight in the imaging screen. Close the
imager door when the plate is centered.
e. Select the “Return” button on the software to close the
focusing window.
22
C. Image Acquisition
a. When the plate is ready to image, press the “Start”
button.
b. After the plate has imaged invert the image to black
with white spots by clicking on “View” then selecting
“Positive Gray” in the drop down menu.
c. Save the image by pressing the “Save” button. In the
new window select “16 bit linear TIFF” in the “Save as
type” drop down menu. Then type a name for the file
and select “Save”.
d. Press the “Complete” button to allow the imager to
take another image.
e. Take multiple images at different exposure times to
ensure you get the best reading possible. Example
exposure times are 20 seconds, 45 seconds, 60
seconds, 90 seconds and 120 seconds.
D. Image Optimization
a. Once the image is acquired, look at the pixel intensity
of the high points on the standard curve. On average,
most of the high points on the curve should be in the
45,000 - 55,000 Pixel Intensity range, and on the
second spot they should be in the 20,000 - 40,000
Pixel Intensity range.
i. If there are spots where the PI (pixel intensity) on
the high point of the curve is at 65,000 and the
second point is 60,000 or higher, then re-expose
image of the plate for a shorter period of time (i.e.
20 seconds).
ii. If the spots on the high point of the curve in
general fall below 40,000 PI, then re-expose the
image for a longer period of time (i.e. 2 minutes).
23
F. PRODUCT PERFORMANCE CHARACTERIZATION
1.
Matrix Studies:
i. Levels of analytes in Normal human serum and Normal
human plasma
Normal human serum from 20 individual donors and Normal
human plasma with different anti-coagulants (Na-EDTA, NaCitrate, and Na-Heparin) from 13 other individual donors were
tested in the assay. The levels of analytes in the samples were
extrapolated from a Standard Curve prepared in Sample
Diluent.
Serum and plasma from all donors had detectable levels of IP10. The average concentration of IP-10 in serum was 55.6 pg/
ml, while in plasma was 86.9 pg/ml.
Serum from one donor had 16.0 pg/ml of IFN-α, serum from a
second donor had 6.4 pg/ml of IL-1 α and 40 pg/ml of IL-6,
serum from a third donor had 9.1 pg/ml of IL-1 α, 1935.2 pg/ml
of IL-6, and 27.0 pg/ml of TNF-α, and serum from a fourth
donor had 43.4 pg/ml of IL-6.
Serum from remaining 16 donors had undetectable levels of
analytes other than IP-10.
Plasma from all 13 donors had undetectable levels of analytes
other than IP-10.
24
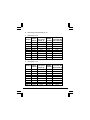
Normal human serum
(20 donors)
Analyte
Normal human plasma
(13 donors)
Average
Average
Range (pg/ml)
Range (pg/ml)
(pg/ml)
(pg/ml)
IFN-α
<LLOD
<LLOD to 16.0
<LLOD
N/A
IFN-β
<LLOD
N/A
<LLOD
N/A
IFN-γ
<LLOD
N/A
<LLOD
N/A
IFN-λ 1/2
<LLOD
N/A
<LLOD
N/A
IFN-ω
<LLOD
N/A
<LLOD
N/A
IL-1α
<LLOD
<LLOD
N/A
IL-6
102.7 *
<LLOD
N/A
IP-10
55.6
<LLOD to 9.1
<LLOD to
1935.2
9.14 to 130.3
86.9
21.3 to 182.2
TNF-α
<LLOD
<LLOD to 27.0
<LLOD
N/A
* Average value of IL-6 in normal human serum was high due
to presence of 1935.2 pg/ml of IL-6 in serum from a particular
donor. Levels in serum from 17 donors were either close to
LLOD or < LLOD.
N/A-Not applicable because levels in serum or in plasma from
all donors were < LLOD.
25
ii.
Spike Recovery
Low, medium, and high spikes were prepared using the
Multiplex Antigen Standard in Normal human serum from a
single donor, Normal human plasma with different anticoagulants, TCM-DMEM+10% FBS, and Sample Diluent. The
concentration of spikes were extrapolated from a Standard
Curve prepared in Sample Diluent. The recoveries in Normal
human serum and in Normal human plasmas were calculated
after subtracting measured levels of endogenous analytes, in
the matrices, from the recovered values.
a.
High Spike
Normal
Normal human
Sample DMEM+ human plasma
Analyte
Diluent 10% FBS serum with Na(donor A) EDTA
(donor B)
Normal
human
plasma
with NaEDTA
(donor C)
Normal Normal
human human
plasma plasma
with Na- with NaHeparin Citrate
(donor C) (donor D)
IFN-α
82.8%
105.3%
91.6%
38.0%
42.7%
114.4%
86.5%
IFN-β
79.6%
77.8%
125.8%
87.2%
110.0%
108.1%
102.7%
IFN-γ
113.8%
88.0%
98.8%
95.5%
92.5%
100.7%
92.7%
IFN-λ 1/2
96.5%
95.5%
94.0%
89.9%
94.0%
101.3%
83.3%
IFN-ω
82.9%
77.3%
82.5%
76.8%
104.8%
104.2%
86.7%
IL-1α *
92.4%
85.0%
76.9%
0.1%
79.7%
71.6%
63.2%
IL-6
IP-10
81.8%
87.2%
75.6%
77.7%
69.1%
83.8%
50.0%
73.5%
77.1%
64.6%
79.1%
83.6%
68.4%
75.0%
TNF-α
91.4%
72.6%
81.3%
79.2%
87.0%
88.5%
60.6%
* The recovery of high, medium and low IL-1α spikes in normal
human plasma with Na-EDTA from donor B was particularly
poor.
26
b.
Medium Spike
Normal
Normal human
Sample DMEM+ human plasma
Analyte
Diluent 10%FBS serum with Na(donor A) EDTA
(donor B)
IFN-α
IFN-β
IFN-γ
IFN-λ 1/2
IFN-ω
IL-1α *
IL-6
IP-10
TNF-α
c.
100.0% 121.8%
82.6% 97.9%
125.5% 97.5%
114.9% 118.0%
97.2% 87.5%
102.3% 89.9%
98.2% 84.5%
97.7% 81.0%
99.3% 77.5%
107.1%
138.4%
110.6%
115.5%
101.1%
80.6%
79.1%
96.1%
86.2%
33.0%
103.3%
104.9%
104.2%
95.7%
0.0%
57.2%
77.4%
77.8%
Normal
human
plasma
with NaEDTA
(donor C)
Normal Normal
human
human
plasma plasma
with Na- with NaHeparin Citrate
(donor C) (donor D)
43.0%
98.7%
89.4%
84.2%
105.8%
59.5%
75.8%
63.4%
85.1%
106.5%
100.2%
94.4%
87.7%
109.6%
55.6%
71.7%
75.6%
88.2%
Normal
human
plasma
with NaEDTA
(donor C)
Normal
human
plasma
with NaHeparin
(donor C)
73.3%
98.1%
77.3%
72.6%
101.4%
47.9%
61.3%
50.8%
57.1%
Low Spike
IFN-α
91.5%
124.2%
109.0%
23.9%
35.5%
91.2%
Normal
human
plasma
with NaCitrate
(donor
D)
81.0%
IFN-β
69.8%
94.2%
161.8%
111.3%
95.2%
87.4%
98.3%
IFN-γ
133.9%
85.1%
113.3%
108.4%
44.7%
72.7%
63.1%
IFN-λ 1/2 93.2%
94.2%
75.5%
91.1%
47.4%
56.1%
54.4%
79.5%
Normal
Normal human
Sample DMEM+ human plasma
Analyte
Diluent 10%FBS serum with Na(donor A) EDTA
(donor B)
IFN-ω
90.8%
82.1%
106.0%
89.2%
62.1%
78.7%
IL-1α *
102.2%
73.2%
64.1%
0.0%
25.3%
20.6%
9.0%
IL-6
95.4%
82.0%
78.4%
67.3%
65.0%
54.2%
49.9%
IP-10 ++ 117.2%
67.8%
113.9%
79.6%
-16.5%
-9.4%
-70.8%
69.4%
86.0%
75.6%
66.9%
60.9%
41.9%
TNF-α
102.1%
++ Poor recoveries of low IP-10 spikes in plasma are due to
presence of ~110 pg/ml of apparent endogenous IP-10 in the
plasma lots.
27
iii.
Intra-assay and Inter-assay % CV
a.
Intra-assay % CV
Analyte
Sample
Diluent
IFN-α
IFN-β
IFN-γ
IFN-λ 1/2
IFN-ω
IL-1α
IL-6
IP-10
TNF-α
4.3%
4.3%
6.3%
7.0%
4.6%
4.9%
7.2%
3.4%
4.4%
b.
Normal human serum
(donor A)
3.9%
8.2%
3.8%
7.7%
7.0%
6.3%
5.1%
8.5%
4.3%
Normal human
DMEM+
plasma with Na10%FBS
EDTA (donor B)
4.6%
7.0%
3.8%
8.0%
6.5%
6.5%
11.4%
9.2%
5.5%
6.5%
5.6%
15.7%
7.4%
2.1%
3.0%
3.3%
4.6%
3.9%
Inter-assay % CV
Analyte
Sample
Diluent
IFN-α
8.6%
IFN-β
9.8%
IFN-γ
8.9%
IFN-λ 1/2 14.1%
IFN-ω
6.2%
IL-1α
9.2%
IL-6
12.8%
IP-10
8.4%
TNF-α
13.2%
Normal human serum
(donor A)
3.8%
13.9%
8.9%
12.4%
7.3%
9.8%
19.0%
10.0%
12.4%
28
Normal human
DMEM+
plasma with Na10%FBS
EDTA (donor B)
7.6%
15.5%
12.1%
12.6%
14.3%
15.6%
20.2%
23.9%
11.0%
8.0%
14.9%
ND
19.8%
25.1%
13.9%
21.5%
12.9%
12.7%
2.
Cross Reactivity Studies
i.
IFN-λ subtypes:
Independent curves of recombinant human IFN-λ1,
recombinant human IFN-λ2, and recombinant human IFN-λ3
were prepared in Sample Diluent. A separate standard curve
was prepared using the Human IFN Multiplex Antigen
Standard supplied in the product. The % recovery of those
points with pixel intensities within the range of pixel intensities
of IFN-λ1/2 in the multiplex standard were averaged to
estimate the % Reactivity for each subtype.
Subtypes % Reactivity
IFN-λ1
IFN-λ2
IFN-λ3
ii.
167.4%
39.5%
41.7%
Human IFN-α subtypes, Rhesus Monkey IFN-α,
Cynomolgus Monkey IFN-α (Ile16) and Cynomolgus
Monkey IFN-β
Independent curves of recombinant analytes listed in the table
on the next page were prepared in Sample Diluent. A separate
standard curve was prepared using the Human IFN Multiplex
Antigen Standard supplied in the product. The % recovery of
those points on the curves of the test analytes with pixel
intensities within the range of pixel intensities of IFN-α A 2a in
the curve prepared using the Multiplex Antigen Standard were
averaged to estimate the % Reactivity for each analyte.
29
Catalog No.
Analyte
% Reactivity
11105-1
11100-1
11175-1
11165-1
11120-1
Human IFN-α 2 (α2b)
Human IFN-α A (α2a)
Human IFN-α 1 {α D (Ala 114)}
Human IFN-α K (α6)
Human IFN-α C (α10)
66.7%
55.7%
30.6%
20.0%
15.6%
11160-1
11180-1
11135-1
11145-1
11130-1
11190-1
11150-1
11115-1
Human IFN-α J1 (α7)
Human IFN-α 4b (α4)
Human IFN-α G (α5)
Human IFN-α H2 (α14)
Human IFN-α F (α21)
Human IFN-α WA (α16)
Human IFN-α I (α17)
Human IFN-α B2 (α8)
14.2%
10.7%
3.7%
0.3%
0.1%
0.1%
0.1%
0.0%
14110-1
Rhesus Monkey IFN-α
10.6%
16100-1
Cynomolgus Monkey IFN-α A Ile16
6.0%
2.3 ng/ml of Cynomolgus IFN-β was measured in tissue culture
supernatant of a mammalian cell line expressing Cynomolgus
IFN-β. No other antigen was detected in the supernatant.
iii.
Mouse IFN-α A, Mouse IFN-β, Mouse IFN-γ, and Mouse
IFN-λ3
Independent curves, starting at 10 µg/ml, of recombinant
analytes listed on the next page were prepared in Sample
Diluent. A separate standard curve was prepared using the
Human IFN Multiplex Antigen Standard supplied in the
product. The % recovery of those points with pixel intensities
within the range of pixel intensities of corresponding human
analytes in the curve prepared using the Human IFN Multiplex
30
Antigen Standard were averaged to estimate the % cross
reactivity for each analyte.
3.
Catalog No.
Analyte
% Cross-reactivity
12100-1
12400-1
12500-1
12820-1
Murine IFN-α A
Murine IFN-β
Murine IFN-γ
Murine IFN-λ3
0.004%
0.0%
0.0%
0.0%
Additional Studies
Serum samples from 27 Rheumatoid Arthritis (RA) patients’
were tested. Only 1 sample gave false positive. The spike
recovery was acceptable.
20 human plasma samples with constituents known to interfere
in immunoassays were tested. No sample gave false positive.
Please note that detection of analytes in serum and plasma
from patients on certain therapeutics can be affected due to
the presence of antibodies against analytes from the multiplex
in such samples.
31
G. REFERENCES
1.
Evolution of the class 2 cytokines and receptors, and
discovery of new friends and relatives; Pestka, S., et al;
Pharmacology & Therapeutics; 2005 June; 106(3); 299346.
2.
Interferons, Interferon-like cytokines, and their receptors,
Pestka, S., et al; Immunological Reviews; 2004; 202; 8-32.
3.
Interferon Alpha in malignant and viral diseases: A review;
Dorr RT; Drugs; 1993; 45(2).
4.
Interferon-treatment for relapsing multiple sclerosis;
Zivadinov, R., et al; Expert Opinion in Biological
Therapeutics; 2008; 8(9); 1435-37.
5.
Interferon-γ: an overview of signals, mechanism, and
functions; Hume, DA, et al; Journal of Leukocyte Biology;
2004; 75; 163-189.
6.
IFN-λ: Novel anti-viral cytokines; Paludan, SR, et al;
Journal of Interferon & Cytokine Research; 2006 May; 26
(6);373-79.
7.
IL-28, IL-29 and their class II cytokine receptor IL-28R;
Sheppard, P., et al; Nature Immunology; 2002 Dec; 4; 6368.
8.
Molecular characterization and Antiviral activities of Type
III interferons; Blecha, F., et al; Journal of Interferon &
Cytokine Research; 2010 Nov; 30(11); 801-807.
32
9.
IFN-λs mediate antiviral protection through a distinct class
II cytokine receptor complex; Donnolley, RP, et al; Nature
Immunology; 2002 Dec; 4; 69-77.
10. Human IFN-lambda 1 modulates the Th1/Th2 response;
Gallagher, G., et al; Genes & Immunity; 2007 March; 8;
254-261.
11. Lambda Interferon inhibits Hepatitis B and Hepatitis C
Virus Replication; Chisari, FV, et al; Journal of Virology;
2005 March; 79(6); 3851-3854.
12. Interferon Lambda as a potential new therapeutic for
hepatitis C; Williams, DE, et al; Annals of the New York
Academy of Sciences; 2009 Dec; 1182; 80-87.
33
PLATE LAYOUT
Use this plate layout as a record of standards and samples
assayed.
34
NOTES
35