1
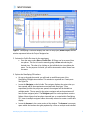
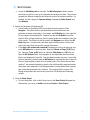
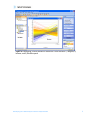
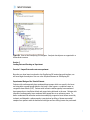
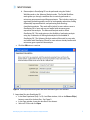
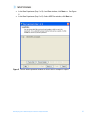
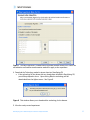
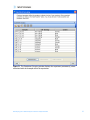
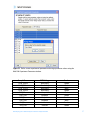
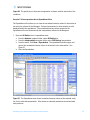
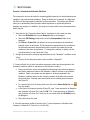
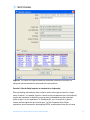
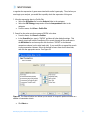
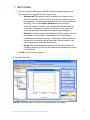
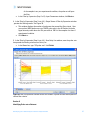
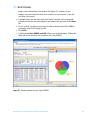
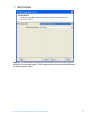
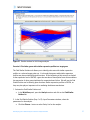
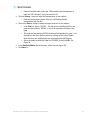
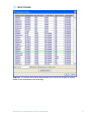
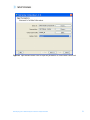
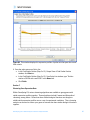
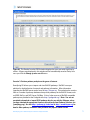
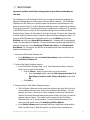
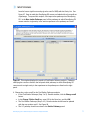
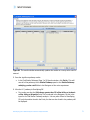
agreements and User should obtain all appropriate licenses before downloading any such data. The Pathways tool in GeneSpring GX allows you to integrate information regarding the dynamics and dependencies of the genes of interest within a pathway. The Find Similar Pathways tool also allows you to quickly answer the questions; what pathways are my genes of interest found in? In which biological pathways is there a significant enrichment of my genes of interest? GeneSpring GX comes pre-loaded with a small set of 21 pathways in the BioPAX format, courtesy of the Computation Biology Center at Memorial SloanKettering Cancer Center, the Gary Bader’s lab at the University of Toronto, the Pandey Lab at Johns Hopkins University, and the Institute of Bioinformationcs (Bangalore, India). To import new BioPAX pathways into GeneSpring GX, go to the Utilities section of the Workflow and click on the Import BioPax pathways link. Pathways will be imported and saved in the GeneSpring GX database. For more information regarding importing BioPAX pathways, please refer to the GeneSpring GX Quick Start Guide or the GeneSpring GX User Manual. For this tutorial, we will look at the pathways that have already been preloaded into GeneSpring GX. 1. Activate the Find Similar Pathways tool. • In the Workflow panel, open the Results Interpretation section and click on the Find Similar Pathways link. 2. Perform Find Similar Pathways analysis. • In the Find Similar Pathways (Step 1 of 2)- Input Parameters window, select the Entity List to be used for the analysis. o Click the Choose… button to select Entity List for the analysis. From the Analysis folder, select the Fold change greater than 1.5 in Non-failing vs Ischemic or Non-failing vs Idiopathic list and click OK. o Click Next>>. 3. Review results for Find Similar Pathways analysis. • The Find Similar Pathways tool will match the entities in the input Entity List to all of the pathways that have been saved in the GeneSpring GX database. For each pathway, the Fisher’s Exact test is used to compute a p-value that indicates the whether the overlap observed between the entities found in the Entity List and the pathway is due to chance. The results are then reported in the Find Similar Pathways (Step 2 of 2)- Results window. For more detailed explanation of the values reported, please refer to the GeneSpring GX User Manual. • In the Similar Pathways panel, pathways that have a significant overlap with the Entity List will be listed. With this analysis, you will see that no pathways are GeneSpring GX 9 Data Analysis Tutorial for Affymetrix data 74