1
US 7,430,692 B2
5
6
derive status change data (e.g., indicating change from opera
tional to inoperative or operational data change) of respective
WINDOWS®, Unix, VMS, Network Devices, and Switches,
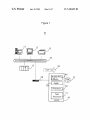
for example (such as server 11, workstation 13, printer 15,
computer 17 and network device 28) that are currently being
devices and stores the status change data in status database 33.
Executable application 30 initiates generation of alert mes
monitored. The devices are populated into the left hand pane
of a display image such as image 303 illustrated in FIG. 3.
sages to responsible personnel (e.g., via a helpdesk) in
response to operational data exceeding a monitoring thresh
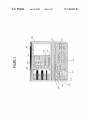
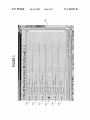
Speci?cally, image 303 provided by display processor 46
old. System 10 supports maintenance of one or more process
enables a user to select and con?gure suppression of alert
ing devices. Display processor 46 initiates generation of data
monitoring of multiple devices during a prede?ned time
representing display images enabling a user to, select a pro
period such as system maintenance. Speci?cally, a user
cessing device from multiple different processing devices
(e. g., server 11, workstation 13, printer 15, computer 17 and
network device 28) intermittently receiving maintenance.
selects and includes devices to be placed into maintenance
mode in window panel 306 from available devices in panel
304 by highlighting devices for selection in panel 304 and use
of selection button 312. The period for maintenance is
selected using days, hours and minutes boxes in column 302
The display images also enable a user to schedule a time
period for suppression of communication of alert messages
indicating a failure condition of the selected processing
device. A processor in application 30 automatically initiates
Option 331 enables a user to select extension of the mainte
nance period by a predetermined period and option 333
redstart of a processing device in response to a detected
failure condition and inhibits re-start of the selected process
enables termination of maintenance and return of devices to
active status. A user is able to schedule a future period of
maintenance by selection of a start date 309 and time in row
ing device during a scheduled period of alert message com
munication suppression.
20
Application 30 enables automatic placement of monitored
processing devices into maintenance mode, either in response
to user command entered via a displayed user interface image
or in response to an executable procedure (e.g., a script) in a
device shutdown sequence. Display images provided by dis
and the months of a year in area 323. A user activates a
selected schedule of maintenance using button 325. Select
25
play processor 46 also advantageously enable a user to sched
nance of devices that are identi?ed in status and monitoring
database 33. The display images further ensure accurate error
30
duration etc.) concerned.
35
portation system processing devices, for example. The sys
e.g., in an Intensive Care Unit (ICU) to inhibit alert message
40
awtrap
identifying actions requested and time and date of the asso
ciated commands. Application 30 is usable by a hosting site
with many (e.g., thousands of) monitored servers, routers and
switches, for example. Application 30 eliminates or reduces
problems associated with manual removal of a device from
45
being monitored by monitoring software. Such manual
50
processor 46. Application 30 accesses data in device and
status database 33 and retrieves a list of devices including
esm
gr
l.3.6.l.4.l.79l.2.9.2.2
“ServerName:
%
6
1
l2
Type:
Monthly Downtime: %2 seconds Application: Scheduling.
Where: awtrap:any third party utility to allow sending of a
raw SNMP trap
Where: esmmgr?he name or location of the monitoring man
ager server.
55
Where: % l is the computer name of the device to be placed
in maintenance
Where: % 2 is the amount of seconds the device is to be in
maintenance
Where: % 3 is the type of device that is to be placed into
maintenance
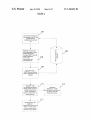
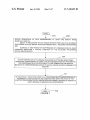
Application 30 (FIG. 1) in step 207 parses the received
60
SNMP trap message and initiates placement of the at least one
selected device into an ‘Unmanaged’ state for the period of
time speci?ed by the start and end times of period of mainte
nance by updating data in step 209 (including server charac
teristics, for example) in status and monitoring database (e. g.,
supporting maintenance of one or more processing devices.
In step 201, a user selects devices to be placed into mainte
nance mode together with time and date of start and end of the
maintenance period via display images provided by display
-h
l.3.6.l.4.l.79l.2.2.3.l-s
com Class: %3”
no longer in maintenance. User error may also occur through
response to a false alert message generated while a device is
in maintenance.
FIG. 2 shows a ?owchart of a process used by system 10 in
(FIG. 3) and other parameters determined via image 303. The
communicated message includes data identifying, a device
name, type of device and start and end times of period of
maintenance. An exemplary SNMP trap message follows.
tenance process including user identi?ers as well as data
removal typically includes error prone manual steps involv
ing communication with a monitoring software administra
tor, manual steps by the administrator to stop alert message
generation and manual steps to reinstitute alert message gen
eration in response to maintenance completion. User error
and resource waste may occur in ignoring genuine particular
device alerts out of habit or through ignorance that a device is
In step 204 (FIG. 2) processor 50 generates and commu
nicates an SNMP trap message to central monitoring appli
cation 3 0 in response to maintenance con?guration data iden
tifying at least one selected device and a scheduled time for
maintenance entered by a user via user interface image 303
tem is also advantageously usable in clinical task work?ow,
generation when a clinician is adjusting or re-attaching leads
associated with signals for heart, respiration, or other moni
tored functions. An audit processor in application 30 auto
matically records data that tracks use of the automated main
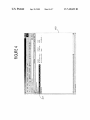
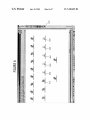
face image 403 provided by display processor 46 (FIG. 1)
illustrating scheduled tasks resulting from con?guration of
inhibiting alert monitoring of multiple devices via image
display 303 (FIG. 3). Speci?cally, image 403 indicates item
407 identifying a device scheduled for future maintenance
and enabling access to the maintenance details (e.g., time,
longer than planned. Selectable monitored devices comprise
a wide variety of different devices including HVAC (Heating,
Ventilation &Air conditioning) processing devices and trans
able buttons in row 320 enable a user to initiate maintenance
now, once, daily, weekly or monthly. FIG. 4 shows user inter
ule future device maintenance and schedule periodic mainte
free selection of single or multiple monitored devices for
maintenance and support incremental time extensions (e.g.,
30 minutes) to a time period for which alerting has been
disabled. This may occur, for example, if maintenance takes
311. Periodic maintenance is scheduled by selection of a day
in a month, via options in rows 313 (e.g., day l of every
month) or 315 and 317 (eg the ?rst Sunday of every month)
65
a relational database or a ?nite state machine database) 33.
Application 30 pseudo code for processing a maintenance
trap is as follows.