1
Via M.E. Lepido, 182 - 40132 BOLOGNA
Casella Postale(PO BOX) 4052 BorgoPanigale
Phone: 051 404140 - Fax: 051 402040 - WEB: www.ducatienergia.com
WarpNet V2.8
USER'S MANUAL
10/2007
WarpNet V2.8
DUCATI energia s.p.a.
TABLE OF CONTENTS
1.
INSTALLATION ...........................................................................................................3
2.
GENERAL DETAILS....................................................................................................3
3.
USING THE WARPNET SOFTWARE..........................................................................5
3.1
File Menu ............................................................................................................................................................ 6
3.1.1
How to create a new network project (New Network Project) ........................................................................ 6
3.1.2
How to open an existing network project (Open Network Project)................................................................. 6
3.1.3
How to open an existing project without connection to DLC (open offline)................................................... 7
3.1.4
How to Make a copy of the project in use (Save as..)...................................................................................... 8
3.1.5
Manage time bands.......................................................................................................................................... 8
3.1.6
Add or modify an existing profile.................................................................................................................... 8
3.1.6.1
Section “Time bands” ............................................................................................................................ 9
3.1.6.2
Section “Day profiles” ........................................................................................................................... 9
3.1.6.3
Section “Periods” ................................................................................................................................. 10
3.1.6.4
Section “Special days” ......................................................................................................................... 11
3.1.7
Offline............................................................................................................................................................ 12
3.2
Network Project Menu..................................................................................................................................... 12
3.2.1
Creation and management of DLC resource (DLC Setup) ............................................................................ 12
3.2.2
How to configure the network of analysers to be associated to a DLC (MACH Setup)................................ 14
3.2.2.1
Search button........................................................................................................................................ 15
3.2.2.2
Save button........................................................................................................................................... 16
3.2.2.3
Cancel button ....................................................................................................................................... 16
3.2.2.4
Configure button .................................................................................................................................. 16
3.2.3
About instruments groups (Group Setup) ...................................................................................................... 17
3.2.3.1
How to add a new Group (Add button)................................................................................................ 19
3.2.3.2
How to change the name of a group (Edit button) ............................................................................... 19
3.2.3.3
How to change measurements associated with groups (Groups Measures button) .............................. 19
3.2.3.4
How to delete an existing group (Delete button) ................................................................................. 20
3.2.3.5
How to add an instrument to a group (Arrow button) .......................................................................... 20
3.2.4
Starting and managing measurement sessions (Session Setup) ..................................................................... 21
3.2.4.1
The data recording interval .................................................................................................................. 21
3.2.4.2
The synchronization of the network..................................................................................................... 22
3.2.4.3
Setup the measure session.................................................................................................................... 23
3.3
Display Menu .................................................................................................................................................... 24
3.3.1
How to display data acquired in table form ................................................................................................... 24
3.3.1.1
Tabular display options (Configure) .................................................................................................... 25
3.3.2
How to display group data acquired in table form......................................................................................... 26
3.3.3
How to display data acquired in graphic form............................................................................................... 26
3.3.4
The Chart windows........................................................................................................................................ 27
3.3.4.1
Button Copy to clipboard ..................................................................................................................... 27
3.3.4.2
Print button........................................................................................................................................... 28
3.3.4.3
Setup alarm button ............................................................................................................................... 28
3.3.4.4
Remove alarm button ........................................................................................................................... 28
3.3.5
How to view the energy consuming dived by time bands ............................................................................. 28
3.3.6
View time bands energy table........................................................................................................................ 29
3.3.6.1
Print button........................................................................................................................................... 30
3.3.6.2
Save button........................................................................................................................................... 30
1
WarpNet V2.8
DUCATI energia s.p.a.
3.4
Tools Menu........................................................................................................................................................ 30
3.4.1
Setting section ............................................................................................................................................... 30
3.5
Stored measure ................................................................................................................................................. 30
3.5.1
Management .................................................................................................................................................. 30
3.5.2
How-to-view the measurements (View) ........................................................................................................ 32
3.5.3
How to export the stored measurements (Export) ......................................................................................... 33
3.5.4
How-to-import from a CSV file (Import) ...................................................................................................... 34
4.
WARPNET CLIENT....................................................................................................35
4.1
Installation ........................................................................................................................................................ 35
4.2
Using WarpNet Client...................................................................................................................................... 36
2
WarpNet V2.8
1.
DUCATI energia s.p.a.
Installation
In order to run WarpNet you will require:
• IBM compatible personal computer with Pentium II processor or higher;
• operating system Windows 98/ME or Windows 2000 with Service Pack 4 or Windows Xp
with Service Pack 2. Windows Vista is not supported
• at least 128 MB of RAM;
• at least 100 MB of free space on hard disc
• CD/DVD Reader, only for installation
Before installing WarpNet close all application running on the PC.
The installation is started by running the setup.exe program from the CD-ROM
2.
General details
WarpNet software is designed to provide user-friendly control over networks of analysers
connected to a PC. The software utilises the serial ports in order to communicate with network
instruments. It can manage all the instruments of the Ducati Family:
MACH 20/30/Smart
Smart 96
Smart Più and Smart 96 Più
RMI/Rego
DAT Più (integrated instrument)
and also any instrument of the latest generation.
Thanks to the updateable database, the software is able to distinguish and understand the number
and type of the instruments connected to the network in order to enable highly-selective handling,
e.g. make available for selection only such measurements as can actually be used with that
particular instrument.
In order to enable RS-485 communication, the PC requires one or more of the following
instruments depending on the number of serial ports in the system:
• Ducati “DLC” RS232/RS485 converters (expressly recommended)
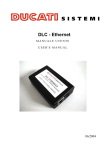
• Ducati “DLC” Ethernet/RS485 converters (expressly recommended)
• “DAT Più” data-logger (Only as added functionality)
3
WarpNet V2.8
DUCATI energia s.p.a.
In theory, the software supports an extremely large number of instruments if you consider that
with four serial ports it should be possible to manage up to 392 of them. In practice however,
networks of this size cannot be handled in a satisfactory manner; the problem is linked to
instrument transmission and response speed. In fact, the length of time between initial acquisition
of the first instrument and final acquisition of the last instrument would be such as to make the
result totally invalid. Satisfactory response times are obtained with networks of up to 150
connected MACH, bearing in mind however that total acquisition is directly proportional to both
number of MACH and number of measures to be acquiredi.
WarpNet allows you to carry out three basic operations:
1. Display the current situation in table form.
2. Store and export a set of measurements associated with the instruments and groups of them.
3. Display the progression in time of a quantity in graphic form.
i
In order to have an estimate of the mean acquisition time of all the data of a network, the following formula is applied:
T = (No. MACHs) x (No. quantities per MACH) x 0.15 [sec]
4
WarpNet V2.8
3.
DUCATI energia s.p.a.
Using the WarpNet software
Start the WarpNet program from the Start menu selecting Programs->Ducati->WarpNet.
The first window shown will be the one of FIG. 1.
FIG. 1
5
WarpNet V2.8
3.1
DUCATI energia s.p.a.
File Menu
This section of the program menu handles all operations carried out on files.
FIG. 2
3.1.1
How to create a new network project (New Network Project)
The user can now create a network project on his own PC; in order to do so, select New
Network Project from the File menu or click the respective button on the toolbar .
The following window will appear in which a name should be entered; this name will be used to
create the directory and give a name to the project files.
FIG. 3
3.1.2
How to open an existing network project (Open Network Project)
icon on the
Firstly, click File->Open Network Project from main menu or the
toolbar the standard dialogue box for opening files will appear: proceed in the usual manner.
6
WarpNet V2.8
DUCATI energia s.p.a.
FIG. 4
After opening the file, the software will start again automatically from exactly where you left
off. For example, if you were acquiring data, acquisition will resume, if you were configuring, you
can continue from where you left off.
A quick way to delete a folder from the list and send to the recycle bin is to select it and use the
DELETE key following which the Confirm File Delete box will appear.
FIG. 5
WARNING :
This will result in the permanent deletion of all information about network configuration
and all measurements taken, thus freeing up space on the hard disk.
3.1.3
How to open an existing project without connection to DLC (open offline)
This feature allows to open a WarpNet's file without making connection with DLC and so
without start the acquisition. The user is allowed to do a restrict number of operations only those
which do not required a connection. Allowed are:ii
ii
7
•
The exportation
•
Static Graphs
•
Database of measure Management
•
Modify the group association
See the next chapters for information about the arguments below
WarpNet V2.8
DUCATI energia s.p.a.
For the use of the dialog box see prevision chapter.
3.1.4
How to Make a copy of the project in use (Save as..)
In every moment is possible to make a global copy of the project including the data. This
command is used to make a Back up copy of the project and the data. For example: use it before
making an important modification to the project.iii
3.1.5
Manage time bands.
Warpnet can manage any time bands profile and can generate a file or a print of energy
consuming divided for each time band.
Next dialog window allow to select the active profile from list below. This choice influence both
table of measure and the export of measure.
FIG. 6
Using this interface you can:
3.1.6
•
pushing “add” button, add a new profile.
•
pushing “Modify” button, modify an existing profile.
•
Pushing “Del” button, delete an existing profile.
Add or modify an existing profile
Next dialog window appear both for add and for modify a profile. For the first case all windows
are blanc and you must insert the correct values.
iii
See also the chapter about Database management for more information.
8
WarpNet V2.8
3.1.6.1
DUCATI energia s.p.a.
Section “Time bands”
In this section is possible to insert all time bands in use by the delivery agent.
FIG. 7
Press add/modify for add/modify a new or existing time band and insert the name choice the
colour and the cost for each KWh.
Use “Del” button for delete a time bands, remember you are not allowed to delete a time band
that is used in a day profile.
3.1.6.2
Section “Day profiles”
This section is dedicated to the manage of day profile. It’s possible to create profile using time
bands previously inserted. You need to create one profile for each different prototype day.
Select a time band and associate it to an hour.
9
WarpNet V2.8
DUCATI energia s.p.a.
FIG. 8
For example in profile 10: the F4 time band is used from 00 AM to 8 AM and from 10 PM to 00
AM.
Use “Del” button for delete a profile, remember you are not allowed to delete a profile used in
Periods section.
3.1.6.3
Section “Periods”
In this section is possible to assign each profile previously inserted to a period of the year. Select
the date for the beginning of new period and For each day of the week select a day profile.
10
WarpNet V2.8
DUCATI energia s.p.a.
FIG. 9
Look at previously figure, on the left side the are current assignment. Select modify or add for
view and modify on the right side the weekday assignments.
3.1.6.4
Section “Special days”
In this section is possible to assign a profile to a particular day of the year, like Christmas.
FIG. 10
11
WarpNet V2.8
DUCATI energia s.p.a.
On the left is possible to assign a profile to a particular day of specific year and it will be used
one time only for that particular date. On the right are listed all annual fix day, every year on that
days it will be used the profile assigned. Note “Profile for Easter Monday”, Warpnet finds Easter
and allows to assign a profile for the monday after.
3.1.7
Offline
Activating this option will stop the acquisition. In this modality the WarpNet all the connections
are closed, communication ports are freed and all commands that require a connection with the
instruments are disabled. Use this command when it is necessary to modify the structure of the
Network. Using "Open offline" (see Cap.3.1.3 How to open an existing project without connection
to DLC (open offline) ) this modality is automatically enabled.
3.2
Network Project Menu
This section of the main menu handles network configuration. Any change to this using one of
the Menu commands will lead to acquisition being suspended and if a network configuration is
already operative the following dialogue box will appear...
FIG. 11
... click Yes to display the previously selected configuration interface and halt acquisition.
3.2.1
Creation and management of DLC resource (DLC Setup)
Situated between PC and analyser network, the DLC is the RS232/RS485 signal converter that
converts the signal of the PC serial port from standard RS232 to RS485. It should be noted that
subject to disabling its store function, the “Dat Più” data-logger can also be used for this purpose,
albeit with a few network speed restrictions.
If you have already completed the configuration of a network, but would like to expand it by
adding a DLC to a free serial port, you can do so, but during configuration of this new resource
acquisition will not be possible. If you find yourself in this situation and run the DLC Setup
command from the Network Project menu, the following window will appear.
12
WarpNet V2.8
DUCATI energia s.p.a.
FIG. 12
This displays the DLCs that have already been configured. By clicking the plus sign you can see
various properties of the DLC-PC connection. On the right there are 4 buttons whose functions are
described below:
•
Add: adds a new DLC to the network configuration.
•
Edit: Changes the configuration of the DLC selected (becomes active when a DLC is
selected from the list).
•
Delete: Irrecoverably deletes DLC from network including configuration of associated
instruments and also deletes from database all related data regarding the measurements
taken.
•
Exit: exits display mode in order to enable acquisition to resume or allow the user to modify
others parts of the configuration.
When clicking Add or Edit a dialogue box appears that allows you to set the attributes of the
connection with the DLC.
13
WarpNet V2.8
DUCATI energia s.p.a.
FIG. 13
The user must enter the Name (numbers or letters or both) to be assigned to the DLC and choose
the type of connection between PC and DLC. The software will automatically prevent the user from
assigning the same resource to two different DLCs.
For example, if choosing Resource COM 1 for the DLC named "ONE" and a modem is installed
on that port, the resource COM1 will no longer be available to the DLC named "TWO", either
amongst the serial ports or as a modem.
Select Ethernet option if you have a DLC – Ethernet code 458001220. The default IP for this
module is 192.168.5.245 with 2000 as port.
No limit for DLC connected are implemented. But you can connect max 98 instrument for each
DLC.
Having chosen the type of connection, the Advanced button will be enabled with which the
user can set the length of the timeout regarding use of the serial line for data transmission.
Changes to this parameter are somewhat critical and could cause a malfunction during acquisition.
3.2.2
How to configure the network of analysers to be associated to a DLC
(MACH Setup)
Having set DLC attributes, the user can set up the network of analysers connected to it by using
the MACH Setup command from the Network Project menu of the main control panel,
thus opening the “MACHs Configuration” window.
14
WarpNet V2.8
DUCATI energia s.p.a.
FIG. 14
Clicking the pointer arrow of the DLC box will open the drop-down list of names of configured
DLCs. Having selected the name, you can access the MACHs installed on the respective RS485
line. In the example above, a DLC named "DLC 01" is selected. This operation will enable the
Search button.
3.2.2.1
Search button
This command enables WarpNet to analyse the network of instruments in order to identify
connected MACHs on the basis of their address. In fact, the MACH list contains three types of icon.
•
The question mark
indicates that no check has ever been carried out on that address,
therefore the system does not know whether a MACH exists.
•
The red X
indicates that an unsuccessful attempt has been made to interrogate the
MACH at that address, therefore the system considers that instrument either absent or out of
service and it will be deleted should it have been present amongst those available in the
network.
•
The corresponding icon for each instrument of the Ducati family: an icon has been inserted
showing its photo, e.g.
15
for MachSmart 96.
WarpNet V2.8
DUCATI energia s.p.a.
In order to complete these details, two additional columns are provided that advise the type of
instrument and the Firmware version contained thereiniv.
The search can last twenty seconds or more for networks with dozens of instruments and when it
has been completed a list of all instruments correctly inserted in the network will appear in the
“MACH Network” window. Choosing a MACH will enable the buttons on the right that are used to
configure and check.
Following any change to the configuration in the Network box, the Save and Cancel
buttons are enabled.
3.2.2.2
Save button
This command allows you to save network configuration as it currently stands.
3.2.2.3
Cancel button
This command allows you to restore the last configuration you had saved.
3.2.2.4
Configure button
FIG. 15
iv
If required, the software will also support new DUCATI instruments released on a subsequent date. A standard icon
will appear to indicate that it does not have the specifications of that particular instrument in its database.
16
WarpNet V2.8
DUCATI energia s.p.a.
This command offers the possibility of configuring several essential Ducati instrument
parameters, as well as sending the most common commands, such as write and read, to a
predetermined instrument: transformation ratio (KV) of the voltage transformer connected to the
voltmeter inputs, average value calculation time and transformation ratio (KA) of current
transformer connected to the ammeter inputs.
How to change the name of Instruments
Rewrite the text on the box named Name. After this in all the project this instrument is indicated
with this text.
Read button
This command simply updates the three fields displayed in the box by communicating directly
with the instrument in question using Ducati protocol.
Write button
This command sends to the instrument selected the parameters entered in the various boxes at
that particular time. Having finished programming, automatic reading takes place in order to be able
to receive confirmation as to whether or not said programming of the instrument has been
successful.
Reset Avg Power button
This command irreversibly resets average and maximum average power of the instrument under
examination. We would remind you that subsequent updating of the quantity will occur at the end
of the period set as average time with effect from the moment in which reset takes place.
Reset Energy button
This command irreversibly resets the energy meter of the instrument under examination. We
would remind you that subsequent updating of the quantity will occur as soon as the instrument
registers the minimum quantum of energy.
Lock keyboard button
The "lock keyboard" function offers the possibility of preventing a user present at the instrument
installation site from accessing the Setup menu once the various on-screen messages have finished.
This command will remain operative until you send the opposite command (see below) or switch
the instrument off and back on again.
Unlock keyboard button
This command restores the option of accessing the Setup menu from the instrument keyboard.
3.2.3
About instruments groups (Group Setup)
From all networks configured by the user with WarpNet it is possible to select instruments
whose measurements are of special significance in order to form separate groups; e.g. from a
network of instruments installed throughout the company you might wish to highlight the data
regarding the instrument group situated in the MV/LV transformer substations. The groups in this
software are merely treated as instrument grouping rules and although some measurements are
associated, in actual fact nothing is stored. \ are generated by recalculating on each occasion the
sum of stored measurements associated with the instruments from which they are obtained. Each
change made to composition and number of groups will not result in any change to previouslystored measurements. This means that if we create a group after recording for two months, all
measurements will be recalculated (when necessary) and despite not having previously been
configured, it will have a record of these last two months; likewise, if we delete a group and then
recreate it exactly the same as it was before, this will retain all data.
17
WarpNet V2.8
DUCATI energia s.p.a.
In order access group creation and management functions you first need to create a DLC
resource (see Chapter 3.2.1 Creation and management of DLC resource (DLC Setup)) and set up an
Instrument Network (see Chapter 3.2.2 How to configure the network of analysers to be associated
to a DLC (MACH Setup)), following which you can go to the main menu and click Network
Project -> Group Setup.
FIG. 16
The screen is divided into two sections, on the left the DLC installed in the system and on the
right the Groups already created, there are also two arrow buttons that allow you to move Network
instruments from one section to the other and four other Group Setup buttons.
The DLCsv configured in the system are displayed on the left. In this tree-like arrangement
leaves are used to depict the instruments connected on the RS485 line corresponding to the DLC
representing the root. Instruments connected to two different DLCs can also be associated to a
group.
The right-hand section shows the names of previously-created Groups present as roots and the
instruments associated to them as leaves. It should be noted that two copies of the same MACH
cannot exist, in fact, those on the left are considered as not being assigned to any group, whilst
those on the right as associated to the respective group. An instrument cannot be associated to two
different groups, so this means that a MACH is either displayed on the left (no group) or will be
situated on the right.
v
By clicking the "+" sign it is possible to expand the icon and see which instruments correspond to that object.
18
WarpNet V2.8
3.2.3.1
DUCATI energia s.p.a.
How to add a new Group (Add button)
To add a new group to those present, you need to give it a name using the following box:
FIG. 17
The new group will be displayed as an icon along with the respective name.
3.2.3.2
How to change the name of a group (Edit button)
This button is used to change the name of a previously-created group. It will only become active
if you select a group by clicking with the mouse.
3.2.3.3
How to change measurements associated with groups (Groups
Measures button)
Clicking this button accesses the change function for measurements associated with groups by
bringing up the following window:
FIG. 18
19
WarpNet V2.8
DUCATI energia s.p.a.
In this section you can select in the usual manner which measurements are to be associated with
the groups. These measurements will be automatically inserted amongst those selectable for all
instruments and cannot be deselected whilst selecting the measurements to be registered.
The set of groupable measures are a subset of the measurements made available by the various
Ducati instruments. By default the fundamental measurements associated with a group are:
• active power
• average active power
• active energy
3.2.3.4
How to delete an existing group (Delete button)
By clicking this button it is possible to delete one of the previously-created groups; in actual
fact, this operation will not bring about any change to previously-stored measurements that are not
touched in any way. As in the case of the Edit button, this becomes active as soon as an
existing Group is selected. If deleting a group containing some MACHs, these are automatically
reassociated to the respective DLCs.
3.2.3.5
How to add an instrument to a group (Arrow button)
Having created a group (see Chapter 3.2.3.1 How to add a new Group (Add button)), simply
select it, choose a MACH from amongst those displayed on the left and click Right arrow that will
light up in green.
FIG. 19
20
WarpNet V2.8
DUCATI energia s.p.a.
In this example the MACH (MachSmart 96) known as Elevator is about to be inserted in the
Shed Group.
Likewise, to remove a MACH from a group, simply select an instrument from the panel on the
right in order to enable the Left Arrow button. In this manner, after clicking the button, the MACH
will be reassociated to the respective DLC.
3.2.4
Starting and managing measurement sessions (Session Setup)
In order access "Session Setup" functions you first need to create a DLC resource (see Chapter
3.2.1 Creation and management of DLC resource (DLC Setup)) and set up an Instrument Network
(see Chapter 3.2.2 How to configure the network of analysers to be associated to a DLC (MACH
Setup)). Next, go to the main menu and click Configuration -> Session.
FIG. 20
A session of measurement consists of a set of acquisitions relating to measures and time period
that are both user-selectable.
3.2.4.1
The data recording interval
The user can select the following parameters in the Data storage box:
21
WarpNet V2.8
DUCATI energia s.p.a.
• screen refresh periodvi
• How many refresh periods must occur before data recording.
FIG. 21
The two parameter determine the data recording interval. For example inserting one minute in
Screen refresh period and 5 in Data recording every the storage happen every 5 minute.
On the other hand, should you select a data save time of Quarter of hour, the above-mentioned
parameters are set automatically. See precedent the picture.
3.2.4.2
The synchronization of the network
Set this option allows the possibility of synchronization all the instruments of the net.
FIG. 22
Synchronizing the instruments means to send to all the network instruments, a reset command
for the mean values computation e.g. average power .(See Cap 0 Command Section). Thanks to this
command, all the instruments will restart the mean values computation at that moment resulting in
the contemporary average computation in the same time interval for all the instruments in the
network. Of course to get all the benefits of this feature, it is required that all instruments are
programmed with the same "Average Time" parameter (mean interval time). After sending this
"reset" command, for all the acquisitions during the first following mean period, you will get stored
"0" values on all the mean and maximum values (e.g mean power). This effect is inevitable: if the
data are stored before the reset, the "0" will appear on the following acquisition, if the reset is sent
before the storing of data, the "0" will appear in this acquisition.
In case in a measurement session you are not interested in the average values, or rather you are
not interested them to be synchronized, the automatic synchronization can be disabled unchecking
Synchronization check Box.
The synchronization command as two options:
vi
This minimum value for the parameter is calculated automatically in accordance with the complexity of the network.
22
WarpNet V2.8
DUCATI energia s.p.a.
•
One time at the end of first Store: this option force a reset after the first acquisition and
storing. This operation then does not occur any more.
•
Ever XX Day/s at time: hh.mm: this option allow you to setup a regular synchronization.
You have to select at what time you wish to get the network synchronization and how many
days waiting for the next automatic new reset (interval selction). The first command is
issued at the first match of the clock time. After the first command, the program will wait the
preset days interval before sending the next one.
3.2.4.3
Setup the measure session
The figure below illustrates the selection of a group.
FIG. 23
In order to show that a measurement needs to be stored, simply tick the box next to it. The Add
this selection to all the group button will arrange to add the selected measurements for the
instrument currently being displayed to all MACHs in the group.
23
WarpNet V2.8
3.3
3.3.1
DUCATI energia s.p.a.
Display Menu
How to display data acquired in table form
Measurement “sessions” allow the acquisition of vast amounts of data concerning three-phasenetwork voltages, currents, power, power factors, etc., thanks to all the MACHs that make up the
measuring network created by the user.
Data regarding the measures chosen by the user during the session setup stage can be viewed in
table form. Simply go the Display Menu and click Measurement table.
FIG. 24
Data are displayed in columns; the first two on the left show the names of the instrument groups
and the names of the MACHs assigned by the user to each group, respectively. The Configure
button can be used to exclude one or more measures from being displayed in the table.
There are 5 different colours for the data boxes as indicated in the table above the grid:
Red: reception error. The measurement in question has not been received as a result of either a
reception error or an instrument malfunction. This means that the measurements taken will be
missing from the database.
Green: measurement not selected. Indicates that the measurement is among those available for
that particular instrument, but the user has not selected it in the group to be stored.
Blue: measurement not available. The measurement in question is not present amongst those
that can be taken by the MACH to which the box corresponds.
Grey: measurement not visible.
24
WarpNet V2.8
DUCATI energia s.p.a.
Should the user decide that he does not want to display certain measurements, for example in
order to make a table more readily comprehensible, the configure button allows him to choose
which boxes to display or hide.
If you select an entire column not to be visible, it will be automatically hidden and even the grey
will no longer be displayed.
Yellow: undefined measurement. If the instrument is operating, but the measurement requested
cannot be taken, it will respond with undefined measurement. For example, if current is zero, it is
not possible to measure the power factor.
3.3.1.1
Tabular display options (Configure)
FIG. 25
In order to hide the quantity of a MACH, simply select the instrument on the left and on the
right tick any measurements you don't want to be visible.
Select All allows you to select all measures that appear and display them in the table. This
will basically take the display back to its original configuration.
Use of the button Hide the selected measures in all the network allows
the user to hide the quantity selected in all MACHs of the network. This will result in the respective
column being hidden whilst displaying in table form.
25
WarpNet V2.8
3.3.2
DUCATI energia s.p.a.
How to display group data acquired in table form
Besides displaying individual measurements, this software also allows you to view group values
in real time.
FIG. 26
In this display the first column shows the group names, whilst the others contain the associated
measurements. If the symbol "-*-" appears, this means that one or more MACHs present in that
group have an incongruous measurement, e.g. timeout or overflow . This will lead to an error in the
measurement database since the figure obtained from the sum of the measurements is not correct
and therefore undefined.
3.3.3
How to display data acquired in graphic form
Graphics are an even more explicit form of displaying data. In this manner it is possible to
monitor and calculate data trends over certain periods of time. This is useful, for example, when
analysing the setup of a system's average active power consumption in order to compare with the
contractual values agreed with the electricity supplier. Various graphic windows can be created,
each one showing different trends associated with single and groups of MACHs.
You can set the data graphic analysis configuration by accessing the Display menu from the
main window and clicking Add Chart Window.
FIG. 27
26
WarpNet V2.8
DUCATI energia s.p.a.
The dialogue box has various sections as can be seen in the next figure:
Measure: this option lets you select the measure to display in graphic form. After choosing this
parameter, you will see a list appear on the right that is restricted to the groups and MACHs having
that particular selection amongst their associated measures.
Real-time charts: by selecting this type of graphic, whenever the quantity is stored, the graph
will be updated by showing the quantity trend in real time. You need to select the length of the time
period to be used in creating the graph.
See Cap 3.5.3 for more information about the database graphical view.
Static charts: by selecting this type of graphic, you will obtain the graph for a certain period
between the first and last instance of storage in the database, showing the trend for stored measures
over the selected period.
Once these options have been chosen, you can then decide which instruments and groups are to
be used for creating the graphics.
3.3.4
The Chart windows
FIG. 28
This pictures show a static Chart the you can generate with WarpNet Software. The Toolbar has
four buttons:
•
Copy to ClipBoard windows as picture the Chart
•
Print the chart directly to the Printer
•
Add or Remove a line alarm
3.3.4.1
Button Copy to clipboard
The first button
permit to copy the image of Chart in Windows ClipBoard. This operation
allow to paste the Chart in any active windows application like Word or Photo Paint.
27
WarpNet V2.8
3.3.4.2
The
3.3.4.3
DUCATI energia s.p.a.
Print button
button prints the chart. Clicking the button opens the standard printer dialog.
Setup alarm button
button opens the window shown in the picture below. Once activated, all the options for
The
the alarm can be selected.
FIG. 29
The Threshold Value is the value used for drawing the line on the Chart (See chapter 3.3.4 The
Chart windows).
The check box named “Blink on Alarm” cause the blinking of the chart window: the white
background is alternated with the red one. Below it can be selected the condition for the chart
alarm. Keep in mind that in case you have more curves displayed, the alarm condition is activated
on all the displayed objects in the chart. Moreover the method for checking a possible alarm
condition depends on the type of chart displayed: in case of dynamic charts, then the condition is
applied only to the latest stored value, while in case of a static chart, all the points of the chart are
used for alarm condition.
3.3.4.4
The
3.3.5
Remove alarm button
button removes the alarm settings.
How to view the energy consuming dived by time bands
Select View -> time band table from main menu. With the next dialog box is possible to see the
energy consuming divided by time bands during period selected.
28
WarpNet V2.8
DUCATI energia s.p.a.
FIG. 30
There are two options:
Dynamic table: Select this option for obtain a dynamic table calculate between the date selected
and the last memorization. The data are recalculate using profile selected.
Static table: Select this option for obtain table calculated between the period select. The data
are recalculate using profile selected.
3.3.6
View time bands energy table
FIG. 31
FIG. 31 shows a time band energy table in static view. The toolbar has two buttons:
29
WarpNet V2.8
3.3.6.1
DUCATI energia s.p.a.
Print button
This button is used to make a hardcopy of the table. When the button is pressed the software
show the standard printer dialog box . Select the printer and press “print”.
3.3.6.2
Save button
This button is used to make a copy of the table in a text file. Select the output file and press
save.
3.4
Tools Menu
This section contains all those commands that can be given to network instruments at the same
time or in any event in quick succession. Command Section
This section contains the commands available for all network instruments. If you are using
instruments of the latest generation such as Smart Più (or later), this command will have immediate
effect thanks to "broadcast" command, whilst in the case of a mixed network, for all other
instruments it will be given in succession. Since the system recognises the various network
instruments, it will automatically send first the broadcast command, i.e. single command interpreted
by all new instruments, and thereafter will deal with all old instruments connected to the network.
Reset Energy: this command allows you to reset energy for all network instruments.
Reset average power: this command resets average and maximum average power. This will
also result in resetting of the instruments' internal timer that from that moment will begin counting
the time set in the Average Time parameter.
Lock keyboard: this command will block local access to the configuration menu from the
instrument keyboard.
Unlock keyboard: this command will restore the possibility of accessing the configuration
menu from the instrument keyboard.
3.4.1
Setting section
Average time: this command is used for fast setting of a single predetermined average time on
all instruments. This command is carried out in sequence, i.e. it is given to the instruments one at a
time, therefore there will be a slight shift in time when the next measurement update takes place; for
this reason, if you have a network of new instruments such as the Smart Più (which support
Broadcast commands), we recommend resetting average power (See chapter 0 Command Section)
in order to increase system synchronisation after this setting.
3.5
Stored measure
In this section you can manage the data of the database.
3.5.1
Management
This dialog allow to save or delete the data in the database of measure.
30
WarpNet V2.8
DUCATI energia s.p.a.
FIG. 32
This dialog window presents two sections: one represents the Database and the selection in
graphical mode (See chapter 3.5.3) and one to select the command to apply to the selection. In the
second section there are two options:
•
"Save in a new project the selection". During the execution of this command WarpNet
will ask the user where to save the new project. After this questions it will create a new
directory with the new project name and copy the entire project without the unselected data.
The user can open in a successive time the duplicated project for example using "Open
offline" command. (See Cap 3.1.3 How to open an existing project without connection to
DLC (open offline))
•
"Delete the selected database records". This command will delete all records of the
selection and the records can't be recovered. To enabled this command the selection must
include the first or the last record: to do it automatically use the two button on left ( ) and
the on the right( ).
Both these options can be used at the same time resulting as "cut and paste" command. At the
end of the operation a message indicate the result. At the end of all operations the database is
compacted automatically. This operation can take a long of time with database larger then 300 Mb.
Moreover being an atomic command, it is not possible to show a "progress bar" and therefore the
program can appear locked during this procedure, but is not.
The command Compact
doesn’t require any selection since it refers to the whole measure
database. This operation is recommended after having managed the measures or Mach (such as
deleted) since the simple deletion itself of records doesn’t produce a reduction of database
dimension.
This kind of operation could be time consuming, according to the size of archive; so try to
use this command frequently and maintain the database at a right dimension, in order to keep
the management operation time in acceptable values.
31
WarpNet V2.8
3.5.2
DUCATI energia s.p.a.
How-to-view the measurements (View)
This menu item opens a window that shows a table with the stored measurements, and a dropdown list to select the instrument to use.
FIG. 33
The numeric format of the measurements stored in the database and in this view are not
identical, therefore some measurements with decimal digits may be rounded with a tiny difference
from the stored value. For instance the value 50.0 may be shown as 50.0000000000001 or
49.999999999999999. To see all the decimal digits drag the column in the table.
32
WarpNet V2.8
3.5.3
DUCATI energia s.p.a.
How to export the stored measurements (Export)
When you click Export the following dialogue box will appear.
FIG. 34
The network configuration is displayed on the left. Each item selected by checking the check
box to its left will now be exported. Each selectable item on the left corresponds with the associated
measurements on the right (warning: if a single instrument or group is not selected on the left, the
associated measurements on the right will not be visible) and these can be selected as wellvii.
Four buttons may speed up the task of choosing the measurements to be exported.
Add those measures to all the group: offers the possibility of adding all checked
measurements to those already selected for the other instruments of the group.
vii
If deciding to export the measurements for a group, they cannot be chosen individually, but will be exported in their
entirety.
33
WarpNet V2.8
DUCATI energia s.p.a.
Add those measures to all network instruments: performs the same task as the previous one,
adding the measurements to all network instruments. Anyway if the instruments on the left are not
selected, the associated measurements will not be exported.
Select all: all instruments, groups and available measurements are selected for export. This is
the default setup.
Unselect all: this command offers you option to export nothing at all.
There are also two boxes that can be used to select the start and end of the time period to which
export should correspond.
Show time bands: adds a column to the output file with the time band of the measure.
Export interval
To choose the export interval is possible to use the graphic bar named "View of database
record" and also manually insert in the box below the value of the first and last date to export. In
any case the graphic bar represents the interval selected.
Once all choices have been made, you can proceed by clicking export. This operation will open
a standard file save dialogue box; the export format is Comma Separated Value, the column
delimiter is ";", whilst as regards numbers, the decimal separator depends on the configuration
chosen in the control panelviii and the file extension is "CSV".
How-to-import from a CSV file (Import)
3.5.4
Before importing a CSV file created from the WinCom5 program you should perform the
following two steps:
1.
Create a new Network Project
2.
Add a DLC connected to a serial port. The Ethernet option will not work.
Import the measurements selecting Stored Measure Æ Import, insert the filename from where
to import and confirm with OK. The progress bar shows the import status and the number of
imported rows.
The WinCom5 program usually adds new rows to the CSV file every day, therefore the same
file will be peridically imported again. All subsequent imports will only add the rows with a
DIFFERENT date/time from those already in the database. This will cause the one-hour period of
measurements during the transition from Daylight Savings Time to normal time to be discarded.
The imported sessions are always opened “Offline”.
Warning: When the number of instruments or the measurements of the DAT are changed a new
Session must be created, otherwise the new measurements will be discarded.
Before importing a new session please check that the destination disc is not full and that the
CSV file remains available, if it is on a network folder.
viii
Care should be taken when exporting a file with a certain setting for decimal numbers and importing in another PC
with different settings, the data could be interpreted incorrectly.
34
WarpNet V2.8
4.
DUCATI energia s.p.a.
WarpNet Client
WarpNet Client software is designed to provide user-friendly access over a network to a
WarpNet database.
4.1
Installation
In order to run WarpNet Client you will require:
•
IBM compatible personal computer with Pentium II processor or higher;
•
operating system: Windows 98/ME or Windows 2000/XP with the latest Service
Pack installed. Windows Vista is not supported;
•
at least 128 MB of RAM;
•
at least 100 MB of free space on hard disc
•
CD/DVD reader (only for installation)
•
A PC monitor with at least 1024x768 pixels of resolution;
•
A network connection to the folder where WarpNet is installed
The WarpNet folder must be shared for reading and writing from the PC where WarpNet
Client is installed.
Before installing WarpNet Client close all application running on the PC.
Installation is achieved by running the setup.exe program from the CD-ROM using My
Computer or the Run option from the Windows Start Menu.
35
WarpNet V2.8
4.2
DUCATI energia s.p.a.
Using WarpNet Client
Start WarpNet Client selecting -> Programs -> Ducati -> WarpNet from the Start
menu.
The first time WarpNet Client is run it will show the main window of FIG. 35
FIG. 35
Opening a session with WarpNet Client is similar to opening the same session in Off Line mode
with WarpNet, with the only difference that:
• it is not possible to view or modify the Groups or the Session settings
• the disabled menu in WarpNet are NOT shown with WarpNet Client
36
WarpNet V2.8
DUCATI energia s.p.a.
DUCATI energia S.p.A. shall accept no liability for damage or personal injury arising from
incorrect or improper use of its equipment.
This manual refers to WarpNet version V2.8 or later
This documentation is subject to change without prior notice.
Documentation code : UserManual_WarpNet28_0A.doc - Version 0.A – October 2007
Via M.E. Lepido, 182 - 40132 BOLOGNA – P.O. Box 4052 BorgoPanigale
Phone.: 051 404140 - Fax: 051 402040 - WEB: www.ducatienergia.com
37