1
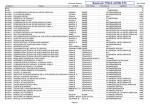
Regional Operational Plan CF.4K.2014.21 Pauls Bay Sockeye Salmon Stock Assessment 2014 by Natura Richardson May 2014 Alaska Department of Fish and Game Divisions of Sport Fish and Commercial Fisheries 1 Symbols and Abbreviations The following symbols and abbreviations, and others approved for the Système International d'Unités (SI), are used without definition in the following reports by the Divisions of Sport Fish and of Commercial Fisheries: Fishery Manuscripts, Fishery Data Series Reports, Fishery Management Reports, and Special Publications. All others, including deviations from definitions listed below, are noted in the text at first mention, as well as in the titles or footnotes of tables, and in figure or figure captions. Weights and measures (metric) centimeter deciliter gram hectare kilogram kilometer liter meter milliliter millimeter cm dL g ha kg km L m mL mm Weights and measures (English) cubic feet per second foot gallon inch mile nautical mile ounce pound quart yard ft3/s ft gal in mi nmi oz lb qt yd Time and temperature day degrees Celsius degrees Fahrenheit degrees kelvin hour minute second d °C °F K h min s Physics and chemistry all atomic symbols alternating current ampere calorie direct current hertz horsepower hydrogen ion activity (negative log of) parts per million parts per thousand volts watts AC A cal DC Hz hp pH ppm ppt, ‰ V W General Alaska Administrative Code all commonly accepted abbreviations all commonly accepted professional titles at compass directions: east north south west copyright corporate suffixes: Company Corporation Incorporated Limited District of Columbia et alii (and others) et cetera (and so forth) exempli gratia (for example) Federal Information Code id est (that is) latitude or longitude monetary symbols (U.S.) months (tables and figures): first three letters registered trademark trademark United States (adjective) United States of America (noun) U.S.C. U.S. state AAC e.g., Mr., Mrs., AM, PM, etc. e.g., Dr., Ph.D., R.N., etc. @ E N S W Co. Corp. Inc. Ltd. D.C. et al. etc. e.g. FIC i.e. lat. or long. $, ¢ Jan,...,Dec U.S. USA United States Code use two-letter abbreviations (e.g., AK, WA) Mathematics, statistics all standard mathematical signs, symbols and abbreviations alternate hypothesis base of natural logarithm catch per unit effort coefficient of variation common test statistics confidence interval correlation coefficient (multiple) correlation coefficient (simple) covariance degree (angular ) degrees of freedom expected value greater than greater than or equal to harvest per unit effort less than less than or equal to logarithm (natural) logarithm (base 10) logarithm (specify base) minute (angular) not significant null hypothesis percent probability probability of a type I error (rejection of the null hypothesis when true) probability of a type II error (acceptance of the null hypothesis when false) second (angular) standard deviation standard error variance population sample HA e CPUE CV (F, t, 2, etc.) CI R r cov ° df E > HPUE < ln log log2, etc. ' NS HO % P " SD SE Var var REGIONAL OPERATIONAL PLAN CF.4K.2014.21 PAULS BAY SOCKEYE SALMON STOCK ASSESSMENT by Natura Richardson Alaska Department of Fish and Game, Division of Commercial Fisheries, Kodiak Alaska Department of Fish and Game Division of Commercial Fisheries May 2014 The Regional Operational Plan Series was established in 2012 to archive and provide public access to operational plans for fisheries projects of the Divisions of Commercial Fisheries and Sport Fish, as per joint-divisional Operational Planning Policy. Documents in this series are planning documents that may contain raw data, preliminary data analyses and results, and describe operational aspects of fisheries projects that may not actually be implemented. All documents in this series are subject to a technical review process and receive varying degrees of regional, divisional, and biometric approval, but do not generally receive editorial review. Results from the implementation of the operational plan described in this series may be subsequently finalized and published in a different department reporting series or in the formal literature. Please contact the author if you have any questions regarding the information provided in this plan. Regional Operational Plans are available on the Internet at: http://www.adfg.alaska.gov/sf/publications/ Note: Product names used in the publication are included for completeness but do not constitute product endorsement. The Alaska Department of Fish and Game does not endorse or recommend any specific company of their products. Natura Richardson, Alaska Department of Fish and Game, Division of Commercial Fisheries, 351 Research Court, Kodiak, AK 99615, USA This document should be cited as: Richardson, N. 2014. Pauls Bay sockeye salmon stock assessment. Alaska Department of Fish and Game, Division of Commercial Fisheries, Regional Operational Plan ROP.CF.4K.2014.21, Kodiak. The Alaska Department of Fish and Game (ADF&G) administers all programs and activities free from discrimination based on race, color, national origin, age, sex, religion, marital status, pregnancy, parenthood, or disability. The department administers all programs and activities in compliance with Title VI of the Civil Rights Act of 1964, Section 504 of the Rehabilitation Act of 1973, Title II of the Americans with Disabilities Act (ADA) of 1990, the Age Discrimination Act of 1975, and Title IX of the Education Amendments of 1972. If you believe you have been discriminated against in any program, activity, or facility please write: ADF&G ADA Coordinator, P.O. Box 115526, Juneau, AK 99811-5526 U.S. Fish and Wildlife Service, 4401 N. Fairfax Drive, MS 2042, Arlington, VA 22203 Office of Equal Opportunity, U.S. Department of the Interior, 1849 C Street NW MS 5230, Washington DC 20240 The department’s ADA Coordinator can be reached via phone at the following numbers: (VOICE) 907-465-6077, (Statewide Telecommunication Device for the Deaf) 1-800-478-3648, (Juneau TDD) 907-465-3646, or (FAX) 907-465-6078 For information on alternative formats and questions on this publication, please contact: ADF&G, Division of Sport Fish, Research and Technical Services, 333 Raspberry Rd, Anchorage AK 99518 (907) 267-2375 25 i TABLE OF CONTENTS Page LIST OF FIGURES ......................................................................................................................................................iii LIST OF APPENDICES .............................................................................................................................................iii ABSTRACT .................................................................................................................................................................. 1 PURPOSE...................................................................................................................................................................... 1 OBJECTIVES................................................................................................................................................................ 1 METHODS .................................................................................................................................................................... 2 Adult Enumeration ........................................................................................................................................................ 2 Weir Installation ....................................................................................................................................................... 2 Weir Operation ......................................................................................................................................................... 3 Weir Maintenance ..................................................................................................................................................... 3 Age, Sex, and Length (ASL) Sampling ......................................................................................................................... 3 Fish Counter .................................................................................................................................................................. 4 Fishery Use Monitoring ................................................................................................................................................. 4 Spawner Surveys ........................................................................................................................................................... 4 Physical Data Reporting ................................................................................................................................................ 4 OTHER REQUIREMENTS .......................................................................................................................................... 4 Safety ............................................................................................................................................................................. 4 Emergencies .................................................................................................................................................................. 5 Resupply ........................................................................................................................................................................ 5 Reporting ....................................................................................................................................................................... 5 Timesheets ..................................................................................................................................................................... 6 SCHEDULE AND DELIVERABLES .......................................................................................................................... 6 Tasks .............................................................................................................................................................................. 6 Deliverables ................................................................................................................................................................... 6 RESPONSIBILITIES .................................................................................................................................................... 7 REFERENCES CITED ................................................................................................................................................. 7 FIGURES ...................................................................................................................................................................... 9 APPENDIX A. ADULT SAMPLING ......................................................................................................................... 17 APPENDIX B. ADULT FISH COUNTER MANUAL............................................................................................... 31 APPENDIX C. TIMESHEET INSTRUCTIONS ........................................................................................................ 47 ii LIST OF FIGURES Figure 1. 2. 3. 4. 5. 6. 7. Page Location of Pauls Bay drainage area. ............................................................................................................ 10 Historical photo of Pauls Bay weir. ............................................................................................................... 11 Pauls Bay Daily Escapement Reporting Form. ............................................................................................. 12 Pauls Bay Drainage Visitor Count Form. ...................................................................................................... 13 Pauls Bay drainage spawning survey areas. .................................................................................................. 14 Pauls Bay Drainage Spawning Survey Form. ............................................................................................... 15 Pauls Bay Daily Physical Observation Form ................................................................................................ 16 LIST OF APPENDICES Appendix Page A. ADULT SAMPLING ...................................................................................................................................... 17 A1. Statistical (sampling) weeks and associated calendar dates. ....................................................................... 18 A2. Procedure for sampling adult salmon age, length, and sex.......................................................................... 19 Sampling Procedures ..................................................................................................................................... 19 Data Entry/Management................................................................................................................................ 22 Entering Data Into The RDA ......................................................................................................................... 22 Enter Background Info .................................................................................................................................. 23 Sample Next Fish .......................................................................................................................................... 24 DATA MANAGEMENT .............................................................................................................................. 26 Backing up Data ............................................................................................................................................ 26 Downloading Data to Netbook ...................................................................................................................... 26 Editing, Naming, and Saving Data ................................................................................................................ 26 Transferring Data from Netbook onto USB Flash Drive ............................................................................... 27 POWERING THE NETBOOK AND RDA .................................................................................................. 27 Some Notes and Reminders .......................................................................................................................... 28 TROUBLESHOOTING ................................................................................................................................ 28 Resetting the RDA ........................................................................................................................................ 28 Hotsync Error Message ................................................................................................................................. 29 B. ADULT FISH COUNTER MANUAL ............................................................................................................. 31 B1. Adult fish counter manual. .......................................................................................................................... 32 C. TIMESHEET INSTRUCTIONS ....................................................................................................................... 47 C1. Timesheet instructions. ................................................................................................................................ 48 iii iv ABSTRACT From 1978 to 2004, the Alaska Department of Fish and Game (ADF&G) operated an adult salmon enumeration weir at the outlet of Pauls Lake located on the north side of Afognak Island. Since 2005, aerial surveys and occasional foot/boat surveys have been used to enumerate escapements into Pauls Lake. Aerial surveys for this system are ineffective and foot/boat surveys tend to underestimate escapement, yet reliable escapement counts are necessary to manage salmon populations. To provide reliable escapement counts of sockeye salmon entering Pauls Bay drainage, ADF&G will reestablish a picket weir at the outlet of Pauls Lake. Age, sex, and length information will be gathered from sockeye salmon escaping into Pauls Lake. An automatic fish counter will be installed and operated at the Laura Creek fish pass exit to test the feasibility of accurately assessing escapement into the upper-Pauls Bay drainage. Fish pass maintenance, spawner distribution surveys, genetic sampling, and fishery harvest monitoring will also be included in the scope of this project. This operational plan provides the instructions and procedures to properly operate the adult escapement weir and fish counter, perform spawner distribution surveys, and monitor fishery use while maintaining a safe and effective working environment during field camp operations. Key words: Pauls Bay, sockeye salmon, escapement, Laura Lake, fish pass, automatic fish counter, weir PURPOSE The primary goal of this project is to accurately count sockeye salmon entering into Pauls Bay drainage (PBD) located on the north side of Afognak Island (Figure 1). A sockeye salmon (Oncorhynchus nerka) run was established in PBD by the Alaska Department of Fisheries in the 1950s (Honnold and Edmundson 1993). This was accomplished through construction of fishways to bypass a series of barrier falls and transplanting eggs from Southeast Portage Creek and Karluk Lake as broodstock (Honnold and Edmundson 1993). By 1958, the sockeye salmon run was self-sustaining (Schrof et al. 2000) and has become an important subsistence resource to Kodiak residents. Pauls Bay commercial catches and effort have been increasing since 2002 and subsistence efforts have shown a marked increase within the last five years (ADF&G, unpublished data). Since the lake and river systems on Afognak Island are relatively small and easily accessible, they are at risk to overexploitation (Dinnocenzo and Caldentey 2008). Monitoring the sockeye salmon escapement back into the PBD is important for the long term sustainability of the run and allows for maximized harvest opportunities for commercial, sport, and subsistence users. OBJECTIVES The project objectives are 1. Enumerate adult sockeye salmon migrating into Pauls Lake, 2. Collect age, sex, and length (ASL) data from the sockeye salmon escapement into Pauls Lake, 3. Install, calibrate, and maintain an automatic fish counter at the upstream end of the Laura Creek fish pass, 4. Conduct weekly foot and/or boat surveys of Pauls Lake, Laura Lake and Creek, and Gretchen Lake and Creek for sockeye spawner distribution, and 5. Monitor and report commercial and subsistence fishery use. 1 METHODS ADULT ENUMERATION Weir Installation The weir is constructed in 2 sections. The first section consists of 2 20′ aluminum I-beams (with 1″ holes drilled and 0.5″ between holes) and numerous aluminum conduit pieces used as pickets (Figure 2). The second section consists of 2 4″x4″ wooden beams (with 1″ holes drilled at 0.5″ increments) and numerous aluminum conduit pieces used as pickets. The weir is constructed in a V-shape around a large exposed rock and spans approximately 25′ (Figure 2). 1. A large wooden beam (currently located near the stream bank) will be placed downstream of the weir and used as a catwalk. Place the beam between the flattened section of the large exposed rock (located in the middle of the stream) and the stream bank. The beam will be installed first and cabled to the bank as it will float during high water events. 2. The longest weir section will be installed upstream of the wooden beam between the large exposed rock and shore. Place one of the aluminum I-beam pieces (hereafter referred to as Ibeam) at a slight downstream angle to the wooden beam and support with sandbags on the stream bottom. 3. Place the second I-beam piece, such that the rebar protruding from the large exposed rock slides through the end hole of the I-beam with the other end supported by the river bank. Sandbags will be used between and on top of the I-beam to secure the pieces once they are positioned properly. 4. 1″aluminum conduit pipes will be fitted into the holes of both the upper and lower I-beam. The I-beam may need adjusting so that the pieces of conduit slip into place easily. Tap pickets down to secure into place. 5. The shorter section of weir will be installed similarly on the opposite side of the rock but 4″x4″ wooden beams with 1″ holes will be used in place of I-beam. The wooden beams may require cutting to fit the needed length. 6. Use an Aqua scope to inspect underwater for any holes surrounding the large exposed rock or weir bottom. Use sandbags to fill any holes. 7. A rope will be secured from bank to bank to prevent the weir from being pushed into the lake during high tides. 8. To assist in identification of jacks, draw a 400 mm line on a flash panel. Draw the line such that it will be perpendicular to the weir when the panels are in place on the river bottom. 9. Install flash panels in front of and against each counting section of the weir. Place panels on the river bottom and weigh down with large rocks or sandbags. 10. Inspect your work. Walk along the front of the weir backfilling the base with gravel where necessary to ensure the weir is fish tight. 2 Weir Operation 1. Monitor the weir throughout the day and pass fish as soon as they build up. Mornings, evenings and high tides are typically the best times for fish passage. The crew leader will organize a schedule. 2. When counting fish and conducting surveys, wear polarized glasses for greater visual recognition. 3. The project leader, supervisor, or designee will train personnel to visually recognize the different salmon species and their swimming patterns. When fish have accumulated behind the weir, take time to visually study them and note differences as they pass through the weir. 4. Count fish by lifting 1 or 2 pickets and enumerate them as they pass through with handheld tally denominators, 1 for each species. Monitor the quality of passing fish, including the number of net-marked and “jack” (< 400 mm) sockeye salmon. 5. Periodically check your handheld tally denominators to ensure they are working properly. 6. When finished counting make sure the picket is secured back into place and the weir is fish tight. 7. Adult numbers will be recorded at the end of each day on the Pauls Bay Daily Escapement Reporting Form (Figure 3). Weir Maintenance 1. The weir must be cleaned and inspected daily. Debris build up on the weir may cause poor water flow, leading to scouring at the base of weir pickets and weir washout during periods of high water. 2. Cleaning the weir includes getting into the river to remove sticks, logs, leaves, grass, gravel, fish carcasses, and garbage. 3. Throw all debris (except garbage) over the weir, allowing it to flow down river. 4. Frequently inspect the weir to ensure it is fish tight; look for scouring, pickets out of place, gaps (greater than a fingers width), sandbags that have been pushed by bears, and unsecured flash panels. Make repairs as needed. Use the Aqua scope to enhance visibility. 5. Make sure the framework of the weir is sound and secure. If the boardwalk is loose, or any section or part of the weir is broken or unsafe, repair it immediately. 6. If a weir wash out is possible, closely monitor fish build-up below the weir for fish pass estimation. Pull a couple pickets and count fish passing. If the water level continues to rise, pull more pickets. Pull pickets from the center of the weir or where the current is the greatest. 7. Keep bears away and off of the weir as much as possible to minimize damage. Try to maintain a perimeter around the camp that is a No-Bear-Zone. Only scare (haze) bears if the crew is comfortable doing so and it is not a dangerous situation. AGE, SEX, AND LENGTH (ASL) SAMPLING A minimum of 600 adult sockeye salmon ASL samples will be collected each year as described by Moore (2014);(Appendix A). Three hundred samples will be collected during each of the 2 historical peaks, approximately mid-June and mid-July, for a total of 600 samples. Using a beach 3 seine, adults will be captured at the head of Pauls Lake, near the Laura Creek terminus into the lake. After samples have been collected, 1 axillary process will be removed from the right side of the fish to mark the fish as sampled to reduce sample duplication. FISH COUNTER The automatic adult fish counter will be installed in the Laura Creek fish pass approximately 1 week after weir installation. The project biologist will be on site to instruct crew in the installation and maintenance of the fish counter. Crew will perform weekly inspections to ensure the fish counter is operating correctly. If problems arise with the fish counter, or counter numbers do not appear to align closely with weir counts, contact the project biologist immediately. The user manual (Appendix B) will be used for initial troubleshooting should operational problems occur. FISHERY USE MONITORING Daily observations of area use will be recorded on the Pauls Bay Drainage Visitor Count Form (Figure 4). The crew are to report visitor activity at least once daily and whenever substantial changes occur. Duties are to visually examine the bay and record the number of boats or float planes present as well as approximate location, persons, duration of visit, and type of fishery use. This does not require the crew to approach or contact area users; it is only a visual observation. If the crew observes any violations, they are to document the event and report to the project biologist. SPAWNER SURVEYS Spawner surveys of the Pauls Bay drainage will be conducted on a weekly basis beginning approximately June 15. The area is divided into 4 sections for which spawner counts will be assessed and recorded. The sections are upper Laura Lake, lower Laura Lake, Gretchen Creek, and Gretchen Lake (Figure 5). The Crew will perform foot surveys of Laura and Gretchen Creek and utilize a small inflatable watercraft with outboard to survey Laura and Gretchen Lake. Estimates of number of fish, visibility, location, and other informative observations will be recorded on the Pauls Bay Drainage Spawning Survey Form (Figure 6). PHYSICAL DATA REPORTING Air and water temperature, cloud cover, wind direction and velocity will be measured at noon daily throughout the season. This information will be recorded on the Pauls Bay Daily Physical Observation Form (Figure 7). OTHER REQUIREMENTS SAFETY Safety is the highest priority of this project. On-site personnel will exercise extreme caution when considering safety issues. Prior to field deployment each crewmember will be certified in CPR and First Aid, and have read the following sections of the ADF&G SOP guidelines. Safety Policy Standards Field Camp Safety Aircraft Passenger Safety 4 Small Tool Handling Firearm and Bear Safety The ADF&G safety policies will be reviewed and followed by each field crewmember at the beginning of the season and referenced throughout the field season. EMERGENCIES In the event of an emergency, use the “Emergency Response Flow Chart” that will be issued at deployment.. If an injury is life threatening, immediately call the Alaska State Troopers at 907486-4121 if on land or US Coast Guard at 907-428-4200 if at sea. Then call the section supervisor (Nick Sagalkin) at 907-486-1873 and call the project biologist (Natura Richardson) at 907-486-1851 ext 1907 during business hours or 907-512-7273 after hours. The US Coast Guard can also be reached on SSB radio frequency 4.125 MHz or on VHF channel 16. When contacting the U.S. Coast Guard, have the following information ready to pass along: Location of your field camp or specific location of the emergency (58.397222°N lat and 152.3419444°W long), Name and phone number of supervisor, General nature of medical emergency, Number of patients, Specific information regarding the patient (name, age, primary complaint, and vital signs), Your assessment and treatment, Wind and weather conditions, and Other information pertinent to a possible medical evacuation. RESUPPLY Resupply items (e.g., groceries, fuel, mail, etc.) will be sent via chartered float plane. All air charter flights will be set up by office staff. Appropriate information in regard to fight logistics and times will be relayed via satellite phone communications. When planning for the resupply flights it will be important to prepare back haul-items and maximize the use of the chartered aircraft. Items to send back to town should include empty fuel containers, mail, trash, timesheets and biological data as requested. REPORTING The crew leader will maintain a daily log of activities and events, including personnel issues or problems with the project. This log will be submitted to the Project Biologist at the end of the field season, and should be a detailed account of daily activities undertaken by themselves as well as the crew. Additionally, daily activities and any unusual events will be recorded by the crew and/or crew leader in the crew notes logbook. The crew leader will contact the project biologist daily at 1330 hours by telephone (486-1851 ext 1907) unless otherwise needed or predetermined. Any crew member may collect and report data but it is the responsibility of the crew leader to ensure daily recording is complete and check data for accuracy. The crew leader is also responsible for completing a comprehensive data and equipment inventory at the end of the season. 5 Because the Pauls Bay project has not been in operation for ten years, it is desirable for the field crews to photograph all aspects of the fieldwork. Photographs will be taken with a digital camera and downloaded on to the research field computer for storage. TIMESHEETS The crew leader is responsible for scheduling daily tasks. Tasks will be scheduled to minimize overtime. Overtime is limited, unless otherwise pre-authorized. The crew leader will document, as part of the daily log, all tasks that are performed and the actual hours worked to complete those tasks. Timesheets will be completed and sent on resupply flights to Kodiak before the 15th and the last day of each month. If timesheets must be sent in early, estimate work hours. Timesheets can be amended if the hours actually worked differ from the hours submitted on the original timesheet. Explicit directions for completing timesheets are located in Appendix C. SCHEDULE AND DELIVERABLES TASKS 1. Transport materials to Pauls Bay, refurbish cabins, and set up field camp. Target dates May 24–June 1. 2. Install and operate adult enumeration weir. Target date for installation June 1. Target dates for operation, June 1–August 7. 3. Install automatic fish counter in the Laura fish pass. Target date June 7. 4. Operate and maintain fish counter and fish passes. Target dates June 7–August 7. 5. Collect two monthly random ASL samples from 300 adult sockeye for a season total of 600. Target dates June 25 and July 25 6. Conduct weekly spawning surveys of Laura Lake, Gretchen Creek, and Gretchen Lake. Target dates June 15–August 7. 7. Collect daily fishery activity: (number or boats, type of fishing, location, number of people, etc). Target dates June 1–August 7. 8. Collect daily physical data: (air and water temperature, wind direction and velocity, precipitation and cloud cover). Target dates May 25–August 7. DELIVERABLES 1. Daily adult enumeration numbers will be recorded on the Pauls Bay Daily Escapement Reporting Form and reported to the Project Biologist daily. 2. Number of fish passing through the Laura Fish Pass will be recorded and stored on the automatic fish counter until downloaded at the Kodiak office. 3. Adult sockeye salmon ASL data will be collected and analyzed by the Kodiak office catch and escapement sampling staff. 4. Physical data will be recorded on the Pauls Bay Daily Physical Observation Form. 5. Fishery use will be recorded daily on the Pauls Bay Drainage Visitor Count Form. 6. Spawning surveys will be recorded on the Pauls Bay Drainage Spawning Survey Form. 6 RESPONSIBILITIES Project Biologist: Natura Richardson – ADF&G Fishery Biologist I Field Staff: Brian Korth – ADF&G Fish and Wildlife Technician III (FWT III) Katlyn Sorto – ADF&G Fish and Wildlife Technician II (FWT II) The project biologist, Ms. Richardson, will oversee the project operations and coordinate tasks so that the project goals are achieved. She will provide logistical and technical assistance, and write reports as required for the AKSSF Pauls Bay Sockeye Salmon Stock Assessment project. The FWT III field crew leader will coordinate day to day work schedules, collect and record data, as well as maintain responsibility for the timeliness and accuracy of all data collected. They are also responsible for daily and end of season reporting to the project biologist. The FWT II is responsible for data collection and recording and assisting the crew leader in all aspects of the project. All field crew will follow the ADF&G safety guidelines, and ensure daily operations are conducted in order to achieve overarching project goals. REFERENCES CITED Dinnocenzo, J., and I. O. Caldentey. 2008. Kodiak Management Area commercial salmon annual management report, 2007. Alaska Department of Fish and Game, Fishery Management Report No. 08-45, Anchorage. Honnold,S.G and J.A. Edmundson. 1993. Limnological and fisheries assessment of sockeye salmon (oncorhynchus nerka) production in the Laura Lake system. Alaska Department of Fish and Game, Division of Fisheries Rehabilitation, Enhancement and Development, Regional Information Report 130, Kodiak. Moore, M. L. 2014. Kodiak Management Area salmon catch and escapement sampling operational plan, 2014. Alaska Department of Fish and Game, Regional Operational Plan ROP CF.4K.2014.07, Kodiak. Schrof S. T., S. G. Honnold, J. Hicks, and J. Wadle. 2000. A summary of salmon enhancement, rehabilitation, evaluation, and monitoring efforts conducted in the Kodiak Management Area through 1998. Alaska Department of Fish and Game, Regional Information Report No. 4K00-57, Anchorage. 7 8 FIGURES 9 Laura Fish pass PBD Weir Figure 1.–Location of Pauls Bay drainage area. 10 Figure 2.–Historical photo of Pauls Bay weir. 11 Pauls Bay Daily Escapement Reporting Form Sockeye Adults Daily Date Counts Cumulative Sockeye Jacks Daily Cumulative Counts Other Species Total Daily Cumulative 12 * d=daily, c=cummulative Notes: (bear activity, weather, holes in weir, etc) Figure 3.–Pauls Bay Daily Escapement Reporting Form. King (d)* King (c)* Chum (d) Chum (c) Coho (d) Coho (c) Pink (d) Pink (c) PAULS BAY DRAINAGE VISITOR COUNT Date Boat(s) Plane(s) Fishery Use (commercial, subsistence, sport) 13 Figure 4.–Pauls Bay Drainage Visitor Count Form. Comments (ie. name of vessel, location, activity, # fish, duration of visit) Figure 5.–Pauls Bay drainage spawning survey areas. 14 Date Personnel PAULS BAY DRAINAGE SPAWNING SURVEY # of Adult Sockeye Visibility Upper Laura Lake South Laura LakeGretchen Creek Gretchen Lake NOTES 15 Figure 6.–Pauls Bay Drainage Spawning Survey Form. PAULS BAY DAILY PHYSCIAL OBSERVATION FORM Date Time Air Cloud Visibility (o C) cover % (miles) Wind direction 16 Figure 7.–Pauls Bay Daily Physical Observation Form Velocity (mph) Comments APPENDIX A. ADULT SAMPLING 17 Appendix A1.–Statistical (sampling) weeks and associated calendar dates. Week 10 11 12 13 14 15 16 17 18 19 20 21 22 23 24 25 26 27 Calendar Dates 1-Mar 8-Mar 15-Mar 22-Mar 29-Mar 5-Apr 12-Apr 19-Apr 26-Apr 3-May 10-May 17-May 24-May 31-May 7-Jun 14-Jun 21-Jun 28-Jun – – – – – – – – – – – – – – – – – – Week 7-Mar 14-Mar 21-Mar 28-Mar 4-Apr 11-Apr 18-Apr 25-Apr 2-May 9-May 16-May 23-May 30-May 6-Jun 13-Jun 20-Jun 27-Jun 4-Jul 28 29 30 31 32 33 34 35 36 37 38 39 40 41 42 43 44 45 18 Calendar Dates 5-Jul 12-Jul 19-Jul 26-Jul 2-Aug 9-Aug 16-Aug 23-Aug 30-Aug 6-Sep 13-Sep 20-Sep 27-Sep 4-Oct 11-Oct 18-Oct 25-Oct 1-Nov – – – – – – – – – – – – – – – – – – 11-Jul 18-Jul 25-Jul 1-Aug 8-Aug 15-Aug 22-Aug 29-Aug 5-Sep 12-Sep 19-Sep 26-Sep 3-Oct 10-Oct 17-Oct 24-Oct 31-Oct 7-Nov Appendix A2.–Procedure for sampling adult salmon age, length, and sex. SAMPLING PROCEDURES Place the salmon flat on its right side (the head should be toward the left). Measure the length (in mm) Adult salmon length is measured from mid-eye to tail fork because the shape of the salmon’s snout changes as it approaches sexual maturity. Slide the fish in place so that the middle of the eye is in line with the edge of the meter stick and hold the head in place with your left hand. Flatten and spread the tail against the board with your right hand. Read and record the mid-eye to tail fork length to the nearest millimeter. Please look at Figure 1. Figure 1.–Measuring fish length from mid-eye to tail fork. Determine the sex of the fish (escapement sampling only). Remove the preferred scale and place on scale card The preferred scale should be properly placed on a labeled scale (gum) card (Figures 2 and 3). Scale cards should be labeled as soon as possible. If sampling commercial catch, write the date the fish were caught on the card instead of the sampling date. The preferred scale is located 2 rows up from the lateral line, on a diagonal from the insertion (posterior) of the dorsal fin toward the origin of the anal fin (Figure 2). Samplers should be careful to make sure that the scale is not flipped over before it is placed on the scale card. -continued- 19 Appendix A2.–Page 2 of 11. Area A is the preferred area. If scales on the left side are missing, try the right side. Area B is the second choice if there are no scales in Area A on either side of the fish. Area C designates nonpreferred areas. Do not turn scale over. The preferred scale in this diagram is solid black. It is located 2 rows up from the lateral line, on a diagonal from the insertion (posterior) of the dorsal fin“back” toward the origin of the anal fin. Figure 2.–Removal and placement of the preferred salmon scale onto the scale card. -continued- 20 Appendix A2.–Page 3 of 11. Thescales scales arecorrectly correctly oriented on in thethecard the same direction, with ofthe The are all oriented on the card same in direction, with the anterior portion the anterior portion pointed toward theportion top of( which the card and the posterior scale pointed toward of thethe top scale of the card and the posterior is that portion of the scale held in the (the forceps) pointedoftoward the bottom card. portion portion the scale heldofinthethe forceps) pointed toward the bottom of the card. Thescales scales incorrectly oriented in different directions. This increases the time The areare incorrectly oriented in different directions. This increases the time spent to age samples. spend to age samples. Figure 3.–Scale orientation on scale card. -continued- 21 Appendix A2.–Page 4 of 11. DATA ENTRY/MANAGEMENT Data obtained while sampling is recorded using a Meazura Rugged Digital Assistant (RDA). The RDA is a waterproof device used to digitally record sampling data. Sample information is transferred from the device to a netbook after each sample. A USB flash drive is used to save and transfer data from the netbooks located in field camps, to the office, throughout the season. An RDA is shown in Figure 4. Figure 4.–Rugged Digital Assiatant (RDA). ENTERING DATA INTO THE RDA To begin using the RDA, turn it on by pressing the power button (Table 1). Using the stylus, tap the home icon in the bottom portion of the screen to bring up the main menu. It may be necessary to press the home icon several times to bring up the entire main menu. Next, tap the Forms 5.1 icon. Pendragon Forms (Forms 5.1) is the program that you will use to enter all of the sample data. After the icon is selected, the Pendragon Forms screen will appear. If a form was left open by a previous user, it may be necessary to hit the Quit or Done button to get to the main list of forms. Highlight the appropriate sampling form (ASL_2014.XX) and select New, which is found in the lower left corner of the screen. The four main buttons of the form will now be visable: Enter Background Info, Sample Next Fish, Review, and Quit. -continued- 22 Appendix A2.–Page 5 of 11. Table 1.–Buttons and Icons addressed in the text. Image Description Power Button - Button you will press on the RDA itself Home Icon - Use the stylus to navigate to the home screens Forms 5.1 Icon - Use the stylus to open pendragon forms 5.1 Quit This is an example of a button within pendragon forms. Use the stylus to select these buttons. ENTER BACKGROUND INFO Background information must be entered at the start of each sampling event. A new day always constitutes a new sampling event, so it will be necessary to enter new background information typically once per sampling day. For most projects, changing the background information each day will consist of updating the date only. It is important to edit background information when any change in sampling information occurs. The following topics constitute sampling information. If information in one of the following categories changes, it is necessary to change the background information. Species Select the appropriate species from the drop down list on the RDA, such as Sockeye. Project Indicate the pertinent project from the dropdown list. For example, if sampling adult sockeye escapement at a weir, choose Escapement. Management Area Choose the relevant management area from the dropdown list. Samples collected from Kodiak Island statistical areas must have Kodiak selected as the proper management area. Area Sampled Select the area that best represents where the fish were sampled, such as Ayakulik River, from the dropdown list. Location Type Indicate the type of area in which the fish were sampled. For example, if the fish were sampled at the Upper Station weir, choose Weir from the drop down menu. -continued- 23 Appendix A2.–Page 6 of 11. Gear Select the type of gear in which the fish were caught, such as Trap. Type of Length Measurement Designate the type of length measurement taken. Adult salmon lengths are typically measured from mid-eye to tail fork. Date of Sample Escapement sampling: Use the date the fish are sampled. Catch sampling: Use the date the fish were caught, even if this differs from the sample date. Sampler Initials Enter the initials of the sampling crew (up to 3 persons). This can be done by writing in the box on the bottom of the screen, or by using the pop up keyboard. Notes 1. When entering text, tap on the dot by the abc icon to bring up a keyboard. 2. To delete a character, place the stylus in the text box and draw a small straight line from right to left. SAMPLE NEXT FISH After entering background information, the RDA is ready to collect individual fish data. The Sample Next Fish button is used to enter the details of each fish sampled. It is not necessary to click on the Sample Next Fish button when entering the first fish of a new sample. After entering the background information, the form automatically knows to go to the sample next fish section of the form. As you continue to sample, simply tap Sample Next Fish or Next to enter individual fish data. This option is used when continuing to the next fish of a sample where no background information has changed. Fish data that is entered here is associated with the current background information logged. The following constitute fish data and should be entered for each fish. Scale Card Number Scale (gum) cards are numbered sequentially by date throughout the season starting with 1. A separate numbering sequence will be used for each species or major location change. Consult your crew leader for the current card number. It is crucial to make sure the number written on the scale card matches the scale card number entered into the RDA. The Scale card number will automatically advance to the next number after fish number 40 is recorded. Fish Number The fish number is the number of the fish on a particular scale card. This must be a number between 1 and 40. By default, the fish number in the RDA will automatically advance after each fish is sampled. It will also automatically go from 40 to 1. -continued- 24 Appendix A2.–Page 7 of 11. Sex Select the sex of the fish. Length in mm Enter the length of the fish from mid-eye to tail fork in millimeters (i.e., 534). If for some reason you do not collect a length measurement, enter 999. Fin Clip and Tag Color Select the Skip Fin Clip and Tag Color button if appropriate. If sampling involves fin clips or tags you can enter the optional fin clip and tag information. Indicate the type of fin clip (e.g., axillary process) or tag color using the drop down menus. Sample Next Fish Select Sample Next Fish to continue sampling. Review The review button can be a very useful tool during sampling. It can be used to ensure data being entered is accurate, or it can be used for editing fish data during a sample. The review portion of the form displays card number, fish number, sex, and length. The most recently sampled fish appear first. To enter the review screen, tap on the Review button on the main screen of the form. After the data has been reviewed and edited, tap the Done button on the bottom right of the screen to return to the main screen of the form. If Sample Next Fish is selected after leaving the review screen, the auto-increment will continue as if the review screen was never entered. Reviewing Data To review the last data entered, tap the Review button on the main screen of the form. Use the scroll bar on the right side of the screen to look at the fish that have been entered. Editing Data If fish data needs to be edited, tap on it using the stylus. Tap on the Sample Next Fish button to go through the fish data that was previously entered for that fish. Changes can be made as needed. Buttons chosen prior to the review are highlighted with asterisks. After a fish has been edited, the main review screen appears. If a fish is accidently selected from the main review screen, click the button that has the Card#-Fish# to return to the main review screen without going through the fish data. As mentioned above, tap Done to exit the review portion of the form and return to the main screen. Quit When sampling is complete, tap Quit to exit the form. -continued- 25 Appendix A2.–Page 8 of 11. DATA MANAGEMENT After sampling is done for the day, it is required that the data be backed up on the RDA itself, and then transferred (by HotSync) to the netbook. BACKING UP DATA After each sample the RDA should be backed up so that data is stored on both of the compact flash drives. Turn the RDA on and tap the home icon in the bottom portion of the screen to bring up the main menu. Tap the CardBkup icon if it is present and then the Backup Now button at the top left of the screen. The data will now be on both flash drives. If the RDA does not have a CardBkup icon, it will back up automatically. DOWNLOADING DATA TO NETBOOK Connect the communications cable into the RDA and a USB port on the netbook. Press the power button to turn on the RDA and begin a HotSync by tapping the home icon, and then the HotSync icon found on the main menu. Tapping the large icon in the center of the screen will start the HotSync operation (Figure 5). Please make sure the RDA is dry before downloading any data to the netbook. Figure 5.–HotSync Screens Found on RDA EDITING, NAMING, AND SAVING DATA If a mistake is realized during a sample it is often easiest to document the mistake and send the correction in with the USB flash drive for the Kodiak office to fix. If a mistake is made during the sample it can be changed using the review portion of the form in the RDA. Data can also be changed after it is downloaded onto the netbook, but is not recommended unless the Kodiak office is consulted first. A HotSync operation after changes have been made on the netbook will update the RDA. -continued- 26 Appendix A2.–Page 9 of 11. To view data, HotSync the RDA and open Pendragon Forms Manager (a shortcut should be located to the right of the start menu) on the netbook. Select the form (ASL_2014.XX), and click Edit/View under Data Functions on the right side of the window. All data will now be visible. Make the necessary changes here and exit out of the window to save. It is important to correct the numbers under the proper column and consult the Kodiak office. Hotsync the RDA to the netbook after any changes are made on the netbook to update the RDA with all changes. After data has been edited and verified, a copy of the database will need to be exported from the Pendragon software and saved on the netbook. In Pendragon Forms Manager, under Data Functions on the right side of the window, click To ASCII. Navigate to the folder in which the data is being saved. Type in the file name and then save. The file name should follow this format: Area_Sampled_YYYYMMDD.csv (e.g., Afognak_River_20140614.csv). After saving, a window will pop up stating the file has been created. Each .csv file will contain all of the data that has been collected up to that point in the season. Do not edit or save the .csv file as an Excel file or it will be difficult or impossible to upload the data into the database. TRANSFERRING DATA FROM NETBOOK ONTO USB FLASH DRIVE Up to date data should be sent into the main office as often as possible (e.g., with the grocery plane). Insert a USB flash drive into an appropriate port on the netbook. Double click on MyComputer, which is found on the desktop of the netbook. Navigate to the folder where your data is saved and highlight the most recent file (determined by the date) by single clicking. With the file highlighted, click on edit at the top of the window and then copy. Open up MyComputer and double click on the USB flash drive (often called Removable Disk) found under the heading Devices with Removable Storage. Click on edit at the top of the window, and then paste. The .csv file that was copied earlier will appear in the window indicating it was copied to the flash drive. Exit out of all windows and single click on the safely remove hardware button on the bottom right corner of the desktop in the quick start menu. Click on Safely remove USB Mass Storage Device. A pop-up will verify that it is now safe to remove the flash drive from the system. POWERING THE NETBOOK AND RDA 1. The RDA can be charged with either the AC or DC powering options. It is the crew leaders responsibility to keep it charged 2. The netbook can only be charged with the AC power adaptor, therefore plan accordingly for generator use. The charging light on the netbook is red when charging, and green when fully charged. 3. If there are powering problems, please contact the office immediately. -continued- 27 Appendix A2.–Page 10 of 11. SOME NOTES AND REMINDERS 1. Connect the AC adaptor to the bottom of the communications cable to charge the RDA batteries. If using the DC charger, connect the charger into the communications port. 2. If a mistake is noticed before moving onto the next fish, the previous button can be used to make changes in the RDA without having to go to the review screen or alter the data on the netbook. 3. Each length, sex, and scale must correspond to a single fish! It is the responsibility of the crew leader to be sure the data has been entered correctly. 4. For greater efficiency in scale reading, mount scales with anterior end toward top of gum card (Figure 3). 5. Never put data from different dates onto one gum card, and always enter new background information. Even if only one scale is collected that day, enter new background information and begin a new gum card the next day. 6. Be careful when collecting and mounting scales in wet conditions (rain, high humidity, etc.). If glue dries on top of the scale, it often obscures scale features, resulting in an unreadable scale. In addition, scales frequently adhere poorly to a wet gum card. Protect the cards and keep them dry to avoid having to remount the scales on a new card. If the cards get wet, try to dry them in a protected area or remount if necessary. Use a pencil when filling out gum cards, because ink will come off during pressing. 7. Responsibility for accuracy lies first with the primary data collector(s) and finally with the crew leader. Sloppy or incomplete data or gum cards will be returned to individual collectors for correction. 8. Ensure that all equipment is well kept. Electronics should be stored in a clean safe place. Dry off the RDA with a paper towel after sampling events. The RDA must be dry before transferring data to the netbook. RDA batteries must be charged to make certain sampling is not hampered. It is the responsibility of the crew leader to make sure that all data is carefully examined and edited before returning it to their supervisor. TROUBLESHOOTING RESETTING THE RDA If problems are encountered with the RDA, A soft reset can be done without losing data. To perform a soft reset hold the power and backlight button down together and release at the same time. If a soft reset does not work, the office should be contacted about other options for resetting. -continued- 28 Appendix A2.–Page 11 of 11. HOTSYNC ERROR MESSAGE HotSync message includes "Exceeded user storage space limit of 500KB in form 'ASL_ 2014.XX' 1. 2. 3. 4. 5. 6. 7. 8. Open Pendragon Forms Manager Under Form Function click on "Properties" Click on "Advanced Properties" Click on the "Synchronization Tab" Change the Storage Limit (KB) to 5000 instead of 500. Click "OK" Under Form Functions Click on "Distribute" Hotsync the RDA and the Netboo 29 30 APPENDIX B. ADULT FISH COUNTER MANUAL 31 Appendix B1.–Adult fish counter manual. -continued- 32 Appendix B1.–Page 2 of 14. -continued- 33 Appendix B1.–Page 3 of 14. -continued- 34 Appendix B1.–Page 4 of 14. -continued- 35 Appendix B1.–Page 5 of 14. -continued- 36 Appendix B1.–Page 6 of 14. -continued- 37 Appendix B1.–Page 7 of 14. -continued- 38 Appendix B1.–Page 8 of 14. -continued- 39 Appendix B1.–Page 9 of 14. -continued- 40 Appendix B1.–Page 10 of 14. -continued- 41 Appendix B1.–Page 11 of 14. -continued- 42 Appendix B1.–Page 12 of 14. -continued- 43 Appendix B1.–Page 13 of 14. -continued- 44 Appendix B1.–Page 14 of 14. 45 46 APPENDIX C. TIMESHEET INSTRUCTIONS 47 Appendix C1.–Timesheet instructions. TIMESHEET INSTRUCTIONS All ADF&G employees must fill out a timesheet biweekly and these timesheets must be turned in to the Administrative staff in Kodiak in a timely manner. Please follow these instructions when filling out your timesheets to avoid payroll problems. When a flight comes out to drop off groceries, or for any other reason, near the end of a pay period, camp personnel need to send in their timesheets. Fill in the timesheet up to the day you send them in and attempt to project your remaining hours worked. Fill out each of the following on the top of the timesheet: Pay period: pay periods start on the 1st or 16th of each month and end on the 15th or end of the month (example: June 1-15 or June 16-30). EIN: your employee identification number Name: full name Division: Commercial Fish In the actual timesheet table fill in the following items: Day: Monday, Tuesday, etc. Date: 6/16, 6/17, etc. Hours worked box: start and stop time in military time. Code 1: fill in the number of hours worked for that day (see example in Appendix G2). Work hours and Code 1 Totals should both equal the sum of daily hours worked. If your timesheet is sent in before the end of the pay period, project your time for the remaining days so you can total your columns. Charge to Table located on the bottom left-hand side of the timesheet should be left blank unless otherwise instructed by your project supervisor. Comments Table located on the bottom right-hand side of the timesheet should be left blank unless otherwise instructed by your project supervisor. Employee’s signature and date: Be sure to sign and date your timesheet. Crew leaders are responsible for reviewing each crew member’s timesheet before sending them to town to ensure that they are properly filled out. -continued- 48 Appendix C1.–Page 2 of 2. TIMESHEET SAMPLE 49