1
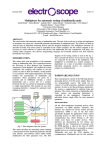
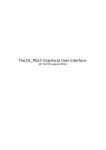
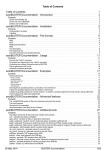
M ASARYK U NIVERSITY
N ATIONAL C ENTER FOR B IOMOLECULAR R ESEARCH
SiteBinder User Manual
Version 1.1.1
Contents
Chapter 1. Overview of SiteBinder . . . . . . . . . . . . . . . . . . . . . . . . . . . . . . . . . . . . . . . . . . . . . . . . . . . . . . 1
1. Running Environment . . . . . . . . . . . . . . . . . . . . . . . . . . . . . . . . . . . . . . . . . . . . . . . . . . . . . . . . . . . . . 1
2. Hardware Requirements . . . . . . . . . . . . . . . . . . . . . . . . . . . . . . . . . . . . . . . . . . . . . . . . . . . . . . . . . . . 1
3. Features . . . . . . . . . . . . . . . . . . . . . . . . . . . . . . . . . . . . . . . . . . . . . . . . . . . . . . . . . . . . . . . . . . . . . . . . . . . 1
3.1. Versions . . . . . . . . . . . . . . . . . . . . . . . . . . . . . . . . . . . . . . . . . . . . . . . . . . . . . . . . . . . . . . . . . . . . . . . . . . 1
4. Input Specification . . . . . . . . . . . . . . . . . . . . . . . . . . . . . . . . . . . . . . . . . . . . . . . . . . . . . . . . . . . . . . . . . 1
5. Output Specification . . . . . . . . . . . . . . . . . . . . . . . . . . . . . . . . . . . . . . . . . . . . . . . . . . . . . . . . . . . . . . . 2
6. User Interface . . . . . . . . . . . . . . . . . . . . . . . . . . . . . . . . . . . . . . . . . . . . . . . . . . . . . . . . . . . . . . . . . . . . . . 2
6.1. SiteBinder CMD . . . . . . . . . . . . . . . . . . . . . . . . . . . . . . . . . . . . . . . . . . . . . . . . . . . . . . . . . . . . . . . . . . 2
6.2. SiteBinder Graphical User Interface . . . . . . . . . . . . . . . . . . . . . . . . . . . . . . . . . . . . . . . . . . . . . . . 2
6.2.1. Structure List . . . . . . . . . . . . . . . . . . . . . . . . . . . . . . . . . . . . . . . . . . . . . . . . . . . . . . . . . . . . . . . . . . . 3
6.2.2. RMSD Panel . . . . . . . . . . . . . . . . . . . . . . . . . . . . . . . . . . . . . . . . . . . . . . . . . . . . . . . . . . . . . . . . . . . . 4
6.2.3. Structure List Pop-up Menu . . . . . . . . . . . . . . . . . . . . . . . . . . . . . . . . . . . . . . . . . . . . . . . . . . . . 4
6.2.4. Structure Manipulation Toolbar . . . . . . . . . . . . . . . . . . . . . . . . . . . . . . . . . . . . . . . . . . . . . . . . . 5
6.2.5. Settings . . . . . . . . . . . . . . . . . . . . . . . . . . . . . . . . . . . . . . . . . . . . . . . . . . . . . . . . . . . . . . . . . . . . . . . . 5
6.2.6. Atom Selection Tree . . . . . . . . . . . . . . . . . . . . . . . . . . . . . . . . . . . . . . . . . . . . . . . . . . . . . . . . . . . . 5
6.2.7. Progress Dialog . . . . . . . . . . . . . . . . . . . . . . . . . . . . . . . . . . . . . . . . . . . . . . . . . . . . . . . . . . . . . . . . . 6
6.2.8. Logs . . . . . . . . . . . . . . . . . . . . . . . . . . . . . . . . . . . . . . . . . . . . . . . . . . . . . . . . . . . . . . . . . . . . . . . . . . . . 6
6.2.9. Statistics Panel. . . . . . . . . . . . . . . . . . . . . . . . . . . . . . . . . . . . . . . . . . . . . . . . . . . . . . . . . . . . . . . . . . 6
6.2.10. Rendering Toolbar . . . . . . . . . . . . . . . . . . . . . . . . . . . . . . . . . . . . . . . . . . . . . . . . . . . . . . . . . . . . . 7
6.2.11. Direct3D Settings . . . . . . . . . . . . . . . . . . . . . . . . . . . . . . . . . . . . . . . . . . . . . . . . . . . . . . . . . . . . . . 7
6.2.12. Rendering and Highlighting . . . . . . . . . . . . . . . . . . . . . . . . . . . . . . . . . . . . . . . . . . . . . . . . . . . 7
6.3. Rendering Window . . . . . . . . . . . . . . . . . . . . . . . . . . . . . . . . . . . . . . . . . . . . . . . . . . . . . . . . . . . . . . 7
6.3.1. Display Types . . . . . . . . . . . . . . . . . . . . . . . . . . . . . . . . . . . . . . . . . . . . . . . . . . . . . . . . . . . . . . . . . . 7
6.3.2. Display Modes . . . . . . . . . . . . . . . . . . . . . . . . . . . . . . . . . . . . . . . . . . . . . . . . . . . . . . . . . . . . . . . . . 8
6.3.3. Highlights . . . . . . . . . . . . . . . . . . . . . . . . . . . . . . . . . . . . . . . . . . . . . . . . . . . . . . . . . . . . . . . . . . . . . . 9
6.3.4. Coloring . . . . . . . . . . . . . . . . . . . . . . . . . . . . . . . . . . . . . . . . . . . . . . . . . . . . . . . . . . . . . . . . . . . . . . . . 9
6.3.5. Saving . . . . . . . . . . . . . . . . . . . . . . . . . . . . . . . . . . . . . . . . . . . . . . . . . . . . . . . . . . . . . . . . . . . . . . . . . . 9
6.3.6. Bond Lengths . . . . . . . . . . . . . . . . . . . . . . . . . . . . . . . . . . . . . . . . . . . . . . . . . . . . . . . . . . . . . . . . . . 10
Bibliography . . . . . . . . . . . . . . . . . . . . . . . . . . . . . . . . . . . . . . . . . . . . . . . . . . . . . . . . . . . . . . . . . . . . . . . . . . . . . 11
ii
CHAPTER 1
Overview of SiteBinder
1. Running Environment
SiteBinder is a software package for Microsoft .NET Framework 3.5 and Microsoft DirectX
(more specifically its 3D part called Direct3D) for displaying graphics. The current version
works under all 32-bit platforms supported by .NET Framework including Windows XP Service Pack 3, Windows Server 2003, Windows Vista, Windows Server 2008 and Windows 7. In
addtition, a simple command line version of SiteBinder works on Linux and Mac using Mono
[1].
2. Hardware Requirements
The hardware requirements are the same as of the operating system the software is running
on. Furthermore, a graphic card that supports Direct3D is required (Direct3D support is fairly
common in today’s computers).
3. Features
The features of SiteBinder include:
Loading PDB structures: Structures in PDB format can be loaded.
Superimposing: Superimposing an arbitrary number of structures (limited by computer
memory and time constraints).
Calculation of RMSD: The RMSD of an arbitrary number of molecules can be computed.
Modeling Binding Site: Models of binding sites can be computed.
Statistics: A simple statististical analysis can be performed on the obtained data. The results can be exported to a CSV file for further processing (for example using Microsoft
Excel).
Rendering: Structures are rendered using Microsoft Direct3D.
Highlighting: Various types of highlighting are supported to enable the user a more
friendly manipulation of structures.
Exporting Results: Superimposed structures can be exported in PDB format. Also,
structures can be rendered to a PNG image.
3.1. Versions. Two major versions of the software are available:
SiteBinder: An application with rich graphical user interface.
SiteBinder CMD: A simple command line interface to SiteBinder Core.
4. Input Specification
SiteBinder supports input from the PDB file format, however, some restrictions apply:
• There can be only one structure contained in one file.
• Alternate locations of atoms are not supported.
• If a file contains more chains, only one chain can be displayed and operated with at
any given time.
In order for SiteBinder to work properly, these columns have to be filled:
Atom serial number: A unique integer identifier of the atom.
Atom name: String representing atom name.
1
6. USER INTERFACE
2
Element symbol: Element symbol of the atom, for example S, Ca, etc. If element symbol
is not filled, part of the atom name record is used instead (the first two characters of the
name).
Residue name: String representing the name of the residue the atom is in, usually the
name of an amino acid.
Residue sequence number: A unique integer identifier of the residue the atom is in.
Chain identifier: Usually represents the ternary structure of the protein.
Position: 3D coordinates of the atom.
Moreover, SiteBinder supports a special naming convention to make working with large a
number of structures easier:
• If a given file has the m prefix, all atoms in the structure get automatically selected
upon load.
• If there are files m x.pdb and ma x.pdb in the same directory, structure “x” will load
from the ma x.pdb file and atoms from m x.pdb will be selected.
5. Output Specification
By default the only output SiteBinder provides is a floating point number representing the
resulting RMSD (or two numbers if we consider the error of multiple alignment).
Nevertheless, aligned structures can be exported to PDB files with these properties:
• an m x.pdb file is created for each structure and contains its selected atoms.
• an ma x.pdb file is created for each structure and contains all of its atoms.
• The order of atoms in all exported (and aligned) structures is the following:
– First the selected atoms are stored.
– 1st atom in structure “x” corresponds to the 1st atom in structure “y”etc.
– Non-selected atoms are appended at the end of the file and sorted by their element
symbol.
• Only ATOM and HETATM records are exported.
• Only the currently selected chain is exported.
6. User Interface
6.1. SiteBinder CMD. SiteBinder CMD has a very simple command line interface working
as following:
sitebinder.cmd.exe s1.pdb s2.pdb ... si.pdb
All atoms in each structure are implicitly selected (the prefix conventions discussed above
are ignored).
If the loaded structures can be superimposed, the output is a number representing RMSD,
otherwise an error is reported.
6.2. SiteBinder Graphical User Interface. Figure 1.1 shows the SiteBinder GUI with several structures loaded and selected. The structure of the main window is split into four basic
parts:
Rendering Window: Shows the render of currently selected structures. Advanced features such as highlighting parts of a molecule are supported.
Superimposing Tab:
Structure List: Contains a list of structures and basic information about them, such
as which residues they contain.
Atom Selection Tree: A tree-view allowing the user to select atoms in structures.
RMSD Panel: Provides the value of the RMSD of the currently selected structures
(assuming they were superimposed) and the error of the alignment (if available);
located under the Structure List and Atom Selection Tree
Statistics Tab: Basic statistical analysis of the obtained values of RMSD.
6. USER INTERFACE
3
F IGURE 1.1. SiteBinder.
Furthermore, SiteBinder contains a log window allowing the user to see exceptions during
the program runtime, and detailed information about each superimposition.
Each of the individual components is described in detail bellow.
6.2.1. Structure List. The structure list is shown on figure 1.2.
Information provided by the structure list:
Id: Identifier of the structure (extracted from the filename of the structure).
Chain Identifier: Currently displayed chain.
Average RMSD (RMSD): (Arithmetic) average RMSD of the last superimposition operation.
Residues: Residue names of the residues contained in the given structure. String
CYSx2,HISx2 means there are 2 CYS and 2 HIS residues in the given structure.
Selected Atoms: Alphabetically ordered element symbols of selected atoms.
F IGURE 1.2. Structure list.
6. USER INTERFACE
4
Structures are grouped into five categories:
Added: Structures that were added and no changes were made to them.
Modified: Structures that were changed (changed selection or chain).
Superimposed: Structures that are currently superimposed along with the current average structures.
Previously Superimposed: Structures that used to belong to the Superimposed group.
Wrong Selection: Structures that could not be superimposed because their selections
were not compatible.
If any modification is made to the structures in the Superimposed group, the average structure is removed.
6.2.2. RMSD Panel. This panel contains the RMSD value of all currently superimposed and
selected structures. The value is calculated as
v
u
X X
m
u m −1 m−1
t
RMSD(S) =
RMSD(Si , Sj )2 .
2
i=1 j=i+1
where S is the set of the selected structures and m is the number of structures.
The RMSD of two structures is defined as
v
u n
u1 X
kAi − Bi k2 .
RMSD(A, B) = t
n
i=1
where n is the number of selected atoms. Finally, the “error” is calculated as the distance
from the theoretically optimal solution (i.e. the solution where each pair of structures in the
ensemble has the minimal distance when superimposed).Nevertheless, this number should be
taken with reserve as the optimal solution does not exist in general [2].
F IGURE 1.3. Structure list pop-up menu.
6.2.3. Structure List Pop-up Menu. The structure list pop-up menu (shown on figure 1.3) can
be invoked by right clicking inside the Structure List.
The following features are available:
Select This: Selects only the “clicked” structure and deselects all other structures.
Remove This: Removes the “clicked” structure.
Select Group: Selects all structures in the “clicked” structure’s group. The average structure is excluded from this selection and has to be selected manually.
Select All: Selects all structures. The average structure is excluded from this selection
and has to be selected manually.
Clear Selection: Deselects all structures.
Remove Selected: Removes all selected structures.
6. USER INTERFACE
5
Highlight: Puts highlight on the “clicked” structure. This visually distinguishes the
structure in the list.
Clear Highlight(s): Removes all active highlights.
Bond Color: Allows the user to change the color of the “clicked” structure.
Select Chain: Allows user to select a different chain on the “clicked” structure.
Export Selected: Exports all selected structures.
F IGURE 1.4. Structure manipulation toolbar.
6.2.4. Structure Manipulation Toolbar. The toolbar shown in figure 1.4 has the following features:
Add: Opens the add structure dialog.
Export: Exports all selected structures.
Reload: Reloads all structures.
Clear: Removes all structures.
Superimpose: Superimposes the selected structures.
Settings: This feature is discussed in a separate section bellow.
Log: Shows log.
Help: Shows help.
About: Shows ”about” dialog.
6.2.5. Settings. The following settings can be adjusted:
Load Hydrogen Atoms: If not checked, hydrogen atoms are ignored.
Enable Chain Selection: If checked, only one chain of a structure can be “active.” However, it is possible to select this active chain.
Allow Reflection: Enables/disables the feature to look for improper rotations as well.
Enabling this feature sometimes provides better fits by reflecting the structure. Nevertheless, in some cases the reflection transformation is not desired. By default, this
feature is disabled.
Method: Allows the user to select the method for the multiple alignment algorithm. One
slower (running in quadratic time), providing information about the quality of the
alignment, and another one faster (running in linear time), presenting only the value
of RMS. By default, the basic version of the algorithm is selected.
Grouping Level: Allows the user to manually override the grouping level to sometimes
achieve better results. There are three grouping levels:
1. Residue Name: Groups the atoms based on the information about residue names.
2. Residue: Groups the atoms based on the information about residue identifiers.
3. Element Symbol: Groups the atoms based on the information about element
symbols.
If grouping of level n is not possible (i.e. the selection of atoms does not allow
Residue Name grouping), grouping of level n + 1 is automatically used.
However, in some cases, even if Residue Name (Residue) grouping is possible, it may
not provide the optimal fit. In these cases, the problem might be solved by forcing a
higher level grouping (which usually means a somewhat slower computation). For
details please refer to the author’s Master’s thesis on SiteBinder [2].
By default, Residue Name grouping is used.
For the explanation of the individual settings please see author’s master’s thesis [2].
6.2.6. Atom Selection Tree. SiteBinder supports a comfortable selection of atoms (shown in
figure 1.5) for superimposing structures.
There are two modes of this function:
Single selection: A tree of atoms grouped by residue name is provided and individual
selection of atoms is possible.
6. USER INTERFACE
6
F IGURE 1.5. Atom selection for single (left) and multiple (right) structures.
Multiple selection: An aggregate of all atoms in all structures is computed based on the
number and type of residues, and on atom names. This allows for the selection of
the same atoms over multiple structures. The structures are grouped by the types of
residues they contain.
6.2.7. Progress Dialog. During the superimposition of structures, a progress dialog (shown
in figure 1.6) is displayed. The dialog provides the following information:
• Number of the current iteration and the error of the last iteration.
• Progress of the current iteration.
• Progress of the current superimposition of pairs of structures.
• Time elapsed since the operation has started.
F IGURE 1.6. Progress dialog.
Furthermore, the dialog gives the user the option to abort the process.
6.2.8. Logs. The logging dialog is used to display two types of information. One refers to
error reports on exceptions which occurred during program runtime, plus possible suggestions
of solutions. The other reports on the alignment operations and their summary. The log is reset
each time Superimpose is called.
6.2.9. Statistics Panel. The list in this panel contains structures from the “Superimposed”
group of the structure list. The standard deviation σ of the RMSD values is computed and the
structures are grouped in four groups based on the distance from the overall mean value (less
than σ, less than 2σ, less than 3σ, and greater than 3σ). Structures removed in the statistics tab
will be removed from the structure list in the superimposing tab as well.
6. USER INTERFACE
7
F IGURE 1.7. Log.
Furthermore, the information about structures can be exported to a CSV file to allow for
further processing (for example in Microsoft Excel). This feature can be accessed from the
statistics list’s context menu.
6.2.10. Rendering Toolbar. The rendering toolbar provides these features:
Resolution selection: allows the user to select the resolution of the image to be exported.
Save Image: Brings up the save image dialog.
Settings: Allows the user to select various colors and set up Direct3D.
Reset Camera: Resets the rotation and zoom to its original value.
Display options: Allows the user to change the current display type as discussed above.
F IGURE 1.8. Rendering toolbar.
6.2.11. Direct3D Settings. Direct3D Settings dialog (shown in figure 1.9) allows the user to
change the following settings:
Back Buffer Format: Represents the data format individual pixels are stored as.
Depth/Stencil Format: Data format for z-buffer and stencil-buffer (unused).
Multisample Type: The quality of anti-aliasing. The higher, the better the rendered images look like.
6.2.12. Rendering and Highlighting. SiteBinder supports rendering of molecules using Microsoft Direct3D 9.
6.3. Rendering Window. Structures in the rendering window can be rotated by pressing
the left mouse button and moving the mouse accordingly. Pressing the right button and moving
up or down zooms the structures.
6.3.1. Display Types. Two display types are supported:
All: Displays all the atoms of the structure (figure 1.10a).
Selected: Displays only selected atoms (figure 1.10b). Selected atoms are displayed using a different color.
6. USER INTERFACE
8
F IGURE 1.9. Direct3D settings.
Highlighting (see below) ignores display type. Therefore, it is possible to see highlighted
atoms even if they are not selected.
6.3.2. Display Modes. Two display modes are supported:
Balls: Atoms are displayed as balls (figure 1.11a).
Sticks: Only bonds are displayed (figure 1.11b).
(a) All.
(b) Selected.
F IGURE 1.10. Display types.
(a) Balls.
(b) Sticks.
F IGURE 1.11. Display modes.
6. USER INTERFACE
9
6.3.3. Highlights. A variety of highlight types (figure 1.12) are supported by SiteBinder:
(a) Whole structure.
(b) Residue name.
(c) Atom name.
(d) Residue serial number.
(e) Atom serial number.
(f) Mouse-over.
F IGURE 1.12. Highlight types.
Whole structure: The whole structure is highlighted by hovering over its ID in the structure list. Furthermore, there is an option to select a persistent highlight of a structure
that also distinguishes the given structure in the structure list.
Residues: All structures with a given set of residues are highlighted by hovering over
the names of the residues in the Atom Selection Tree (multiple selection mode only).
Residue name: All residues with a given name are highlighted by hovering over the
residue name in the Atom Selection Tree (multiple selection mode only).
Residue serial number: The residue with a given serial number is highlighted by hovering over the residue in the Atom Selection Tree (single selection mode only).
Atom name: All atoms with a given name are highlighted. Only the atoms in the original
atom’s residue are considered by hovering over the atom name in the Atom Selection
Tree (multiple selection mode only).
Atom serial number: The atom with a given serial number is highlighted by hovering
over the atom in the Atom Selection Tree (single selection mode only).
Mouse-over highlight: If the number of displayed structures is not too large, hovering
over atoms in the render window will give information about their element symbol,
name, serial number, residue, residue identifier, and the structure identifier.
6.3.4. Coloring. Atoms can be colored based on whether they are selected or not. Both
colors can be adjusted. Also, highlight color can be adjusted.
When a structure is loaded, it is assigned a random bond color to help distinguish individual structures. The bond color can also be adjusted.
6.3.5. Saving. Molecules can be rendered to a PNG image and saved to a file.
Five resolutions are supported: 640x480, 800x600, 1024x768, 1280x1024 and 1600x1200.
6. USER INTERFACE
10
6.3.6. Bond Lengths. The values of bond lengths are stored in the file BondLengths.xml
and can be adjusted by the user. All values are in Ångströms.
Three types of lengths can be adjusted:
Default Length: Specifies bond lengths for “unknown” atoms. Can be adjusted by
changing the line
<default value=x.y />
in BondLengths.xml.
Atom Radius: Specifies the “radius” of a given atom. Can be adjusted by changing/adding the line
<radius element=ElSymbol value=x.y />
in BondLengths.xml.
Bond Length: Specifies the maximum distance between two atoms, for which there is
still a bond. Can be adjusted by changing/adding the line
<bond element1=ElSymbol element2=ElSymbol value=x.y />
in BondLengths.xml.
Bibliography
[1] Wikipedia. Mono (software) — Wikipedia, the free encyclopedia, 2009. [Online; accessed 25-December-2009].
Available from: http://en.wikipedia.org/wiki/Mono_(software).
[2] David Sehnal. Multiple Structure Alignment and Exploring Protein Binding Sites. Master’s thesis, Masaryk
University Brno, 2010. Available from: http://is.muni.cz/th/140435/fi_m/.
11