1
Evaluation of ALM results
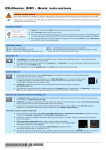
Zooming the graph display
The system allows zooming the graphs in 4 steps to improve the
presentation of signal curves:
• Move the cursor on the longitudinal axis (x-axis) to the desired centre
of the zoomed image and press the left mouse button. (When the
mouse pointer approaches the X-axis the cursor changes from an
arrow pointing diagonally upwards into a magnifying glass.) Then
press the left button. This procedure may be repeated four times.
• To return to the original view (zooming out), place the cursor at any
position on the longitudinal axis and press the right mouse button.
Note
In zoomed views, the axial length scale is not visible!
000000-1322-734_GA_GB-US_120608
101