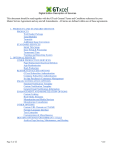
1
www.derivativefitch.com
Default Vector SME Model
User Manual
Version: 1.0
March 2007
Authors
Vasileios Papatheodorou
Ramachandran Balasubramanian
Imane Bakkar
www.derivativefitch.com
•
Table of Contents
Overview............................................................................................................................3
Installation Instructions......................................................................................................4
A. System Requirements.....................................................................................................4
B. Installation Checklist .....................................................................................................4
C. Downloading the VECTOR SME Model..........................................................................4
D. Installing the VECTOR SME Model ................................................................................4
E. Opening the VECTOR SME Model..................................................................................5
F. Uninstalling the VECTOR SME Model ............................................................................5
•
VECTOR SME Definitions ...............................................................................................5
A. Transaction Properties Input Terms...................................................................................5
B. Simulation Input Terms......................................................................................................5
C. Portfolio Input Terms .........................................................................................................5
D. VECTOR SME Output Terms ...........................................................................................5
•
Deal Setup..........................................................................................................................5
A. Initial Setup....................................................................................................................5
B. Asset Amortization Schedule.........................................................................................5
C. Simulation Run...................................................................................................................5
•
Analytical Results & Summary Reports ............................................................................5
A. Simulation Summary .....................................................................................................5
B. Portfolio Default Distribution ........................................................................................5
C. Portfolio Loss Distribution ............................................................................................5
D. Portfolio Composition....................................................................................................5
•
VECTOR SME Assumptions ............................................................................................5
A. Recovery Rates ..................................................................................................................5
B. Correlation Adjustments ....................................................................................................5
C. Risk Horizon and Confidence Levels.................................................................................5
•
Appendix I: VECTOR SME Methodology........................................................................5
•
•
www.derivativefitch.com
•
Overview
The Derivative Fitch Default VECTOR SME model (VECTOR SME) is Derivative Fitch’s
main quantitative tool to evaluate credit risk in portfolios of assets referenced by Small and
Medium Enterprises (SME). The determination of default is formally based on a structural
form methodology, which holds that an asset defaults if the value of the asset falls below its
default threshold. The outputs of this model may then serve as inputs into cash flow models.
The main outputs of VECTOR SME are the Rating Default Rates (RDR), Rating Recovery
Rates (RRR), the Rating Loss Rates (RLR) and default timing information corresponding to
each rating level. The model outputs also include various portfolio statistics as well as the
portfolio’s default and loss distribution.
The model engine is a C++ compiled program embedded into a Microsoft Excel spreadsheet
which serves as the user interface and contains both inputs and outputs. The model can be
downloaded from Derivative Fitch’s website at www.derivativefitch.com. For a detailed
discussion of VECTOR SME and how it is used in Fitch’s overall analysis see “European
SME CDO Rating Criteria”, dated March, 2007, also available at www.derivativefitch.com.
This manual will begin with instructions for installing VECTOR SME followed by the
definition of the various terms used and instruction on how to populate the input sheets. The
outputs of the model are then described followed by a discussion of the various assumptions
made while evaluating the model. Finally, details about the underlying methodology are
covered in the appendix.
www.derivativefitch.com
•
Installation Instructions
A. System Requirements
PC
512+ MB Memory
1.2+ GHz Processor Speed
Operating System
Windows NT, 2000, or XP
Software
WinZip
Excel 2003 (Older versions of Excel have not been tested)
B. Installation Checklist
Before installing the VECTOR SME Model you must:
Close all open programs.
Meet the minimum requirements to access and install the model.
Have administrator rights to install the VECTOR SME Model.
C. Downloading the VECTOR SME Model
Before you can download and install the VECTOR SME Model you must have access to the
Internet. The model can be downloaded from the website www.derivativefitch.com.
D. Installing the VECTOR SME Model
Once you have downloaded the VECTOR SME Model file you must install the application.
To install the VECTOR SME Model:
1. Double click on the downloaded file.
2. The installation script will install the model files in the directory “C:\Fitch\VECTOR
SME” by default. The user will be prompted before this directory is created the user
will be able to change the installation directory.
www.derivativefitch.com
E. Opening the VECTOR SME Model
1. Go to the Windows “Start” menu and select “Programs”
2. VECTOR SME should appear as one of the choices. Select the “VECTOR SME”
option.
F. Uninstalling the VECTOR SME Model
1. Go to the Windows “Start” menu and select “Programs”
2. VECTOR SME should appear as one of the choices. Select the “VECTOR SME”
option.
3. Select the “Uninstall” option. This will uninstall the software.
www.derivativefitch.com
•
VECTOR SME Definitions
This section provides brief definitions of many key terms used and seen in the VECTOR
SME model.
A. Transaction Properties Input Terms
Transaction Name (optional) – The name of the transaction.
Evaluation Date (optional) – The evaluation date of the deal.
B. Simulation Input Terms
Correlation Structure (mandatory) – This input defines the correlation structure that is used
to induce correlations between default events. There are two options and the user can choose
between “Fitch Correlation Structure” and “User defined Correlation Structure”. The Fitch
Correlation Structure consists of a large number of factors categorized into country factors,
region factors and industry sector factors. Each asset is associated with a unique country,
region and sector and pair wise correlations between assets are a consequence of their
common affiliation to a country and/or region and/or industry sector. The User Defined
Correlation scheme allows users the freedom to define their own regions and sectors.
Risk Horizon (mandatory) – The risk horizon determines the confidence levels applied to the
default and loss distributions to infer the Rating Default Rate (RDR) and Rating Loss Rate
(RLR) values (Please refer to subsection D for a definition of these terms). The model
internally computes the Weighted Average Life (WAL) of the portfolio and uses it as the risk
horizon. However the user is allowed to extend this by choosing a larger value for the risk
horizon. This can be achieved by selecting the “User Defined Horizon” item on the pull down
menu. A new input cell is activated on the main sheet on the Transaction properties input
table where the risk horizon can be specified.
Number of Trials (mandatory) – The number of scenarios to explore. Typically we would
recommend a minimum of 150,000 trials or scenarios. Since a Monte Carlo simulation
consists of modelling random scenarios, the outputs are also random and converge to a
constant value only for a large number of simulations. It is advisable to run the model for
several values of this input until both the RDR and RLR numbers converge.
C. Portfolio Input Terms
Asset ID (mandatory) – A unique integer identifier for each asset.
www.derivativefitch.com
Obligor ID (mandatory) – This is a non unique alphanumeric string that identifies each
obligor. Multiple assets can be mapped to a single obligor and all the assets default if the
obligor defaults (provided the PD/Rating and the remaining term are the same). The model
expects that all the assets corresponding to an obligor will have the same country, region and
sector affiliation. If this is not so then the model will issue a warning and assign a single
region and sector affiliation drawn from the affiliation of any one of the assets for that
obligor.
Outstanding Balance (mandatory) – The total initial outstanding amount corresponding to
each asset.
[Please note that at least one of the next two inputs has to be provided.]
Fitch Rating (optional) – This is the Fitch rating of the asset as of the valuation date. The
rating is mapped to a probability of default based on the Fitch default assumptions. The
mapped rating is mandatory when the probability default (see below) of the asset is not
specified.
Probability of Default (PD) (optional) – The default probability of the asset. The time
horizon for the PD is assumed to the “remaining term” of the asset. Either the mapped rating
or the PD of each asset is a required input of the model. However if the mapped rating is
specified for the asset this input is ignored.
PD Multiplier (optional) – May be used to adjust a default probability assumed by Fitch. For
example, to increase the default probability for a specific asset by a net 20%, the user should
input 120%. If this field is left blank the default value will be 100%. Note that any adjustment
will alter the default term structure of this asset; adjustments are typically done on a case-bycase basis and should only be made in consultation with a Fitch analyst to ensure the model
accurately reflects agency assumptions or used as a stress.
Amortization Flag (mandatory) – The user can select to model individual assets as having
bullet maturity dates (select ‘no’) or as amortizing assets using the amortization schedule
(select ‘yes’). If marked “yes” then the amortization schedule must be populated with valid
data.
Remaining Term (mandatory) – It is time remaining until the asset matures. It is specified in
months and must lie between 1 and 120. [When amortization information is not available it
might be more appropriate to put the WAL of the asset rather than the remaining term.
Please see page 13 for more details.]
Region (mandatory) – It is the geographical region in which the specific obligor of the
portfolio was originated. In the Fitch correlation structure the regions are mapped to
countries. As part of the correlation structure Fitch currently specifies 9 European countries.
It is also possible for the user to specify a different set of regions. Regions are also considered
to be risk buckets in the same way as sectors.
www.derivativefitch.com
Sector (mandatory) – This represents the business sector of an underlying obligor. For
diversified companies the applicable industry class should be derived from the Industry
accounting for the majority of the company’s revenues. The industry, together with the
country and region classification, determines the correlation of an asset with all other assets
in a portfolio applied by the model. The user can select one of the 25 corporate Industry
sectors which are currently specified by Fitch. Alternatively, users can also define their own
set of sectors and map the assets to these. This can be accomplished by pressing the “Edit
Correlation Assumptions” button on the worksheet “FitchCorrelationAssumptions”. This
would allow users to add their own countries, regions and industries and assign correlation
premiums. The user must press the “Update Correlation Structure” button after editing this
page.
[The recovery rate assumptions for each asset can be specified in several ways. The model
will determine the recovery rates using the following columns in order. If the inputs are
insufficient to determine the recovery rate assumptions the model will display an error
message. ]
Fixed Recovery Rate (optional) - The Fixed RR column associates the asset with a fixed
recovery rate irrespective of rating scenario.
[The next input consists of six columns where the recovery rate is specified for various rating
scenarios.]
Recovery Rate (optional) –These 6 columns allow the user to specify the recovery rates for
several rating scenarios, namely AAA, AA, A, BBB, BB and B. For intermediate rating
scenarios the recovery rates are obtained via interpolation. These columns are not used if the
“Fixed Recovery Rate” is specified.
Security Type (optional) - The Security Type determines the recovery rates via the table in
the worksheet “Recovery Rate Assumptions”. Again this input is not used if either the “Fixed
Recovery Rate” or the “Recovery Rate” inputs are available.
Seniority (optional) - If the recovery rate inputs defined above have not been specified then
the model will attempt to infer the recovery rates using the country and seniority of the asset.
These assumptions are not made available to the user.
Recovery Rate Multiplier (optional) - This is a multiplicative factor with which the
recovery rates are scaled. If left blank a value of 100% is assumed.
[The next input consists of forty columns where the outstanding balance is specified for each
quarter for ten years.]
Outstanding Balance Quarter (optional) – The outstanding balance at any given point in
time. The amortization schedule goes out to 10 years on a quarterly basis. Negative
amortization is not allowed and the outstanding notional for the first quarter must match
exactly with the value in the column “outstanding balance”.
www.derivativefitch.com
D. VECTOR SME Output Terms
The main outputs of the model are the Rating Default Rate (RDR), the Rating Recovery Rate
(RRR), the Rating Loss Rate (RLR) and the default timing. The “SimulationSummary”
worksheet shows the RDR, RRR and RLR for each rating scenario. The “DefaultTiming”
worksheet shows the default timing information.
Rating Default Rate (RDR) – The RDR for each rating level is defined as the value of the
defaulted amount (relative to the total outstanding balance) for which the cumulative default
distribution equals the confidence level corresponding to that rating level. In other words we
assert that the defaulted amount in the portfolio will not exceed the RDR level with a
confidence level appropriate to the rating. It is the required default hurdle input into Fitch’s
cash flow modelling and break even analysis.
Rating Loss Rate (RLR) – The RLR for each rating level is defined as the value of the loss
amount (relative to the total outstanding balance) for which the cumulative loss distribution
equals the confidence level corresponding to that rating level. In other words we assert that
the loss amount in the portfolio will not exceed the RLR level with a confidence level
appropriate to the rating. The RLR values take into account the recovery rate assumptions for
the individual assets.
Rating Recovery Rate (RRR) – The RRR is defined in terms of RDR and RLR (defined
above) and is given as RRR = 1.0 - (RLR/RDR).
Table 1 : Vector SME output table.
Rating Default
Rate
(RDR)
Rating Recovery
Rate
(RRR)
Rating Loss
Rate
(RLR)
AAA
12.08%
34.89%
7.86%
AA+
11.85%
37.08%
7.46%
AA
11.14%
37.03%
7.02%
AA-
10.52%
36.98%
6.63%
A+
9.97%
39.12%
6.07%
A
9.22%
38.95%
5.63%
A-
8.08%
38.67%
4.96%
BBB+
7.34%
40.76%
4.35%
BBB
6.81%
40.53%
4.05%
BBB-
6.37%
40.41%
3.80%
BB+
6.01%
41.31%
3.53%
BB
5.70%
41.21%
3.35%
BB-
5.43%
41.14%
3.19%
B+
5.17%
42.06%
3.00%
B
4.94%
41.95%
2.87%
B-
4.73%
41.80%
2.75%
Rating
www.derivativefitch.com
Default Timing – This output contains information about the timing of defaults in each
rating scenario. Consider for instance those scenarios that led to a default amount which
breached the AA attachment point but did not breach the AA+ attachment point. For these
scenarios we compute the average fraction of the default amount that was recorded for each
year and record these in the row corresponding to the AA level. For example for AAA
scenarios an average of 15.718% of the defaulted amount was observed in year 3. The last
row in the table averages over all the rating scenarios and represents the overall default
timing information
Table 2 : Default timing table
Rating
AAA
AA+
AA
AAA+
A
ABBB+
BBB
BBBBB+
BB
BBB+
B
BAggregate
Year 1
Year 2
Year 3
Year 4
Year 5
Year 6
Year 7
Year 8
Year 9
Year 10
41.032%
38.320%
38.188%
37.884%
37.521%
36.080%
34.596%
33.513%
32.629%
31.921%
31.242%
30.602%
30.311%
29.988%
29.461%
28.807%
33.881%
20.077%
21.019%
20.482%
20.725%
20.520%
20.882%
20.988%
21.022%
20.843%
20.746%
20.944%
21.268%
21.098%
20.840%
20.803%
20.992%
20.828%
15.718%
16.324%
16.320%
16.501%
16.301%
16.801%
17.206%
17.468%
17.534%
17.766%
17.848%
17.826%
17.725%
17.929%
18.074%
18.110%
17.216%
10.773%
11.622%
12.028%
11.502%
12.055%
12.358%
12.601%
12.858%
13.196%
13.327%
13.511%
13.487%
13.747%
13.839%
13.794%
13.856%
12.785%
3.344%
2.876%
3.433%
3.521%
3.612%
3.671%
3.902%
3.998%
4.119%
4.297%
4.361%
4.397%
4.458%
4.536%
4.577%
4.699%
3.988%
3.280%
3.374%
3.221%
3.293%
3.393%
3.424%
3.612%
3.665%
3.853%
3.991%
3.918%
4.085%
4.131%
4.228%
4.388%
4.428%
3.768%
2.616%
2.893%
2.776%
3.002%
3.022%
3.126%
3.173%
3.395%
3.472%
3.585%
3.652%
3.622%
3.749%
3.811%
3.933%
4.076%
3.369%
2.422%
2.853%
2.734%
2.731%
2.783%
2.814%
3.035%
3.144%
3.382%
3.381%
3.532%
3.624%
3.708%
3.725%
3.829%
3.889%
3.224%
0.737%
0.719%
0.818%
0.841%
0.793%
0.845%
0.887%
0.936%
0.973%
0.986%
0.993%
1.089%
1.073%
1.105%
1.141%
1.143%
0.942%
0.000%
0.000%
0.000%
0.000%
0.000%
0.000%
0.000%
0.000%
0.000%
0.000%
0.000%
0.000%
0.000%
0.000%
0.000%
0.000%
0.000%
Portfolio Correlation Level (PCL) – The PCL is defined as the root mean square value of
the pair wise asset correlations and is a measure of the average asset correlation between
assets in the portfolio.
N
N
2
∑∑ ρ i , j
PCL =
i =1 j =1
N × ( N − 1)
,i ≠ j
www.derivativefitch.com
•
Deal Setup
A. Initial Setup
The VECTOR SME Model is embedded in a Microsoft Excel spreadsheet, which provides
the user interface and contains the model inputs and outputs. In order to set up a new deal the
“Main” worksheet has to be configured. The Main worksheet is reproduced below in
Figure 1. The primary inputs which have to be decided upon before any analysis are:
1. Correlation Structure (“Fitch Defined Correlation” or “User Defined Correlations”).
2. The Risk Horizon (“Fitch Default Horizon” or “User Defined Horizon”).
3. The number of Simulations (trials) (minimum150000 recommended).
Figure 1: The main input sheet
There are two choices for Correlation Structure:
www.derivativefitch.com
a. Fitch Defined Correlation: This will create a portfolio-specific asset correlation
matrix based on Fitch’s correlation assumptions. The correlation between each pair of
assets is based on their Country, Region and Sector affiliations. The Country
correlation is internally increased for stressed scenarios. For assets that are either in
the same region or in the same sector or both, the respective sector and region
premium will be added to the country correlation. The user cannot modify the Fitch
correlation assumptions. However, the user can add (and later modify) new countries,
regions or industry sectors to the existing lists. The user can edit the correlation
structure by pressing the button “Edit Correlation Assumptions”. Once changes are
incorporated, they can be updated by pressing the button “Update Correlation
Assumptions”.
Figure 2: Fitch correlation structure used by VECTOR SME.
b. User Defined Correlation: This option allows the user to assign individual
correlation assumptions to sectors and regions of assets in the portfolio. By selecting
this option the user can allocate each asset on the Main worksheet to one of the 12
user-defined regions and one of the 12 user-defined sectors. The global correlation
www.derivativefitch.com
applies universally for all assets. The names of the regions and sectors can also be
changed for convenience.
Table 3 : User Defined Correlations table
Global Correlation
2%
Region
Correlation
Sector
Correlation
R1
5%
S1
5%
R2
R3
R4
R5
R6
R7
R8
R9
R10
R11
5%
5%
5%
5%
5%
5%
5%
5%
5%
5%
S2
S3
S4
S5
S6
S7
S8
S9
S10
S11
5%
5%
5%
5%
5%
5%
5%
5%
5%
5%
R12
5%
S12
5%
B. Asset Amortization Schedule
VECTOR SME models the default timing using the default term structure of the asset.
Amortizing assets are treated appropriately by allocating the loss in the asset which is
consistent with the time of default. The amortization information is input on a quarterly basis
going out to 10 years. Amortization information should always be provided if available.
Occasionally the amortization schedule is not available for some or all of the assets, in which
case the user might decide to replace the amortizing asset with a bullet asset with the initial
outstanding balance as principal and a remaining term equal to the weighted average life of
the asset. In the absence of amortization information this is a reasonable approximation.
For bullet assets and assets where the user lacks amortization information the “Amortization
Flag” in the portfolio input sheet should be set to “no”. Alternatively the user can select ‘yes’
and input an amortization schedule, showing the asset’s notional at the beginning of each
quarter for years one to maximum 10 (see example) on a quarterly basis. If the asset defaults,
the model will record the outstanding notional amount of the asset in the relevant quarter.
Table 4 : Sample Amortization Schedule
Outstanding
Balance Quarter
1
Outstanding
Balance Quarter
2
Outstanding
Balance Quarter
3
Outstanding
Balance Quarter
4
Outstanding
Balance Quarter
5
Outstanding
Balance Quarter
6
1000
900
800
700
600
500
For example in the table above we specify the amortization schedule for the first 6 quarters.
An amount of 600 will be recorded as the default amount if the asset defaults in the 6th
quarter.
www.derivativefitch.com
C. Simulation Run
On the Main page the user is allowed to specify the number of scenarios used in the MonteCarlo simulation. The accuracy of the outputs increases with increasing number of trials or
simulations. The minimum number of trials depends on, among other things, portfolio size,
rating distribution within the portfolio, and the desired percentile on the output side (the
higher the percentile, the higher the minimum number of simulations required). Fitch
recommends running a minimum 150,000 trials for a reasonably accurate approximation of
the RDR/RLR.
After having specified the number of trials, select the Run Simulation button. The simulation
includes a visual timer that will display the progress of the simulation. During the simulation
it will not be possible to amend inputs in any Excel application running.
The time to complete the simulation will depend on, among others, the number of trials, the
number of assets in the portfolio and computer hardware. As a guide, for a portfolio of 1,000
assets and 150,000 simulation runs, the simulation takes about 20 seconds on an 3.4 GHz
Intel Pentium 4 workstation with 1GB RAM. The computational time scales linearly with the
number of assets and number of simulations. For example for 15000 assets and 300000
simulations the model should take about 600 seconds to run on the same architecture.
Simulation speed can be improved by:
a. Shutting down all other applications.
b. Running the model on a stand alone work station.
Once the simulation is complete, the application will automatically populate the output sheets
and take the user to “SimulationSummary” page.
www.derivativefitch.com
•
Analytical Results & Summary Reports
A. Simulation Summary
The “SimulationSummary” page displays the summary properties of the portfolio in a table
called the “Portfolio Properties”. The main output of the model which are the rating default
rate (RDR), the rating recovery rate (RRR) and the rating loss rate (RLR) are listed in a
separate table (reproduced below). The table shows the RDR, RLR and RRR for each rating
scenario.
Table 5 : Output table showing the RDR, RRR and RLR levels
Rating
Rating Default
Rate
(RDR)
Rating Recovery
Rate
(RRR)
Rating Loss
Rate
(RLR)
AAA
12.08%
34.89%
7.86%
AA+
11.85%
37.08%
7.46%
AA
11.14%
37.03%
7.02%
AA-
10.52%
36.98%
6.63%
A+
9.97%
39.12%
6.07%
A
9.22%
38.95%
5.63%
A-
8.08%
38.67%
4.96%
BBB+
7.34%
40.76%
4.35%
BBB
6.81%
40.53%
4.05%
BBB-
6.37%
40.41%
3.80%
BB+
6.01%
41.31%
3.53%
BB
5.70%
41.21%
3.35%
BB-
5.43%
41.14%
3.19%
B+
5.17%
42.06%
3.00%
B
4.94%
41.95%
2.87%
B-
4.73%
41.80%
2.75%
B. Portfolio Default Distribution
The portfolio default distribution is displayed in the “SimulationSummaryGraphs” page. The
graph illustrates the distribution of default amounts obtained for the various scenarios. Figure
4 gives an example of such a graph.
www.derivativefitch.com
Default Distribution (RDR)
0.07
Relative Frequency
0.06
0.05
0.04
0.03
0.02
0.01
0
0%
1%
2%
3%
4%
5%
6%
7%
8%
10%
11%
12%
Default Amount (% of total)
Figure 3: Default distribution graph produced by VECTOR SME.
C. Portfolio Loss Distribution
The portfolio loss distribution is displayed in the “SimulationSummaryGraphs” worksheet
and shows the distribution of losses observed in the course of simulations.
Loss distribution (RLR)
0.1
Relative Frequency
0.09
0.08
0.07
0.06
0.05
0.04
0.03
0.02
0.01
0
0%
1%
2%
4%
5%
6%
7%
8%
9%
Loss Amount (% of total)
Figure 4 : Loss distribution graph produced by VECTOR SME.
11%
www.derivativefitch.com
D. Portfolio Composition
The Portfolio Composition graphs show the portfolio composition by remaining term and
sector. A sample graph showing the sector segmentation is displayed below.
Industry Sector Distribution
60.00%
% Notional
50.00%
40.00%
30.00%
20.00%
10.00%
0.00%
Food, Beverage & Tobacco
Industrial/Manufacturing
Supermarkets & Drugstores
Figure 5: Portfolio distribution by industry sector graph produced by VECTOR SME.
www.derivativefitch.com
•
VECTOR SME Assumptions
A. Recovery Rates
The recovery rate assumptions for each asset can be specified on the “Portfolio” sheet. The
values can either be specified numerically or the recovery rate assumptions can be inferred
from the security type input. The worksheet “RecoveryRateAssumptions” contains a table of
various security types which are mapped to recovery rates for every rating scenario. This
table can be edited by the user. The user can define up to 40 different security types. In the
absence of either the numerical recovery rate inputs or the security type the model internally
infers the recovery rate based upon the country and seniority of the asset.
Table 6 : Recovery Rate table (partial view).
Security Type
Type 1
Type 2
Type 3
AAA
AA+
20.00%
4.00%
28.00%
21.25%
4.25%
29.75%
AA
21.25%
4.25%
29.75%
AA21.25%
4.25%
29.75%
A+
22.50%
4.50%
31.50%
A
22.50%
4.50%
31.50%
A22.50%
4.50%
31.50%
B. Correlation Assumptions
As part of Fitch’s criteria, assumptions are made for the correlations based on Region,
Country and Industry. The actual correlation table is displayed in Figure 2 above.
C. Risk Horizon and Confidence Levels
The risk horizon for each asset is assumed to be the weighted average life (WAL) of the
asset. For bullet assets the WAL of the assets is the same as the remaining term. The risk
horizon for the portfolio is the outstanding balance weighted WALs of the assets. The
confidence levels applied to the loss distribution to obtain the RLR reflects the risk horizon as
calculated above. It is possible for the user to manually override this calculation using the
“Risk Horizon” input on the main page. However the model will only allow the user to
extend the risk horizon and will not allow the user to select a risk horizon less than the
portfolio WAL.
www.derivativefitch.com
•
Appendix I: VECTOR SME Methodology
The general framework of VECTOR SME is common to nearly all credit risk portfolio
models – a multi risk factor, Monte Carlo model which generates the distribution of the
portfolio losses by simulating various scenarios for a set of systematic risk factors. VECTOR
SME categorizes the systematic risk factors into country risk factors, region risk factors and
industry sector risk factors. Each of these factors is represented by a latent random Gaussian
variable and is assumed to be independent of the other factors. A random draw for each of
these factors creates a scenario or “state of the world”. The idiosyncratic risk factor for each
asset is also represented by Gaussian random variables, which are independent of the
systematic risk factors.
In each scenario, and for every asset in the portfolio, we define a latent variable to represent
the credit quality of the asset. The value of this latent variable is a linear combination of
systematic risk factors and its own idiosyncratic risk factor. To determine whether an asset
defaults we compare this latent variable against a threshold which is determined exclusively
by the asset’s probability of default. Further by comparing the latent variable’s value with
thresholds derived from the term structure of default we can also infer the time of default.
If the asset defaults, the outstanding amount of the asset at the time of default is recorded.
The cumulative default of the scenario is then the sum of the amounts outstanding of the
defaulted assets. In addition, for each defaulted asset the model records the recovered amount
from which the average recovery rate and ultimately the cumulative loss amount are
calculated.
We run a large number of simulations and record the defaulted amount and loss amount (by
rating scenario) for each simulation. For each simulation these are random variables and by
applying suitable confidence levels we obtain the desired RDR and RLR levels for each
rating level.
Recent work has shown that the correlation structure described under a Gaussian copula
model lacks a way to enhance the correlation in stressed scenarios as is observed in the real
world. VECTOR SME remedies this by introducing a stress correlation with scenario
dependent correlation. Thus it is possible in the model to emphasize the correlation for
stressed scenarios.
A more detailed discussion of the VECTOR SME methodology is given in “European SME
CDO Rating Criteria”, dated March, 2007, available on www.derivativefitch.com.