1
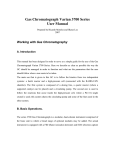
Bullseye Precision Vacuum Gauge
Prototype Version K13J12
17 October 2013
The DigiVac Company
105B Church Street
Matawan, NJ 07747
Ph: 732.765.0900
Fax:732.765.1800
www.DigiVac.com
1
Table of Contents
Overview
Quick Start for Lesker’s Field Analysis Vacuum Meter
Modes of Display
Display numeric
Display Bar
Display Pump-down
Display time auto
Menu of Configuration Options
Display
Numeric format
Precision
Standard
Scientific
Setpoint value
Setpoint action
Pumpdown time
AutoOff time
Sound
Self Test
Units
Units pumpdown rate
Calibration
Version
Auto Off Operation
Set Point Operation
Vacuum System Analysis
Data set size
Differential Analysis
Reset
Self Test Operation
Field Calibration
Calibration parameters
Calibration functions
Functions F/ATM and F/VAC
Functions F/LOAD and F/STORE
Calibrating the instrument
UNDERSTANDING TORR
2
SERVICING AND MAINTENANCE
GAUGE TUBE SERVICING
Maintenance
FACTORY REPAIR AND CALIBRATION
NOTES ON CALIBRATION
Instrument Accuracy
SPECIFICATIONS
3
Overview
The Bullseye precision Vacuum gauge was built to be a rugged, portable vacuum measurement
instrument designed specifically for the demands of field use. First and foremost, it is a highly
accurate vacuum gauge using field proven thermocouple vacuum sensor technology. The
Bullseye precision gauge offers several viewing options including numeric, bar graph and
pumpdown display.
Portable
● Rugged design that offers a super-strong magnet for hands-free vacuum measurement
● Field proven thermocouple vacuum sensing technology
Precise
● Bullseye accuracy available in 11 different measurement units
● Field calibratable
Reliable
● 70 hour battery life
● Protective rubber boot
● Simple easy to use design
Features:
● Auto Off
● On/Off soft switch
● Battery level indication
● Good/Bad tube indication
● 70 hour battery life
● Self test mode
● Field calibratable
● 3 different graphical displays of vacuum pressure
● Vacuum analytics for leak, outgassing and pump down
4
Quick Start for DigiVac’s Bullseye Precision Vacuum Gauge
While this vacuum instrument has many features, it is very simple to use. Before anything else,
it is an easy to use vacuum measuring device.
First unpack the gauge to verify you’ve received everything you ordered. Next:
1. Remove protective boot.
2. Remove the battery cover and install 4 AA batteries
3. Plumb the thermocouple sensor into the system to be measured, taking care to keep the
stem down
4. Power on the device by pressing the “PWR” button. It will take about 5 seconds to turn
on.
5. If need be, turn on the backlight. The backlight does not affect gauge reading or accuracy
6. Read vacuum!
Feel free to explore the latest copy of this manual at www.digivac.com for all the features that
make this a truly useful tool.
5
6
Modes of Display
The handheld gauge has four display modes: one numeric, and three graphs. The numeric
display has three numeric formats: standard, precision, and scientific.
Display modes are selected from the Configuration option “Display”, and numeric formats are
selected from the Configuration option “Numeric”. The SEL button enters and traverses the
Configuration menu.
Display numeric
The following example shows the numeric display with the “precision” format.
The following image shows the numeric display with the “scientific” format.
The numeric display shows the currently configured units, in these examples the vacuum
pressure units are “microns” or “torr”. Below the units indicator are the battery, vacuum
pressure, and vacuum system analysis indicators.
In any display mode, the UP and DOWN buttons turn the backlight on and off (respectively), the
SEL button enters the configuration menu, and the ENT button turns the gauge on or off.
7
In the previous example the battery indicator is shown at full strength and the vacuum pressure
indicator is shown in its second of three (logarithmic / order of magnitude) levels. The following
example shows the numeric display when the vacuum sensor tube is disconnected or has
failed.
Display Bar
The bar graph visualizes the current sensor reading with a stepped bar.
Display Pump-down
The pump-down graph plots time horizontally and log pressure vertically. The horizontal time
scale is selected using the configuration option “Pumpdown time”. The vertical pressure scale
is logarithmic, indicating order of magnitude from one micron to atmosphere.
8
In the top left is the current vacuum pressure display figure. In the center of the first line is the
Vacuum System Analysis, “PUMP”, and to the right is one of either the pump down rate in units
per minute, or the data set window size in hours, minutes and seconds. The “STABLE” case
shows data set window size (for example “1m18s”).
Display time auto
The auto-scaling (or, auto-ranging) time graph is a microscope into the pump down data.
In this mode, the pump down graph is shown with a linear pressure scale that is fit to the
pressure range of the data set.
The height of the graph display is the pressure range of the data set in a linear scale (not log).
The top left figure is the maximum value in this range, and the bottom left figure is the minimum
value in this range.
The top right figure is the current or most recent value in the instrument.
Sometimes this visualization is not useful, showing noise. This noise comes from the from the
instrument’s process of measurement, as well as the vacuum system under measurement.
The auto scaling graph is a data visualization microscope, in this sense.
Oftentimes this visualization is interesting in showing a very small climbing or descending trend
that the Vacuum Analysis algorithm has not declared as a leak or pump.
9
Menu of Configuration Options
Display
Pressing the SEL button from the vacuum display screen will present the configuration menu.
The configuration menu is a linear series of menu screens that are stepped or skipped through
using the SEL button.
Above each button is a utility hint to indicate button functions. The SKIP hint is above the SEL
button to indicate that the SEL button is used to step or skip to the next menu screen with no
configuration change. The ENTER hint above the ENT button indicates that this button is used
to enter the display mode as shown in the menu screen.
Using the UP or DOWN buttons will change the option available on the menu screen. In the
example above, the configuration menu is ready to change the display to the Pumpdown Graph.
In this state pressing the ENTER button will change the display to the Pumpdown Graph, or
pressing the SKIP button will ignore the state of the menu screen and leave the display mode
unchanged.
Numeric format
The numeric configuration option defines the vacuum pressure number format throughout all
modes of display.
The UP and DOWN buttons select a format type from “precision”, “scientific” and “standard”,
and the ENT button saves the current choice.
10
Precision
The precision format has three digits precision and micron accuracy. For example, an internal
vacuum value of 1234 microns (µm Hg) would be displayed as 1.23 torr in the Precision numeric
format with torr units.
Standard
The standard format has two digits precision and micron accuracy. For example, an internal
vacuum value of 1234 microns (µm Hg) would be displayed as 1.2 torr in the Standard numeric
format with torr units.
Scientific
The scientific format has two digits precision with a base ten exponent following conventional
usage. For example, an internal vacuum value of 1234 microns (µm Hg) would be displayed as
1.2 x 100 torr.
Setpoint value
The Set Point Value is defined in terms of the current vacuum pressure units.
The Set Point indicates a pump down to configured pressure state according to the configuration
of the Set Point Action. See “Set Point Operation” for more detail.
Setpoint action
The Set Point Action is defined as one of a set of choices, including: None, Beep, Beep and
Flash, or Flash.
For details of operation, refer to the section “Set Point Operation”.
Pumpdown time
The pumpdown time configuration option defines the width of the Pumpdown Graph and
pumpdown rate window.
11
The pumpdown rate is the difference between the start and end of the pressure data shown in
the pumpdown graph. For example using a pumpdown time of ten minutes, a system
pumpdown from atmospheric pressure to one torr in ten minutes has a pump down rate of 760
torr per ten minutes or 76 torr per minute.
AutoOff time
Use this configuration option to save battery power during periods of inactivity. The figure zero
will disable the auto off battery saver feature. To see the specifics of this feature, look at the
Auto Off Operation section.
With a positive (non zero) value, the unit will indicate the Auto Off
Sound
The two sound configurations determine the audible Set Point Alarm and Calibration Storage
Acknowledgement tones, named “Sound SP” and “Sound Cal” respectively.
The Set Point Alarm sound is typically configured to a different value from the Calibration
Acknowledgement sound.
Self Test
The self test function reviews the Tube and Battery status, and resets the internal Elapsed Time
Clock, Pump Down Data, and Auto Off subsystems.
Enter the Self Test sequence with this option. Refer to the section “Self Test Operation” for
more detail.
12
Units
The units configuration option permits numeric vacuum values to be displayed in any one of a 11
available vacuum pressure units including microns, millitorr, millimeters of mercury, Torr, mbar,
Bar, Pa, kPa, inches of mercury, inches of water and PSIA. Note that inches of mercury and
inches of water is zero referenced to 760 Torr absolute pressure. A negative number indicates
vacuum, a positive number indicates pressure relative to sea level.
Units pumpdown rate
The units pumpdown configuration option permits the pumpdown rate figure displayed in the
Pumpdown Graph to employ identical or different units from the numeric vacuum units. Use this
option to change the pumpdown rate units. This option has been included to support work with
multiple sources of technical documentation for the vacuum system, and vacuum system pump
down.
The “Sync” option, shown in this example (above), maintains the pumpdown rate units as
identical to the primary vacuum units. Of course this is the recommended configuration, as
employing mixed units could be a source of misunderstanding.
Calibration
This configuration option may enter the field calibration mode.
Refer to the section “Field Calibration” for a complete description of the operation of the
Calibration function.
Version
The last step in the configuration menu reports the software version identifier.
13
This software version identifier is useful for communicating with the factory or distributor support.
Auto Off Operation
The auto off feature has been defined as an unattended mode of operation to not conflict with
other unattended modes of operation. The Handheld Gauge will not turn itself off when:
● connected to a system under vacuum (less than 100 Torr, pump down feature set);
● initially filling the pump down data set (pump down feature set);
● not timed-out since pump down or button activity;
● in calibration mode.
Set Point Operation
A Set Point may be defined to beep (configured sound) or flash (invert display) when a low
pressure vacuum has been achieved.
The Set Point Value is defined with the Configuration option “Set point V units” for V between one
micron and atmosphere.
The Set Point Action is defined with the Configuration option “Set point A” for A one of “None”,
“Beep”, “Flash”, “Beep&Flash”.
The Set Point Alarm is raised on successfully achieving the objective vacuum pressure (Set
Point Value).
The Set Point Alarm is lowered, but not cleared, on pressing any button while the alarm is raised
(display flashing or beep sounding).
The Set Point Alarm is cleared, and is ready to be raised again, when the pressure in the system
under test rises well above the Set Point Value.
Vacuum System Analysis
The result of the Vacuum System Analysis is one of “PUMP”, “LEAK”, “OUTGAS” or “STABLE”
and is shown in some display modes.
Internally, one data set serves the Pump down and Time Auto graphs as well as the Vacuum
System Analysis. The data is visualized in the Pump down and Time Auto graphs. The data set
is maintained continuously in every mode of operation.
Data set size
14
The width of the data set in time is configured with the option “Pumpdown time”. This figure is
employed to determine the time slices that are accumulated at a rate of roughly three updates
per second. A small difference will accrue to the actual data set span in hours, minutes, and
seconds. The Pump down graph with a “STABLE” case (under 100 torr) will display the actual
time window size in hours, minutes and seconds.
Differential Analysis
The Vacuum System Analysis looks at the last quarter of the pump down data set to determine
the state of the system under test. The whole analysis is recomputed approximately three times
per second.
The “LEAK” result indicates pressure increasing towards atmosphere with rates that are not
typically indicative of outgassing alone.
The “PUMP” result indicates a strong pressure descent to vacuum as for a system under
vacuum pump down.
The “OUTGAS” result indicates evidence of outgassing. Evidence of outgassing is a pressure
trend that is ascending at a rate that is decreasing. Eventually the rate of ascent decreases until
the pressure stabilizes.
The “STABLE” result indicates no particular evidence of venting (LEAK) or outgassing, and is
shown for slow pump down rates for the benefit of the experience of working with the instrument.
The “STABLE” case partially obscures some (weak) “PUMP” cases in order to stabilize the
instrument display.
Reset
The pump down data set is cleared in power-off states: turned off, or dead or missing batteries.
15
Self Test Operation
The Self Test feature is available from the Configuration option “Self Test”, pictured below.
From this Configuration option, press the ENT button to enter the Self Test sequence.
The Self Test sequence proceeds on any button press through a set of steps. The first step in
the Self Test sequence, shown below, performs tests of the Battery level and Tube connection.
Pressing any button will increment the Self Test sequence to the second step, shown below.
The second step reviews the detailed results of the tests performed in the preceding step.
Pressing any button will proceed to the third step.
The third step reports the overall condition as GOOD or NOT GOOD, based on the results
reviewed in the previous step.
Pressing any button will exit the Self Test and reset the Elapsed Time Clock and dependent
subsystems including the Pump Down Data Set -- as occurs on any power off state (turned off
or batteries dead or missing).
16
Field Calibration
From the Configuration option “Calibration”, pictured below, press the ENT button to enter the
field calibration mode.
The field calibration mode, shown below, shows digital signal counts and torr pressure times
10,000 (“Torr x 10+4”). For example, one micron (or millitorr) is “10” in the “Torr x 10+4” scale.
Calibration parameters
The calibration method employs a “zero and span” model. The “ATM” parameter is modified to
align to 300 torr, and the “VAC” parameter is modified to align to 5 millitorr. In the “Torr x 10+4”
scale employed in the Calibration mode, these pressures are represented with the figures
3000000 and 50, respectively.
Calibration functions
The Calibration mode operates using a function concept. The current function is one of four
available functions (operations) and is shown above the EXIT button hint as “F/LOAD” in this
example.
The four functions are F/LOAD, F/STORE, F/ATM, and F/VAC. The SEL button changes the
current function among these four possibilities.
Functions F/ATM and F/VAC
The F/ATM and F/VAC functions enable the UP and DOWN buttons to change these parameter
values. As these parameter values change, the internal pressure value register shown in the
Calibration display (at “Torr x 10+4”) is modified. These values are not saved for use beyond the
calibration session until they are stored using F/STORE.
Functions F/LOAD and F/STORE
The F/LOAD and F/STORE functions read and write parameters from and to persistent memory
(long term storage).
One of these two functions is available when the function indicator above the EXIT hint shows
F/LOAD or F/STORE. In this case, pressing and releasing the UP and DOWN buttons together
will execute the function.
When the function has been successfully executed the display will flash, and an audible beep will
sound (with the tone configured in “Sound Cal”).
Completing a calibration session requires execution of F/STORE in order to save the
parameters to persistent memory before exiting the calibration session. Exiting a calibration
17
session without successfully executing the F/STORE function will discard the calibration
parameters.
Calibrating the instrument
1) Set Cal points VAC, MID and ATM to zero
2) Get counts to 105600 +/-500 (105100 to 106100) and adjust "MID" so Bullseye Vac Reading reflects
standard. I found that the actual vacuum value at this counts is somewhere between 2 and 270 Torr. (Note
step 2 needs to be done on each gauge individually)
3) Set manifold vacuum to 760 Torr, and adjust "ATM" so Bullseye reading reflects Standard +/- 10 Torr
4) Set manifold vacuum to .005 Torr, and adjust "VAC" so Bullseye reading reflects standard +/- 0.001 Torr
5) Store
6) Check ATM is +/- 20 Torr
7) Check Vac is +/- 0.002 Torr
UNDERSTANDING TORR
The DIGIVAC and many similar instruments are calibrated in microns or "milliTorr." It is
appropriate to discuss what microns are and to relate microns to other measures of pressure
and vacuum. Microns are not really a measure of vacuum at all, but rather of absolute pressure.
It will be recalled that the pressure of the atmosphere is 14.696 or approximately 14.7 pounds
per square inch at sea level. This pressure is due to the weight of all of the air in the earth's
atmosphere above any particular square inch. This 14.696 psi is equivalent to the pressure
produced by a mercury column of approximately 29.92 inches high or .76 meters (about 3/4 of a
yard) or 760 millimeters of mercury. Atmospheric pressure varies greatly with altitude. It
decreases approximately 1 inch of mercury per thousand feet of altitude. It also varies widely
with local weather conditions. (Variations of one half inch in a single day are common.) The word
vacuum means pressure lower than atmospheric or "suction," but, in describing negative
pressure, the atmosphere is only a satisfactory reference if we are dealing with values of
vacuum down to about 27 inches of mercury. Below that, it is much more useful to talk in terms
of absolute pressure, starting from absolute zero. The 801 and all similar instruments do just
this.
One TORR, a commonly used unit, is an absolute pressure of one millimeter of mercury. A
milliTorr is equal to one thousandth of a TORR. A MICRON is the same as a milliTorr.
18
SERVICING AND MAINTENANCE
GAUGE TUBE SERVICING
In many cases, a gauge tube may become fouled with oil or other foreign matter. It is often
possible to restore the functionality of contaminated probes with cleaning. If the contaminant is
known, the tube should be filled with a fluid that is known to be a solvent to that contaminant. As
an example, ether is often effective in removing residues of some oils. Commercial carburetor
cleaners are very powerful solvents and are highly effective against some contaminants.
After cleaning with solvents, the gauge tube should be completely dried or flushed with a volatile
solvent to assure that it is dry prior to re-installing it. If this is not done, contamination of the
system may result.
Maintenance
Your vacuum instrument should give you many years of trouble free service. There are no
regularly scheduled maintenance intervals. If consistent accuracy is required, it is
recommended that the gauge, tube, cable and power supply be returned for a yearly calibration
check.
FACTORY REPAIR AND CALIBRATION
The vacuum gauge assembly is designed to provide years of trouble-free service, and the liberal
internal use of plug-in components make it easily repairable. No field servicing of the unit is
recommended, other than replacement of the gauge tube, but factory servicing and calibration
are available at a nominal cost and fast turn-around times.
NOTES ON CALIBRATION
The instrument is calibrated in nitrogen, which has thermal properties virtually identical to air.
Other gasses will affect the readings by an amount proportional to the thermal conductivity of the
gases. In most cases, the gases present in a vacuum system will be air, nitrogen, or oxygen,
and no appreciable errors will occur.
Certain other gases, however, have thermal conductivity significantly greater than air and will
cause the instrument to read higher than the actual amount of pressure. Examples of such
gasses are water vapor, fluorocarbon refrigerants, and acetone. Conversely, other gasses have
thermal conductivity significantly lower than air and will cause the instrument to read lower than
actual pressure. Examples of such gasses include helium, oxygen and to a lesser extent, CO2.
When interpreting readings using gasses other than air, it should be borne in mind that the
DIGIVAC reads Torr, which is a measure of absolute pressure - that is the opposite of vacuum.
Thus, a lower numerical reading actually is a higher level of vacuum. For more information, refer
19
to section 8.0.
Instrument Accuracy
.001 to .010 Torr
+/- .002 Torr
.010 to 5.00 Torr
+/- 15% of reading
200 to 760 Torr
+/- 25% of reading
SPECIFICATIONS
Input Voltage
4 AA Alkaline
Maintenance Interval
1-10 years depending on use
Overall Dimensions, front panel
6.0 in high, 3.5 in wide, 1.25 inches deep
Ambient Operating range
0°C to 70°C
Battery Life
60 Hours running
Measurement Media
Clean Dry Air or Nitrogen
Certifications, controller display
CE Planned
Shipping Bill of Materials
The vacuum instrument contains the following components:
1. Vacuum Instrument with amber backlight and blue rubber boot attached to 7’ of coiled
cable with Octal
2. Thermocouple Plus vacuum sensor, part number SEN-VGT500
3. ⅛ FNPT, male to ¼ Flare adapter (for refrigeration applications)
4. Quick Start guide or (this) User Manual
20