1
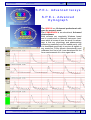
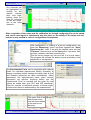
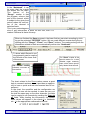
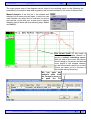
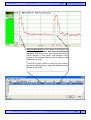
Brochure
EXPERIMETRIA LTD.
S.P.E.L. Advanced
Software Family
Isosys
Kymograph
www.experimetria.com
BROCHURE
SOFTWARE
EXPERIMETRIA LTD.
S . P. E . L . A d v a n c e d I s o s y s
S . P. E . L . A d v a n c e d
Kymograph
The ISOSYS is a 16-channel professional software for research work.
The KYMOGRAPH is an educational; 8-channel
chart software.
Both software are completely Windows based
and is constructed on National Instrument hardware which is known all over the world. Its advantage is that any physiology and pharmacology
measuring parameters can be loaded easily, and
it is developed specifically to receive all signals in
any maximum 2 KHz domain dimensionally and
calibrated, but first of all it was developed for the
force measurement of in-vitro organ tissue.
www.experimetria.com
[email protected]
2
BROCHURE
SOFTWARE
EXPERIMETRIA LTD.
The operation of
the configuration
can be carried out
rather quickly; almost from the
same menu indicated above.
In the Setup Chart we can determine both the operations to be carried out on-line and automatically
by the software and its trend to be drawn into the
chart field. With the symbols on the left side of the
chart, we can continuously adjust both the values of
the Full Scale field (Lupe) and the Position of the
visualised curves (arrow), and we can also indicate
the Amplitude values of the curves digitally.
It eases the calibration at setting up as the dimension of the indicated measuring parameter is written
into the calibration field automatically. Moreover, we
can choose from the one and the same menu which
quantifier we would like to use for example when
measuring force/displacement.
www.experimetria.com
[email protected]
3
BROCHURE
SOFTWARE
EXPERIMETRIA LTD.
The frequency of sample taking can be adjusted in the menu in five domains. Moreover, within the program, there is an option
to set the decimal of the numerical values
of the recorded and indicated curve points.
The visualised running speed of the curves
can be set in 15 stages in the Primary menu
between 100ms-5000sec. This wide setting
provides possibility to visualise and monitor
any curves of physiology measurement. (e.g.
force/displacement, blood pressure, ECG,
EEG, tailfak, rotarod, non-invasive blood pressure etc…).
In the lower part of the Setup chart we
can cut the unwanted noise levels with a
6dB and a 12dB filter. During employment, it is strongly recommended to be
aware of the fact that the filter can have
an effect on the parameters of the curves
(i.e. amplitude, rise etc…). Filtering is
completed only on the marked channels.
In case we activate the F
(Freeze) button, which
takes place in the lower left
part of the chart fields, the
curves in the channels will
freeze. While freezing,
monitoring or recording
continues; and if the application is stopped in time,
monitoring will proceed
from that moment.
www.experimetria.com
[email protected]
4
BROCHURE
SOFTWARE
EXPERIMETRIA LTD.
Any channels can
be highlighted by
clicking on the
chosen
channel
field. And highlighting does not
have an influence
on the set operation of the other
channels.
After completion of the setup and the calibration the formed configuring file can be saved
and can be used again in experiments any time later on. Re-setting of the setup and calibration is only needed in case of configuration development.
After configuration, or loading of a pre-set configuration, we
enter the “Measuring” menu and there appears the “Save
Experiment As” chart. If we write the desired name into the
“Filename” field and click on the Save button, the result, that
we have created a valid data recording file.
This file can be reopen any time we call it in by this name.
The program will indicate the primer curves according to the
adjustment of configuration.
The Experimental Form can be completed with optional
fields. An individual experimental identity (filename) is
always mandatory before starting recording; date & time
and filename textboxes are filled automatically. Other
parameters, like experimenter's name, place, animal,
description are optional. Anything written into the
Experimental Form is recorded into the given file and
cannot be edited later (see GLP and ISO standards).
Each file consists of individual records, of which length,
number and interval is determined by the experimenter.
The upper field of the
main screen monitors the times related
to the events continuously.
www.experimetria.com
[email protected]
5
BROCHURE
SOFTWARE
EXPERIMETRIA LTD.
In the “Notebook” it can
be seen that the events
are written into the chart.
The feature of the
“Range” marker is that
the program colours that
part of the channel, which
is subject to the given time
period unless the unit button of the channel is
switched back.
This is very advantageous
since if any intervention is done on time unit, then it is
marked. Retrieval is faster this way.
When we finished the Save process in the lower field we can start recording by clicking on the activated “RECORD” button. We can mark different events during the recording with the “Range”, “Event”, and “Dose” buttons. The markers along with the
information related to them are automatically written into “Notebook”.
To know which Record is running presently can be read on
the left side of the lower field
of the screen.
The “Dose” marker is the
special marker for in-vitro
isolated organ measurement, which has a specifically related chart as well.
The “Event” marker
indicates a moment of
intervention.
The chart related to the Dose marker means a great
help to research workers since it provides an opportunity to have a quick and well documented lead of experiment
In the chart, the quantifier and the configuration we
are likely to use can be marked. In case we carry out
the task the same way on the other channels, the data
can be copied to all channels by marking the Copy to
all fields. While loading the information, the certain
dose values will appear in the charts (i.e. Notebook
etc...) in the appropriate mathematical format
www.experimetria.com
[email protected]
6
BROCHURE
SOFTWARE
EXPERIMETRIA LTD.
The most important part of the system is the Data Management and the Analysis of the
Recorded Primer Curves. Unlike other software systems used in this field, for Data Management we do not use only one central data acquisition to make the users classify the
data in Excel, but each analysing method receives an independent data acquisition chart
where the user can directly export data in CSV. format. At the Analysis we made every
effort that the user should not purchase innumerable folders to up-grade since the basic
modes of calculation is built in the system and it is included in the basic price too.
Both the data acquisition and evaluation can be set from either mode:
“Measuring” or “Monitoring”. If we set the data acquisition and
evaluation off from the “Measuring” mode, only the actual measuring
in process can be evaluated, but the previous measuring data collection cannot be called in. However, if we set the data acquisition and
evaluation off from the “Monitoring” mode, any closed and stored
measuring file can be called in. Setting the data acquisition and evaluation off is the same in both cases. The difference lies in the file root,
and we are going to demonstrate it in the next two examples.
Through the “Open
menu” point” of the
“Analysis”
menu,
any stored file can be
opened
and
the
primer curve can be
evaluated
in
the
modes listed.
When loading the file, the
primer curves sets off
automatically from the
first curve of the first Record. Scrolling of the
curves can be done with
the “scroll bar” according to the Primer Timebase, or upwards, adjusted with the steps of “Data-scroll” chart. Scrolling can be carried out with the
arrows of the bar, moving the scroll or the arrows of the keyboard. Furthermore,
with the “Jump to” function
of
the
data
acquisition
(Notebook).
www.experimetria.com
[email protected]
7
BROCHURE
SOFTWARE
EXPERIMETRIA LTD.
The menu points seen in the diagram can be found in the scrolling menu. In the following, the
possibilities of evaluation and data acquisition will be demonstrated in the order of these points.
Manual Analysis: If we click on it, the window that
belongs to the menu point will open, in which we can
mark whether we would like to evaluate our primer
and derived curves with one- or two-cursor method.
(Marking can be done with the following keys: Ctrl+1
and Ctrl+2).
One cursor mode: In this mode of
evaluation, each loaded channel receives a vertical evaluating cursor.
With the help of the cursor the values,
which belong to the primer and derived
curve points of the marked channel,
can be defined and copied into a chart.
(Points are taken up as a function of
the sample taking frequency).
We can open any
analysis table from
the Analysis menu or
to push the F12
www.experimetria.com
[email protected]
8
BROCHURE
SOFTWARE
EXPERIMETRIA LTD.
Two-cursor mode: In this mode of evaluation, all
loaded channel receives two vertical evaluating
cursors. With the help of the cursors the values,
which belong to the primer and derived curve
points of the marked channel, can be defined and
copied into a chart.
The time of point, which is cut by the two cursors,
the values belonging to it and their differences are
written in the chart.
www.experimetria.com
[email protected]
9
BROCHURE
SOFTWARE
EXPERIMETRIA LTD.
Automatic Analysis: If we click on it, the window that belongs to the menu point will open. We can mark in the window whether we want to evaluate our primer curves with
“Min-Max” or “Integration” method automatically.
AUTOMATIC Analysis (Min-Max mode): If we open this mode, two vertical and two horizontal
cursors will appear in the marked channel. (If Num lock was “on”, the two horizontal cursors
have to be active and this can be recognised by one dotted cursor while the other one remains
unbroken. If Num lock was “off”, the two vertical cursors will be active).
The curves or curve groups can be marked with the vertical cursors and their minimum – maximum values will be evaluated. The horizontal cursors are used for
marking that level on the primer curve(s) which above the minimum – maximum
values are determined.
www.experimetria.com
[email protected]
10
BROCHURE
SOFTWARE
EXPERIMETRIA LTD.
AUTOMATIC Analysis (integration mode): If we open this mode, two vertical cursors will appear in the marked channel. The vertical cursors are used for marking the curves or curve
groups and the
integral values
of these curves
or curve groups
will be counted.
The
program
offers four ways
of integration in
the opening window: Absolute,
Positive, Negative and Normal. We are going to
show each way of integration in
this order, moving from top to bottom.
We kindly call your attention that
integration, in all four cases, is
carried out with millisecond (ms)
time base.
Absolute integration: The
absolute area of the primer
curves is counted, so
the areas determined
at calibration below
(negative) and above
(positive) zero level
will be added.
Normal integration: The (negative) areas
below zero level of the primer curves determined at calibration are subtracted from
the areas above zero level (positive) of the
primer curves determined at calibration
( see figure.107 ). If we do not wish to use
the original baseline for integration, with
the help of the B button
of the sixth field
(Baseline shift [Ctrl +
B] we can set that
level, in comparison we
wish to integrate the
area.
www.experimetria.com
Negative integration: Only
the
below
zero
level
(negative) areas of the primer
curves determined at calibration will be counted. (see figure.106 ). In case we do not
wish to use the original baseline for integration, with the
help of the B button of the
sixth field (Baseline shift [Ctrl
+ B] we can set that level
which below we would like to integrate the
area.
Positive integration: Only the above zero
level (positive) areas of the primer curves
determined at calibration will be counted.
(see figure.105). In case we do not wish
to use the original baseline for integration, with
the help of the B button of
the sixth field (Baseline
shift [Ctrl + B] we can set
that level which above we
would like to integrate the
area.
[email protected]
11
BROCHURE
SOFTWARE
EXPERIMETRIA LTD.
In the following we are going to show four basic functions, which are the basic elements
of the software:
•
Setting of the baseline
•
Cursor scroll
This function is
•
Quick information acquisition
carried out with
•
Export
the “B” button of
•
Printing
the field in the
lower part of the
channels.
Setting of the baseline: In biological measuring, (through at other
measuring as well) it is frequent
that the baseline determined at
calibration or zero level (this is
called Baseline) after the fall of the
injected substance effects, is restored higher or lower than the
calibration. If we want to take the
new Baseline in account at the
evaluation, please act as follows.
If we push the button, a dotted green line will appear
at the calibrated zero level.
With the setting of this, the zero level can be set anywhere in the channel.
Scrolling of the cursor: In case we employ the cursors in any modes of evaluating, we have
already marked their scrolling. This is indicated by blackening the scroll of the “Set Cursor Position” bar. Marking can be achieved by clicking on the scroll with the left button of the mouse.
Left scrolling of the cursor is also possible with the same direction of arrows of “SCp. Bar.” The
result is the same if we use the arrows of the keyboard.
Quick information acquisition: The information belonging to the marked channels
can be displayed
with the event
markers of certain channels. If
we click on the
marker,
the
“ I n fo r m a ti o n ”
chart will open
and all those information can be
found, which is in
the “Notebook”
chart as well.
www.experimetria.com
[email protected]
12
BROCHURE
SOFTWARE
EXPERIMETRIA LTD.
Export: The program gives to opportunities to export the non-evaluated primer curves and its
derived values; and from the primer curve, the marked count (e.g. d/dt, min. – max. etc...) in
the “Setup Channel” chart.
•
•
From Notebook chart
From Export segment menu point
The export occurring from certain data acquisition charts can be carried out, in a way known in
Windows, by the opening of the File menu
Printing:
1.
2.
3.
4.
5.
Signal preview – view of the signals before printing
Signal – printing of signals
Notebook – printing of the notebook
Print! - this button starts the printing
Setup-this button opens the setting of the printer
If we want to print in colour, the Monochrome
option has to be switched off. If we want to
save the screen to the server, use “Save
Screenshot” point of the “File” menu. We
give the name of the picture in the displayed
window, which is saved in Bitmap (BMP) format by the software.
www.experimetria.com
[email protected]
13
BROCHURE
SOFTWARE
EXPERIMETRIA LTD.
The construction of the software makes it possible to display and store any User Define - maximum 2 KHz - signals that can be recorded by sample taking. Therefore, as well as completed in
its construction, we can receive and work up complete signals of Haemodynamics (Blood pressure, EKG, Temperature, respiration number, etc.), Central Nerve Systems (EEG. EMG, etc.)
and certain Behaviour Systems (Non-invasive blood pressure, pain threshold) dimensionally.
Example for configuration:
1 ch. Invasive - Blood pressure (BP).
2 ch. Invasive - Blood pressure (LVP).
3 ch. EKG-II - Lead.
4 ch. Rectal - Temperature.
We construct the configuration via the
“Definition” menu point of the “Channel”
menu, such way that certain dimensions of
measuring parameters are marked in the
“User Defined” scrolling menu dimension list
of the “Setup channel” chart.
www.experimetria.com
[email protected]
14
BROCHURE
SOFTWARE
EXPERIMETRIA LTD.
About the hardware
NI 6023E Multifunction DAQ – 12-Bit, 200 kS/s, 16 Analog Inputs
• 16 analog inputs at up to 200 kS/s, 12 or 16-bit
resolution
• Up to 2 analog outputs at 10 kS/s, 12 or 16-bit
resolution
• 8 digital I/O lines (TTL/CMOS); two 24-bit counter/
timers
• Digital triggering
• 4 analog input signal ranges
• NI-DAQ driver that simplifies configuration and
measurements
Operating Systems
• Windows 2000/NT/XP
• Real-time performance with LabVIEW
• Others such as Linux® and Mac OS X
Driver Software (included)
NI-DAQ 7
•
Overview and Applications
National Instruments low-cost E Series multifunction data acquisition
devices provide full functionality at a price to meet the needs of the
budget-conscious user. They are ideal for applications ranging from
continuous high-speed data logging to control applications to highvoltage signal or sensor measurements when used with NI signal
conditioning. Synchronize the operations of multiple devices using
the RTSI bus or PXI trigger bus to easily integrate other hardware
such as motion control and machine vision to create an entire
measurement and control system.
Type
Bus
Analog imputs
Imput
resolution
Max sampling
rate
NI 6023E
PCI
16 SE/8 DI
12 bits
200 kS/s
Input range
Analogue
outputs
Digital I/O
Counter/
Times
Trigers
±0.05 to ±10 V
0
8
2, 24-bit
Digital
NI low-cost E Series DAQ devices include the following features and technologies:
Temperature Drift Protection Circuitry – Designed with components that minimize the effect of
temperature changes on measurements to less than 0.0010% of reading/°C.
Resolution-Improvement Technologies – Carefully designed noise floor maximizes the
resolution.
Onboard Self-Calibration – Precise voltage reference included for calibration and measurement
accuracy. Self-calibration is completely software controlled, with no potentiometers to adjust.
www.experimetria.com
[email protected]
15
BROCHURE
SOFTWARE
EXPERIMETRIA LTD.
NI DAQ-STC – Timing and control ASIC designed to
provide more flexibility, lower power consumption,
and a higher immunity to noise and jitter than off-theshelf counter/timer chips.
NI MITE – ASIC designed to optimize data transfer
for multiple simultaneous operations using bus
mastering with one DMA channel, interrupts, or
programmed I/O.
NI PGIA – Measurement and instrument class
amplifier that guarantees settling times at all gains.
Typical commercial off-the-shelf amplifier
components do not meet the settling time
requirements for high-gain measurement applications.
PFI Lines – Eight programmable function input (PFI) lines that you can
use for software-controlled routing of interboard and intraboard digital and timing signals.
RTSI or PXI Trigger Bus – Bus used to share timing and control signals between two or more
PCI or PXI devices to synchronize operations.
RSE Mode – In addition to differential and nonreferenced single-ended modes, NI low-cost E
Series devices offer the referenced single-ended (RSE) mode for use with floating-signal sources
in applications with channel counts higher than eight.
Onboard Temperature Sensor – Included for monitoring the operating temperature of the
device to ensure that it is operating within
thespecified range.
The AIF-01, -02 and –03
connector boxes helps the
user for the quick and
apropriate
connection
bet ween the a n alo gue
amplifier and the NI A/D card.
Computer requirements:
Minimal:
Recommended:
Processor: Intel Celeron 2 GHz or AMD
Processor: Intel P4 2.4 GHz or AMD AthAthlonXP 2000+
lonXP 2600+
256 Mb RAM
512 Mb RAM
Video card: ATI Radeon 9000 series or
Video card: ATI Radeon 9000 series or
Nvidia Geforce 2/3/MX/FX series (PCI type Nvidia Geforce 3/FX series (PCI type connecconnector not recommended.)
tor not recommended.)
SVGA monitor, 1024x768 recommended,
SVGA monitor, 1280x1024 recommended,
(at least 17-19” diagonal size and 100 Hz
(at least 17-19” diagonal size and 100 Hz ferfervency recommended)
vency recommended)
Windows XP Home v. Professional operation system
Three button mouse, 101 button keyboard, CD-ROM reader - writer
One free RS232 COM port for the stimulator
One free PCI connector on the motherboard for the NiDaq A/D card.
www.experimetria.com
[email protected]
16
BROCHURE
SOFTWARE
EXPERIMETRIA LTD.
What is in the box?
The box contains:
•
SPEL software
•
SPEL software user manual
•
NI Daq A/D card
•
NI Daq driver software
•
AIF-0# connector box
•
cables
FA Q
Is it an open system?
Can I use my biological amplifiers?
Should I by the NI card?
No. You can purchase the NI card on your own.
In this case all the guarantee, delivery and installation duties are on you.
Yes. The SPEL software systems can
receive any standard analogue 0 +5v
DC signal.
Can I measure other parameters?
Can I use more then one software on a PC?
Yes. All the members of the SPEL software family are developed on the same type of NI card.
Can I use laptop?
Who gives the computer?
Yes. The PCMCIA version of the NI card is available.
Do I have upgrade?
Yes. All the SPEL software systems
contains the User Define option, which
is capable to receive any custom define
voltage data.
The Experimetria do not supply the PC
with the software system instantly. In
case of request Experimetria kindly delivers the PC or laptop.
Maintenance upgrades are available. Further developed versions are treated as new products.
Can I use the software on an other PC
These are available for a moderate upgrade
or laptop?
cost.
No. If you would like to analyse the previously recorded data Experimetria
Can I have software training?
kindly provide you the demo version of
your software where the full analysis
Yes. For detailed information please contact Ex- option is presented.
perimetria.
What is the Windows operation system?
Do I have guarantee?
Yes. 2 years.
www.experimetria.com
The SPEL software systems can work
under Win 9X, NT, ME and XP. The Win
2000 is not applicable.
[email protected]
17