1
Caution: For Research Use Only.
Not for use in diagnostic procedures.
FOR RESEARCH USE ONLY
TOC-1
LC1115RUO.3(2/15)
Immucor Transplant Diagnostics, INC
550 West Avenue
Stamford CT 06902
Luminex is a trademark of Luminex Corporation
LIFECODES, MATCH IT!, IMMUCOR and associated logos are trademarks and/or
registered trademarks of Immucor Incorporated and/or its subsidiaries in the
United States and/or other countries.
FOR RESEARCH USE ONLY
TOC-2
LC1115RUO.3(2/15)
T ABLE OF C ONTENTS
Chapter 1: Introduction
System Requirements 1-1
Computer Requirements 1-1
Software Requirements 1-1
Luminex Requirements 1-1
Networking 1-2
Networking Client Computers to a SQL Server 1-2
Networking Client computers to a SQL Server Express 1-2
Chapter 2: MATCH IT! Menus
Menus 2-1
File Menu 2-1
Settings (Lab Settings) Menu 2-1
Tools 2-9
Exports/Reports 2-12
Chapter 3: Automated Batch Setup
Lot Information Import 3-1
Importing Template files into Luminex 3-1
Importing EDS files into MATCH IT! 3-1
Automated Batch Setup 3-2
Setting Automated Batch Preferences 3-2
Creating a Sample List (optional) 3-2
Creating a Batch 3-3
Running a Batch in Luminex 3-4
Batch Status 3-6
FOR RESEARCH USE ONLY
TOC-3
LC1115RUO.3(2/15)
Chapter 4: LifeScreen Deluxe Analysis
Importing LifeScreen Results into MATCH IT! 4-1
Importing EDS files 4-1
Manually Importing CSV Files 4-1
Opening a Batch 4-2
Direct Selection 4-2
Date Range Selection 4-2
Viewing and Changing the Results of a Batch 4-3
Scrolling through a Batch 4-3
Navigating to a Particular Sample 4-3
Changing the Sort Order 4-4
Displaying BAF Values 4-4
Displaying Phenotypes 4-4
Displaying Bead Counts 4-4
Assignments, Displayed Values and Calculations 4-5
Batch Failures 4-5
Overriding an Assignment 4-6
Overriding Default Parameters 4-6
Optional VBAF Analysis 4-7
Approving the Results of the Analysis 4-7
Saving, Completing, and Approving an Assignment 4-7
Reports 4-8
Printing Standard Report 4-8
Printing an Individual Sample Report or Audit Report 4-8
Batch Reporting 4-8
Exporting Reports 4-9
Exporting Summary Results 4-10
FOR RESEARCH USE ONLY
TOC-4
LC1115RUO.3(2/15)
Chapter 5: LIFECODES ID Analysis
Importing ID Results into MATCH IT! 5-1
Importing EDS files 5-1
Manually Importing CSV Files 5-1
Opening a Batch 5-2
Direct Selection 5-2
Date Range Selection 5-2
Viewing a Sample within a Batch 5-3
Navigating to a Particular Sample 5-3
Tabs in the Analysis screen 5-4
Column Customization 5-4
Graphical Display 5-6
Antigen Graph 5-6
Control Graph 5-6
Additional Graphing Features 5-7
Calculations and Displayed Values 5-8
Calculations 5-8
Making a Positive or Negative Assignment 5-9
By Standard Mode 5-9
By MFI Cutoff 5-10
Batch Failures 15-10
Tools for Making an Assignment 5-11
Tail Analysis 5-12
Automatic Tail 5-13
Manual Tail 5-13
Creating a History 5-16
New History 5-16
Applying a Previously Created History to a New Sample 5-16
View Current Assigned History for a Sample 5-17
FOR RESEARCH USE ONLY
TOC-5
LC1115RUO.3(2/15)
Approving the Results of the Analysis 5-17
Approving Results 5-17
Reporting and Printing 5-18
Customizing a Final Report 5-18
Quick Print 5-19
Batch Reporting 5-19
Exporting Reports 5-20
Exporting Summary Results 5-21
Chapter 6: LIFECODES Single Antigen Analysis
Importing Single Antigen Results into MATCH IT! 6-1
Importing EDS files 6-1
Manually Importing CSV Files 6-1
Opening a Batch 6-2
Direct Selection 6-2
Date Range Selection 6-3
Viewing a Sample within a Batch 6-3
Navigating to a Particular Sample 6-3
Overall Antibody Assignments 6-4
Automatic Assignments 6-4
Calculations and Displayed Values 6-4
Calculations for LSA 6-4
Calculations for C3d 6-5
Making a Positive or Negative Assignment 6-5
By Standard Mode (LSA and C3d) 6
By MFI Cutoff (LSA and C3d) 6
Move/Remove/Exclude Antigens to/from the Assignment (LSA and
C3d) 6-7
Tools for Making an Assignment (LSA and C3d) 6-8
FOR RESEARCH USE ONLY
TOC-6
LC1115RUO.3(2/15)
Creating a History (LSA and C3d) 6-11
Applying a Previously Created History to a New Sample 6-11
View Current Assigned History for a Sample 6-12
Column Customization (LSA and C3d) 6-12
Changing Sort Order 6-12
Column Removal/Addition and Column Width 6-13
Displaying Selected Bead Values 6-13
Graphical Display (LSA and C3d) 6-13
Antigen Graph 6-13
Control Graph 6-14
Additional Graphing Features 6-15
Batch Failures (LSA and C3d) 6-16
Bead Count Failure 6-16
Approving the Results of the Analysis 6-17
Saving Results 6-17
Reporting and Printing 6-18
Customizing a Final Report 6-18
Quick Print 6-19
Batch Reporting 6-19
Exporting Reports 6-20
Exporting Summary Results 6-21
Chapter 7: DSA Analysis
Importing DSA Results into MATCH IT! 7-1
Importing EDS files 7-1
Manually Importing CSV Files 7-1
Opening a Batch 7-2
Direct Selection 7-2
Date Range Selection 7-2
Viewing and Changing the Results of a Batch 7-3
FOR RESEARCH USE ONLY
TOC-7
LC1115RUO.3(2/15)
Scrolling through a Batch 7-3
Navigating to a Particular Sample 7-3
Changing the Sort Order 7-4
Displaying Bead Counts 7-4
Assignments, Displayed Values and Calculations 7-4
Batch Failures 7-5
Overriding an Assignment 7-5
Overriding Default Parameters 7-6
Approving the Results of the Analysis 7-6
Saving, Completing, and Approving an Assignment 7-6
Reports 7-7
Printing Standard Report 7-7
Printing an Individual Sample Report or Audit Report 7-7
Batch Reporting 7-7
Exporting Reports 7-8
Exporting Summary Results 7-9
Chapter 8: Database management
Creating a New Database 8-1
Deleting a Database 8-1
Attaching a Database 8-2
Detaching a Database 8-2
Backing Up a Database 8-2
Restoring a Database 8-2
Choosing a Server 8-3
Connecting to a Database 8-3
FOR RESEARCH USE ONLY
TOC-8
LC1115RUO.3(2/15)
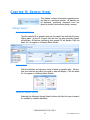
Chapter 9: Sample View
Sample Search 9-1
By Sample ID Name 9-1
By Run Date 9-1
Advanced Sample Search 9-1
Merge Sample IDs/Sample Names 9-2
Viewing Antibody Batch Results 9-3
Patient Information 9-3
Manually Entering Patient Data 9-4
Entering HLA Type 9-4
Displaying Batches 9-4
Graphing Antigens across Several Batches 9-6
Creating Paired Data Sets and Graphing LSA IgG and C3d 9-8
Graphing LSA IgG-C3d paired data 9-10
Generating LSA IgG-C3d Reports 9-11
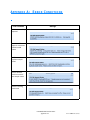
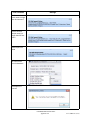
Appendix A: Error Conditions
**Patient, as defined in this manual, is synonymous with
subject/sample, as in the person or thing that is being
discussed or described.
FOR RESEARCH USE ONLY
TOC-9
LC1115RUO.3(2/15)
C HAPTER 1: I NTRODUCTION
Welcome to LIFECODES MATCH IT! Antibody Software. LIFECODES MATCH
IT! Antibody Software is an accessory for the evaluation of test results from
LIFECODE’s antibody products.
The LIFECODES MATCH IT! Antibody Software is an aid to assist qualified
laboratory personnel by suggesting the presence or absence of HLA antibodies.
Due to the complex nature of HLA Testing, qualified laboratory personnel must
review any result to assure correctness. The software is a laboratory aid and
not meant to be the sole source of a definitive result.
System Requirements
The following is required to successfully install and use LIFECODES MATCH IT!
Antibody Software, version 1.2.1, (Part Number 888627R).
Computer Requirements
•Microsoft™ Windows XP SP3, Vista, or Win 7 (32-64 bit version) operating
systems
•Pentium® 4 or Core 2 Duo
•10 GB hard disk space
•4 GB RAM
•24-bit graphics adapter and display
•XGA display with 1024 x 768
•Mouse or other windows compatible pointing device
Software Requirements
•Microsoft™ SQL Express 2008 (Included with software)
•Microsoft .NET Framework Version 3.5 (Included with software)
•(Optional) Microsoft™ SQL Server 2008 or 2012 for increased storage capacity
Luminex Requirements
•The LIFECODES MATCH IT! Antibody Software is designed to import csv files
created by the Luminex 2.3 and xPONENT software versions.
•The data present in the csv file must be generated using an unmodified
Luminex template provided by LIFECODES.
FOR RESEARCH USE ONLY
1-1
LC1115RUO.3 (2/15)
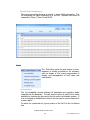
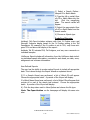
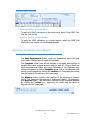
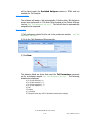
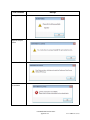
Networking
Networking Client Computers to a SQL Server
For Standard or Enterprise editions
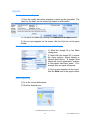
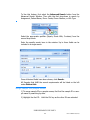
1) From the Start Menu, Open the MATCH IT! database management
utility drop-down. Choose the application and log-in required for this
utility.
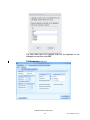
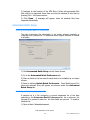
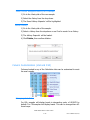
2) Click Choose Server.
3) Click Available SQL Instances dropdown to display known SQL
instances.
4) Choose the SQL instance that contains the database.
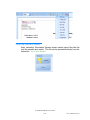
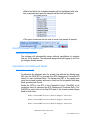
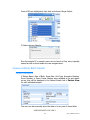
5) Once the connection is established a list of available databases will
be displayed. Choose the database and click Ok to connect.
6)Open Matchit Software.
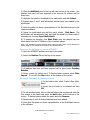
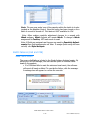
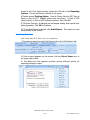
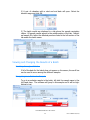
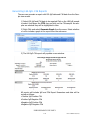
Troubleshooting
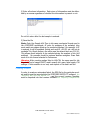
If the SQL instance does not appear in the dropdown then there are two
options:
1) Type in the name of the SQL instance, if the instance is valid and
Match IT! can connect to it then the databases it holds will be listed.
Click Connect to establish the connection.
2) Click Refresh Server List to scan the network for Match IT!
instances.
If the SQL instance appears but Match IT! can not connect to it:
1) Check to see if a port for the instance has been specified.
Ask the database administrator to check the port settings in SQL
Server Configuration Manager.
2) If a port has been specified then add the port number to the SQL
instance in the dropdown.
Example:
<Computer name>, <port number>
MatchITserver, 1500
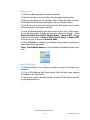
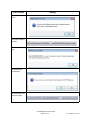
Networking Client computers to a SQL Server Express
For 2008 editions
1) From the Start Menu, Open the MATCH IT! database management
utility drop-down. Choose the application and log-in required for this
utility.
FOR RESEARCH USE ONLY
1-2
LC1115RUO.3 (2/15)
2) Click Choose Server.
3) Click Available SQL Instances dropdown to display known SQL
instances.
4) Choose the SQL instance that contains the database. Click Connect
to establish the connection.
5) Once the connection is established a list of available databases will
be displayed. Choose the database and click Ok to connect.
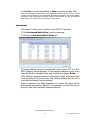
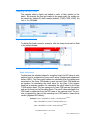
Troubleshooting
On the computer that holds the database, verify the SQL Browser is off
and TCP/IP is enabled.
Checking the SQL Browser state:
1) Open SQL Server Configuration Manager.
2) Click SQL Server Services.
3) Check that the SQL Server Browser is stopped. If it is not then,
right click the service and choose stop.
Checking TCP/IP state:
1) Open SQL Server Configuration Manager.
2) Click SQL Server Network Configuration.
3) Click the correct protocol. This will be the name of the instance that
holds the database.
4) Verify the status of TCP/IP. It should be enabled. If it is not then,
right click TCP/IP and choose Enable.
If the SQL instance does not appear in the dropdown then there are two
options:
1) Type in the name of the SQL instance, if the instance is valid and
Match IT! can connect to it then the databases it holds will be listed.
2) Click Refresh Server List to scan the network for Match IT!
instances.
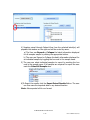
If the SQL instance appears but Match IT! can not connect to it:
1) Check to see if a port for the instance has been specified.
2) Open SQL Server Configuration Manager.
3) Click SQL Server Network Configuration.
4) Click the correct protocol. This will be the name of the instance that
holds the database
FOR RESEARCH USE ONLY
1-3
LC1115RUO.3 (2/15)
5) Double click TCP/IP.
6) Choose the IP Addresses tab.
7) Scroll to the bottom to find IPAll.
8) Check the TCP Port field. If a port has been specified then add the
port number to the SQL instance in the dropdown.
Example:
<Computer name>, <port number>
MatchITserver, 1500
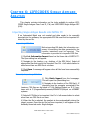
**Note: Images depicted in this manual may differ slightly from
MATCH IT! Antibody software. Please contact LIFECODES technical
support with any questions.
FOR RESEARCH USE ONLY
1-4
LC1115RUO.3 (2/15)
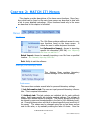
C HAPTER 2: MATCH IT! M ENUS
This chapter provides descriptions of the home menu functions. Menu functions which can be found on the main home screen are described in brief with
a link to more detailed instructions. Other functions found only in the menu
are described in this chapter in full detail.
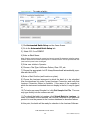
Menus
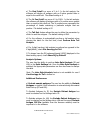
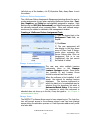
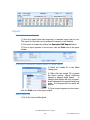
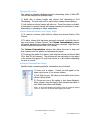
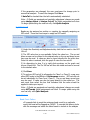
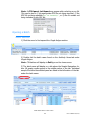
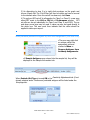
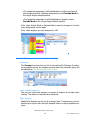
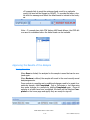
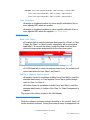
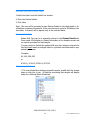
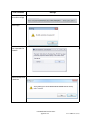
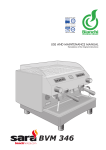
File Menu
The File Menu contains addtional access to common functions found on the home screen. It
allows the user to utilize keyboard shortcuts.
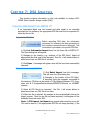
Lot Information Import: Access to importing
specific lot information (EDS file). See “Importing
EDS files into MATCH IT!”
Batch Import: Access to manually importing a csv file from a specified
location. See “Manual ly Importing CSV Files”
Exit: Ability to exit the software.
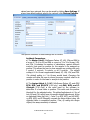
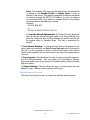
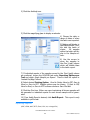
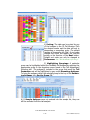
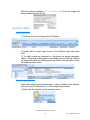
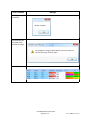
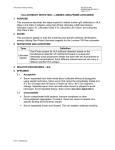
Settings (Lab Settings) Menu
The Settings Menu contains laboratory
defined settings for the various assays.
Preferences
This menu item contains several tabs for personal laboratory settings.
1) Lab Information tab: The user can input personal laboratory information. This is required information.
2) Antibody tab: This tab contains an individual tab for each antibody
assay. Each assay specific tab includes analysis settings. The software is
installed with default values for analysis. The default settings should only
be altered by personnel knowledgeable in the field of HLA Antibody Analysis. Changing these values will result in altered specificity and sensitivity of
the assay. The values may be changed using the up and down arrows
next to the value, or by manually entering the value of choice. Once the
FOR RESEARCH USE ONLY
2-1
LC1115RUO.3(2/15)
values have been entered, they can be saved by clicking Save Settings. If
at any time default settings need to be restored, click Restore Defaults.
The specific functions of these settings are as follows.
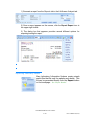
Antibody Parameters:
a) The Assign Cutoff (LifeScreen Deluxe, ID, LSA, C3d and DSA) is
a score of 1 to 4 for ID and DSA or a score of 1 to 3 for Screen, LSA,
and C3d. It indicates the number of calculations, against different
controls, that must be positive for the sample to be assigned as
positive. This allows the user to show samples are positive with only
1 control, 2 controls, 3 controls, or all 4 controls. The default
setting is 2 for Screen supplemental beads, ID, LSA, C3d, and DSA.
The default setting is 1 for Screen pooled bead. Changing this
number will allow the user to chose how many controls need to be
positive in order for the bead or analyte to be positive.
b) The Assign Adjust 1, 2, & 3 (LifeScreen Deluxe, ID, and DSA)
BCM, BCR, and AD-BCR (LSA only), and BGA, BCM, and RStrength (C3d Only) is the value used by the software to
determine if a bead value is positive. This value sets the positive
threshold for the adjusted value. The default adjustment is 0 for all
but LSA and C3d, which have lot-specific default adjustments. When
an Adjusted Value (Adj Val 1, 2 and 3 or BCM, BCR, and AD-BCR),
or BGA, BCM, and R-Strength) exceeds the Assign Adjust value, the
Adjusted Value is considered positive. Thus, by raising the Assign
Adjust, the assay sensitivity is reduced.
FOR RESEARCH USE ONLY
2-2
LC1115RUO.3(2/15)
c) The Pos/Neg Control Override (LifeScreen Deluxe only when
submitting batches to Liquid Handler) allows the logged-in user to
decide if this function should be enabled. When enabled, the entire
batch is tied to the performance of the Positive and Negative
control. All samples will be listed as failed if either the Positive or
Negative Control samples fail.
•A Negative Control is considered as failed if any bead fails to
meet the minimum bead count, or if the Negative Control has a
positive assignment for Class I or Class II.
•A Positive Control is considered as failed if any bead fails to meet
the minimum bead count, or if either of the Class I or Class II
assignment is negative.
d) Enable VBAF Calculation (LMX only) allows the logged-in user
to activate this feature. By default, this feature is inactivated. VBAF,
or Variable Background Adjustment Factor, is designed to be used
by personnel knowledgeable in the field of HLA Antibody analysis
when the samples being analyzed have negative control bead
values that do not conform to expected values. This calculation
uses the following formula:
(MFIClassI - VBAF)/AVGCON1-BAFCON1-VBAF/256
TheVariable Background Adjustment Factor (VBAF) is calculated as
the difference between the observed MFI for a CON bead and a
predetermined average (AVG) value based on a set of negative
sera. The VBAF is then subtracted from the MFI value of the CON
and the Class 1 & Class II beads. VBAF makes the assay less
sensitive when the negative control bead values are low and more
sensitive when the negative control bead values are high. Once this
feature is enabled, the calculation can be applied to an entire batch,
or to individual samples. If the VBAF calculation is used, the sample
header will indicate this. By default this feature is inactivated.
e) Import Mode (ID and LSA) allows the user to choose to apply
either the Standard Assignment adjustments (Assign Cutoff and
Assign Adjust or BCM, BCR and AD-BCR) or to set cut-offs based on
an MFI value for ID and LSA files upon import.
f) Bead Ranking Default tab ((ID and LSA) allows the user to
define the columns that will be included on the Bead Ranking Report
during export. The user can select individual columns by placing a
FOR RESEARCH USE ONLY
2-3
LC1115RUO.3(2/15)
check next to the item. Once all items have been selected, click
Save Settings.
Negative Control Sample Name (C3d ONLY)
It is a requirement of the C3d assay that a negative control sample
be included in every batch. The user must designate a Negative
Control Sample Name that will be referenced for all C3d batches
upon import.
If the Negative Control Sample Name in the batch does not match
what is listed in Preferences, the user will be prompted to select a
negative control upon import.
FOR RESEARCH USE ONLY
2-4
LC1115RUO.3(2/15)
The user must click on a sample from the list displayed in the
dialogue box and then click OK.
Tail Parameters (ID only):
FOR RESEARCH USE ONLY
2-5
LC1115RUO.3(2/15)
a) The Rval Cutoff is a score of 0 to 1. In the tail analysis, the
software will display all antigens with an R-value greater than or
equal to the cutoff set. The default setting is 0.
b) The % Pos Cutoff is a score of 0 to 100%. In the tail analysis,
the software will display all antigens with a % positive score greater
than or equal to the cutoff set. The % positive score represents the
percentage of beads containing a particular antigen that are
positive. The default setting is 50.
c) The Tail Sort feature allows the user to define the parameter by
which to rank the antigens. The default setting is RVal.
d) For the software to automatically perform a tail analysis when
opening the batch for the first time, check Perform Auto Tail
Analysis.
e) If a 2-digit (serology) tail analysis is preferred as opposed to the
4-digit(Allelic), check Use Serology for Tail.
f) To always have the DQ enhanced beads (LM2Q) displayed in the
bead ranking report, check Show DQ by Default
Analysis Options:
The user has the ability to perform Auto Eplet Analysis (ID and
LSA) in the Eplet Settings tab. Once the Auto Eplet Analysis is
selected, the appropriate parameters can then be chosen to analyze
the data.
Note: The Auto Eplet Analysis feature is not available for use if
Use Serology for Tail is turned on.
Additional Preferences:
a) Exclude sample antigens The user has the ability to Exclude
Antigens on import if this information in entered during Automated
Batch Set-up (ID and LSA).
To Exclude Antigens for ID, the Exclude Patient Antigen box
must be checked on the Settings tab in ID.
To Exclude antigens for LSA, the Exclude Patient Antigens box
must be checked on the Settings tab in LSA and the import Exclude
Antigen CSV file (available from the Immucor website) must be
imported in to the software
FOR RESEARCH USE ONLY
2-6
LC1115RUO.3(2/15)
Note: The sample’s HLA type must be entered into the sample list
or added to the Sample Profile in Patient View in order to
display on the report. This feature is designed for batches submitted
to Luminex through the MATCH IT! software. In order for antigens
to be excluded they must match an antigen listed on the product
worksheet and be separated by commas.
Example:
A2, A24, B56, B51
or
A*02:01, A*24:02, B*56:01, B*51:01
b) Override Default Adjustments (LSA and C3d only) allows the
user to set new cutoffs and apply them to all future batches of a
given lot. When this box is left un-checked lot-specific cut-offs will
be applied when in Standard Mode. This box is unchecked by
default.
3) Date Format Settings: To change the date format that appears in the
reports and user interfaces, the Date Format Settings may be changed in
this tab. It is also necessary to select a date format used in the Luminex
system which specifies the run date format in the output files generated by
Luminex.
4) Page Layouts: This tab allows the user to restore a specific page layout to its default settings. This only needs to be performed if changes
have been made to any of the layout of a particular assay. Select the layout
and click restore.
5) Report Settings: This tab allows the user to choose paper size and
address format. Settings will be applied to all reports.
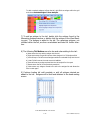
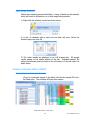
Antibody Reactivity Groups
This menu item allows the user to create user defined antigen groups.
FOR RESEARCH USE ONLY
2-7
LC1115RUO.3(2/15)
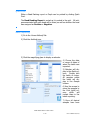
To color code antigens:1)
Under the Color Managment
tab, choose either Class I or
Class II.
2) Choose a color from the Antigen(s) Color drop down menu.
3) Place a check mark next to all
the antigens to be colored one
color.
4) Click Save.
To create or edit a group:
1) Under the Group Managment
tab, choose either Class I or
Class II.
2) Choose an existing group from
the drop down menu if edits are
needed or choose Add New.
3) If creating a new group, type
the name of the group in the box
and click OK.
4) Place a check mark next to all
antigens that need to be added to
the newly created group or the
group being edited.
5) Click Save.
To Import/Export Group Data:
1) An already exisiting .xml file can be imported by clicking Import. This
file is available on LIFECODES section of our website.
2) Once a category of groups is created, an .xml file can be exported by
clicking Export.
FOR RESEARCH USE ONLY
2-8
LC1115RUO.3(2/15)
Eplet/Epitope Management
This menu item allows the user to import or export Eplet information. The
file containing the eplet information is a .csv file. Separate files must be
imported for Class I, Class II, and MICA.
.
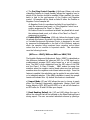
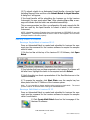
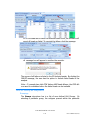
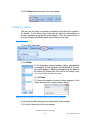
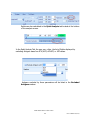
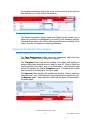
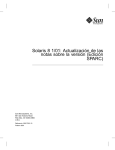
Tools
The Tools Menu gives the user access to management of certain properties in the software;
such as display of lots, screen assignments to
display, and management of both users and
instruments.
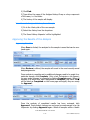
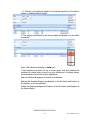
Lot Availability
The Lot Availability window displays all templates and expiration dates
imported into the database. The user has the option of which lots to make
available by checking the box next to the lot under the Available column. If
a lot is checked as Available then this lot can be used to import data and to
create a batch.
To search for a particular lot, type a portion of the lot ID in the Lot Search
box.
FOR RESEARCH USE ONLY
2-9
LC1115RUO.3(2/15)
Left-click any of the headers, Lot ID, Expiration Date, Assay Name to sort
the column.
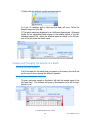
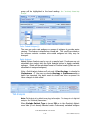
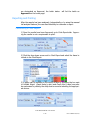
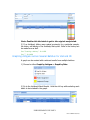
LifeScreen Deluxe Assignments
The LifeScreen Deluxe Assignment Management window allows the user to
create assignments for use when analyzing LifeScreen Deluxe data. Positive, Negative, and Failed are automatically assigned to samples. High
Background and ND (Not Determined) are default assignments but must
be manually assigned when reviewing data. Other user defined assignments may be created or deleted in this management window.
Creating a LifeScreen Deluxe Assignment Text:
1) Type the desired text in the
Assignment Text field; ex.
Repeat.
2) Click Save.
3) The new assignment will
now display in the drop down
menu of Class I and II Assignments when reviewing LifeScreen Deluxe data. Once an
Assignment Text is in use
(highlighted), the text cannot
be cleared or edited.
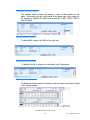
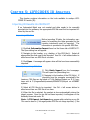
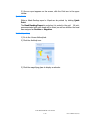
Manage Luminex Systems
The user may enter multiple Luminex
instruments when in the Manage
Luminex Systems window. Serial Number, Luminex ID, and Luminex Server
should be entered and then saved.
When the software is first installed, it will
search the network for existing Luminex
databases.
The Luminex instrument to
which the batch is to be submitted may be
selected from the dropdown list when in
Automated Batch Setup. If the name of
the computer to which the instrument is
attached does not show up in the list, it may be typed in. See “Chapter 3:
Automated Batch Setup”
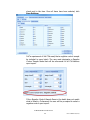
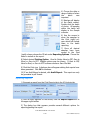
Manage Users
The MATCH IT! software allows users to have unique log-ins. The login feature will prevent access to the software unless a user has been granted
access during the activation process or if Lab Supervisor adds a user profile
at a later date.
FOR RESEARCH USE ONLY
2-10
LC1115RUO.3(2/15)
To create a user:
Note: The first time the software is installed, the login information is
username: supervisor
password: lifecodes
1) Type a User Name, First Name, and Last Name.
2) Choose the role: Lab Supervisor, Technician, or User.
A User: Users can only create other users. A User does not have the ability to save, complete or approve samples and is only in a read-only mode.
A Technician: Technicians can create other users and other Technicians.
A Technician is able to make changes, add comments, save and complete
samples.
A Lab Supervisor: Lab Supervisors can create all levels previously
described plus other supervisors. A Lab Supervisor is able to perform all
the roles of a Technician in addition to the ability to Approve samples and
run Audit Reports.
3) Click Add.
4) Close the software.
To login or reset password:
1) Open the software. Type in the user name created in the steps above.
The default password is lifecodes.
2) Go to the User:(x) tab and type the old password and then a any new
password.
3) Click Change Password.
4) Clicking Reset Password will set password to lifecodes.
Available Assays
This menu item allows the user to choose what to display on the Antibody
home tab. For example, if the user does not wish to display LifeScreen
data, uncheck the LifeScreen choice found under Antibody.
FOR RESEARCH USE ONLY
2-11
LC1115RUO.3(2/15)
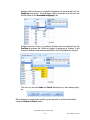
Exports/Reports
The Exports/Reports Menu item allows the
user to export results and create reports.
Export Design Wizard
The wizard will help the user to create a user defined export for all tests.
1) Choose a test to create an export.
2) Customize the export columns to include in the final export.
FOR RESEARCH USE ONLY
2-12
LC1115RUO.3(2/15)
3) Columns can be moved once selected.
4) Choose a field delimiter for your final export.
5) Name the final export.
Note: LSA-C3d is not available in Export Design Wizard.
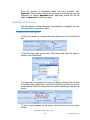
Export Results
To export results:
FOR RESEARCH USE ONLY
2-13
LC1115RUO.3(2/15)
1) Select a Search Option-Sample ID or Batch Name.
2) Type the full or partial Sample ID or Batch Name into the
cell.
Click the magnifying
glass. The search results will
appear.
3) Select the appropriate Sample ID or Batch Name from the
search results.
4) Choose an Export type.
Predefined Exports:
Antibody Tail Export includes antigens with their % Postive score and
Strength. Antigens display based on the % Positive setting in the Tail
Parameters. For example if the % positive is set to 75%, only those antigens 75% and above will display in the export.
Antibody Tail ID includes PRA, Tail Antigens, and any user comments on
individual samples.
LifeScreen Export includes all information from the LifeScreen data including individual sample information, raw data for each bead, run date, score,
assignment and reviewer information.
User Defined Exports:
The user has the ability to create custom Exports to include all appropriate
data. This is done through the Export Wizard as explained above.
5) If a Sample Search was performed, a list of Batch IDs will appear.
Choose the appropriate batch. A preview of the Export will display.
If a Batch Name Search was performed, a list of Batch IDs will appear that
contain all or part of the search text entered. Choose the appropriate
batch. A preview of the Export will display.
6) Click the drop-down next to Save Options and choose the file type.
Note: The Export button on the homepage will display the same window
FOR RESEARCH USE ONLY
2-14
LC1115RUO.3(2/15)
Batch Reports
1) Click the magnifying glass to display a calendar.
2) Choose the date or range of dates when the batch was imported.
3) Batches will display on the left under Batch. Select the batch of choice.
All samples within the batch will display under the Sample column.
4) Use the arrows to move the samples to the Print (right) column which
will include them in the batch reporting.
5) Once all desired samples have been moved to the Print (right) column,
choose the appropriate Test tab and Reporting Option for the test. Select
Send to Printer, Save to PDF, Save to Excel, or Save to RTF. Multiple
options may be chosen. If Save to PDF, Save to Excel, or Save to RTF
is chosen browse to choose a Save File Path.
6) Click the Print icon. Dialog box will appear when printing is complete or
reports have been generated.
Note: The Antibody button on the homepage will display the same window
Export C3d Results
1) Click the Calendar Icon to select a run-date or range of run-dates to be
displayed.
2) A list of C3d Batches with Paired results from the date range selected
will appear in the left window.
3. The user can select individual batches or Select All C3d batches by clicking the appropriate box.
FOR RESEARCH USE ONLY
2-15
LC1115RUO.3(2/15)
4) Samples paired through Patient View from the selected batch(es) will
populate the window on the right and will be sorted by name.
a) The User can Expand or Collapse the batch information displayed
for all samples sample by clicking the appropriate button.
b) The user can Expand or Collapse the batch information displayed for
an individual sample by toggling the box next to the sample name
5) The user can select individual samples to export by marking the box
next to the sample name. If all samples are required for export the user
mark the Select All Samples box.
6)To Export the results, click the Export Paired Results Button. The user
can then save the exported data to any desired location.
Note: files exported will be csv format.
FOR RESEARCH USE ONLY
2-16
LC1115RUO.3(2/15)
C HAPTER 3: A UTOMATED B ATCH S ETUP
This chapter describes how to set up a batch. Detailed instructions are
described including creating a sample list, choosing a Luminex connection, and
then creating the entire batch for submission to the chosen Luminex.
Lot Information Import
Importing Template files into Luminex
Before creating a batch, the information necessary for identifying the
appropriate beads to count must be imported into the Luminex software.
The information is provided in lot-specific template files. Files with the
extension .idt are designed for use with the Luminex IS 2.3 software. Files
with the extension .lxt are designed for use with the Luminex xPonent software. Templates can be downloaded from the Immucor website.
To import an IDT file into Luminex IS 2.3
1) Go to File>Import Template found on the Luminex software home
tab.
2) Navigate to the location, of the IDT file(s). Choose the appropriate file
to be imported. Only one file may be chosen at a time.
3) A message will appear for each successful file import.
To import an LXT file into Luminex xPONENT
1) Select the Protocols Tab at the top of the Luminex xPONENT screen.
2) Click on the Import button on the bottom of the screen.
3) Navigate to the location of the LXT file(s). Choose the appropriate file
to be imported. Only one file may be chosen at a time.
4) A message will appear for each successful file import.
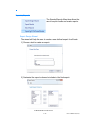
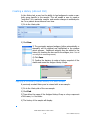
Importing EDS files into MATCH IT!
Before creating a batch, the information necessary
for analyzing data generated by the Luminex instrument must be imported. The information is provided
in lot-specific EDS files. To import an EDS file:
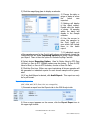
1) Click Lot Information Import found on the Home Screen. The Open
dialog box will appear.
FOR RESEARCH USE ONLY
3-1
LC1115RUO.3(2/15)
2) Navigate to the location of the EDS file(s). Select all appropriate files
that need to be imported. More than one may be selected at one time by
pressing Ctrl + left mouse button.
3) Click Open. A message will appear when all selected files have
imported successfully.
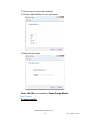
Automated Batch Setup
Setting Automated Batch Preferences
This tab customizes the information to be either entered manually or
imported from a sample list. To customize which import columns to include
in a batch:
1) Click Automated Batch Setup on the Home Screen.
2) Go to the Automated Batch Preferences tab.
3) Place a check in the box next to each item to be included as an import
column.
4) Save by clicking Update Batch Preferences. Once Batch Import Columns are selected, they will appear as columns under the Automated
Batch Setup tab.
Creating a Sample List (optional)
A sample list is a file containing a comma separated list of the data
selected on the Automated Batch Preferences tab. As a minimum, the
Sample ID is present in each list. All other fields are optional. To create a
Sample List:
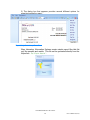
1) Open a blank Notepad document.
FOR RESEARCH USE ONLY
3-2
LC1115RUO.3(2/15)
2) Enter all column information. Each piece of information must be delimited by a comma regardless of whether the information is present or not.
Do not hit return after the last sample is entered.
3) Save the file
Note: Enter the Sample HLA Type in the same serological format used in
the LIFECODES worksheets. In order for antigens to be excluded, they
must match an antigen listed on the product worksheet. For example, if A1
is entered, it will be excluded. Entries such as A01, A01/02, etc. will not be
excluded. For Single Antigen, the allele must be entered such as A*01:01.
This allows those antigens to be excluded during the analysis of the HLA
antibody. No commas should be entered between antigens. Draw Date
must be in the format selected in Preferences
Warning: When creating patient lists for LSA-C3d, the name used for the
Negative Control sample MUST match exactly the name listed under C3d
settings. If this condition is not met, auto-import of this batch will fail.
Creating a Batch
In order to create an automated batch, the EDS file for the particular product and lot must be imported into the LIFECODES MATCH IT! software See
“Importing EDS files into MATCH IT!” and the correct Luminex Template
must be imported into the Luminex Software See “Importing Template files
FOR RESEARCH USE ONLY
3-3
LC1115RUO.3(2/15)
into Luminex” . To create a batch:
1) Click Automated Batch Setup on the Home Screen.
2) Go to the Automated Batch Setup tab.
3) Select IS 2.3 or xPONENT.
4) Enter a Batch Name.
Note: Session names cannot be reused and cannot exceed 30 characters including spaces.
Session names cannot contain apostrophes or commas and will not be imported and analyzed until the panel name is changed.
5) Enter user initials in Operator.
6) Choose a Test Type: LifeScreen Deluxe, Class I ID, etc.
7) Choose the appropriate Lot ID. Assay Name should automatically populate with the Lot ID.
8) Enter a Start Position (well location on plate).
9) Choose the Luminex instrument to which the batch is to be submitted
from the dropdown list under Current Luminex Connection and verify that
Luminex Connection Status is Available. If the name of the computer to
which the instrument is attached does not display in the list, it may be typed
in.
10) To load a pre-saved Sample List, click Get Sample List File. The user
may type directly into the columns as well.
11) To submit the batch to Luminex, click Submit Batch to Luminex. In
order for the batch to be submitted, the Luminex Template for the particular
product lot must be present in the Luminex database as described above.
At this point, the batch will be ready for selection in the Luminex Software.
FOR RESEARCH USE ONLY
3-4
LC1115RUO.3(2/15)
12) To submit a batch to an Automated Liquid Handler, choose the Liquid
Handling Mapped Drive and then click Submit Batch to Liquid Handler.
A dialog box will appear.
If the liquid handler will be submitting the Luminex run to the Luminex
Instrument, the user must select Yes. After selecting Yes or No, a message will indicate that the batch was submitted successfully.
This process generates two files—a configuration file and a sample list file
that are used by the liquid handler to submit a batch to the Luminex
Instrument.
NOTE: Specialized Luminex Templates have been developed by LIFECODES for use with
liquid handlers. These templates must be used in order for the integration of the Luminex
and liquid handler to function properly.
Running a Batch in Luminex
Running a Single Batch in Luminex IS 2.3
Once an Automated Batch is created and submitted to Luminex the user
must give the command for the Luminex software to acquire the samples
within a batch.
1) On the tool bar at the top of the Luminex IS 2.3 Software, click Open
Batch.
2) Any batches that have not been acquired in the Luminex IS software will
be listed here. Highlight the batch to be acquired and click Select.
3) Verify the plate is a direct representation of the Run Batch screen in the
Luminex software.
4) To acquire the samples, click Start Plate once the sample tray has
been placed into the XY Platform of the Luminex system.
Note: It is not possible to change positions when opening a single batch. The correct
position needs to be selected when Creating the Automated Batch.
Running a Multi-Batch in Luminex IS 2.3
Once an Automated Batch is created and submitted to Luminex the user
must give the command for the Luminex software to acquire the samples
within a multi-batch.
1) Click Create Multi Batch found on the homepage of the
Luminex IS software.
FOR RESEARCH USE ONLY
3-5
LC1115RUO.3(2/15)
2) Click the Add Batch icon in the top left hand corner of the screen. Any
batches that have not been acquired in the Luminex IS software will be
listed here.
3) Highlight the batch to be added to the multi-batch and click Select.
3) Repeat steps 1 and 2 until all desired batches have been added to the
multi-batch.
4) Verify the plate is a direct representation of the Run Batch screen in the
Luminex software.
5) Name the multi-batch and add the user’s initials. Click Save. The
multi-batch will automatically load, but could be saved for a future date if
necessary by choosing Open Multi-Batch.
6) To acquire the samples, click Start Plate once the sample tray has
been placed into the XY Platform of the Luminex system.
Note: It is possible to change positions when creating a multi- batch. As the batches are
added, drag the first sample of the batch to the desired location.
Running a Single Batch in Luminex xPONENT
1) Open the xPONENT software and sign in as admin.
2) Select the Batches Tab at the top of the screen.
3
3) All batches that have not been acquired will be listed under Pending
Batches
4) Select a batch by clicking on it. To Review batch contents select Plate
Layout. To run click the Run button at the bottom of the screen.
Running a Multibatch in Luminex xPonent
1) In the batches tab, select Create a New MultiBatch
2) Select the first batch to be included and click
OK.
3) To add another batch, click on the well where that corresponds with the
first sample in the batch and select the Add button at the bottom of the
screen. To delete batches select the batch and click Remove.
4) Repeat step 3 until all desired batches have been added.
5) Verify that the plate is a direct representation of the Multi-Batch screen
in the software.
FOR RESEARCH USE ONLY
3-6
LC1115RUO.3(2/15)
6) Click Run to process immediately or Save to process at a later time.
Note: The first batch in a multi-batch will, by default be added to well A1. If this is not the
location of the first batch in your multi-batch, Add the second batch to the correct location
according to the instructions above then Remove the first batch. You can now add this
batch back to the correct location following the steps above.
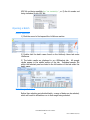
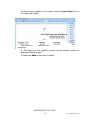
Batch Status
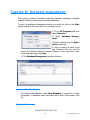
The status of a batch can be verified in the MATCH IT! software.
1) Click Automated Batch Setup from the homepage.
2) Choose the Automated Batch Status tab.
3) Pending batches (those not yet acquired in the Luminex IS 2.3 or xPONENT software) will be displayed. To see completed batches as well, check
Show All Batches. A pending batch may be deleted by clicking Delete.
Note: Deleting completed batches from the Batch Status will prevent them
from appearing in the home-screen. Only Pending batches that will not be
run should be deleted from this window.
4)Upon completion of a Batch acquisition in Luminex, the batch will be
automatically imported into Matchit! It is neccessary to refresh the homescreen to view newly imported automated batches.
FOR RESEARCH USE ONLY
3-7
LC1115RUO.3(2/15)
C HAPTER 4: L IFE S CREEN D ELUXE A NALYSIS
This chapter contains information on the tools available to analyze LifeScreen
Deluxe results (LifeScreen).
Importing LifeScreen Results into MATCH IT!
If an Automated Batch was not created and data needs to be manually
imported into the software, the appropriate EDS file must first be imported followed by the csv file.
Importing EDS files
Before importing LifeScreen data, the information necessary for analyzing the data generated
by the Luminex instrument must be imported.
The information is provided in lot-specific EDS
files.
1) Click Lot Information Import found on the Home tab of MATCH IT!.
The Open dialog box will appear.
2) Navigate to the location, e.g., desktop, of the EDS file(s). Select all
appropriate files that need to be imported. Use Ctrl + left mouse button
to select more than one EDS file at one time.
3) Click Open. A message when all lots have successfully imported.
Manually Importing CSV Files
1) Click Batch Import from the homepage.
This will open the Open dialog box.
2) Navigate to the location of the CSV file(s). If
importing from the computer connected to the
Luminex, CSV files can be found in C:\My Batches\Output on IS 2.3 systems and at C:\ProgramData\Luminex\xPONENT31\Output on xPonent
systems.
3) Select all CSV files to be imported. Use Ctrl + left mouse button to select
more than one CSV file at one time.
4) When the file is selected, the analysis is done automatically during the
import process. Once the csv file has been imported, it will appear on the
Antibody Home tab under LifeScreen.
Note: A CSV Import: Lot Import may appear after selecting a csv file.
This can be due to:1) the appropriate EDS file not being imported, 2) the
FOR RESEARCH USE ONLY
4-1
LC1115RUO.3(2/15)
EDS file not being available See “Lot Availability” , or 3) the lot number not
being indicated on the CSV file.
Opening a Batch
Direct Selection
1) Click the arrow to first expand the LifeScreen section.
2) Double click the batch name found on the Antibody Home tab under
LifeScreen
3) The batch results are displayed in an LMXAnalysis tab. All sample
results appear in the middle section of the tab. Individual sample IDs
within the selected panel are listed in the left section of the tab under the
batch name.
Date Range Selection
Rather than selecting an individual batch, a range of dates can be selected,
which will result in all batches run in that range being selected.
FOR RESEARCH USE ONLY
4-2
LC1115RUO.3(2/15)
1) Right click the antibody symbol as shown below.
2) A pair of calendars with a start and end date will open. Select the
desired range and click OK.
3) The batch results are displayed in an LifeScreen Analysis tab. All sample
results for the highlighted batch appear in the middle section of the tab.
Individual sample IDs within the selected panel are listed in the left section of the tab under the batch name.
Viewing and Changing the Results of a Batch
Scrolling through a Batch
If all of the data for the batch does not appear on the screen, the scroll bar
can be used to move among the different samples.
Navigating to a Particular Sample
To view a particular sample in the batch, left click the sample name in the
left hand pane. The software will jump to this sample and it will be highlighted in red.
FOR RESEARCH USE ONLY
4-3
LC1115RUO.3(2/15)
Changing the Sort Order
The samples within a batch are loaded in order of their location in the
batch. By selecting the sort tab located in the upper right, the results can
be ordered by Sample ID, Well Location (default), CON1, CON2, CON3 or
Pos Ctrl Bead.
Displaying BAF Values
To display BAF values, click BAF on the right tab.
Displaying Phenotypes
To display the list of antigens on the beads, click Phenotypes.
Displaying Bead Counts
To display the bead counts for a sample, click the down arrow next to Bead
in the sample header.
FOR RESEARCH USE ONLY
4-4
LC1115RUO.3(2/15)
Assignments, Displayed Values and Calculations
Bead Assignment
To determine the adjusted value for a bead, the individual bead MFI is
divided by the MFI for each Negative Control Bead (CON1, CON2, CON3).
From these quotients, the Background Adjustment Factor (BAF) for the
appropriate bead/CON combination is subtracted. The BAF is a pre-determined MFI ratio for each bead/CON combination to compensate for background noise due to bead variation. See the lot-specific Recording Sheet
provided with the kit for BAF values.
(Individual Bead MFI
÷
CON1 MFI) - BAF = Adjusted Ratio 1
(Individual Bead MFI
÷
CON2 MFI) - BAF = Adjusted Ratio 2
(Individual Bead MFI
÷
CON3 MFI) - BAF = Adjusted Ratio 3
•For I-01 and II-01, a positive value for any one of the calculations indicates a positive bead reaction.
•For all remaining beads, a positive value for any two of the calculations
indicates a positive bead reaction.
•A negative value for all three calculations indicates a negative bead
reaction.
•The Score shown in the Results Table is the number of above calculations that exceed the Assign Adjust value. By default, the Assign Adjust
values are set to zero. See “Preferences”
Class Assignment
•A sample is considered to be positive for class I HLA-specific antibodies
if at least one of the seven (7) class I HLA beads is positive.
•A sample is considered to be positive for class II HLA-specific antibodies if at least one of the five (5) class II HLA beads is positive.
•A sample is considered to be negative for HLA-specific IgG antibodies if
all the HLA beads are found to be negative.
Batch Failures
Bead Count Failure
•If a sample fails to meet the minimum bead count for a Class I or Class
II bead, the Class I or Class II result, respectively, will be reported as
Bead Failure. To override the failure, review the bead count and then
choose the appropriate assignment from the drop-down menu.
FOR RESEARCH USE ONLY
4-5
LC1115RUO.3(2/15)
•If a CON bead fails to meet the minimum bead count, the software will
report Bead Failure for both Class I and Class II.
Positive or Negative Control Failure (when using a liquid handler)
The software can be set so that the results for the entire batch are tied to
the performance of the Positive and Negative control when a liquid handler
is used. All samples will be listed as failed if either the Positive or Negative
Control samples fail.
•A Negative Control is considered as failed if any bead fails to meet the
minimum bead count, or if the Negative Control has a positive assignment for Class I or Class II.
•A Positive Control is considered as failed if any bead fails to meet the
minimum bead count, or if either of the Class I or Class II assignment is
negative.
•The source of the failure is listed in the LifeScreen Header. Bead failures will only be listed within the panel not in the header. The feature
that ties the performance of the batch to the performance of the negative and positive controls can be enabled or disabled in Lab Settings feature. See “Preferences”
Overriding an Assignment
While the software performs analysis according to the product insert, all
results should be reviewed. During this review process, an assignment can
be changed manually by clicking the arrow on the right side of the text box
and selecting one of the choices that appears.
Overriding Default Parameters
The default parameters (Assign Adjust and Assign Cutoff) should only be
altered by personnel knowledgeable in the field of HLA Antibody Analysis.
Changing these values will result in altered specificity and sensitivity of the
assay. See “Antibody Parameters: ”
FOR RESEARCH USE ONLY
4-6
LC1115RUO.3(2/15)
Optional VBAF Analysis
Applying VBAF to an Entire Batch
To apply the VBAF calculation to the entire batch, select View VBAF Calc
from the Options tab.
Applying VBAF to a Single Sample
To apply the VBAF calculation to a single sample, select the VBAF Calc
checkbox in the header of the individual samples.
Approving the Results of the Analysis
Saving, Completing, and Approving an Assignment
The Save Assignments button saves any assignment edits that have
been made. Changes can be made and re-saved.
The Complete button locks all the samples in the batch and signifies all
samples have been analyzed and are ready for sign-off. When a batch has
been completed and locked, only a Lab Technician or Lab Supervisor may
unlock the samples by clicking Complete again. Only a Lab Supervisor can
unlock a single sample by clicking the Locked box. Completing the results
lists the batch as Completed on the home page.
The Approve button signifies that analysis of the samples is finished.
Only a Lab Supervisor can approve or unapprove a batch. To unapprove,
click Approve again. Lab Supervisors can also unlock individual samples
by clicking the Locked box. Approving the results lists the batch as
Approved on the home page.
FOR RESEARCH USE ONLY
4-7
LC1115RUO.3(2/15)
Reports
Printing Standard Report
1) Once the results have been approved, a standard report may be run.
The report for the batch can be ordered by sample or well location.
2) The report is created by clicking the Generate LMX Report button.
3) Once a report appears on the screen, click the Print icon in the upper
toolbar.
Printing an Individual Sample Report or Audit Report
1) Select the sample ID in the Batch
Listing pane.
2) Right click the sample ID to access
the report options: Report LifeScreen
Sample or Sample Audit Report.
A
Sample Audit Report will only be generated if changes to the sample have been
made. If no changes then no report will
appear.
3) Once a report appears on the screen,
click the Print icon in the upper toolbar.
Batch Reporting
1) Go to the Home Antibody tab.
FOR RESEARCH USE ONLY
4-8
LC1115RUO.3(2/15)
2) Click the Antibody icon.
3) Click the magnifying glass to display a calendar.
4) Choose the date or
range of dates of when
the batch was imported.
5) Batches will display in
the Batch column. Double click the batch of
choice.
All samples
within the batch will display in the Sample column.
6) Use the arrows to
move the samples to
the Print (right) column
which will include them
in the batch report.
7) If individual reports of the samples moved to the Print (right) column
are preferred, choose the LMX/DSA tab under Reporting Options per
Test and check Single Sample per Report. There is then the option to
Include Pos/Neg Controls.
8) Select desired Printing Option: Send to Printer, Save to PDF, Save to
Excel, or Save to RTF. Multiple options may be chosen. If Save to PDF,
Save to Excel, or Save to RTF is chosen choose a Save File Path.
9) Click the Print icon. Either one report containing all chosen samples will
be generated or individual reports for each chosen sample will be generated.
10) If an Audit Report is desired, click Audit Report. This report is only
available in pdf format.
Exporting Reports
(PDF, HTML, MHT, RTF, Excel, CSV, txt, or Image File)
FOR RESEARCH USE ONLY
4-9
LC1115RUO.3(2/15)
1) Generate a report from the Reports tab in the LifeScreen Analysis tab.
2) Once a report appears on the screen, click the Export Report icon in
the upper right toolbar.
3) The dialog box that appears provides several different options for
exporting/saving the report.
Exporting Summary Results
Many Laboratory Information Systems require simple
export files that list only the samples and results. This
file can be generated directly from the Export button
on the homepage. See “Export Resul ts”
FOR RESEARCH USE ONLY
4-10
LC1115RUO.3(2/15)
C HAPTER 5: LIFECODES ID A NALYSIS
This chapter contains information on the tools available to analyze LIFECODES ID results (ID).
Importing ID Results into MATCH IT!
If an Automated Batch was not created and data needs to be manually
imported into the software, the appropriate EDS file must first be imported followed by the csv file.
Importing EDS files
Before importing ID data, the information necessary for analyzing the data generated by the
Luminex instrument must be imported. The
information is provided in lot-specific EDS files.
1) Click Lot Information Import found on the Home tab of MATCH IT!.
The Open dialog box will appear.
2) Navigate to the location, e.g., desktop, of the EDS file(s). Select all
appropriate files that need to be imported. Use Ctrl + left mouse button to
select more than one EDS file at one time.
3) Click Open. A message will appear when all lots have been successfully
imported.
Manually Importing CSV Files
1) Click Batch Import from the homepage.
This will open the Open dialog box
2) Navigate to the location of the CSV file(s). If
importing from the computer connected to the
Luminex, CSV files can be found in C:\My Batches\Output on IS 2.3 systems and at C:\ProgramData\Luminex\xPONENT31\Output on xPONENT
systems.
3) Select all CSV files to be imported. Use Ctrl + left mouse button to
select more than one CSV file at one time.
4) When the file is selected, the analysis is done automatically during the
import process. Once the csv file has been imported, it will appear on the
Antibody Home tab under ID.
Note: A CSV Import: Lot Import may appear after selecting a csv file.
This can be due to:1) the appropriate EDS file not being imported, 2) the
FOR RESEARCH USE ONLY
5-1
LC1115RUO.3(2/15)
EDS file not being available See “Lot Availability” , or 3) the lot number not
being indicated on the CSV file.
+
Opening a Batch
Direct Selection
1) Click the arrow to first expand the ID section.
2) Double click the batch name found on the Antibody Home tab under ID.
3) The batch name will display on a tab above the Sample Navigation ribbon. All sample results appear in the middle section of the tab. Individual
sample IDs within the selected panel are listed in the left section of the tab
under the batch name.
Date Range Selection
Rather than selecting an individual batch, a range of dates can be selected,
which will result in all batches run in that range being selected.
FOR RESEARCH USE ONLY
5-2
LC1115RUO.3(2/15)
1) Right click the antibody symbol as shown below.
2) A pair of calendars with a start and end date will open. Select the
desired range and click OK.
3) The batch results are displayed under the ID Analysis tab. All sample
results appear in the middle section of the tab. Individual sample IDs
within the selected panel are listed in the left section of the tab under the
batch name.
Viewing a Sample within a Batch
Navigating to a Particular Sample
To go to a particular sample in the batch, left click the sample ID in the
window. The software will open this sample.
Within the Batch List completed samples will be highlighted with bold text;
completed and approved samples will be bold and italicized.
FOR RESEARCH USE ONLY
5-3
LC1115RUO.3(2/15)
The upper arrows can also be used to move from sample to sample.
Tabs in the Analysis screen
Once a Sample is selected, the Standard Calculation tab will display thebead ranking grids. The user can select between Serology and Allelic phenotype displays by clicking on the tabs at the top of the grid. Both tabs
look similar and can be customized as described in the below sections. Tail
Analysis will only be available in the grid designated in Preferences. See
“Analysis Options:”
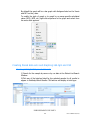
Column Customization
Columns can be customized to meet the user’s needs by right clicking a
column header. The customization will be saved for the user for future
data review.
FOR RESEARCH USE ONLY
5-4
LC1115RUO.3(2/15)
Changing Sort Order
The sample by default will display beads in descending order of Raw MFI.
This can be changed two different ways.
1) Right click a column header and choose Sort Ascending or Sort
Descending. The sort order will be saved when viewing future batches.
2) Left clicking a column header will also sort. Once the column is clicked,
a downward or upward triangle will appear showing the direction of order;
descending or ascending in value, respectively.
Column Removal/Addition and Column Width
1) To remove a column, right click the column and choose Remove This
Column.
2) To add a column that has been previously removed, right click the column and choose Column Chooser. The Column Customization window
will appear displaying the columns that have been removed. Right click the
column to add and choose Show This Column.
The Column Customization window also allows the user to drag and
drop columns into the window to customize the layout.
3) To change the width of a column, right click the column and choose Best
Fit or Best Fit (all columns). The columns will size according to the values
in the column and apply it to only that column or to all columns depending
on what is chosen.
Displaying Selected Bead Values
Specific beads containing particular information can be viewed.
1) Hover over a column. A small pin will appear in the
upper right corner of the chosen column.
2) Left click the pin. All values or text within that chosen
column will be listed.
3) Choose any one of the values or text items displayed.
When chosen, only the bead(s) that includes that value or
text within that column will display.
Note: All of the sub-windows and columns may be resized by placing
cursor on the line to be moved and dragging the mouse.
FOR RESEARCH USE ONLY
5-5
LC1115RUO.3(2/15)
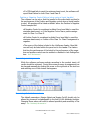
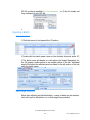
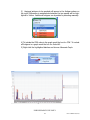
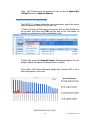
Graphical Display
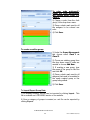
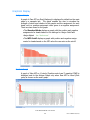
Antigen Graph
A graph of Raw MFI vs. Bead (Antigens) is displayed by default on the main
page in a separate tab. The graph enables the user to visualize the
strength of each bead relative to the sample and the assignment for each
bead; red is a positive assignment while green is a negative assignment.
There are two views for the graph:
•The Standard Mode displays a graph with the positive and negative
assignments for beads based on the settings for Assign Cutoff and
Assign Adjust. See “Preferences”
•The MFI Cutoff displays a graph with positive and negative assignments for beads based on the MFI value the user sets as the cutoff.
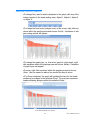
Control Graph
A graph of Raw MFI vs. Controls (Positive control and 3 negative CONS) is
displayed next to the Antigen Graph only when Raw MFI vs. Bead (Antigens) is chosen as the main graph.
FOR RESEARCH USE ONLY
5-6
LC1115RUO.3(2/15)
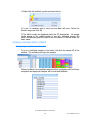
Additional Graphing Features
•To change the y-axis for what is displayed in the graph, click any of the
column headers in the bead ranking view; Adjust 1, Adjust 2, Adjust 3,
or Adjust C.
•To change the bead order (antigen order) of the x-axis, right click anywhere within the graphing area and choose Sort By. A selection of antigen sorting options will appear.
•To change the graph type, i.e. from a bar graph to a line graph, right
click anywhere within the graphing area and choose Gallery. A selection
of graph types will appear.
•To zoom, right click anywhere within the graphing area and choose
Zoom. Use the mouse to make a box around the area to zoom.
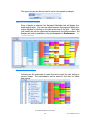
•If a Group is selected, the graph will highlight the bars for the beads
containing an antigen in the selected Group. The grey bars represent
beads containing antigens within the selected Group.
FOR RESEARCH USE ONLY
5-7
LC1115RUO.3(2/15)
•To overlay a particular sample; i.e. the negative control, onto each
sample graph, right select the sample of choice from the batch window
and right click to choose Set as Negative Control. Now when viewing
any of the sample graphs within the batch, the sample and the set negative control sample will display.
Note: The user may select different samples within the batch to be designated as the Negative Control. Once this option has been turned on for a
batch it cannot be turned off.
Calculations and Displayed Values
Calculations
To determine the adjusted value for a bead, divide the individual bead
median MFI by the MFI for each Negative Control Bead (CON1, CON2,
CON3). From these values, subtract the Background Adjustment Factor
(BAF) for the appropriate bead/CON combination. The BAF is a pre-determined MFI ratio for each bead/CON combination to compensate for background noise due to bead variation and can be found on the lot-specific
Recording Sheet provided with the kit.
(Individual Bead MFI
÷
CON1 MFI) - BAF = Adjusted Ratio 1
(Individual Bead MFI
÷
CON2 MFI) - BAF = Adjusted Ratio 2
(Individual Bead MFI
÷
CON3 MFI) - BAF = Adjusted Ratio 3
The Class I & II ID kits also employ a fourth negative control calculation,
“CalcCON”, based on performance of the non-reacting antigen-containing
beads.
(Individual Bead MFI
÷
CalcCON) - BAF = Adjusted Ratio 4
FOR RESEARCH USE ONLY
5-8
LC1115RUO.3(2/15)
CalcCON = MFI lowest ranked antigen bead + 20
•By default, a positive value for two or more of the four calculations indicates a positive bead reaction. This setting can be changed by the user.
See “Preferences”
For LIFECODES Class I ID:
The percent PRA (Panel Reactive Antibodies) is calculated by:
% PRA = (# of pos bead reactions
÷ # of beads in the assay) x 100
# of beads in the assay does not include control beads
For LIFECODES Class II IDv2:
% PRA = [(# of pos reacting DR-containing beads + # of neg reacting DR-containing beads
that also contain an assigned DQ antigen that is 100% pos in the enriched beads) ÷ Total #
of DR-containing beads] X 100
# of beads in the assay does not include control beads
Making a Positive or Negative Assignment
A bead is assigned as positive or negative based on user defined analysis
parameters or by manual MFI cutoffs.
By Standard Mode
If preferences have not already been set for these parameters or an override is necessary for a particular sample, they can be changed in the Reactivity Adjustments tab. See “Preferences”
•Assign Adjust sets the positive threshold for all adjusted values.
Once the value box is selected, the up and down arrows can be clicked
to the desired value or the up and down arrow keys may be used. A
value can also be typed directly into the white box. The default setting is
0.
•Assign Cutoff is a score of 1 to 4. It indicates the number of calculations, against different controls, that must be positive for the sample to
be assigned as positive. This allows the user to show samples positive
with only 1 out of 4 controls positive, 2 out of 4 controls positive, 3 out
of 4 controls positive, or all 4 controls positive. The default setting is 2.
FOR RESEARCH USE ONLY
5-9
LC1115RUO.3(2/15)
If the parameters are changed, the user must save the change prior to
manual tail analysis. To save the changes Click Save.
If AutoTail is checked then the tail is automatically calculated.
Note: If Eplets are assigned and reactivity adjustment changes are made
using Assign Adjust or Assign Cut-off, the Eplet assignment will clear.
To assign eplets using the new cut-offs, click Eplet Analysis.
By MFI Cutoff
Beads can be assigned as positive or negative by manually assigning an
MFI cutoff. There are three ways to assign an MFI cutoff.
1) Under the Reactivity and Adjustments tab, click the box next to Use MFI
Cut-off.
2) The MFI value box is now available. Select the value box. The up and
down arrows can be clicked to the desired value or the up and down arrow
keys may be used. A value can also be typed directly into the white box.
Once the value is entered, click the graph to view the new cutoff.
3) An alternative to step 2 is to right click anywhere on the graph and
choose Graph Edit. The Cut Off bar will then be visible and can be moved
to the desired value.
4) Click Save.
5) To apply an MFI cut-off to all samples for Class I or Class II, a user may
select MFI mode in the ID tab of Preferences window. MFI cut-offs can
be set individually for Class I and Class II The up and down arrow keys
may be used. A value can also be typed directly in the white box. The
user must then select the box that indicates that the value should be
applied to data upon import.
Note: If Eplets are assigned and reactivity adjustment changes are made
using MFI mode, Eplet assignments will clear. To assign eplets using the
new cut-offs, click Eplet Analysis.
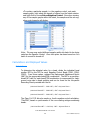
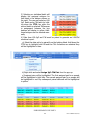
Batch Failures
Bead Count Failure
•If a sample fails to meet the minimum bead count for a particular
result, the bead will be flagged as FAILED. To override the failure, doule
click the message and select the failed beads to include in the analysis
FOR RESEARCH USE ONLY
5-10
LC1115RUO.3(2/15)
•If a CON bead fails to meet the minimum bead count, the software will
report all beads as failed. To override the failure, click the message.
•A message box will appear to confirm the override.
The source of all failures is listed in the ID Analysis header. By clicking the
FAILED message, the user has the option to include failed beads in the
analysis.
Note: If a sample has both CON failures AND bead failures, the CON failure must be overidden before the failed beads can be included.
Tools for Making an Assignment
Groupings
The Groups drop-down box is a list of user defined HLA Groups. By
selecting a particular group, the antigens present within the particular
FOR RESEARCH USE ONLY
5-11
LC1115RUO.3(2/15)
group will be highlighted in the bead ranking. See “Antibody Reactivi ty
Groups”
Color-Coded Antigen(s):
The user can color code antigens or groups of antigens to provide easier
viewing. This feature is intended as a visual aid. The .xml file provided on
the Immucor website contains color-coded antigens but they may be
changed.
Eplet Analysis
Added Epitope Analysis can be run at a sample level. If epitopes are not
calculated upon import click the Eplet Analysis button to assign available
epitopes. Eplets will be calculated based on Positive beads (Eplets are not
calculated on assigned antigens).
Note: Eplet Analysis feature will not work if Use Serology is checked in
Preferences. If the user un-checks Serology in Preferences after a
batch has imported, the batch must be closed and then re-opened for
those changes to take effect.
Tail Analysis
Note: Tail Analysis is by default a serology tail analysis. To change to a 4-digit tail
analysis See “Antibody Parameters:”
When Exclude Patient Type is turned ON on in the Reactivity Adjustment tabs (if not already selected under Preferences) excluded antigens
FOR RESEARCH USE ONLY
5-12
LC1115RUO.3(2/15)
will be listed under the Excluded Antigens window in IDTail and not
available for Tail Analysis
Automatic Tail
The software will assign a tail automatically if Perform Auto Tail Analysis is
chosen as a preference or if Do Auto Tail is checked in the Patient Information key. See “Tail Parameters (ID only): ” The tail will then be automatically
assigned when imported.
Manual Tail
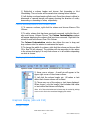
1) Tail preferences should first be set in the preference window.
Parameters (ID only): ”
See “Tail
2) Go to the Tail Adjustment/Groupings tab.
3) Click New.
The antigens listed are those that meet the Tail Parameters previously
set for a particular sample. See “Tai l Parameters (ID only): ” The following
statistics are displayed:
a) # of true positives(++)
b) # of false positives (+ -)
c) # of false negatives (- +)
d) # of true negatives (- -)
e) Chi²
f) R Value
g) % Positive
h) Strength Index (Avg. MFI of all beads containing the antigen)
FOR RESEARCH USE ONLY
5-13
LC1115RUO.3(2/15)
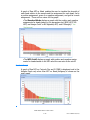
4) Sorting: The data can be sorted by any
of the headers in the ID Tail Window. Click
the desired header and the data will sort in
descending or ascending order. The default
ranking is descending by RVal. A sort order
change here does not impact the AutoTail
sorting or the function of the Next button.
Default sort order can only be changed in
Preferences. See “Tail Parameters (ID only): ”
5) Highlighting Groupings: A particular
group can be highlighted within the Available Tail Antigens by selecting the
appropriate group in the dropdown menu found in the Tail Adjustment/
Grouping tab. The antigen(s) included in the group that meet the Tail
Parameters set will be highlighted in gray under Remaining Antigens.
To bring the antigens within the selected group to the top of the Remaining Antigens, turn Sort by Group ON.
6) If Sample Antigens were not entered into the sample list, they can
still be excluded from the tail analysis.
FOR RESEARCH USE ONLY
5-14
LC1115RUO.3(2/15)
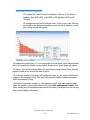
To add or exclude antigens to/from the tail, right Click an antigen within the grid
and choose Exclude Antigen X from Analysis.
7) To add an antigen to the tail, double click the antigen found in the
Remaining Antigens window or double click the antigen in the Bead Ranking grid. The antigen is added to the tail. The remaining antigens, not
included within the tail, are then re-calculated and listed for further selection.
8) The following Tail Actions can also be used when adding to the tail:
a) Next moves the top-ranking antigen into the tail.
b) Right click within the grid and choose Move Antigen X to Tail Antigens Grid
c) Move Group to Tail will move all antigens within the selected Group into the tail
d) Undo Tail will remove the most recent tail addition
e) Save will save any antigens placed into the tail analysis for the report
f) Reset returns the tail to the previously saved tail
g) New returns any antigens moved to the tail to the antigen list and allows the
user to start again.
9) Continue loading tail until complete or until all antigens desired are
added to the tail. Antigens will be bold and italicized in the bead ranking
screen.
FOR RESEARCH USE ONLY
5-15
LC1115RUO.3(2/15)
10) Click Save before moving to the next sample.
Creating a History
The user has the option of creating a Snapshot of the History for a particular sample. In the History tab, a user has the ability to load antigens to
create a reactivity group specific to the sample. This will enable a user to
monitor changes in antibody status across kits and over time.
New History
1) Go to the History tab.
2) Click New.
3) The previously assigned antigens (either automatically
or manually) will be checked and highlighted in the window which appears. Additional antigens may be added to
the history by checking the box next to the antigen (Note:
This will not change the saved tail results).
4) Click Save.
5) Confirm the decision to make a history snapshot of the
results and name the Antigen History Group.
Applying a Previously Created History to a New Sample
A previously created History can be viewed with a new sample.
1) Go to the History tab of the new sample.
FOR RESEARCH USE ONLY
5-16
LC1115RUO.3(2/15)
2) Click Find.
3) Type either the name of the Antigen History Group or a key component
of the name, i.e. first letter.
4) The history of the sample will display.
View Current Assigned History for a Sample
1) Go to the History tab of the new sample.
2) Select the History from the dropdown.
3) The Saved History Snapshot will be highlighted.
Approving the Results of the Analysis
Approving Results
When Save is clicked, the analysis for the sample is saved but can be analyzed again.
When Restore is clicked, the sample will revert to the most recently saved
data/assignments.
Once analysis is complete and no additional changes need to be made for a
particular sample, click Complete. Only a Lab Technician or Lab Supervisor may make changes to a sample by clicking Complete again. When all
samples in a batch have been designated as Complete, the batch status
will be listed as Completed on the home page and signify they are ready
for Approval.
Once the analysis of completed results has been reviewed, click
Approved. Once clicked, changes can no longer be made except by a Lab
Supervisor by clicking Approved again. When all samples within a batch
FOR RESEARCH USE ONLY
5-17
LC1115RUO.3(2/15)
are designated as Approved, the batch status
Approved on the home page.
will list the batch as
Reporting and Printing
After the sample has been analyzed, (automatically or by using the manual
tail analysis features) the user has the ability to customize a report.
Customizing a Final Report
1) Once the results have been Approved, go to Print Reports tab. Approving the results is not a requirement to print.
2) Click the drop down arrow next to Final Report and select the items to
include in the Final Report.
3) A graph can be included in the report as well by checking the box next
to Include Graph. Graph Value (y-axis) and Graph Sort (x-axis) may also
be customized by clicking the drop down arrow and selecting the appropriate choice.
FOR RESEARCH USE ONLY
5-18
LC1115RUO.3(2/15)
3) Once a report appears on the screen, click the Print icon in the upper
toolbar.
Quick Print
Either a Bead Ranking report or Graph can be printed by clicking Quick
Print.
The Bead Ranking Report is sorted as it is sorted in the grid. All antigens associated with each bead will be listed, as well as whether the bead
was assigned as Positive or Negative.
Batch Reporting
1) Go to the Home Antibody tab.
2) Click the Antibody icon.
3) Click the magnifying glass to display a calendar.
FOR RESEARCH USE ONLY
5-19
LC1115RUO.3(2/15)
4) Choose the date or
range of dates of when
the
batch
was
imported.
5) Batches will display
in the Batch column.
Double click the batch
of choice. All samples
within the batch will
display in the Sample
colunmn.
6) Use the arrows to
move the samples to
the Print (right) column which will include
them in the batch
reporting.
7) Once all desired
samples have been
moved to the Print
(right) column, choose the ID tab under Reporting Options. Choose the
items to include in the report.
8) Select desired Printing Option: Send to Printer, Save to PDF, Save to
Excel, or Save to RTF. Multiple options may be chosen. If Save to PDF,
Save to Excel, or Save to RTF is chosen choose a Save File Path.
9) Click the Print icon. A dialogue box will appear stating that reports have
been generated. Click OK to continue.
10) If an Audit Report is desired, click Audit Report. This report can only
be generated in pdf format.
Exporting Reports
1) Generate a report from the Print Reports tab in the ID Analysis tab.
2) Once a report appears on the screen, click the Export Report icon in
the upper right toolbar.
3) The dialog box that appears provides several different options for
exporting/saving the report.
FOR RESEARCH USE ONLY
5-20
LC1115RUO.3(2/15)
Exporting Summary Results
Many Laboratory Information Systems require simple export files that list
only the samples and results. This file can be generated directly from the
Export tab. See “Export Results” .
FOR RESEARCH USE ONLY
5-21
LC1115RUO.3(2/15)
C HAPTER 6: LIFECODES S INGLE A NTIGEN
A NALYSIS
This chapter contains information on the tools available to analyze LIFECODES Single Antigen Class I and II, C3d, and LIFECODES Single Antigen-MIC
(LSA).
Importing Single Antigen Results into MATCH IT!
If an Automated Batch was not created and data needs to be manually
imported into the software, the appropriate EDS file must first be imported followed by the csv file.
Importing EDS files
Before importing LSA data, the information necessary for analyzing the data generated by the
Luminex instrument must be imported. The
information is provided in lot-specific EDS files.
1) Click Lot Information Import found on the Home tab of MATCH IT!.
The Open dialog box will appear.
2) Navigate to the location, e.g., desktop, of the EDS file(s). Select all
appropriate files that need to be imported. Use Ctrl + left mouse button to
select more than one EDS file at one time.
3) Click Open. A message will appear when all lots have been successfully
imported.
Manually Importing CSV Files
1) Click Batch Import from the homepage.
This will open the Open dialog box
2) Navigate to the location of the CSV file(s). If
importing from the computer connected to the
Luminex, CSV files can be found in C:\My Batches\Output on IS 2.3 systems and at C:\ProgramData\Luminex\xPONENT31\Output on xPONENT
systems.
3) Select all CSV files to be imported. Use Ctrl + left mouse button to select
more than one CSV file at one time.
4) When the file is selected, the analysis is done automatically during the
import process. Once the csv file has been imported, it will appear on the
Antibody Home tab under Single Antigen.
FOR RESEARCH USE ONLY
6-1
LC1115RUO.3(2/15)
Note: A CSV Import: Lot Import may appear after selecting a csv file.
This can be due to:1) the appropriate EDS file not being imported, 2) the
EDS file not being available See “Lot Availability” , or 3) the lot number not
being indicated on the CSV file.
Opening a Batch
Direct Selection
1) Click the arrow to first expand the Single Antigen section.
2) Double click the batch name found on the Antibody Home tab under
Single Antigen.
Note: C3d batches will display in Bold type on the home screen
3) The batch name will display on a tab above the Sample Navigation ribbon. All sample results appear in the middle section of the tab. Individual
sample IDs within the selected panel are listed in the left section of the tab
under the batch name.
FOR RESEARCH USE ONLY
6-2
LC1115RUO.3(2/15)
Date Range Selection
Rather than selecting an individual batch, a range of dates can be selected,
which will result in all batches run in that range being selected.
1) Right click the antibody symbol as shown below.
2) A pair of calendars with a start and end date will open. Select the
desired range and click OK.
3) The batch results are displayed in an LSA Analysis tab. All sample
results appear in the middle section of the tab. Individual sample IDs
within the selected panel are listed in the left section of the tab under the
batch name.
Viewing a Sample within a Batch
Navigating to a Particular Sample
•To go to a particular sample in the batch, left click the sample ID in the
left hand pane. The software will open this sample.
FOR RESEARCH USE ONLY
6-3
LC1115RUO.3(2/15)
•Within the Batch List completed samples will be highlighted with bold
text; completed and approved samples will be bold and italicized
•The upper arrows can also be used to move from sample to sample.
Overall Antibody Assignments
Automatic Assignments
The software will automatically assign antibody specificities for antigens
that are 100% positive. The automatic assignments will appear in the Single Antigen Results window.
Calculations and Displayed Values
Calculations for LSA
To determine the adjusted value for a bead, first subtract the Background
MFI from the RAW MFI to generate the BCM (Background Corrected MFI
Value) for each individual bead. The Background MFI is the background
noise due to bead variation and can be found on the lot-specific Recording
Sheet provided with the kit.
Divide the BCM by the MFI of the Calculated Control (CalcCON) of its
respective locus to generate the BCR (Background Corrected Ratio). The
CalcCON for each locus is the Raw MFI value of the lowest ranked antigen
bead for that locus.
BCM
÷
CalcCON MFI for locus 1= BCR for antigen ’x’ from locus 1
BCM
÷
CalcCON MFI for locus 2= BCR for antigen ’y’ from locus 2
BCM
÷
CalcCON MFI for locus 3= BCR for antigen ’z’ from locus 3
FOR RESEARCH USE ONLY
6-4
LC1115RUO.3(2/15)
To generate the AD-BCR (Antigen Density Background Corrected Ratio),
normalize BCR by dividing this number by the relative amount of antigen
on each bead as found in the lot-specific Recording Sheet.
Refer to the lot-specific Recording Sheet provided with the kit for the list of
the antigens present on each bead and the suggested cutoff for estimating
the positive/negative result. The bead is considered positive if two or
more of the adjusted values are above the cutoff values. Higher or lower
sensitivities can be obtained by adjusting the cutoff.
Note: For LSA MIC, there is only one CalcCON which is defined as the Raw MFI
value of the lowest ranked antigen bead.
Calculations for C3d
The Negative Control Sample (NC) Raw MFI serves as the Background MFI
for C3d calculations
To determine the adjusted value for a bead, subtract the Negative Control
sample MFI from the RAW MFI to generate the BG Adjusted (Background
Adjusted MFI Value) for each individual bead.
Individual Bead MFI - MFI of NC bead = BG Adjusted
Divide the BG Adjusted by the MFI of the Calculated Control (CalcCON) of
its respective locus to generate the BCR (Background Corrected Ratio).
The CalcCON for each locus is the Raw MFI value of the lowest ranked
antigen bead for that locus.
BG Adjusted
÷
CalcCON MFI for locus 1= BCR for antigen ’x’ from locus 1
BG Adjusted
÷
CalcCON MFI for locus 2= BCR for antigen ’y’ from locus 2
BG Adjusted
÷
CalcCON MFI for locus 3= BCR for antigen ’z’ from locus 3
To calculate the relative strength (R Strength) of an antigen, divide the BG
Adjusted values of the individual bead by the corresponding MFI value of
the bead in the LSA Negative Control (NC) serum
R Strength = BG Adjusted MFI of Antigen
÷
Raw Value MFI of Antigen in NC
Higher or lower sensitivities can be obtained by adjusting the cutoff.
Making a Positive or Negative Assignment
A bead is assigned as positive or negative based on user defined analysis
parameters or by MFI cutoffs. Weak assignments are made based on preset values that are lot specific.
FOR RESEARCH USE ONLY
6-5
LC1115RUO.3(2/15)
By Standard Mode (LSA and C3d)
If preferences have not already been set for these parameters or an override is necessary for a particular sample, they can be changed in the Reactivity Adjustments tab. See “Preferences”
•Adjustment Values for LSA and C3d (BCM, BCR, and AD-BCR or
BG Adjusted, BCR, and R Strength) set the positive threshold for
BCM, BCR, and AD-BCR (LSA) or BG Adjusted, BCR, and R Strength
(C3d). Once the value box is selected, the up and down arrows can be
clicked to the desired value or a value can also be typed directly into the
white box. The default settings are lot-specific and part of the EDS file
used for analysis.
•Assign Cutoff (LSA and C3d) is a score of 1 to 3. It indicates the
number of calculations, i.e. BCM, BCR, and AD-BCR or BG Adjusted,
BCR, and R Strength that must be positive for the sample to be assigned
as positive. This allows the user to show samples positive with only 1
out of 3 adjustment values positive, 2 out of 3 adjustment values positive, or 3 out of 3 adjustments values. The default setting is 2.
By MFI Cutoff (LSA and C3d)
Beads can be assigned as positive or negative by assigning an MFI cutoff.
There are three ways to assign an MFI cutoff.
1) Under the Reactivity and Adjustments tab, click the box next to Use MFI
Cutoff.
2) The MFI Cutoff value box is now available. Select the value box. The up
and down arrows can be clicked to the desired value or the up and down
arrow keys may be used. A value can also be typed directly into the white
box. Once the value is entered, click the graph to view the new cutoff.
FOR RESEARCH USE ONLY
6-6
LC1115RUO.3(2/15)
3) An alternative to step 2 is to right click anywhere on the graph and
choose Graph Edit. The Cut Off bar will then be visible and can be moved
to the desired value. Once the cut-off has been set, click Save
4) To apply an MFI cut-off to all samples for Class I or Class II, a user may
select MFI mode in the LSA or C3d tab of Preferences window. MFI
cut-offs can be set individually for Class I and Class II and MICA. The up
and down arrow keys may be used. A value can also be typed directly in
the white box. The user must then indicate that the value should be
applied to data upon import.
Move/Remove/Exclude Antigens to/from the Assignment (LSA and C3d)
•The user may right click
an antigen within the
assignment grid and
choose to Move or
Remove Antigens from
Antibody Assignments.
•If Sample Antigens were entered into the sample list, they will be
displayed in the Sample Information tab.
When Exclude HLA Type is turned ON in the Reactivity Adjustments tab (if not
already selected under Preferences) excluded antigens will be listed under the
Groupings tab.
FOR RESEARCH USE ONLY
6-7
LC1115RUO.3(2/15)
•To change the assignment of all Weak beads to Positive and have all
such Antigens listed in Antibody Assignments, check Include Weak in
the Single Antigen Results window
•To change the assignment of all Weak beads to Negative, check
Exclude Weak in the Single Antigen Results window.
Note: Once Include Weak or Exclude Weak is used no changes to the Antibody Assignments can be made
Note: Weak antigens are only assigned for LSA
Tools for Making an Assignment (LSA and C3d)
Groupings
The Groups drop-down box is a list of user defined HLA Groups. By selecting a particular group, the antigens present within the particular group will
be highlighted. See “Antibody Reactivity Groups”
Color-Coded Antigen(s):
The user can color-code antigens or groups of antigens to provide easier
viewing. This feature is intended as a visual aid.
Eplet Analysis
Added Eplet Analysis can be run at a sample level. If epitopes are not calculated upon import click the Eplet Analysis button to assign available epitopes.
FOR RESEARCH USE ONLY
6-8
LC1115RUO.3(2/15)
Eplets can also calculated in the Eplet Analysis tab located at the bottom
of the analysis screen.
In the Eplet Analysis Tab, the user can refine the list of Eplets displayed by
excluding Antigens based on BCM, BCR, AD-BCR, or MFI values.
Antigens excluded by these parameters will be listed in the Excluded
Antigens window.
FOR RESEARCH USE ONLY
6-9
LC1115RUO.3(2/15)
Antigens that are known or predictive Negatives can be selected from the
Negative drop-down. These Antigens will be removed from the grid and
will be added to the Excluded Antigen(s) list.
Antigens that are known or predictive Positives can be selected from the
Positive drop-down list. When an Antigen is assigned as Positive, it will
change to bold text and the associated Eplet will be highlighted in the grid.
The user can use the Undo and Reset buttons at any time during analysis.
When Analysis is complete the results can be exported to an Excel worksheet
using the Export to Excel button.
FOR RESEARCH USE ONLY
6-10
LC1115RUO.3(2/15)
Creating a History (LSA and C3d)
In the History tab, a user has the ability to load antigens to create a reactivity group specific to the sample. This will enable a user to create a
"snap-shot" for a particular sample and monitor changes in antibody status for a patient across kits and over time.
1) Go to the History tab.
2) Click New.
3) The previously assigned antigens (either automatically or
manually) will be checked and highlighted in the window
which appears. Additional antigens may be added to the
history by checking the box next to the antigen (Note: This will
not change the saved assignments).
4) Click Save.
5) Confirm the decision to make a history snapshot of the
results and name the Antigen History Group.
Applying a Previously Created History to a New Sample
A previously created History can be viewed with a new sample.
1) Go to the History tab of the new sample.
2) Click Find.
3) Type either the name of the Antigen History Group or a key component
of the name, i.e. first letter.
4) The history of the sample will display.
FOR RESEARCH USE ONLY
6-11
LC1115RUO.3(2/15)
View Current Assigned History for a Sample
1) Go to the History tab of the new sample.
2) Select the History from the drop-down.
3) The Saved History Snapshot will be highlighted.
Delete History
1) Go to the History tab of the sample.
2) Select a History from the dropdown or use Find to search for a History.
3) The History Snapshot will be loaded.
4) Click Delete, then confirm deletion.
Column Customization (LSA and C3d)
Columns located in any of the Calculation tabs can be customized to meet
the user’s needs.
Changing Sort Order
For LSA, samples will display beads in descending order of AD-BCR by
default. For C3d samples will display beads. This can be changed two different ways:
FOR RESEARCH USE ONLY
6-12
LC1115RUO.3(2/15)
1) Right-click a column header and choose Sort Ascending or Sort
Descending. The sort order will be saved when viewing future batches.
2) Left clicking a column header will also sort. Once the column is clicked, a
downward or upward triangle will appear showing the direction of order;
descending or ascending in value, respectively.
Column Removal/Addition and Column Width
1) To remove a column, right click the column and choose Remove This
Column.
2) To add a column that has been previously removed, right click the column and choose Column Chooser. The Column Customization window
will appear displaying the columns that have been removed. Right click the
column to add and choose Show This Column.
The Column Customization window also allows the user to drag and
drop columns into the window to customize the layout.
3) To change the width of a column, right click the column and choose Best
Fit or Best Fit (all columns). The columns will size according to the values
in the column and apply it to only that column or to all columns depending
on what is chosen.
Displaying Selected Bead Values
Specific beads containing particular information can be viewed.
1) Hover over a column. A small pin will appear in the
upper right corner of the chosen column.
2) Left click the column header pin. All values or text
within that chosen column will be listed.
3) Choose any one of the values or text items displayed.
When chosen, only the bead(s) that includes that value
or text within that column will display.
Note: All of the sub-windows and columns may be resized by placing
cursor on the line to be moved and dragging the mouse.
Graphical Display (LSA and C3d)
Antigen Graph
FOR RESEARCH USE ONLY
6-13
LC1115RUO.3(2/15)
A graph of Raw MFI vs. Bead enables the user to visualize the strength of
each bead relative to the sample and the assignment for each bead; red is
a positive assignment, green is a negative assignment, and gold is a weak
assignment. There are two views for the graph:
•The Standard Mode displays a graph with the positive and negative
assignments for beads based on the parameters set (BCM, BCR, AD-
BCR, and Assign Cutoff or BG Adjusted, BCR, and R Strength). See
“Preferences”
•The MFI Cutoff displays a graph with positive and negative assignments for beads based on the MFI value the user sets as the cutoff.
Control Graph
A graph of Raw MFI vs. Controls (Pos and 3 CONS) is displayed next to the
Antigen Graph only when Raw MFI vs. Bead (Antigens) is chosen as the
main graph.
FOR RESEARCH USE ONLY
6-14
LC1115RUO.3(2/15)
Additional Graphing Features
•To change the y-axis for what is displayed, click any of the column
headers; Raw, BCM, BCR, or AD-BCR or BG Adjusted, BCR, and R
Strength
•To change the bead order (antigen order) of the x-axis, right click anywhere within the graphing area and choose Sort By. A selection of antigen sorting options will appear.
•To change the graph type, i.e. from a bar graph to a line graph, right click anywhere
within the graphing area and choose Gallery. A selection of graph types will appear.
•To zoom, right click anywhere within the graphing area and choose Zoom. Use the
mouse to make a box around the area to zoom.
•If a Group is selected, the graph will highlight the bars for the beads containing an
antigen in the selected Group. The gray bars represent beads containing antigens
within the selected Group.
•To overlay a particular sample; i.e. the negative control, onto each sample graph,
select the sample of choice and right click to choose Set as Negative Control. Now
when viewing any of the sample graphs within the batch, the sample and the set negative control sample will display.
FOR RESEARCH USE ONLY
6-15
LC1115RUO.3(2/15)
Note: The user may select one of the samples within the batch to be designated as the Negative Control. Once this option has been turned on for a
batch it cannot be turned off. This feature is NOT available for C3d.
Note: When making reactivity adjustment changes to a sample with
Weak antigens, Weak Antigens will remain Weak. To change a Weak
assignment to Positive, MFI mode must be used.
Note: If Eplets are assigned and changes are made to Reactivity Adjustments then Eplet assignments will clear. To assign Eplets using the new
cut-offs, click Eplet Analysis.
Batch Failures (LSA and C3d)
Bead Count Failure
The source of all failures is listed in the Single Antigen Analysis header. By
clicking the FAILED message, the user has the option to included failed
beads in the analysis.
• If a CON bead fails to meet the minimum bead count, the software
will report all beads as failed. To override the failure, click the message.
A message box will appear to confirm the override.
•
•
FOR RESEARCH USE ONLY
6-16
LC1115RUO.3(2/15)
•If a sample fails to meet the minimum bead count for a particular
result, the bead will be flagged as FAILED. To override the failure, double click the message and select the failed beads to include in the analysis.
Note: If a sample has both CON failures AND bead failures, the CON failure must be overidden before the failed beads can be included.
Approving the Results of the Analysis
Saving Results
When Save is clicked, the analysis for the sample is saved but can be analyzed again.
When Restore is clicked, the sample will revert to the most recently saved
data/assignments.
Once analysis is complete and no additional changes need to be made for a
particular sample, click Completed. Only a Technician or Lab Supervisor
may make changes to a sample by clicking Completed again. Once all
samples in a batch have been completed, the batch will be listed as Completed on the home page and signify they are ready for sign-off.
FOR RESEARCH USE ONLY
6-17
LC1115RUO.3(2/15)
Once the analysis of completed results has been reviewed, click
Approved. Once clicked, changes can no longer be made except by a Lab
Supervisor by clicking Approved again. Approving results will list the
batch as Approved on the home page.
Reporting and Printing
After the sample has been analyzed, (automatically or manually) the user
has the ability to customize a report.
Customizing a Final Report
1) Once the results for a sample have been Approved, go to Print Reports
tab.
2) Click the drop down arrow next to Final Report and select the items to
include in the Final Report.
3) A graph can be included in the report as well by checking the box next
to Include Graph. Graph Value (y-axis) and Graph Sort (x-axis) may also be
customized by clicking the drop down arrow and selecting the appropriate
choice.
3) Once a report appears on the screen, click the Print icon in the upper
toolbar.
FOR RESEARCH USE ONLY
6-18
LC1115RUO.3(2/15)
Quick Print
Either a Bead Ranking report or Graph can be printed by clicking Quick
Print.
The Bead Ranking Report is sorted as it is sorted in the grid. All antigens associated with each bead will be listed, as well as whether the bead
was assigned as Positive or Negative.
Batch Reporting
1) Go to the Home Antibody Tab.
2) Click the Antibody icon.
3) Click the magnifying glass to display a calendar.
4) Choose the date
or range of dates of
when the batch was
imported.
5) Batches will display in the Batch column. Double click
the batch of choice.
All samples within
the batch will display in the Sample
column.
6) Use the arrows to
move the samples to
the Print (right) column
which
will
include them in the
batch reporting.
7) Once all desired
samples have been
FOR RESEARCH USE ONLY
6-19
LC1115RUO.3(2/15)
moved to the Print (right) column, choose the LSA tab in the Reporting
Options. Choose the items to include in the report.
8) Select desired Printing Option: Send to Printer, Save to PDF, Save to
Excel, or Save to RTF. Multiple options may be chosen. If Save to PDF,
Save to Excel, or Save to RTF is chosen choose a Save File Path.
9) Click the Print icon. A dialogue box will appear stating that reports have
been generated. Click OK to continue.
10) If an Audit Report is desired, click Audit Report. This report can only
be generated in pdf format.
Exporting Reports
(PDF, HTML, MHT, RTF, Excel, CSV, txt, or Image File)
1) Generate a report from the Print Reports tab in the LSA Analysis tab.
2) Once a report appears on the screen, click the Export Report icon in
the upper right toolbar.
3) The dialog box that appears provides several different options for
exporting/saving the report.
FOR RESEARCH USE ONLY
6-20
LC1115RUO.3(2/15)
Exporting Summary Results
Many Laboratory Information Systems require simple export files that list
only the samples and results. This file can be generated directly from the
Export tab. See “Export Results” .
FOR RESEARCH USE ONLY
6-21
LC1115RUO.3(2/15)
C HAPTER 7: DSA A NALYSIS
This chapter contains information on the tools available to analyze LIFECODES Donor Specific Antigen results (DSA).
Importing DSA Results into MATCH IT!
If an Automated Batch was not created and data needs to be manually
imported into the software, the appropriate EDS file must first be imported followed by the csv file.
Importing EDS files
Before importing DSA data, the information
necessary for analyzing the data generated by
the Luminex instrument must be imported. The
information is provided in lot-specific EDS files.
1) Click Lot Information Import found on the Home tab of MATCH IT!.
The Open dialog box will appear.
2) Navigate to the location, e.g., desktop, of the EDS file(s). Select all
appropriate files that need to be imported. Use Ctrl + left mouse button to
select more than one EDS file at one time.
3) Click Open. A message will appear when all lots have been successfully
imported.
Manually Importing CSV Files
1) Click Batch Import from the homepage.
This will open the Open dialog box
2) Navigate to the location of the CSV file(s).
If importing from the computer connected to
the Luminex, CSV files can be found in C:\My Batches\Outputon IS 2.3 systems and at C:\ProgramData\Luminex\xPONENT31\Output on xPONENT
systems.
3) Select all CSV files to be imported. Use Ctrl + left mouse button to
select more than one CSV file at one time.
4) When the file is selected, the analysis is done automatically during the
import process. Once the csv file has been imported, it will appear on the
Antibody Home tab under DSA.
Note: A CSV Import: Lot Import may appear after selecting a csv file.
This can be due to:1) the appropriate EDS file not being imported, 2) the
FOR RESEARCH USE ONLY
7-1
LC1115RUO.3(2/15)
EDS file not being available See “Lot Availability” , or 3) the lot number not
being indicated on the CSV file.
Opening a Batch
Direct Selection
1) Click the arrow to first expand the DSA section.
2) Double click the batch name found on the Antibody Home tab under
DSA.
3) The batch results are displayed in a tab above the sample navigation
ribbon. All sample results appear in the middle section of the tab. Individual sample IDs within the selected panel are listed in the left section of the
tab under the batch name.
Date Range Selection
Rather than selecting an individual batch, a range of dates can be selected,
which will result in all batches run in that range being selected.
1) Right click the antibody symbol as shown below.
FOR RESEARCH USE ONLY
7-2
LC1115RUO.3(2/15)
2) A pair of calendars with a start and end date will open. Select the
desired range and click OK.
3) The batch results are displayed in a tab above the sample navigation
ribbon. All sample results appear in the middle section of the tab. Individual sample IDs within the selected panel are listed in the left section of the
tab under the batch name.
Viewing and Changing the Results of a Batch
Scrolling through a Batch
If all of the data for the batch does not appear on the screen, the scroll bar
can be used to move among the different samples.
Navigating to a Particular Sample
To go to a particular sample in the batch, left click the sample name in the
left hand pane. The software will jump to this sample and it will be highlighted in red.
FOR RESEARCH USE ONLY
7-3
LC1115RUO.3(2/15)
Changing the Sort Order
The samples within a batch are loaded in order of their location in the
batch. By selecting the Sort tab located in the upper right, the results can
be ordered by Sample ID, Well Location (default), CON1, CON2, CON3, Pos
ctrl, or Lys Ctrl Bead.
Displaying Bead Counts
To display the bead counts for a sample, click the down arrow next to Bead
in the sample header.
Assignments, Displayed Values and Calculations
Bead Assignment
To determine the adjusted values for a capture bead, the MFI value of each
capture bead is compared to three cutoff values (background adjustment
factors; BAFs). The three cutoff values are calculated from the background
measured on the three CON beads in each test well. Each CON bead has
an equation for calculating the cutoff value for the Class I HLA capture
bead and a separate equation for calculating the cutoff value for the Class
II HLA capture bead. The two equations for each CON bead are lot-specific
and can be found on the Recording Sheet. The cutoff value calculated for a
CON bead is subtracted from the MFI value of the capture bead. The process is repeated for each of the remaining two CON beads to obtain three
results (Adjusted MFI Values).
Example: Class I HLA BAF for CON1 = 49.465(CON1) 0.5312
Class I HLA BAF for CON2 = 34.622(CON2) 0.5673
Class I HLA BAF for CON3 = 29.615(CON3) 0.6532
FOR RESEARCH USE ONLY
7-4
LC1115RUO.3(2/15)
Example: Class I HLA Capture Bead MFI - (BAF for CON1) = Adjusted MFI 1
Class I HLA Capture Bead MFI - (BAF for CON2) = Adjusted MFI 2
Class I HLA Capture Bead MFI - (BAF for CON3) = Adjusted MFI 3
Class Assignment
•A sample is considered positive for donor specific antibodies if two or
more adjusted MFI values are positive.
•A sample is considered negative for donor specific antibodies if two or
more adjusted MFI values are negative. See “Preferences”
Batch Failures
Bead Count Failure
•If a sample fails to meet the minimum bead count for a Class I or Class
II bead, the Class I or Class II result, respectively, will be reported as
bead failure. To override the failure, review the bead count and then
choose the appropriate assignment from the drop-down menu.
•If a CON bead fails to meet the minimum bead count, the software will
report bead failure for both Class I and Class II.
Positive or Negative Control Failure
•A Negative Control is considered as failed if any bead fails to meet the
minimum bead count, or if the Negative Control has a positive assignment for Class I or Class II.
•A Positive Control is considered as failed if any bead fails to meet the
minimum bead count, or if either of the Class I or Class II assignment is
negative.
The source of the failure is listed in the DSA Header.
Overriding an Assignment
While the software performs analysis according to the product insert, all
results should be reviewed. During this review process, an assignment can
FOR RESEARCH USE ONLY
7-5
LC1115RUO.3(2/15)
be changed manually by clicking the arrow on the right side of the text box
and selecting one of the choices that appears.
Overriding Default Parameters
The default parameters (Assign Adjust and Assign Cutoff) should only be
altered by personnel knowledgeable in the field of HLA Antibody Analysis.
Changing these values will result in altered specificity and sensitivity of the
assay. See also for details on changing parameters.
Approving the Results of the Analysis
Saving, Completing, and Approving an Assignment
The Save Assignments button saves any assignment edits that have
been made. Changes can be made and re-saved.
The Complete button locks all the samples in the batch and signifies all
samples have been analyzed and are ready for sign off. When a batch has
been completed and locked, only a Lab Technician or Lab Supervisor may
unlock the samples by clicking Complete again. Completing the results
lists the batch as Completed on the home page.
The Approve button signified the samples are finished. When a batch has
been approved, only a Lab Supervisor may unapprove the samples by clicking Approve again. Approving the results lists the batch as Approved on
the home page.
FOR RESEARCH USE ONLY
7-6
LC1115RUO.3(2/15)
Reports
Printing Standard Report
1) Once the results have been accepted, a report can be generated. The
report for the batch can be ordered by sample or well location.
2) The report is created by pressing the Generate DSA Report button.
3) Once a report appears on the screen, click the Print icon in the upper
toolbar.
Printing an Individual Sample Report or Audit Report
1) Select the sample ID in the Batch
Listing pane.
2) Right click the sample ID to access
the report options: Report Sample or
Sample Audit Report. A Sample Audit
Report will only be generated if changes
to the sample have been made. If no
changes then no report will appear.
3) Once a report appears on the screen,
click the Print icon in the upper toolbar.
Batch Reporting
1) Go to the Home Antibody tab.
2) Click the Antibody icon.
FOR RESEARCH USE ONLY
7-7
LC1115RUO.3(2/15)
3) Click the magnifying glass to display a calendar.
4) Choose the date or
range of dates of when
the
batch
was
imported.
5) Batches will display
in the Batch column.
Double click the batch
of choice. All samples
within the batch will
display in the Sample
colunmn.
6) Use the arrows to
move the samples to
the Print (right) column which will include
them in the batch
report.
7) If individual reports
of the samples moved to the Print (right) column are preferred, choose the
LifeScreen/DSA tab under Reporting Options and check Single Sample
per Report. There is then the option to Include Pos/Neg Controls.
8) Select desired Reporting Option: Send to Printer, Save to PDF, Save
to Excel, or Save to RTF. Multiple options may be chosen. If Save to PDF,
Save to Excel, or Save to RTF is chosen, choose a Save File Path.
9) Click the Print icon. Either one report containing all chosen samples will
be generated or individual reports for each chosen sample will be generated.
10) If an Audit Report is desired, click Audit Report. This report can only
be in pdf format.
Exporting Reports
(PDF, HTML, MHT, RTF, Excel, CSV, txt, or Image File)
1) Generate a report from the Reports tab in the DSA Analysis tab.
2) Once a report appears on the screen, click the Export Report icon in
the upper right toolbar.
FOR RESEARCH USE ONLY
7-8
LC1115RUO.3(2/15)
3) The dialog box that appears provides several different options for
exporting/saving the report..
Exporting Summary Results
Many Laboratory Information Systems require simple export files that list
only the samples and results. This file can be generated directly from the
Export tab. See “Export Results” .
FOR RESEARCH USE ONLY
7-9
LC1115RUO.3(2/15)
C HAPTER 8: D ATABASE MANAGEMENT
This chapter provides information regarding managing databases; including
creating, deleting, backing up and storing databases.
To open the database management window you must first click on the Start
button located at the lower left of the computer screen.
1) Go to All Programs and then
select Lifecodes.
2) Select Database Management .
3) Select Antibody from the Application dropdown.
4) Sign in using the same Login
and Password that are used to
access the Matchit! Antibody analysis software (Login: supervisor, Password: lifecodes) and click Login.
5) The Database Management window will open.
Creating a New Database
To create a new database, select New Database. A prompt for a name
will appear. A database name must start with a letter. Once named, click
Ok.
Deleting a Database
FOR RESEARCH USE ONLY
8-1
LC1115RUO.3(2/15)
To delete a database, highlight the database to be deleted and select
Delete Database. A prompt will appear asking if the database should be
deleted. Select Yes to delete the database. Once a database is deleted, it
cannot be retrieved and all data is lost.
If the current database in use needs to be deleted, the user must connect
to another database by highlighting and clicking Connect or create a new
database and connect to it. Once a new connection has been established,
the former database in use can be deleted.
Attaching a Database
To attach a database, select Attach Database. A dialog box will appear
where the user selects the database to be attached. This feature is only
available on the PC housing the database.
Detaching a Database
Detaching a database removes it from the server list, but does not delete
the database. It can be attached later if needed. To detach a database,
highlight the database and select Detach Database. The database that
is currently in use cannot be detached. This feature is only available on the
PC housing the database.
Backing Up a Database
To backup a database, select Backup Database. Next, navigate to the
location where the backup is to be kept.
If the software is running on Windows 7, Backup files should be stored at
C:\ProgramData\Lifecodes\Backup.
If the software is running on Windows XP Backup files should be stored at
C:\Documents and Settings\All Users\Application Data\Lifecodes\Backup.
Restoring a Database
To restore a database, select Restore Database. Next, select the location where the backup to be restored is kept.
If the software is running on Windows 7, Backup files should be stored at
C:\ProgramData\Lifecodes\Backup.
If the software is running on Windows XP Backup files should be stored at
C:\Documents and Settings\All Users\Application Data\Lifecodes\Backup.
FOR RESEARCH USE ONLY
8-2
LC1115RUO.3(2/15)
This feature is only available on the PC housing the database.
Choosing a Server
In order to connect to a SQL database on another computer, select
Choose Server. From here, the SQL Instance and database can be
selected. If the SQL instance does not appear in the drop down, it can be
entered manually.
Connecting to a Database
To choose the database to be used, first highlight the database and then
select Connect.
FOR RESEARCH USE ONLY
8-3
LC1115RUO.3(2/15)
C HAPTER 9: S AMPLE V IEW
This chapter contains information regarding viewing data for a particular sample. All batches can
be displayed, graphically compared from one
batch to another, and antibody history viewed.
Sample Search
By Sample ID Name
Type the sample ID or sample name into the search box and click the magnifying glass. As the ID is typed into the box, the auto-complete feature
will activate. All batches containing that sample ID will display. Click the
batch for it to appear in Antibody Batch Results.
By Run Date
Click the calendar and choose a range of dates or specific date. All samples from batches run within the range or date will display. Click the batch
for it to appear in Antibody Batch Results.
Advanced Sample Search
Selecting the Advanced Sample Search button will allow the user to search
for samples by multiple identifiers.
FOR RESEARCH USE ONLY
9-1
LC1115RUO.3(2/15)
To Use this feature, first select the Advanced Search button from the
Advanced Search Window. Then click the first drop-down to search by
Assignment, Patient Name, Donor Center, Donor Number, or HLA Type.
Select the appropriate qualifier (Equals, Starts With, Contains) from the
second drop-down.
Enter the specific search term in the window. Up to three fields can be
included in a single search.
Once all desired fields have been chosen, click Search.
All Samples that fulfill the search requirements will be listed on the left
under Patient List.
Merge Sample IDs/Sample Names
1) To merge sample IDs or sample names, first find the sample ID or sample name by searching by date.
2) Highlight the first ID. Hold the Ctrl key as the other IDs are selected.
FOR RESEARCH USE ONLY
9-2
LC1115RUO.3(2/15)
Once all IDs are highlighted, right click and choose Merge Patient.
3) Name the new Sample.
Now the sample ID or sample name can be found as they were originally
named as well as found under the new merged name.
Viewing Antibody Batch Results
Patient Information
If Patient Name, Date of Birth, Draw Date, HLA Type, Accesstion Number,
Donor Number, or Donor Center Number were included in the auto-batch
set-up, they will be displayed in the Patient Details tab of Patient View
for each individual sample.
The user can also manually enter this data in to any one of these fields.
FOR RESEARCH USE ONLY
9-3
LC1115RUO.3(2/15)
Manually Entering Patient Data
1.Select the batch from the Patient List window.
2. Enter the Patient Details.
3. Click Save.
Note: The user will be prompted to save Patient Details for the single batch or for
all batches containing the sample. If the user chooses to save for All Batches, the
draw date, if entered, will be applied only to the selected batch.
Entering HLA Type
Patient HLA Type can be is manually entered in the Patient Details tab.
Once saved it will display in Patient Information in the Analysis screen and
on reports generated for that sample.
If a user wants to Exclude the patient HLA type then antigens entered into
this field must match an antigen listed on a product worksheet and be separated by commas.
Example:
A2, A24, B56, B51
or
A*02:01, A*24:02, B*56:01, B*51:01
Displaying Batches (
1) To view all batches containing a specific sample, double-click the sample
name or click the + icon. All batches containing that sample will display
under the Antibody Batch Results tab.
FOR RESEARCH USE ONLY
9-4
LC1115RUO.3(2/15)
2) Click any of the batches listed for the selected sample for all results to
appear in Antibody Batch Results.
3) The antigen specificities for the chosen batch will display once the batch
is selected.
Note: C3d batches will display in bold type.
If two batches have been run for a chosen assay and both batches are
selected by holding down the ctrl key, any differences of antigen assignments between the batches will be highlighted.
Red and Checked Antigens are Positive in all batches.
Red and Un-checked Antigens are Negative in the first batch and Positive in
the Positive in the second batch.
Yellow and Checked Antigens are Positive in the First batch and Negative in
the Second Batch.
FOR RESEARCH USE ONLY
9-5
LC1115RUO.3(2/15)
Note: Double click the batch to get to the original analysis tab.
3) If an Antibody History was created previously for a particular sample,
the history will display in the Antibody History tab. Edits to the history can
be made here as well.
See “Creating a History” for LMID
See “” for LMSA
Graphing Antigens across Several Batches for LSA and ID
A graph can be created with combined results from multiple batches.
1) Choose to either Graph by Antigen or Graph by Date.
2) Go to the Antibody Batch Results. Hold the ctrl key while selecting each
batch to be included in the graph.
FOR RESEARCH USE ONLY
9-6
LC1115RUO.3(2/15)
3) Assigned antigens to be graphed will appear in the Antigen column on
the right. Differences in assignments between the two panels will be highlighted in Yellow. Additional antigens can by added by selecting manually
4) To include the CON value in the graph mark the box for CON. To include
all Antigens in a graph mark the box for Select All .
5) Right click the highlighted batches and choose Generate Graph.
FOR RESEARCH USE ONLY
9-7
LC1115RUO.3(2/15)
By default the graph will be a bar graph with Antigens listed on the X-axis
and MFI on the y-axis.
To modify the style of graph or to graph by an assay-specific calculated
value (ADJ1, BCM, etc) right click anywhere in the graph and select from
the menu that appears.
Creating Paired data sets and Graphing LSA IgG and C3d
Creating LSA IgG-C3d paired data sets
1) Search for the sample by name or by run date in the Patient List Search
Window
2)Click any of the batches listed for the selected sample for all results to
appear in Antibody Batch Results. C3d batches will display in bold type.
FOR RESEARCH USE ONLY
9-8
LC1115RUO.3(2/15)
3) Selecting an individual batch will
display the assigned antigens for
that batch in the antigen column on
the right. The user can select an LSA
IgG batch and a C3d batch by holding down the CTRL key when the
second batch is selected. Differences
in assignment between the two
batches will display in yellow. Additional antigens can be selected manually.
4) Data from LSA IgG and C3d must be paired to generate an LSA-C3d
combined report.
a) Select the data set to be paired from the batches listed. Hold down the
CTRL key to highlight both LSA and the C3d. As batches are selected they
will be highlighted in blue.
b) Right-click and select Assign IgG-C3d Pair from the pop-up.
c) Assigned pairs will be highlighted. The first assigned pair for a sample
will be highlighted in light blue. The second assigned pair for a sample will
be highlighted in red. Any subsequent paired data sets will be highlighted
in yellow.
FOR RESEARCH USE ONLY
9-9
LC1115RUO.3(2/15)
Note: IgG-C3d pairs must be assigned in order to use the Export IgGC3d pair function in Exports/Reports.
Graphing LSA IgG -C3d paired data
The MATCH IT! software allows the user to generate a graph that gives a
direct comparison between LSA IgG and C3d.
1) Select LSA IgG and C3d data to be graphed. Click on the LSA-IgG sample to select. Hold down the CTRL key and click on the C3d sample. As
samples are selected they will be highlighted in blue.
2) Right-Click and select Generate Graph. All assigned antigens from the
antigen window will appear as data points on the graph.
Note: IgG vs C3d Graphs will display Background Corrected MFI in the yaxis and antigens in the x-axis.
FOR RESEARCH USE ONLY
9-10
LC1115RUO.3(2/15)
Generating LSA IgG -C3d Reports
The user can generate a report with LSA IgG data and C3d data from the Sample view screen.
1) Select LSA IgG and C3d data to be reported Click on the LSA-IgG sample
to select. Hold down the CTRL key and click on the C3d sample. As samples are selected they will be highlighted in blue.
2) Right-Click and select Generate Graph from the menu. Select whether
or not to include a graph in the report from the sub-menu.
3) The LSA IgG-C3d report will populate a new window.
All reports will include IgG and C3d Report Parameters and data will be
sorted as follows:
• Positive IgG-Positive C3d
•Positive IgG-Negative C3d
•Negative IgG-Positive C3d
•Negative IgG-Negative C3d
FOR RESEARCH USE ONLY
9-11
LC1115RUO.3(2/15)
4) Once a report appears on the screen, click the Export Report icon in
the upper right toolbar.
3) The dialog box that appears provides several different options for
exporting/saving the report
4) Select and Save to the chosen location
FOR RESEARCH USE ONLY
9-12
LC1115RUO.3(2/15)
A PPENDIX A: E RROR C ONDITIONS
Error Condition
Message
CSV File successfully imported
Lot selected for import is not correct and has invalid probes
CSV file contains duplicate sample names
CSV file contains invalid or inconsis‐
tent sample names
CSV file is missing batch name
FOR RESEARCH USE ONLY
Appendix A-1
LC1115RUO.3 (2/15)
Error Condition
Message
CSV file contains Batch name is longer than 30 characters CSV file contains sample name(s) is longer than 30 char‐
acters Batch Import Can‐
celled Lot could not be found in database
No samples are entered
FOR RESEARCH USE ONLY
Appendix A-2
LC1115RUO.3 (2/15)
Error Condition
Message
Missing Fields
Duplicate Sample Names
Invalid date format
Luminex Connection not available
FOR RESEARCH USE ONLY
Appendix A-3
LC1115RUO.3 (2/15)
Error Condition
Message
Invalid Database Name
Successful Database Creation
Detach in‐use data‐
base
Detach database Confirmation
Detach database suc‐
cessful message
FOR RESEARCH USE ONLY
Appendix A-4
LC1115RUO.3 (2/15)
Error Condition
Message
Database Backup successful message
Invalid Login
Batch has already been imported into database. EDS file already exists in database FOR RESEARCH USE ONLY
Appendix A-5
LC1115RUO.3 (2/15)
Error Condition
Message
EDS file(s) imported successfully. No paired C3d sam‐
ples found within specified dat range. Bead Failure
FOR RESEARCH USE ONLY
Appendix A-6
LC1115RUO.3 (2/15)
SOFTWARE AGREEMENT
IF YOU DO NOT AGREE WITH THESE TERMS AND CONDITIONS, DO NOT INSTALL THE
SOFTWARE AND RETURN THIS ENTIRE PACKAGE WITHIN 30 DAYS OF SALE WITH YOUR
RECEIPT FOR A FULL REFUND.
1. USE
You (an entity, a Site, An Institution or a person) may use Immucor Transplant Diagnostics, Inc. MATCH
IT!, Antibody Analysis Software (the "Software"), either on a standalone computer or a network, in the
quantity purchased, if you meet the following conditions. In addition you may make one (1) archival copy
of the Software.
STANDALONE COMPUTER USE:
You must acquire one copy of the Software for each Site or Institution on which the Software will be
installed. You may use the applications on more than one computer at a time, provided these multiple
computers are connected in a network with a computer acting as a File Server.
FOR UPGRADES AND TRADEUPS:
If the Software is an upgrade or a trade-up, you are authorized to use the Software only if you are an
authorized user of a qualifying product as determined by Immucor Transplant Diagnostics, Inc. and
provided you (i) either delete the qualifying product or install the new product on the same computer or
network as the qualifying product and (ii) do not transfer the qualifying product to any other person.
2. RESTRICTIONS
Except as expressly provided in Section 1, you may not alter, merge, modify or adapt the Software in any
way including reverse engineering, disassembling or decompiling. You may not sell, distribute, loan, rent,
lease, license or otherwise transfer the Software or any copy; except, you may permanently transfer the
Software (including all prior versions) provided you transfer the Software Agreement and all documentation
and media and you do not retain any copies. If the Software is demonstration and evaluation ("D&E")
software, you may not transfer the Software for commercial purposes. If you acquired the Software
preloaded on a computer as part of your purchase of the computer ("OEM Software"), then you may not
transfer such OEM Software (or any accompanying disks) for value separately from the computer.
If you are using the Software in any country in the European Community, the prohibition against altering,
merging, modifying or adapting the Software does
not affect your rights under any legislation implementing the E.C. Council Directive on the Legal Protection
of Computer Programs. If you seek interface information within the meaning of Article 6.1.b of that
Directive, you should initially inquire with Immucor Transplant Diagnostics, Inc., 550 West Avenue,
Stamford, CT 06902, USA.
3. INTELLECTUAL PROPERTY RIGHTS
All intellectual property rights in the Software and user documentation are owned by Immucor Transplant
Diagnostics, Inc. and are protected by applicable intellectual property laws (including patent, trademark
and copyright laws) and international treaty provisions. Immucor Transplant Diagnostics, Inc. retains all
rights not expressly granted.
FOR RESEARCH USE ONLY
SA-1
LC1115RUO.3(2/15)
4. LIMITED WARRANTY
For ninety (90) days from your date of purchase, Immucor Transplant Diagnostics, Inc. warrants that:
(i) The Software will substantially conform to the applicable user documentation and (ii) that the magnetic
media on which the Software is distributed and the user documentation (if any) are free from defects in
materials and workmanship. If the media is defective, Immucor Transplant Diagnostics, Inc. will replace the
Software or provide you with corrected items at no charge provided that the defective item(s) is returned to
Immucor Transplant Diagnostics, Inc. within ninety (90) days from the date of purchase. Any misuse or
unauthorized modification of the Software will void this limited warranty.
EXCEPT AS SPECIFICALLY PROVIDED HEREIN, Immucor TRANSPLANT DIAGNOSTICS, INC.
MAKES NO WARRANTY, REPRESENTATION, PROMISE OR GUARANTEE, EITHER EXPRESS OR
IMPLIED, STATUTORY OR OTHERWISE, WITH RESPECT TO THE SOFTWARE, USER
DOCUMENTATION OR RELATED TECHNICAL SUPPORT, INCLUDING THEIR QUALITY,
PERFORMANCE, MERCHANTABILITY OR FITNESS FOR A PARTICULAR PURPOSE.
5. LIMITATION OF LIABILITY
Because software is inherently complex and may not be completely free of errors, it is your responsibility to
verify your work and to make backup copies. IN NO EVENT WILL Immucor TRANSPLANT
DIAGNOSTICS, INC. OR ANY OF ITS LICENSORS BE LIABLE FOR INDIRECT, SPECIAL,
INCIDENTAL, TORT, ECONOMIC, COVER OR CONSEQUIENTIAL DAMAGES ARISING OUT OF THE
USE OF OR INABILITY TO USE IMMUCOR TRANSPLANT DIAGNOSTICS, INC.= (OR ANY OF ITS
LICENSORS') PRODUCTS OR SERVICES, INCLUDING, WITHOUT LIMITATION, DAMAGES
OR COSTS RELATING TO THE LOSS OF PROFITS, BUSINESS, GOODWILL, DATA OR COMPUTER
PROGRAMS, EVEN IF ADVISED OF THE POSSIBILITY OF SUCH DAMAGES. IN NO CASE SHALL
IMMUCOR TRANSPLANT DIAGNOSTICS INC.' OR ANY OF ITS LICENSORS' LIABILITY EXCEED THE
AMOUNT PAID BY YOU FOR THE SOFTWARE OUT OF WHICH SUCH CLAIM AROSE.
This limitation on monetary damages will not apply to claims relating to death or personal injury which
arises out of products deemed to be consumer goods under applicable law. Some states, provinces and
other jurisdictions do not allow the exclusion or limitation of implied warranties or limitation of liability for
incidental or consequential damages, so the above exclusion or limitation may not apply to you. However,
in appropriate jurisdictions, Immucor Transplant Diagnostics, Inc. limits its liability, according to the terms
of this Agreement, to the extent permissible at law.
Nothing in this Agreement operates to exclude, restrict or modify the application of any of the provisions of
the Trade Practices Act 1974 (Cth) or any equivalent state or territory legislation, the exercise of a right
conferred by such a provision, or any liability of Immucor Transplant Diagnostics, Inc. for a breach of a
condition or warranty (including but not limited to a condition or warranty in relation to goods or services of
a kind ordinarily acquired for personal, domestic or household use or consumption) implied by such a
provision.
6. U.S. GOVERNMENT RESTRICTED RIGHTS
The Software and/or user documentation are provided with RESTRICTED AND LIMITED RIGHTS. Use,
duplication or disclosure by the Government is subject to restrictions as set forth in FAR 53.027-14 (June
1987) Alternate III (g)(3) (June 1987), FAR 53.027-19 (June 1987), or DFARS 53.027-7013 (c)(1)(ii) (June
1988), as applicable. Contractor/Manufacturer is Immucor Transplant Diagnostics, Inc., 550 West Ave.,
Stamford, CT 06902. In the event the Government seeks to obtain the Software pursuant to standard
FOR RESEARCH USE ONLY
SA-2
LC1115RUO.3(2/15)
commercial practice, this software agreement, instead of the noted regulatory clauses, shall control the
terms of the Government's license.
7. GENERAL
No Immucor Transplant Diagnostics, Inc. dealer, distributor, agent or employee is authorized to make any
modification or addition to this Agreement. For use of the Software in North America and Latin America,
this Agreement will be governed by the laws of the State of Delaware. For all other countries, this
Agreement will be governed by the laws of the country in which the Software was purchased.
For customers: Should you have any questions concerning this Agreement or Immucor Transplant
Diagnostics, Inc. ' software use policies, write to Inside Sales and Service,
Immucor Transplant Diagnostics, Inc.
550 West Ave, Stamford, CT 06902.
CONTRAT DE LOGICIEL IMMUCOR TRANSPLANT DIAGNOSTICS, INC.
SI VOUS N'ÊTES PAS D'ACCORD AVEC LES PRÉSENTES MODALITÉS ET CONDITIONS,
N'INSTALLEZ PAS LE LOGICIEL ET RENVOYEZ LE EN TOTALITÉ AU PLUS TARD 30 JOURS APRÈS
L'AVOIR ACHETÉ, AVEC VOTRE REÇU, POUR VOUS FAIRE TOTALEMENT REMBOURSER.
1. UTILISATION
Vous (une entité ou une personne) pouvez utiliser Immucor Transplant Diagnostics, Inc. MATCH IT!,
Antibody Analysis Software (le *logiciel+) en quantité autorisée, si vous remplissez les conditions
suivantes. En outre, vous pouvez faire une (1) copie d'archive du logiciel.
Pour les mises à jour et les échanges: Si le logiciel est une mise à jour ou un échange, vous avez le droit
de l'utiliser uniquement si vous êtes un utilisateur autorisé d'un produit vous qualifiant, tel que défini par
Immucor Transplant Diagnostics, Inc. et à condition (i) d'effacer le produit vous qualifiant ou d'installer le
nouveau produit dans le même ordinateur ou réseau que le produit vous qualifiant et (ii) de ne pas
transférer le produit vous qualifiant à une autre personne.
2. RESTRICTIONS
Sauf autrement prévu en Section 1, vous ne pouvez pas altérer, amalgamer, modifier ou adapter le logiciel
de quelque manière que ce soit, y compris par rétroingénierie, décompilage ou desassemblage, Vous ne
pouvez pas vendre, distribuer, prêter, louer à court terme ou à long terme, licenser ou autrement transférer
le logicier ou le copier, à l'exception de transférer de manière permanente le logiciel (y compris toutes ses
versions antérieures) et de transférer le contrat de logiciel et toute la documentation et les médias et ne
retenir aucun exemplaire. Si le logiciel est un logiciel de démonstration et d'évaluation, vous ne pouvez
pas transférer le logiciel à des fins commerciales. Si vous avez acquis le logiciel pré-chargé dans un
ordinateur en achetant l'ordinateur (logiciel MEO), vous ne pouvez pas séparer ce logiciel MEO (ou toute
disquette l'accompagnant) de l'ordinateur.
Si vous utilisez le logiciel dans un pays de la Communauté européenne, la défense contre toute
modification, amalgamation, altération ou adaptation du logiciel ne modifie pas vos droits en vertu d'une
législation appliquant les directives du Conseil de la CE sur la protection juridique des programmes
informatiques. Si vous recherchez de l'information d'interface conformément au texte de l'Article 6.1.b de
FOR RESEARCH USE ONLY
SA-3
LC1115RUO.3(2/15)
ces directives, vous devez d'abord contacter le service suivant: Immucor Transplant Diagnostics, Inc., 550
West Ave., Stamford, CT 06902, USA
3. DROITS DE PROPRIÉTÉ INTELLECTUELLE
Tous les droits de propriété intellectuelle sur le logiciel et la documentation de l'utilisateur appartiennent à
Immucor Transplant Diagnostics, Inc. ou à ses fournisseurs et sont protégés par les lois sur la propriété
intellecutelle en vigueur (y compris les lois sur les brevets, les marques de commerce et les droits
d'auteur) et les modalités des traités internationaux. Immucor Transplant Diagnostics, Inc. conserve tous
les droits non expressément accordés.
4. GARANTIE LIMITÉE
Pendant les quatre-vingt-dix (90) jours qui suivent la date d'achat, Immucor Transplant Diagnostics, Inc.
garantit (i) que le logiciel se conformera substantiellement à la documentation destinée à l'utilisateur et (ii)
que les médias magnétiques sur lesquels le logiciel est distribué et la documentation de l'utilisateur (s'il y
en a une) sont libres de tout vice de matériaux et de main-d'oeuvre. Immucor Transplant Diagnostics, Inc.
choisira de vous rembourser le montant que vous avez payé pour le logiciel, ou bien de vous fournir les
produits corrigés gratuitement si vous renvoyez les articles défectueux au plus tard quatre-vingt-dix (90)
jours après votre date d'achat. Toute mauvaise utilisation ou modification non autorisée du logiciel
annulera cette garantie limitée.
À l'exception des modalités contenues dans le présent contrat, Immucor Transplant Diagnostics, Inc. ne
donne aucune garantie, ne fait aucune déclaration, promesse ou garantie, expresse ou implicite, statutaire
ou autre, sur le logiciel, la documentation de l'utilisateur ou le soutien technique connexe, y compris sur
leur qualité, leur rendement, leur commercialité ou leur utilisation à une fin particulière.
Cette garantie et les remèdes exposés dans le présent contrat excluent et remplacent toutes les autres
garanties, verbales ou écrites, expresses ou implicites. Cette garantie vous donne des droits juridiques
particuliers et vous pouvez également avoir d'autres droits qui varient d'une juridiction à l'autre.
5. LIMITE DE RESPONSABILITÉ
Comme le logiciel est fondamentalement complexe et peut contenir des erreurs, vous êtes responsable de
vérifier votre travail et d'en faire des copies d'archive. En aucun cas Immucor Transplant Diagnostics, Inc.
ou l'un de ses donneurs de licence sera responsable de dommages indirects, spéciaux, incidents, civils,
économiques, couverts ou conséquents occasionnés par l'utilisation ou l'impossibilité d'utiliser des
produits ou des services Immucor Transplant Diagnostics, Inc. (ou de l'un de ses donneurs de licence), y
compris, mais sans s'y limiter, aux dommages ou aux coûts relatifs à la perte de profits, de contrats, de
réputation commerciale, de données ou de programmes informatiques, même si Immucor Transplant
Diagnostics, Inc. a été avisé de la possibilité de tels dommages. En aucun cas la responsabilité de
Immucor Transplant Diagnostics, Inc. dépassera le montant payé par vous pour le logiciel ayant
occasionné une telle réclamation. Cette limite sur les dommages monétaires ne s'appliquera pas aux
plaintes relatives à des blessures corporelles ou des décès occasionnés par des produits considérés
comme des biens de consommation en veru de la loi en vigueur. Certains États, provinces et autres
juridictions ne permettent pas l'exclusion ou la limite des garanties implicites ou la limite de la
responsabilité pour dommages incidents ou conséquents, et par conséquent l'exclusion ou la limite
ci-dessus peut ne pas s'appliquer à vous. Cependant, dans les juridictions pertinentes, Immucor
Transplant Diagnostics, Inc. limite sa responsabilité, conformément aux modalités du présent contrat,
dans la mesure permise par la loi.
FOR RESEARCH USE ONLY
SA-4
LC1115RUO.3(2/15)
6. DROITS LIMITÉS DU GOUVERNEMENT DES ÉTATS-UNIS
Le logiciel et/ou la documentation de l'utilisateur sont fournis avec des DROITS LIMITÉS ET
RESTREINTS. L'utilisation, le dédoublement ou la divulgation par le Gouvernement est soumise aux
restrictions exposées dans les lois suivantes: FAR 53.027-14 (Juin 1987) Alternate III(g)(3) (Juin 1987),
FAR 53.027-19 (Juin 1987), ou DFARS 53.027-7013 (c)(1)(ii) (Juin 1988), en vigueur. L'entrepreneur/
fabricant est Immucor Transplant Diagnostics, Inc. , 550 West Ave., Stamford, CT 06902. Si le
Gouvernement a obtenu le logiciel conformément à la pratique commerciale normale, c'est le présent
contrat de logiciel, et pas les articles des règlements cités, qui régira les modalités de permis au
Gouvernement.
7. GENERALITÉS
Aucun revendeur, distributeur, agent ou employé de Immucor Transplant Diagnostics, Inc. n'est autorisé à
faire des modifications ou des additions au présent contrat. Pour toute utilisation du logiciel en Amérique
du Nord et en Amérique Latine, le présent contrat sera régi par les lois du Commonwealth du Delaware.
Pour tous les autres pays, le présent contrat sera régi par les lois du pays dans lequel le logiciel a été
acheté.
Clients: Si vous avez des questions sur le présent contrat ou sur les politiques d'utilisation des logiciels
Immucor Transplant Diagnostics, Inc. , écrivez à: Inside Sales and Service, Immucor Transplant
Diagnostics, Inc. , 550 West Ave. Stamford, CT 06902, USA.
CONVENIO PARA USO DE SOFTWARE DE IMMUCOR TRANSPLANT DIAGNOSTICS, INC.
SI USTED NO ESTÁ DE ACUERDO CON ESTOS TÉRMINOS Y CONDICIONES, NO INSTALE EL
SOFTWARE Y DEVUELVA ESTE PAQUETE COMPLETO DENTRO DE LOS 30 DÍAS DESPUÉS DE LA
VENTA, JUNTO CON SU NOTA, PARA EL REEMBOLSO TOTAL DE SU DINERO.
1. USO
Usted (persona física, o moral, laboratorio, o institucion) podrá usar el MATCH IT!, Antibody Analysis
Software de Immucor Transplant Diagnostics, Inc. (el "Software"), en la cantidad establecida, siempre que
reúna las condiciones que siguen. Además, usted podrá hacer una (1) copia de archivar del Software.
Para Modernizaciones y Sustitutos Mejores:
Si se trata de un Software de modernización o sustituto mejor, se le autoriza para que use el Software sólo
en caso de que sea usuario autorizado de un producto de aprobación según lo determinado por Immucor
Transplant Diagnostics, Inc. y siempre que usted (i) o suprima el producto de aprobación o instale el
producto nuevo en la misma computadora o red, tal como el producto de aprobación, y (ii) no transfiera el
producto de aprobación a ninguna otra persona.
2. RESTRICCIONES
Salvo lo que se estipule expresamente en la Cláusula 1, usted no podrá alterar, fusionar, modificar o
adaptar el Software de ninguna manera, incluso la ingeniería inversa, el desensamblaje o la
descompilación. Usted no podrá vender, distribuir, prestar, arrendar, alquilar, otorgar licencia o transferir
de manera distinta el Software o cualquier copia del mismo; excepto que sí podrá transferir el Software de
FOR RESEARCH USE ONLY
SA-5
LC1115RUO.3(2/15)
manera definitiva (incluso todas las versiones anteriores), a reserva de que transfiera el Convenio para
Uso de Software y toda la documentación y soportes magnéticos, y no retenga copia alguna. Si el
Software es un software de demostración y evaluación ("D y E"), no podrá transferir el Software con
propósito comercial. En caso que adquiriera el Software precargado en computadora como parte de su
compra de la computadora ("Software del Fabricante"), entonces no podrá transferir ese Software del
Fabricante por un valor aparte del de la computadora.
Si está haciendo uso del Software en cualquier país de la Comunidad Europea, la prohibición de alterar,
fusionar, modificar o adaptar el Software no afecta a sus derechos bajo ninguna legislación que aplique
las Directrices del Consejo de la C.E. sobre la Protección Legal de Programas Informáticos. Si busca
información de interfase en los términos del Artículo 6.1.b de esas Directrices, debiera inicialmente
consultar Immucor Transplant Diagnostics, Inc., 550 West Ave, Stamford, CT 06902, USA.
3. DERECHOS DE PROPIEDAD INTELECTUAL
Immucor Transplant Diagnostics, Inc. o sus proveedores son titulares de todos los derechos de propiedad
intelectual del Software y de la documentación del usuario, y están protegidos por leyes sobre propiedad
intelectual vigentes (incluso por leyes sobre patentes, marcas registradas y derechos de autor), así como
por disposiciones de tratados internacionales. Immucor Transplant Diagnostics, Inc. se reserva todos los
derechos que no se hayan cedido expresamente.
4. GARANTÍA LIMITADA
Durante noventa (90) días a partir de la fecha de su compra, Immucor Transplant Diagnostics, Inc. le
garantiza que (i) el Software se ajusta sólidamente a la documentación aplicable del usuario y (ii) los
soportes magnéticos sobre los que está distribuido el Software y la documentación del usuario (si la hay)
son libres de defectos en materiales y mano de obra. A su opción, Immucor Transplant Diagnostics, Inc. le
hará la devolución del importe que usted haya pagado por el Software o le proporcionará los artículos
correctos, sin costo, siempre que el o los artículos defectuosos sean retornados a Immucor Transplant
Diagnostics, Inc. dentro de los noventa (90) días después de la fecha de compra. Cualquier maltrato o
modificación no autorizada del Software anulará esta garantía limitada.
Como excepción a lo estipulado en la presente, Immucor Transplant Diagnostics, Inc. no hace garantía,
declaración de hecho o promesa, ya sea expresa o tácita, reglamentaria o de otro carácter, con respecto
al Software, documentación del usuario o apoyo técnico inherente, incluso respecto a su calidad,
funcionamiento, comerciabilidad o idoneidad para un propósito especial.
La garantía y recursos estipulados en la presente cláusula son exclusivos y en sustitución de todos los
demás, verbales o escritos, expresos o tácitos. Esta garantía le otorga derechos jurídicos específicos, y
quizá usted también disponga de otros derechos que varían de una jurisdicción a otra.
5. LIMITACIÓN DE RESPONSABILIDAD CIVIL
Toda vez que el software es inherentemente complejo y no pueda ser libre de errores por entero, es
responsabilidad de usted verificar su trabajo y hacer el copiado preventivo. En ningún caso, Immucor
Transplant Diagnostics, Inc. o cualquiera de sus licenciantes será responsable por daños y perjuicios
indirectos, especiales, incidentales, extracontractuales, económicos, de cobertura o consecuentes
derivados del uso o la inhabilidad de uso de productos y servicios de Immucor Transplant Diagnostics, Inc.
(o de cualquiera de sus licenciantes), entre los cuales figuran los
FOR RESEARCH USE ONLY
SA-6
LC1115RUO.3(2/15)
daños o costos vinculados a la pérdida de ganancias, negocios, plusvalía, datos o programas
informáticos, aun cuando se advirtiera la posibilidad de tales daños. En ningún caso, la obligación de
Immucor Transplant Diagnostics, Inc. será superior al monto desembolsado por usted en la compra del
Software, del cual derivara aquella reclamación. Esta limitación sobre daños pecuniarios no será aplicable
a reclamaciones relativas a la pérdida de la vida o la lesión corporal que surja de productos que se les dé
tratamiento de bienes de consumo conforme a la ley aplicable. Algunos estados, provincias y demás
jurisdicciones no permiten la exclusión o limitación de garantías implícitas o de restricción de
responsabilidad civil por daños y perjuicios incidentales o consecuentes, de tal manera que la exclusión o
limitación de más arriba quizá no le sea a usted pertinente. Sin embargo, en las jurisdicciones
competentes, Immucor Transplant Diagnostics, Inc. hace valer sus límites de responsabilidad con arreglo
a las estipulaciones de este Convenio, hasta el alcance legal permisible.
6. DERECHOS RESTRINGIDOS DEL GOBIERNO DE LOS EE.UU.
El Software y/o la documentación del usuario se proporcionan con DERECHOS RESTRINGIDOS Y
LIMITADOS. El uso, reproducción o divulgación por parte del Gobierno de los EE.UU. se sujeta a
restricciones como se consagra en la FAR 53.027- 14 (Junio de 1987). Alterna con [f](g)(3) (Junio de
1987), FAR 53.027-19 (Junio de 1987) o DFARS 53.027-7013 (c)(^)(ii) (Junio de 1988), según proceda.
La contratista/fabricante es Immucor Transplant Diagnostics, Inc. 550 West Ave., Stamford, CT 06902
EE.UU.. En caso que el Gobierno procure obtener el Software de acuerdo con prácticas comerciales
ordinarias, este Convenio para Uso de Software, en lugar de las cláusulas reglamentarias anotadas
arriba, normará las condiciones de la licencia del Gobierno.
7. CONDICIÓN GENERAL
Ningún intermediario, distribuidor, agente o empleado de Immucor Transplant Diagnostics, Inc. está
autorizado para hacer modificación o adición alguna a este Convenio. Para efectos del uso del Software
en América del Norte y América Latina, este Convenio se regirá por las leyes del Estado de Delaware.
Para todos los demás países, este Convenio se regirá por las leyes del país en el que fuera adquirido el
Software.
Para clientes: Si llegaran a tener alguna pregunta respecto a este Convenio o a las normas del uso de
software de Immucor Transplant Diagnostics, Inc., escriban a Servicio y Ventas, Immucor Transplant
Diagnostics, Inc. , 550 West Ave., Stamford, CT 06902.
FOR RESEARCH USE ONLY
SA-7
LC1115RUO.3(2/15)