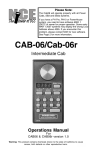
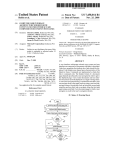
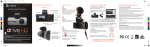
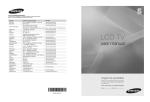
1
A Free Software for Food Industries to Ensure
Food Safety: CARVER + Shock
Vedpal Yadav and Alka Sharma
Abstract: Bio-terrorism is not a new term for scientists. Post 9/11 the United States of America, as well as other
countries which have grown well economically and countries undergoing the metamorphosis to developed nations,
are under serious threat of bio-terrorism. This has led to the development of the software CARVER + Shock by
Sandia National Laboratories and Food and Drug Administration (FDA), specifically for risk assessment and protection
mechanism in the entire food supply chain from farm to table. This software requires training on the software front and
interaction with industry people to chalk out a plan to safeguard the premises and the supply chain of the food products in
the industry manufacturing. Such efforts should be well highlighted and advertised among food processing professionals,
educators, students, and those government agencies concerning the food safety issues. Everyone must look at this software
as this is going to be the future of food processing safety. This system works like Hazard Analysis and Critical Control
Points and can be integrated for total quality management of the concerned industry. Our study has highlighted the
application of this software in various food industries showing its strength and weaknesses.
r Accessibility—ability to physically access and egress from
Introduction
Food safety concerns used to focus solely on accidental contamination. But in recent years, there has been concern that terrorists
could intentionally introduce biological, chemical, or radiological
agents. A risk assessment tool called CARVER + Shock helps
food processors protect their products from deliberate contamination (Acheson 2007b).
CARVER was originally developed by the U.S. military to
identify areas that may be vulnerable to an attacker. Food and
Drug Administration (FDA) and other agencies have used the
method to evaluate potential vulnerabilities in the supply chains
of different foods and food processes (Pohl 2007).
The CARVER + Shock method is an offensive targeting prioritization tool that has been adapted for use in the food sector.
This tool can be used to assess the vulnerabilities within a system or infrastructure to an attack. It allows you to think like an
attacker by identifying the most attractive targets for attack. By
conducting such a vulnerability assessment and determining the
most vulnerable points in your infrastructure, you can then focus
your resources on protecting your most vulnerable points (News
2007).
CARVER is an acronym for the following 6 attributes used to
evaluate the attractiveness of a target for attack:
r Criticality—measure of public health and economic impacts of an attack.
target.
r Recuperability—ability of system to recover from an at-
tack.
r Vulnerability—ease of accomplishing attack.
r Effect—amount of direct loss from an attack as measured
by loss in production.
r Recognizability—ease of identifying target.
A 7th attribute, Shock, has been added to the original 6 to
assess the combined health, economic, and psychological impacts
of an attack within the food industry (USFDA 2005).
Computerizing CARVER
CARVER has traditionally been used in a face-to-face setting.
Experts from FDA and/or U.S. Dept. of Agriculture have gone
to food processing plants and held meetings. The software program takes companies through more than 100 questions about
their facilities and processes to help them identify vulnerable areas
(USFDA 2007c).
Companies consider what type of attack is the greatest threat
and whether a biological or chemical agent might be used in an
attack. The questions center around which food supply chain the
company will assess, whether pizza production or a generic process
from farm to table (USFDA 2007a, 2007c).
Material and Methods
MS20100972 Submitted 8/28/2010, Accepted 11/16/2010. Author Yadav is
The attractiveness of a target can then be ranked on a scale from
with Food Technology, Government Polytechnic, Mandi Adampur, Hisar, Haryana,
India 125052. Author Sharma is with Dept. of Food Technology, GJU S&T, 1 to 10 on the basis of scales that have been developed for each of
Hisar, Haryana, India 125001. Direct inquiries to author Yadav (E-mail: the 7 attributes.
[email protected]).
Conditions that are associated with lower attractiveness (or
lower vulnerability) are assigned lower values (1 or 2), whereas
c 2011 Institute of Food Technologists®
doi: 10.1111/j.1541-4337.2010.00142.x
Vol. 10, 2011 r Comprehensive Reviews in Food Science and Food Safety 109
A free software for food industries to ensure food safety. . .
Table 1–Criticality.
Criticality: A target is critical when introduction of threat agents into food at this location would
have significant health or economic impact. Example metrics are:
Criticality Criteria—Use this scale to assess:
Scale
An individual food processing facility
Loss of over 10,000 lives OR loss of > 90% of the total economic value.
9-10
Loss of life is between 1,000-10,000 OR loss of between 61% and 90% of the total
7-8
economic value.
Loss of life is between 100 and 1000 OR loss of between 31% and 60% of the total
5-6
economic value.
Loss of live is less than 100 OR loss of between 10% and 30% of the total economic
3-4
value.
No loss of life OR < 10% of the total economic value.
1-2
Criticality Criteria—Use this scale to assess:
Scale
An individual crop or animal agriculture facility
Loss of > 90% of animal lives or total economic value.
9-10
Loss of 61% - 90% of animal lives or total economic value.
7-8
Loss of 31% - 60% of animal lives or total economic value.
5-6
Loss of 10% - 30% of animal lives or total economic value.
3-4
Loss < 10% of animal lives or total economic value.
1-2
conditions associated with higher attractiveness as a target (or
higher vulnerability) are assigned higher values (9 or 10). Evaluating or scoring the various elements of the food sector infrastructure of interest for each of the CARVER + Shock attributes
can help identify where within that infrastructure an attack is most
likely to occur (USFDA 2007a).
Federal agencies, such as the Food Safety and Inspection Service (FSIS) and the FDA, have used this method to evaluate the
potential vulnerabilities of farm-to-table supply chains of various
food commodities. The method can also be used to assess the potential vulnerabilities of individual facilities or processes (Acheson
2007a).
Steps for conducting a CARVER + Shock analysis
Step 1—establishing parameters. Before any scoring can begin, the scenarios and assumptions you wish to use in the analysis
must be established in order to guide all further steps. That is, you
need to answer the question of what you are trying to protect and
what you are trying to protect it from. Those parameters include:
r What food supply chain you are going to assess (hot dog
production or deli meat production or chicken nugget production, an overall assessment based on the generic process
from farm to table or postslaughter processing in a specific
facility and so on.);
r What is the endpoint of concern (food borne illness and death
or economic impacts and so on.);
r What type of attacker and attack you are trying to protect
against. Attackers could range from disgruntled employees to
international terrorist organizations. Those different attackers
have different capabilities and different goals. For example, a
major assumption used by FSIS and FDA in their vulnerability
assessments is that one of the goals of terrorist organizations
is to cause mass mortality by adding acutely toxic agents to
food products. That assumption has a major impact on the
scoring of the various parts of the supply chain and the scales
for the attributes (see below) have been developed with that
in mind;
r What agent(s) might be used? The agent used in your scenario will impact the outcome of the assessment. Potential
agents include biological, chemical, or radiological agents.
Different agents have different properties such as potency,
heat stability, pH stability, half-life that will determine the
impact of an intentional contamination incident (USFDA
2007a).
Step 2—assembling experts. A team of subject matter experts
should be constituted to conduct the assessment. The team should
consist, at a minimum, of experts in food production (specifically
for the food process being evaluated), food science, toxicology,
110 Comprehensive Reviews in Food Science and Food Safety r Vol. 10, 2011
c 2011 Institute of Food Technologists®
A free software for food industries to ensure food safety. . .
Table 2–Accessibility.
Accessibility: A target is accessible when an attacker can reach the target to conduct the attack
and egress the target undetected. Accessibility is the openness of the target to the threat. This
measure is independent of the probability of successful introduction of threat agents. Example
metrics are:
Accessibility Criteria
Scale
Easily Accessible (e.g., target is outside building and no perimeter defense). Limited
9-10
physical or human barriers or observation. Attacker has relatively unlimited access to
the target. Attack can be carried out using medium or large volumes of contaminant
without undue concern of detection. Multiple sources of information concerning the
facility and the target are easily available.
Accessible (e.g., target is inside building, but in unsecured part of facility). Human
7-8
observation and physical barriers limited. Attacker has access to the target for an hour
or less. Attack can be carried out with moderate to large volumes of contaminant, but
requires the use of stealth. Only limited specific information is available on the facility
and the target.
Partially Accessible (e.g., inside building, but in a relatively unsecured, but busy part
5-6
of facility). Under constant possible human observation. Some physical barriers may be
present. Contaminant must be disguised, and time limitations are significant. Only
general, non-specific information is available on the facility and the target.
Hardly Accessible (e.g., inside building in a secured part of facility). Human
3-4
observation and physical barriers with an established means of detection. Acces
generally restricted to operators or authorized persons. Contaminant must be disguised
and time limitations are extreme. Limited general information available on the facility
and the target.
Not Accessible. Physical barriers, alarms, and human observation. Defined means of
1-2
intervention in place. Attacker can access target for less than 5 minutes with all
equipment carried in pockets. No useful publicly available information concerning the
target.
epidemiology, microbiology, medicine (human and veterinarian),
radiology, and risk assessment. The team will apply the CARVER
+ Shock method to each element of food system infrastructure and
come to a consensus on the value from 1 to 10 for each attribute,
using the scenario and assumptions established in Step 1 (Rigby
2006; USFDA 2007b ).
Step 3—detailing food supply chain. The analysis begins by
developing a description of the system under evaluation.
A graphical representation (flow chart) of the system and its subsystems, complexes, components, and nodes (its smaller structural
parts) should be developed to facilitate this process. For example, if
you are evaluating hot dog production, the food system is hot dog
production that can be broken down into subsystems (production
of live animals subsystem, slaughter/processing subsystem, distribution subsystem). Those subsystems can be further broken down
into complexes (such as slaughterhouse facility and processing facility) Those can be broken down into components and would
c 2011 Institute of Food Technologists®
include the raw materials receiving area, processing area, storage
area, shipping area, and so on), and to the smallest possible nodes
(for example, individual pieces of equipment) (FDA 2007; News
2007; Pohl 2007 ).
Step 4—assigning scores. Once the infrastructure has been
broken down into its smallest parts (components and nodes), these
can be ranked or scored for each of the 7 CARVER + Shock
attributes to calculate an overall score for that node. The nodes
with the higher overall scores are those that are potentially the
most vulnerable nodes (and, therefore, most attractive targets for
an attacker). The rationale for a particular consensus score should
be captured (Donald Kautter 2006; Danneels 2007).
Step 5—applying what has been learned. Once the critical
nodes of the system have been identified, a plan should be
developed to put countermeasures in place that minimize the
attractiveness of the nodes as targets. Countermeasures might include enhancements to physical security, personnel security, and
Vol. 10, 2011 r Comprehensive Reviews in Food Science and Food Safety 111
A free software for food industries to ensure food safety. . .
Table 3–Recuperability.
Recuperability: A target’s recuperability is measured in the time it will take for the specific facility
to recover productivity. Example metrics are:
Recuperability Criteria
Scale
> 1 year
9-10
6 months to 1 year
7-8
3-6 months
5-6
1-3 months
3-4
< 1 month
1-2
Table 4–Vulnerability.
Vulnerability: A measure of the ease with which threat agents can be introduced in quantities
sufficient to achieve the attacker’s purpose once the target has been reached. Vulnerability is
determined both by the characteristics of the target (e.g., ease of introducing agents, ability to
uniformly mix agents into target) and the characteristics of the surrounding environment (ability to
work unobserved, time available for introduction of agents). It is also important to consider what
interventions are already in place that might thwart an attack. Example metrics are:
Vulnerability Criteria
Scale
Target characteristics allow for easy introduction of sufficient agents to achieve aim.
9-10
Target characteristics almost always allow for introduction of sufficient agents to
7-8
achieve aim.
Target characteristics allow 30 to 60% probability that sufficient agents can be added to
5-6
achieve aim.
Target characteristics allow moderate probability (10 to 30%) that sufficient agents can
3-4
be added to achieve aim.
Target characteristics allow low probability (less than 10%) sufficient agents can be
1-2
added to achieve aim.
Table 5–Effect.
Effect: Effect is a measure of the percentage of system productivity damaged by an attack at a
single facility. Thus, effect is inversely related to the total number of facilities producing the same
product. Example metrics are:
Effect Criteria
Scale
Greater than 50% of the system’s production impacted
9-10
25-50% of the system’s production impacted
7-8
10-25% of the system’s production impacted
5-6
1-10% of the system’s production impacted
3-4
Less than 1% of system’s production impacted
1-2
112 Comprehensive Reviews in Food Science and Food Safety r Vol. 10, 2011
c 2011 Institute of Food Technologists®
A free software for food industries to ensure food safety. . .
Table 6–Recognizability.
Recognizability: A target’s recognizability is the degree to which it can be identified by an
attacker without confusion with other targets or components. Example metrics are:
Recognizability
Scale
The target is clearly recognizable and requires little or no training for recognition
9-10
The target is easily recognizable and requires only a small amount of training for
7-8
recognition
The target is difficult to recognize or might be confused with other targets or target
5-6
components and requires some training for recognition
The target is difficult to recognize. It is easily confused with other targets or
3-4
components and requires extensive training for recognition
The target cannot be recognized under any conditions, except by experts.
1-2
Table 7–Shock.
Shock: Shock is the final attribute considered in the methodology. Shock is the combined
measure of the health, psychological, and collateral national economic impacts of a successful
attack on the target system. Shock is considered on a national level. The psychological impact
will be increased if there are a large number of deaths or the target has historical, cultural,
religious or other symbolic significance. Mass casualties are not required to achieve widespread
economic loss or psychological damage. Collateral economic damage includes such items as
decreased national economic activity, increased unemployment in collateral industries, etc.
Psychological impact will be increased if victims are members of sensitive subpopulations such
as children or the elderly.
Shock
Scale
Target has major historical, cultural, religious, or other symbolic importance. Loss of
9-10
over 10,000 lives. Major impact on sensitive subpopulations, e.g., children or elderly.
National economic impact more than $100 billion.
Target has high historical, cultural, religious, or other symbolic importance. Loss of
7-8
between 1,000 and 10,000 lives. Significant impact on sensitive subpopulations, e.g.,
children or elderly. National economic impact between $10 and $100 billion.
Target has moderate historical, cultural, religious, or other symbolic importance. Loss of
5-6
life between 100 and 1,000. Moderate impact on sensitive subpopulations, e.g.,
children or elderly. National economic impact between $1 and $10 billion.
Target has little historical, cultural, religious, or other symbolic importance. Loss of life
3-4
less than 100. Small impact on sensitive subpopulations, e.g., children or elderly.
National economic impact between $100 million and $1 billion.
Target has no historical, cultural, religious, or other symbolic importance. Loss of life
1-2
less than 10. No impact on sensitive subpopulations, e.g., children or elderly. National
economic impact less than $100 million.
c 2011 Institute of Food Technologists®
Vol. 10, 2011 r Comprehensive Reviews in Food Science and Food Safety 113
A free software for food industries to ensure food safety. . .
operational security that help to minimize aggressor access to the
product or process (Catlin and Kautter 2007).
Description of attributes and scales
The following section defines the attributes used by FDA and
USDA to conduct their vulnerability assessments and provides the
scales used by the agencies for scoring each attribute. These scales
were developed with the mindset that mass mortality is a goal of
terrorist organizations. It is important to remember, however, that
any intentional food contamination could also have major psychological and economic impacts on the affected industry. Tables
to assist in calculating the public health impacts and the overall
CARVER + Shock scores can be found in Table 8 and 9, respectively (USFDA 2005; News 2007).
CARVER + Shock scoring table (individual facilities). See Table
1 to Table 7.
Criticality of the attack
This table can be used to calculate the potential number of
deaths and illnesses resulting from addition of a particular adulterant at a particular point in a given food production process. Details
of the batch size to which the adulterant is added, the number of
servings that will be sold and eaten from that batch, and the characteristics of the adulterant (including its lethality) must be known
to use this worksheet. The numbers generated in this worksheet
will help determine where on the criticality scale a given attack
will fall (see table 8).
Summary sheet for total scores. This table can be used to total
the scores across the CARVER + Shock attributes for each node.
The totals can then be compared across the various nodes to determine which nodes are critical. The nodes with the highest scores
are the “critical nodes” and should be the focus for beginning to
implement countermeasures (see table 9).
Software Installation and Startup
The software CARVER + Shock is copyrighted by Sandia National Laboratories and FDA. Its version 1.0.0.0 is available for
usage for free.
CARVER + Shock runs on hardware systems with the following minimum performance characteristics:
(1) Pentium I processor
(2) 256 MB RAM
(3) 120 MB available hard disk space
(4) CD ROM drive
(5) Video card displaying 1280 × 1024 desktop area.
The software is compatible with the following operating systems:
(1)
(2)
(3)
(4)
Windows NT Service Pack 4
Windows 98
Windows 2000
Windows XP (Brackett 2003, 2005;Acheson 2007a, 2007b;
Barringer 2007; Busta 2007; Catlin and Kautter 2007)
CARVER is available on FDA’s Web site at http://www.fda.
gov/Food/FoodDefense/CARVER/default.htm. The source file,
carver.exe, is approximately 53.53 MB (USFDA 2005;Donald
Kautter 2006;Danneels 2007; FDA 2007; News 2007; Pohl 2007;
USFDA 2007c, 2008). Installation prerequisite of this program
requires.NET availability on the system you are running. The
auto-executable file dotnetfx.exe (22.4 MB) can be downloaded
from the Microsoft Corp.’s global site and should be run prior to
carver.exe
When properly installed and having chosen default settings in
the Windows XP operating system, go to Start—All Program—
fda—CARVER (see figure 1).
Front end window of CARVER + Shock software opens up.
In the quick-start pop-up window 3 categories represent the
fields namely User Assistance, Process Diagram, and Information
(Figure 1).
User Assistance section has 3 tab buttons: Help, User Manual,
and Tutorial. First-time users must undertake a journey to the
User Manual first, which is a document file explaining in detail the
theory behind CARVER + Shock software and also its technical
details.
For a novice, Tutorial is of utmost help as in this section a video
tutorial file teaches how to use this software in less than 5 min.
The Process Diagram section has 2 tabs: New for creating a new
session and Open for opening an existing session.
The Information section has 2 tabs: Websites, clicking
on it opens the link http://www.fda.gov/Food/FoodDefense/
CARVER/default.htm in the default web browser and the other
tab Contacts opens the same link (USFDA 2005; Donald Kautter
2006Danneels 2007; ; FDA 2007; News 2007; Pohl 2007; USFDA
2007c, 2008).
The main window has 3 menus on the menu bar: File, Window,
and Help. This gives the software a clean look but at the same time
also gives the notion to the user that this software is in the initial
stages of its development as evident from the version number from
the help menu.
The Window menu has 2 options, Cascade and Tile, to arrange
the multiple windows opened in the program.
The File menu has options, New to create a new session, Open
for opening an existing session, and Quick Start to open quickstart pop-up window. Other buttons are Edit, Delete, Export,
Import, and Exit options.
Table 8–Worksheet for calculating criticality.
A
Entry Point
Agent
Batch
Size
B
C
D
E
F
Serving Serving
Dose
Total
Distribution
Size
Unit
per Batch Required Amount
Required
per
Serving per Batch
A/B
C*D
G
H
I
Units
% of Units Sold
Produced Before Warning
A/F
(H/100)*G
1.
1.
2.
2.
114 Comprehensive Reviews in Food Science and Food Safety r Vol. 10, 2011
J
Units for
Consumers
Potential
per
Consumption Distribution
Unit
K
L
M
N
Number of % of Units
No. of
Morbidity/
Potential Consumed Exposures Mortality
Exposures
Before
Rate
Warning
I*J
K*(L/100)
O
No. of
Illness/
Deaths
M/N
c 2011 Institute of Food Technologists®
A free software for food industries to ensure food safety. . .
Table 9–Summary sheet for total scores for nodes across CARVER + Shock attributes.
SCHOCK
RECOGNIZABIL
ITY
EFFECT
VULNERABILIT
Y
RECUPERABILI
TY
ACCESSIBILITY
TARGET
(Nodes)
CRITICALITY
FOOD:_______________________________________________
OVERALL
SCORE
Figure 1–Start up window of CARVER + Shock.
To start with the real procedure, one must use the default templates supplied with the software available when you click on
File—Open (Figure 2).
The process can be edited and used for any food industry.
CARVER + Shock Scoring Table (Individual Facilities) is given
in this article and must be referred to for standard scores. This
table must be taken as reference scale when designing the process
diagram of any industry (see Figure 2).
CARVER + Shock software mimics the thought processes in
play during a face-to-face CARVER + Shock session by having
the user:
(1) Build a process flow diagram for the system to be evaluated.
c 2011 Institute of Food Technologists®
(2) Answer a series of questions for each of the seven
CARVER + Shock attributes for each process flow diagram
node.
Each question has an associated score. Based on the answers
given, the software calculates a score for each CARVER + Shock
attribute and adds them up to produce a total score for each node.
Analogous to a face-to-face session, total scores range from 1 to
10 for each CARVER + Shock attribute and therefore 7 to 70
for each node. The user may view the attribute scores and total
for each node, the total scores for all nodes, and the attribute
scores for all nodes (for example, all the node Criticality scores,
Accessibility scores, and so on) (USFDA 2005; Donald Kautter
Vol. 10, 2011 r Comprehensive Reviews in Food Science and Food Safety 115
A free software for food industries to ensure food safety. . .
Figure 2–Templates available for usage in CARVER + Shock.
2006; Acheson 2007a; Danneels 2007; FDA 2007; News 2007; Busta 2007; Catlin and Kautter 2007; Green 2007; Harlander
2007).
Pohl 2007; USFDA 2007a, 2007c, 2008).
The software was used and tested for ruggedness on all the
platforms mentioned in the manual and was found to be quite
Results and Discussion
stable as the application did not crash even a single time. So hats
Sandia is a National Nuclear Security Administration labora- off to the Sandia people.
tory. A team from Sandia National Laboratories led the effort to
While testing, some points emerged and are mentioned here as
computerize the FDA program so that it will be distributed as a suggestion for improvement. These points were sent to the FDA
widely as possible (USFDA 2005; Keller and Killorin 2006; Rigby and Sandia National Laboratories for their consideration.
2006; SPPA 2006; IFT 2007a, 2007b; SPAA 2007; Wordpress (1) File menu has options, New to create a new session, Open
2007a, 2007b).
for opening an existing session, Quick Start to open a quickThis indeed is a marvelous effort by Sandia National Laborastart pop-up window. Other buttons are Edit, Delete, Export,
tories and FDA to start a new age of solutions for the problem,
Import, and Exit options. The compact look of this software
which is now in its infancy but will soon be a giant to fight
provides a very easy impression and thus a psychological effect
against BIO-TERRORISM. The food-defense project began in
to the user, which is very much required when you are trying
longhand; in effect, in response to the federal Bioterrorism Act of
to incorporate such software in an established firm or industry
2002, which said the industry should be prepared to defend against
that may be set in its way.
any contingency that might arise (Brackett 2003, 2005; Donald (2) Information section has 2 tabs: Websites clicking
Kautter 2006; Barringer 2007; Busta 2007; Catlin and Kautter
opens the link http://www.fda.gov/Food/FoodDefense/
2007; Green 2007; Harlander 2007).
CARVER/default.htm in the default web browser and the
Food defense is a national and of international priority for the
other tab Contacts opens the same link. This repetitive link
food industry and the government. Product developers, research
could have been avoided or the Contacts tab could have been
and management professionals, regulators, academics, and anyone
designated to some other webpage for feedback and questions
involved in food safety and quality will find this software useful to
pertaining to CARVER.
enhance their awareness of and professional development in the (3) In the Help menu there must be an auto update link to update
field ( Brackett 2003, 2005; Donald Kautter 2006; Barringer 2007;
the patches, if any.
116 Comprehensive Reviews in Food Science and Food Safety r Vol. 10, 2011
c 2011 Institute of Food Technologists®
A free software for food industries to ensure food safety. . .
(a) Apart from these preliminary findings there are some
industry-specific requirements which can be met by meetings of the programmers with the industry people from
time to time.
(4) Auto save feature is missing. This feature is required in an
Indian scenario as power cuts are frequent and computer
systems operate mostly without UPS. So important data are
lost if the person doing the data entry is too engrossed to save
the document from time to time.
(5) If the Other icon option is used, the software will only ask
the questions that are asked for all nodes in that category.
Because an Other process node is user-generated, there is no
way to provide node-specific questions. This may affect the
accuracy of CARVER + Shock scores. So when the Other
icon option is to be used, then try to make the questions as
elaborate and rate them as given in the reference (USFDA
2005; Wordpress 2007a, 2007b).
(6) Because several of the algorithms used to calculate results are
related, results cannot be viewed until all the questions are
answered for all the icons in the process flow diagram. So
utmost care is to be taken to answer all the questions and that
too to the required level of accuracy (USFDA 2005, 2007a,
2007c, 2008).
(7) To report any bug there is a form at the end of the manual.
This is a good idea, but for software issues bug reporting must
be done on-line. A link for bug reporting and on-line help is
a must to make this software a great success.
(8) Taking into consideration the attention span of a normal human being, 12 to 14 h of assessment are too long a period.
For that a preassessment version or step must be incorporated. This would give an outline of the software and a rough
estimate of the premises in question resulting in greater acceptability of this software, which is the ultimate intended
goal of developing this software.
References
Acheson DWK. 2007a. CARVER + Shock – introduction and food
regulatory agency goals. In: Bryant CM, editor. Global food safety & quality
conference. Minnesota: Univ. of Minnesota. p 1–3.
Acheson DWK. 2007b. Current status of U.S. food defense. In: Bryant CM,
editor. Global food safety & quality conference. Minnesota: Univ. of
Minnesota. p 3.
Barringer AA. 2007. Staying ALERT about food defense.
Brackett RE. 2003. Threat/vulnerability assessments for foods. In: USFDA,
editor. Food safety and security. Center for Food Safety and Applied
Nutrition. p 1.
Brackett RE. 2005. Subcommittee on the Federal Workforce and Agency
Organization Committee on Government Reform.
Busta FF. 2007. Recent developments in the national center for food
frotection and defense. In: Bryant CM, editor. Global food safety & quality
conference. Minnesota: Univ. of Minnesota. p 1.
Catlin M, Kautter D. 2007. An overview of the Carver Plus Shock method
for food sector vulnerability assessments. In: USFDA, editor. USFDA.
p 1–14.
Danneels JJ. 2007. CARVER+Shock. Albuquerque, NM, USA: Sandia
National Laboratories.
Donald Kautter J. 2006. CARVER + Shock – vulnerability assessmentsstrategic partnership program agroterrorism (SPPA). Food and Drug
Administration, DHHS- Office of Food Safety, Defense, and OutreachMultistate Partnership Meeting.
FDA. 2007. CARVER+Shock. 1.0.0.0 ed.: Sandia National Laboratory.
Green K. 2007. Strategic partnership program for agroterrorism (SPPA)
initiative – execution and outcomes. In: Bryant CM, editor. Global food
safety & quality conference. Minnesota: Univ. of Minnesota. p 1.
Harlander SK. 2007. Human and economic impact of contamination and the
consequence management system. In: Bryant CM, editor. Global food safety
& quality conference. Minnesota, USA: University of Minnesota, USA.
IFT. 2007a. Food safety the federal perspective.
IFT. 2007b. Risk assessment to drive research for contaminant detection.
Keller J, Killorin P. 2006. A newsletter focusing on food safety issues. In:
Robbins M, Sevchik J, editors. Patco Food Safety Consultants.
News M. 2007. CARVER + Shock for safer food. Medical News.
Pohl PI. 2007. Introduction of CARVER + Shock tool. In: Bryant CM,
editor. Global food safety & quality conference. Minnesota: Univ. of
Minnesota. p 3.
Rigby S. 2006. How to effectively use the CARVER+Shock method of
Conclusion
After the New York City attacks of 9/11, National Security has assessing risks and vulnerabilities. 2006 AFDO Pre-Conference Food
Defense Workshop.
shifted to the highest priority for the United State of America and
SPPA. 2006. Threat assessments and Strategic Partnership Program
this must be top priority agenda item for every other government Agroterrorism (SPPA).
too. Post 9/11, everyone is looking for better ways to protect SPAA. 2007. Strategic Partnership Program Agroterrorism (SPPA) initiative.
the food supply, especially from intentional contamination. Now USFDA. 2005. CARVER + Shock primer.
the resources are available globally and like-minded nations are USFDA. 2007a. CARVER + Shock scoring table (individual facilities).
stressing collaborative efforts to fight terrorism. Bio-terrorism is at USFDA. 2007b. How you can enhance food security.
the threshold and we the people of the food industry must make USFDA. 2007c. What is CARVER +Shock?
up our mind to incorporate such software as CARVER + Shock USFDA. 2008. CARVER + Shock: enhancing food eefense. USFDA.
in our system to be ready to avert damage or disaster. Otherwise Wordpress. 2007a. Guard against agroterrorism.
future generations may not forgive us for the steps we could have Wordpress. 2007b. National bio-surveillance = miserable failure.
taken but did not.
c 2011 Institute of Food Technologists®
Vol. 10, 2011 r Comprehensive Reviews in Food Science and Food Safety 117