1
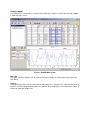
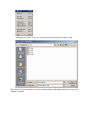
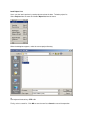
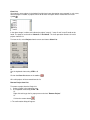
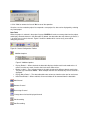
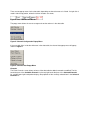
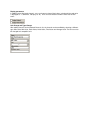
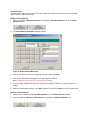
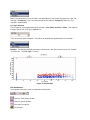
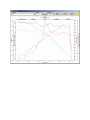
BrakeDAQ EzVIEW User Manual
Introduction
Roush’s BrakeDAQ EzVIEW software provides access to complete data post processing and analysis
functionality in one easy-to-use Windows application. The straightforward graphical user interface (GUI)
utilizes intuitive icons and right-click menus to quickly and easily produce any combination of the following
features:
•
•
•
•
•
Event Summary Data - All acquired channels are available for summary analysis including Maximum,
Minimum, Average, Initial, Final, and Average for every event
Virtual Channel Definition - Utilizing a formula editor very similar to a typical calculator, the user can
create custom-defined equations to describe virtual channels. These channels can then be analyzed
in the same fashion as acquired channels as stated above.
Multiple y-axes Graphs - Every graph in EzVIEW can display a maximum of (6) y-axes for multichannel plotting. 3-D Waterfall plots are also available for a limited data set.
Exportation - All acquired and calculated data can be exported to Excel, ASCII text data files, or
Windows image files.
Printing - Graphs and Tables can be quickly sent to the default computer with a single click of a
button or drop-menu, producing an easy-to-read and colorful report.
Utilizing the features stated above, users can create reports consisting of In-stop data plots, Scatter plots
for noise analysis, and Entire test summaries while their BrakeDAQ is in the vehicle capturing more data.
This is possible because EzVIEW is a standalone application capable of being installed on any PC and
able to process data from any source: network, local hard drive, CD, or DVD-ROM. Whether thoroughly
analyzing data for complete report generation or taking a snap-shot of a few events, EzVIEW fulfills all
requirements.
Screen Layout
The EzVIEW main screen consists of 4 basic parts: Menu Bar, Project List, Data Table and Plot. Figure
1 shows the main screen.
Figure 1: EzVIEW Main Screen
Menu Bar
The menu selections allow the user to create a new project, to open a saved project and to display the
Help dialog.
Projects
The project menu allows user to create, open or edit a project list. A project list is a group of one or more
projects. EzVIEW support multiple project lists, however, only one project list can be opened at a time. A
project can belong to multiple lists.
Edit
Edit menu provides the user abilities to export both the data and plot to a file or export the plot to a
printer. User can also edit program settings to change the default EzVIEW behavior through
“Preference”.
Windows
Channels displayed in the data table are added, removed or edited through the “Channels” window.
User can go to either “Spectra” window or “Time History” window to further analyze the data for each
event or brake.
Help
User can get online help and software support information.
Project List
The Project List contains a list of BrakeDAQ projects.
Right-clicking in the Project List area will bring up a popup window. The operations displayed in the
popup window are the same as the shortcut buttons shown above the Project.
Data Table
In the Data Table section, the user can view the data for a specific project, as well as sort the data based
on the desired criteria.
Plot
The Plot shows the data being selected. The user can customize the plot using the X-Axis and Line Type
dropdown menus and provide a title for the plot.
By selecting the X-Axis menu, the user can select to display the plot by Event, Noise Level or
Frequency.
The Line Type menu will change the format of the plot. The user can select from Line, Points, or Line +
Points.
Getting Started
EzVIEW is an event based data viewer. It maintains projects in one or multiple list(s). This approach
allows project data located at different places be organized into a single place.
To quickly get started in using EzVIEW, follow these steps.
1. Create a project list
2. Add projects to the new list
3. Save the list (can be done automatically)
4. Select the project to load the event-based data
5. Add channels to the data table
6. Select data in the table to be displayed on the plot
To create a new project list:
1. Select Projects from the menu and choose New List or use the keyboard shortcut: CTRL + N
A dialog box will appear so user can select a directory where the new list will be saved.
After a new list has been created, the user will add some projects. After adding the projects, they can be
modified or removed.
The project toolbar contains buttons for all the operations.
Save List
Clean List
Add Project
Insert Project
Re-Link Project
Remove Project
A right click inside the project list pane brings up a popup menu which also contains the same list
operations.
To add a project to the Project list, either:
Use the keyboard shortcut key: CTRL + J
or
Right click in the Project List window to bring up the list popup menu and select "Add Project"
or
Click on the Add Project button
When the dialog box appears, select the directory for the Source Path.
Once the Source Path is selected, the Destination Path will be filled in automatically. However, if the
Source Path is read-only then Destination Path is empty and a new directory should be selected.
The user should modify the Project Name if a similar project name already exists in the list.
Click OK to add the project and Cancel to cancel the operation.
To save a project:
Once the user has loaded a project or projects into the Project List, the user should save the project.
Select Projects from the menu and choose Save List.
or
Use keyboard shortcut key: CTRL + S
or
Click on the Save image on the toolbar
To save a project list with a different name:
Select Projects from the menu and choose Save List As.
Or
Use keyboard shortcut key: CTRL + A
When the file dialog box appears, select a directory and type in a name for the new list. The extension
“.dat” can be left out.
Click OK to save the new list or Cancel to cancel the operation.
Load Project List:
Users can also load a previously saved project to review the data. To load a project list:
Select Projects from the menu and choose Open List from the menu.
When the dialog box appears, select the correct project directory.
Or
Use keyboard shortcut key: CTRL + O
Finally, select a saved list. Click OK to save the new list or Cancel to cancel the operation.
Clean List:
Occasionally, some projects in the loaded list might have been relocated or even removed. In such cases,
after the project is loaded, all projects which do not have valid paths will be marked with the invalid
symbol:
In the above image, invalid marks indicate the project "comp 3", "comp 4" and "comp 5" could not be
found. The projects can be either “Cleaned” or “Re-Linked”. The clean operation removes all invalid
projects from the list.
To clean the list, select Projects from the menu and choose Clean List.
Or
Use the keyboard shortcut key: CTRL + C
Or
Click on the Clean List button on the toolbar:
All invalid projects will be removed from the list
Remove Project from List:
To remove a project from the Project list:
1. Select a project in the project list pane
2. Use keyboard shortcut key: CTRL + M
Or
Right click to bring up the list popup menu and select "Remove Project"
Or
Click on the remove button
3. The confirmation dialog will appear:
4. Click "Yes" to remove the list and "No" to cancel the operation.
Once the user has created a project list or opened a save project list, data can be displayed by selecting
any listed project.
Data Table
When the project is selected in the project list pane, EzVIEW will retrieve summary data from the project
and display selected channels in the data table. By default, the data table does not show any channels, it
is up to the user to select channels. Figure X shows the toolbar which can be easily accessed for
configuring channels.
Figure X: Channel Configuration Toolbar
Additional options
Figure X: Additional options
•
•
•
•
Display Brakes? – When checked, the data table displays whether each brake made noise. 0
means no noise was made, 1 means there are one or more noises.
Brakes in color? – For a selected channel, the plot is displayed in different color for each brake.
The plot style is default to “Point”. When multiple channels are selected, only the first channel is
displayed.
Display Noise Rates? – The data table adds extra column to show the noise rate for each event.
Hide Zero dB data? – When enabled, all non-noise data will be removed from the data table.
Add Channel
Remove Channel
Re-arrange Channel
Change the unit of each displayed channel
Sort Ascending
Sort Descending
There are two popup menus for the data table, depending on where the mouse is clicked. If a right-click is
made inside the top portion, where the column headers are shown,
Figure X: Data Table Column Header
The popup menu allows the user to arrange and sort the columns in the data table.
Figure X: Channel Configuration Popup Menu
If the user right clicks inside the white area in the data table, the channel data popup menu will popup,
shown in Figure X.
Figure X: Channel Data Popup Menu
Channels
The Event Channels screen allows columns of the data table be added, removed or modified. The lefthand side pane is the Available Channels list, the top right hand side pane is the Selected Channels
list, and the lower right hand portion displays the properties of the currently selected item in the Selected
Channels list.
Figure X: Channels Window
Add and Remove Channels
To add, remove, and rearrange the channels in the Selected Channels list, use the buttons in between
the Available Channels list and Selected Channel list.
The Add All button adds all channels from the Available Channels list to the Selected
Channels list
The >> button adds the selected channel from the Available Channels list to the
Selected Channels list
The X button removes a selected channel from the Selected Channels list
The Remove All button empties the Selected Channels list
Rearrange Channels
The order of selected channels can be rearranged. To do so, follow these steps:
1. Left-click on a desired channel (without releasing the button).
2. Move the mouse up or down to the desired position. Figure X shows the selected channel
being moved up one position. Notice there is a thick black bar above “Vehicle Acceleration”
entry.
Figure X: Selected channel is being moved
3. Release the mouse button. Figure X shows the final position of the selected channel.
Figure X: Final position of the selected channel
Display parameters
In addition to the displayed channels. user can choose to view all the brakes (a brake which made noise
is displayed as ‘1’, otherwise, it displays as ‘0’). User can also choose to view the noise rate of each
event.
Unit Change and Type Change
After adding channels to the Selected Channels list, the channel can be modified by selecting a different
type: Max value, Min Value, Delta Value, Initial Value, Final Value and Average Value. The Unit can also
be changed to a compatible unit.
Virtual Channels
Virtual channel is not a physical channel that was recorded in the data file, but instead it is a calculated
channel from the available channels.
Adding a Virtual Channel
1. Click on the button "Add Virtual Channel" just below the "Available Channels" list on the Event
Channel window.
2. The Virtual Channel Definition dialog will appear
Figure X: Virtual Channel Definition
3. Click on the buttons to enter corresponding characters into the equation.
4. Click on the "Add Channel" dropdown list to add a physical channel.
Note: A maximum of 4 channels can be used in the equation
5. Fill in the Name, Abbreviation and Unit. The channel will NOT be added if any of these fields are
empty.
6. When finish editing the equation, click "OK" to add the channel and "Cancel" to cancel the operation
Remove a Virtual Channel
1. Select a virtual channel from the Available Channel list on the Event Channel window.
2. Click on the button "Remove Virtual Channel" just below the "Available Channels" list.
3. The selected virtual channel will be removed
Data Plot
Selected data can be displayed as plot(s). Multiple channels (up to 6) can be displayed. If channels have
different units, then channels having same unit will be grouped for a single y-axis. If each channel has
different unit, then up to 6 y-axis can be displayed. Figure X shows 5 channels are displayed on 4 y-axis.
Figure X: Multiple Y-Axis
Plot Controls
Plot behavior can be modified through three controls: Main title, X –Axis and Line Type.
Figure X: Plot Controls
Main Title
The plot can have a descriptive title.
When the title is changed, the plot will be immediately updated.
X-Axis Selection
The default x-axis selection for the plot on the main screen is Event, but Noise Level and Frequency can
also be used as the x-axis.
To change the x-axis, click on the dropdown list:
Then select one of the three items. The plot will be updated automatically.
Note: if the selected item is also selected in the data table then it will not be displayed on the plot. For
example, if "Frequency" is the x-axis then the plot will not show the "Frequency" data, even if it is
selected in the data table.
Line Type Selection
The line type can be changed among three selections: Line, Points and Line + Points. To change the
line type, click on the "Line Type" dropdown list.
Then select one of the three options. The plot will be automatically updated to the new selection.
Example: The following example plot displays two channels, with Noise Level as the X-axis, and title
“Test Drive 03”. The Line Type is “Points”.
Figure X: Plot Example
Plot Area Buttons
These buttons allow easy access to commonly used functions.
Open the Time History window
Open the spectra window
Save plot as image file
Print the plot
Make the plot full screen
Export Functions
EzVIEW has a set of flexible and powerful exporting functions. Both the data and plot can be exported to
comma delimited ASCII file (.csv), MS Excel file (.xls), or the plot can be save as image file (.emf). To
export data, either right click on the white area of the data table to bring up the popup menu, shown in
Figure X, or click on one of the export buttons on the toolbar.
Note: EMF file can be loaded into Excel for viewing or printing. The image can be resized without
downgrading the quality.
Figure X: Export Popup Menu
Export Buttons
Figure X: Export Buttons
Export to comma delimited ASCII file
Export to Microsoft Excel
Save plot as an image
After selecting the export option, the File Path & Comment dialog will appear, click on the button to
select a directory and enter a name for the exported file. If the output is .csv and .xls files then a short
comment can be added.
Click "Continue" to start exporting process or "Cancel" to cancel the operation.
Print
Plots can be sent to printer for a quick print out. To print the current plot, click on the printer button on the
toolbar
Or
Use keyboard shortcut: CTRL+P
Time History and Spectra
EzVIEW also can display the detailed event time history data and recorded spectra data. To display the
details window, click on one of the two buttons on the toolbar on the main screen:
Open the time history viewer
Open the spectra viewer
Time History / Event Details
The Time History shows the time data on an event basis.
All the controls are located at the top portion of the window.
The functions of each menu are listed below:
• X – Scale: Every channel in the project can be used as the X-axis. “Time” is the default
selection.
Event: The user will use the drop down menu to select the particular event to be
•
displayed or use the
buttons to step through the list
Plot Type: The user can select the line type of the plot: Line, Points or Line +
•
Points.
•
•
Channels: This button will allow the user to select the channels to be displayed on the plot.
A maximum of 6 channels can be selected and the selected channels will be saved.
Switch to Spectra Viewer: This button will switch the display to the Spectra Viewer.
History Channels
This screen changes the displays channels on the time history plot. The selected channels are saved.
The X-axis can also be selected on this screen. Note: Maximum of 6 channels can be displayed at one
time.
Spectra
The spectra window displays the recorded spectra information.
The controls are located at the top portion of the screen.
The functions are listed below:
2D or 3D: Spectra data can be viewed in either 2-dimention or 3-dimention. Use the tab to select
the desired view. Below are samples of 2D and 3D views.
Figure X: 2D View
Figure X: 3D View
Spectra Channel: From this drop-down, the user can select different channels to view.
Sub-Event Change: The user will either use this dropdown to select different Sub-Events to be
displayed or use the
button to step through the list.
Event: The user will either use this dropdown to select different event to be displayed, use the
button to step through the list.
Plot Type: The user can select the line type of the plot: Line, Points or Line + Points.
Switch to Time History: This button will switch the user back to the Time History display.
Preferences
Some features can be set as default when EzVIEW is loaded. These features can be changed / modified
through Preferences screen. To access the screen, select from the menu Edit -> Preferences or by
using keyboard shortcut CTRL+E. Figure X shows the menu selection.
Figure X: Preference Menu Selection
Figure X shows a screen shot of the Preference screen.
Figure X: Preferences
The settings are grouped into two sections: General and Data Table.
Saves and updates the setting, and exit the dialog
Apply the changes but do not exit the dialog
Exit the dialog without saving and updating settings.
General
Figure X: Preference – General
Show tooltip? -- When checked, tooltips will popup after a brief pause when the mouse is moved
over the buttons and dropdown menus.
Load most recently used project upon start? -- Determines whether EzVIEW should load a
project or not when startup.
Automatic save project list? -- When checked, all the changes made to the project list are
automatically saved so there is no need to manually click “Save” button.
Data Table
Figure X: Preference - Data Table
Display Brakes? -- When checked, the data table displays each brake whether it made any
noises.
Display Noise Rates? -- When checked, the noise rate for each event will be displayed in
addition to the selected channels.
Brakes in color? -- When checked, selected data will be broken into different groups for each
brake. The data is then displayed in the plot, each brake has different color.
Hide Zero dB data -- When enabled, all non-noisy data are removed from the data table.
Keyboard Shortcuts
Table 1 displays a list of keyboard shortcuts used in EzVIEW.
Actions
Key Combinations
New List
Open List
Save List
Save List As
CTRL + N
CTRL + O
CTRL + S
CTRL + A
Add Project
Insert Project
Remove Project
CTRL + J
CTRL + I
CTRL + M
ReLink Project
Clean List
CTRL + L
CTRL + M
Print
CTRL + P
Preference
CTRL + E
Exit
CTRL + X
Help
CTRL + H
Table 1: Keyboard Shortcuts