1
Software-Defined Radio
Lab 1: Getting in Touch with GNU Radio and the USRP
Version 0.3
Anton Blad and Mikael Olofsson
September 19, 2011
1
Introduction
The purpose of this lab is to give a first impression of signal processing using GNU Radio and the
USRP. It covers the basics of the GNU Radio flowgraph descriptions, and gives an understanding
of the transmission and reception paths of the USRP.
You will start with a very simple flowgraph that produces a sine wave, alters the amplitude, and
plays the signal on the speakers. You will then alter the flowgraph to instead send the signal to the
USRP and view the output using an oscilloscope. When you have a basic grasp of the processing
that happens in the transmission chain, you will write a new flowgraph that receives a signal using
the USRP and shows its FFT on the screen. You will also play the received signal on the speakers.
Finally, you will replace the sine wave source with a wave file reader, and add configurable filters
at the receive side with which it is possible to change the bass and treble. Along the way, you will
also see how you can present graphs of signals using a GUI.
2
Preparations
Those preparations are all related to the receiver that we construct in Sections 4.3 and 4.5. Choose
the interpolation rate usrp_interp of the USRP. Based on that, compute the interpolation rate
fir_interp and the decimation rate fir_decim of the rational resampler. Notice that all involved
sampling frequencies are integers and all interpolation and decimation rates have to be integers.
3
Setup
The following hardware is needed for this lab:
•
•
•
•
A computer with USB 2.0
Speakers connected to the line-out
A USRP with an LFTX/LFRX daughterboard pair at the A side
An oscilloscope with two channels
1
You need GNU Radio installed. The lab is tested and ensured to work with GNU Radio 3.3.0,
and assumes that it is installed in /usr/local/gnuradio-3.3.0.
3.1
Initialization
If you are doing this lab in CommSys’ research lab:
Log in to one of the lab computers as the user SDR lab user. Your lab teacher will give you
the password. Your lab computer is prepared with all needed files in the directory
/home/sdrlabuser/labfolder/lab1
Open a terminal and cd to that directory. You do not need to worry about making changes
to files there. That directory will be updated for the next occation.
If you are not following these instructions in CommSys’ research lab:
Open a terminal. Create a directory labfolder somewhere and cd into it. Download and
extract the accompanying lab files by executing the following commands:
$
$
$
$
wget http://www.commsys.isy.liu.se/SDR/labs/gr/lab1.tar.gz
tar zxf lab1.tar.gz
cd lab1
wget http://www.commsys.isy.liu.se/SDR/labs/gr/test.wav
All files needed in this lab are now in the directory lab1 that you just created.
4
First Steps
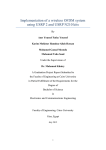
Open the file base.py, which contains the Python code for the flowgraph shown in Fig. 1. The
simple flowgraph is composed of the following blocks:
• a signal source gr.sig_source_f, producing a stream of floats
• a multiplier gr.multiply_const_ff, accepting float inputs and producing float outputs
• a signal sink audio.sink, accepting a stream of floats and sending them to the speakers.
Study the code and then try to run it, which should produce a tone in the computer’s speakers.
You run it from the terminal like so:
$ ./base.py
Note: Even though the gr.sig_source_f block is created with a sampling frequency of 48 kHz,
this does not ensure that samples are produced at this rate. The block has no notion of time, and
the sampling_freq argument is only used to determine the successive phase shifts between the
samples. The audio.sink block is the only block affecting the processing rate in the system, by
having a fixed rate at which samples can be fed to the soundcard.
gr.sig source f
src
gr.multiply const ff
scale
audio.sink
sink
Figure 1: Simple flowgraph generating a sine signal and playing it on the computer speakers.
2
There is also the file base_gui.py, which does the same thing as base.py, but also has a GUI
with two graphs. The upper graph shows the signal in the time domain the same way as an
oscilloscope would. The lower graph shows a power spectrum of the signal in dB scale based on
an FFT. Open that file to see how that is accomplished. The differences compared to base.py
are clearly indicated in the code using comments.
4.1
Connecting the USRP
Make sure that an LFTX/LFRX daughterboard pair is connected to the A side of a USRP unit,
Then connect a power cable to the USRP and connect the USRP to the PC using a USB cable.
You should see a LED blinking with approximately 3 Hz frequency on the USRP motherboard,
right next to the power connector. This indicates that the USRP is ready to be initialized. Ensure
that the computer can find the USRP by running
$ /usr/local/gnuradio-3.3.0/bin/lsusrp
The command should print the USRP, its serial number, and the connected daughterboards. After
this, the LED blinks with approximately 1 Hz frequency. This indicates that the USRP has been
initialized.
4.2
Interfacing to the USRP
In the example files base.py and base_gui.py, the signal source is generating samples at a rate
of 48 kHz, which is much lower than the USRP can support. This is the value of the variable
fs_src used below. The D/A conversion rate is fixed at 128 MHz, and the USRP supports any
interpolation rate f = 4n, where n ∈ {1, . . . , 128}. In this particular lab, it is not possible to use
the smallest allowed values of this interpolation rate. We need to choose a suitable interpolation
factor for the USRP, and in addition to that, we also need to upsample the signal in the host
computer before sending it to the USRP. In our case, the interpolation rate needs to be rational
since 48 · 103 does not divide 128 · 106 /4. We will therefore be using the block blks2.rational_
resampler, which combines interpolation and decimation to perform rational resampling. The
following relation has to hold:
usrp_rate = usrp_interp ·
fir_interp
· fs_src
fir_decim
All interpolation and decimation rates have to be integers.
4.3
Building a Transmitter
Begin by saving the file base.py with a new name usrp_tx.py, and do the changes in this file.
Alternatively, if you want a GUI, do this based on the file base_gui.py. Then perform the
following changes to the code.
To interface to the USRP in the Python code and to be able to use blks2.rational_resampler,
first import the relevant modules:
from gnuradio import usrp, blks2
3
Next, remove the audio.sink instance and the self.connect command, and replace it by the
following code. Lines two to five below should have been done as preparation to this lab. These
should all result in integers. As a result of the calculations, some of them may be represented as
floats, though, and need to be transformed into integers, which is done using the python internal
function int.
usrp_rate = int(128e6)
usrp_interp = <choose>
fir_interp = <compute/choose>
fir_decim = <compute/choose>
carrier = 0
self.fir = blks2.rational_resampler_fff(fir_interp, fir_decim)
self.uscale = gr.multiply_const_ff(2**15)
self.f2c = gr.float_to_complex()
self.u = usrp.sink_c(interp_rate = usrp_interp, nchan = 1)
subdev_spec = (0,0)
subdev = self.u.selected_subdev(subdev_spec)
self.u.set_mux(self.u.determine_tx_mux_value(subdev_spec))
self.u.tune(0, subdev, carrier)
subdev.set_gain(0)
self.connect(self.src, self.scale, self.fir, self.uscale,
self.f2c, self.u)
In this code, the line blks2.rational_resampler_fff(fir_interp,fir_decim) produces a rational resampler block that also lowpass filters the resulting signal with normalized cut-off frequency 0.4 relative to the resulting sampling frequency. The parameters are the interpolation and
decimation rates of the rational resampling. The rational resampler is followed by a scaling by 215
and conversion to complex, necessary because the USRP accepts complex samples in the range
[−215 , 215 − 1]. When the USRP is instantiated, the interpolation rate and number of transmitter
paths are set. The next five lines obtain a reference to the daughterboard connection at side
A, configures the FPGA mux to use its DAC path for the incoming samples, tunes the carrier
frequency, and sets the gain to 0 dB, which makes sample value 215 correspond to 1 V output. It is
also possible to use (1, 0) as argument to usrp.selected_subdev in order to use a daughterboard
at side B.
Connect the I and Q transmitter connectors (TX-A and TX-B of the LFTX daugherboard) to
the two inputs of the oscilloscope. Study the signal on the oscilloscope and verify that it has
amplitude 0.1 V and frequency close to the expected 440 Hz. You may see the tone on both of
the channels, even though the imaginary part of the source signal is zero. This is because the
CORDIC in the AD9862 chip imposes a complex phase shift of the signal. Unfortunately, it is not
possible to clear the phase accumulator register (other than by restarting the USRP), so tuning
to 0 Hz will produce a complex output even if the input is real. So, if you do this as the first thing
you do after powering up the USRP, than the signal should only be available on the I connector.
To see the effect of the complex phase shift, set the carrier frequency to 1 Hz and rerun the
program. Next, set the carrier frequency to 1 MHz and explain the results.
4
4.4
Spectrum Analyzer using USRP
Now connect the I and Q transmitter connectors (TX-A and TX-B of the LFTX daugherboard)
to the I and Q receiver connectors (RX-A and RX-B of the LFRX daugherboard) via the two
channels of the oscilloscope. The amplitude should then drop to half, since the output and input
impedances of the daughterboards are both 50 Ω.
The USRP and GNU Radio can be used as a spectrum analyzer. A general analyzer built on the
old wxgui GUI library is included in the GNU Radio distribution with the name usrp_fft.py.
Set the transmitter carrier frequency to 100 kHz and run
$ usrp_fft.py -d 64 -f 0
to see the spectrum of the received signal. Explain the results. The frequency axis can be changed
by instead running
$ usrp_fft.py -d 64 -f 100000
4.5
Building a Receiver
In this task, you will build a receiver for the signal generated with usrp_tx.py. The USRP ADC
conversion rate is fixed at 64 MHz, and you need to bring this down to the 48 kHz that the audio
card can sink. The FPGA firmware supports any even integer decimation factor in the range
[4, 256]. Choose a suitable FPGA decimation factor, and then compute the additional decimation
needed at the host. Call the receiver program usrp_rx.py. You will have a use for (some of) the
following blocks:
usrp.source_c
gr.complex_to_real
gr.complex_to_imag
gr.multiply_const_ff
blks2.rational_resampler_fff
audio.sink
Change the carrier frequency back to 0, then build and run the flowgraph. This should produce
the 440 Hz tone in the speakers.
Note: There is no phase synchronization between the transmitter and receiver, and hence the
received signal will not necessarily be real. However, we know that the source signal was real. The
goal in this task is not to produce a perfect receiver. Therefore, you can allow yourself to just use
complex_to_real and hope for the best.
Note: If the produced audio signal has the wrong frequency, combined with that you notice a
“stutter” or “buzzing” of the audible signal, then most likely you need to check your interpolation
and decimation rates used by the rational resampler. You would then also notice print-outs like
repeated ’Uo’ in the terminal. The reason for this is that the flowgraph contains two blocks with
fixed sampling rates. The rational resampler has to do the correct thing to ensure that the samling
rates match. Even if you have done everything correctly, you may still see spurios printouts of that
kind in the terminal. The reason for that is that the clocks of the USRP and the audio sink are
not locked. Eventually that leads to overruns or underruns in the software or hardware buffers,
5
downsampled signal (48kHz)
gr.fir filter fff
bass
gr.fir filter fff
mid
gr.fir filter fff
treble
gr.multiply const ff
bassgain
gr.multiply const ff
midgain
gr.multiply const ff
treblegain
gr.add ff
add
audio.sink
sink
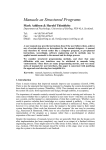
Figure 2: USRP audio player with equalizer
which is what the printouts are reporting. Building a rate-adaptor block to compensate for this
is possible, but outside the scope of this introductory lab.
4.6
A USRP equalizer
In the last part of this lab, you will change the sound source from a simple sinus signal to a
music sample read from a wave file. Begin by copying your usrp_rx.py to wav_rx.py. Notice the
code starting with tb.start. That code provides a commandline interface for setting equalizer
parameters. Use the file wav_tx.py and insert code from your usrp_tx.py into wav_tx.py.
Modify wav_tx.py to use gr.wavfile_source instead of gr.sig_source_f:
self.src = gr.wavfile_source(’test.wav’, True)
gr.wavfile_source produces float samples, so no type conversion is needed.
In wav_rx.py, insert three FIR filters as shown in Fig. 2, one each for bass, mid, and treble. You
may use the following helper functions to design the filters, i.e. to determine the filter taps. See
the manual for further information.
gr.firdes.low_pass
gr.firdes.band_pass
gr.firdes.high_pass
They return tap values as a list, which is then used as the argument taps when instantiating the
filter with
gr.fir_filter_fff(decim_rate,taps)
6
where decim_rate should be 1 in this case. Suitable bandwidths and transition bands are given
in the following table:
Filter
Bass
Mid
Treble
Bandwidth
0–200
200–2000
2000–24000
Transition width
20
100
400
Run your sender and receiver to verify that the code works as intended.
5
Resources
• Online USRP FAQ:
http://gnuradio.org/redmine/wiki/gnuradio/UsrpFAQIntro
• Firas Abbas Hamza, The USRP under 1.5X Magnifying Lens! :
http://gnuradio.org/redmine/attachments/129/USRP_Documentation.pdf
Third-party documentation of USRP.
• GNU Radio C++ block documentation:
file:///usr/local/gnuradio-3.3.0/share/doc/gnuradio-3.3.0/html/index.html
• Firas Abbas, Simple Gnuradio User Manual :
http://rapidshare.com/files/72169239/Simple-Gnuradio-User-Manual-v1.0.pdf
Third-party documentation of GNU Radio. This one is a bit out of date, but still useful. A
printed copy is available at the lab desk.
7